Characterization of hydrometeorological events and flood impacts in the Basque Country
Santiago Gaztelumendi
Joseba Egaña
Kepa Otxoa de Alda
In this study, the focus is on the characterization of floods in Basque Autonomous Community, considering damages, hydrometeorological aspects and others factors during the period 2000–2021. The ultimate goal is to contribute to understanding the processes of impact, enhancing awareness, and improving preparedness before flood events. To assess flood impact, damage data from the Spanish Insurance Compensation Consortium areexposureccccccc used as a proxy. For hydro-meteorological characterization and weather context, we use data from the Automatic Weather Station Network and various Euskalmet general and local ad-hoc weather context classifications. Different datasets are conveniently prepared to extract a range of indicators, taking into account: (1) physiographic and socio-economic factors, (2) damages and impact, (3) hydrometeorological aspects, and (4) weather context. Visual data analytics techniques are utilized for analysis, characterization, and presentation of findings. We integrate indicators with diverse temporal resolutions (daily and monthly) and spatial aggregations (primary watersheds and selected hydrological units) to facilitate discussions and derive conclusions. This work establishes a foundation for a semi-automatic procedure for data preparation, indicator extraction, analysis, and results presentation. Although it is a strategy specifically designed for its application in our context, we believe it can serve as inspiration for conducting similar free software based exercises in other parts of the world.
- Article
(4945 KB) - Full-text XML
- BibTeX
- EndNote
Severe weather phenomena affect the Basque society in many ways, from disruption in various sectors and substantial damages in infrastructure to human and economic losses (e.g. CCS, 2023; Gaztelumendi et al., 2016a, 2017, 2023; Prieto and Lamas, 1985; Egaña and Gaztelumendi, 2018). Flooding is, among others, one of the natural events that causes a relatively high impact in Basque Country, usually as a consequence of intense and persistent precipitation (e.g. DAEM, 2015, 2016; Ibisate et al., 2000, Egaña et al., 2010, 2015, 2016; Gaztelumendi et al., 2011, 2016b; Mugerza et al., 2005; Ruiz et al., 2012).
Impact from meteo-climatic hazards depends on the nature of the meteo-climatic severe event (GV, 2023; Gaztelumendi et al., 2012, 2016c) and on the vulnerability of exposed human assets to this particular hazard. Vulnerability and exposure are a consequence of different complex factors (Cardona et al., 2012), mainly related to physical characteristics of watersheds, human occupation of the territory and others socio-economic factors.
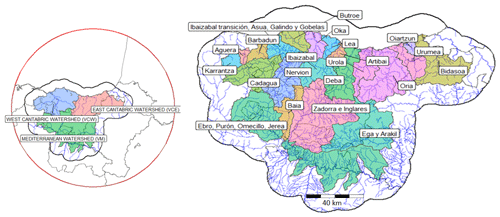
It is noteworthy that the Basque Country is situated between France and Spain, on the western part of the Pyrenees (Fig. 1). The Basque Autonomous Community (BAC) is politically comprised of the territories of Araba, Bizkaia, and Gipuzkoa (Fig. 1). On the physical side, rivers flow into two main basins, the Cantabrian and the Mediterranean (Fig. 1). For further considerations about impact, it is important to mention that Mediterranean watersheds cover the majority of the southern part of the territory, mainly in Araba, which is the largest (2963 km2) of the three BAC territories but is less industrialized, inhabited, and relatively flat. In contrast, Bizkaia (2217 km2, 1 141 000 inhabitants) and Gipuzkoa (1980 km2, 700 000 inhabitants), mainly in the Cantabrian basin, are characterized by many densely populated river valleys with significant industrial activities (GV, 2002; Urzainqui, 2023).

Figure 1Basque Country location, orography and rivers, main basins and watersheds, and political Basque Autonomous Community territories (from left to right).
This study focuses on the analysis of flood impacts produced in our territory and their hydrometeorological characterization during 2000–2021 period, where data are available. The study cover twenty-one areas coinciding with natural watersheds, five in Mediterranean basins, seven in the eastern Cantabrian basin, and nine in the western part (Fig. 2). The overarching objective of our work is to contribute to understanding the impact processes associated with floods by characterizing events using daily indicators at the watershed level. Additionally, we aim to develop a general and flexible methodology to extend our findings to other watersheds and different temporal periods.
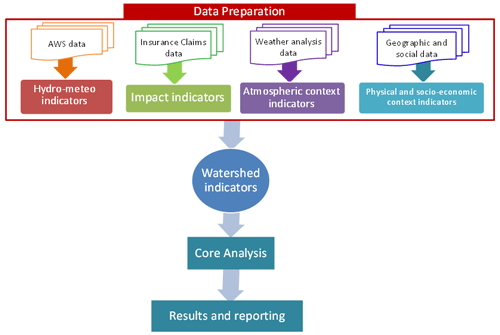
The methodology nvolves a sequential workflow (Fig. 3) comprising four main steps: (1) data preparation, (2) watershed indicator calculation, (3) core analysis, and (4) characterization. This approach follows a typical strategy for data science (e.g., Cashman and Quinlan, 2018; Wickham and Grolemund, 2017), extensively utilizing Exploratory Data Analysis (EDA) (e.g., Tukey, 1977; Willey, 2021) in data preparation and indicator calculation (first and second steps), and Visual Data Analytics (VDA) (e.g., Kabacoff, 2018; Tufte, 2001) in analysis and characterization (second and third steps). A set of specific Python (PSF, 2021) and R (Wickham and Grolemund, 2017; R Core Team, 2022) scripts has been developed for the acquisition of such a heterogeneous raw dataset, its inspection, cleaning, and transformation into a set of indicators with relevant information for selected watersheds. The use of more or less complex indicators for flood assessment and risk understanding is quite extended (e.g. Vojtek, 2023; Quesada-Román, 2022; Tang et al., 2021; Tate et al., 2021; Solín and Rusnák, 2020; Santos et al., 2020), in our case indicators are defined for the four main aspects covered in this study: (1) physiographic and social, (2) damages and impact, (3) hydrometeorological, and (4) weather context.
VDA techniques are used extensively for core analysis and result reporting. VDA involves the use of visual representations, such as charts, graphs, and dashboards, to explore and analyze complex datasets. In our context, VDA helps analyze watershed indicator datasets through visual representations, enabling the discovery of relationships and patterns in the data.
We utilized various R scripts for spatial data analysis (Pebesma and Bivand, 2023), facilitating result generation, conclusion extraction, and creating graphs and maps for reporting purposes. Diverse libraries were employed, including sf (Pebesma, 2018) for spatial vector data manipulation and analysis, Terra (Hijmans, 2022) for spatial raster data manipulation and analysis, tidyr (Wickham et al., 2023) for data manipulation and transformation, dplyr (Wickham et al., 2023) for data transformation and analysis, and ggplot2 (Wickham, 2016) for data visualization and analysis. Facets (Wickham, 2016) were used to generate multiple plot panels based on categorical key indicators, and grouping and summarizing (Wickham and Grolemund, 2017) were extensively used to simplify complexity and extract conclusions with varying levels of spatial and temporal aggregation.
2.1 Physiographic and socio-economic context data
Various data sources were used to calculate physiographic and socio-economic context indicators, employing different rasters and shapes for rivers, watersheds, municipalities, and tabular data for population and other social aspects (GEOEUSKADI, 2022; EUSTAT, 2022). Several R scripts were developed to adapt original data formats for analysis, transforming raw data into watershed-level indicators.
Distinct physiographic indicators for each watershed were computed using whiteboxR (Wu and Brown, 2022; Lindsay and Whitebox, 2016). Utilizing available river rasters, watershed shapes, orography, and land use data, we calculated various geomorphometric and hydrological variables at the pixel level (200 m resolution), such as slope and flow direction. These variables were then aggregated at the watershed level through statistical operations (mean, max, etc.).
Various socio-economic indicators at the watershed level were also calculated, including total population, population density, and rental aspects. Data at the municipality level was distributed in pixels based on a normalized population raster map and later recombined at the watershed level.
Preparing useful indicators integrated at the watershed level, along with auxiliary vector files and shapes, is crucial for effective visual data analysis in combination with other indicators and for geospatial result representation.
2.2 Impact data
Impact indicators were generated based on damage and claim data from the Spanish Insurance Compensation Consortium (CCS). These data consisted of individual claims paid by CCS for “extraordinary inundation” (CCS, 2018; García Canales and Nájera, 2010) during the study period. The available information included an Excel file with 80 322 rows, detailing accepted claims in the Basque Autonomous Community (BAC) and surrounding territories, including attributes such as the day, amount paid, and municipality where damages occurred.
Various R scripts were implemented to transform the original data into a daily data structure based on watersheds. Different daily quantitative and qualitative impact indicators were constructed using spatial and statistical operations (aggregation, segmentation, count, sum, mean, max). Main impact indicators were defined considering temporal affection (number of days: ND), social extension of damages (number of claims: NP), magnitude of impact (sum of euros: SE), and spatial extension (number of affected municipalities: NM). Derived indicators were also defined by aggregation and segmentation. The final impact dataset consisted of over 50 daily impact indicators aggregated at the watershed level, stored in R native tibble format and .csv files for external use.
To facilitate characterization, some categorical derived impact indicators at the watershed level were defined. Specifically, the Economic Impact Indicator (IIE) categorizes events based on impact relevance into five categories (very low, low, moderate, high, very high) and includes a category for no claims (NIA). IIE is a qualitative index based on three components (IIEM, IIEP, IIEE) that capture the most important aspects of impact on a daily basis, derived from insurance claims data: (1) economic amount paid (IIEM), (2) number of claims (IIEP), and (3) spatial extension (IIEE). Thresholds for segmentation were assigned based on data characteristics and local knowledge. For economic impact (SE), the thresholds were EUR 0, 5000, 20 000, 100 000, and 1 000 000; for number of claims (NP), they were 0, 1, 10, 50, and 1000 claims; and for number of municipalities affected (NM), they were 0, 1, 3, 10, and 50 municipalities.
2.3 Hydrometeorological data
The river level and precipitation data used in this study come from Euskalmet (EUSKALMET, 2022) repositories. These repositories consist of files with hydro-meteorological variables recorded every 10 min across the Basque network (e.g., Gaztelumendi et al., 2018) during the period 2000–2021 (e.g., Hernandez et al., 2022). Several Python scripts were developed to prepare statistical variables (count, sum, mean, max) under different spatial and temporal aggregations. For precipitation, maximum, minimum, and mean values were calculated over various temporal intervals (10 min – p10m, 30 min – p30m, 1 h – p1h, 3 h – p3h, 6 h – p6h, 12 h – p12h, 24 h – p24h, 48 h – p48h, up to 168 h – p168h). Additionally, daily normalized river level (niv) values were computed based on the orange warning river level reference available for each river-gauge location (GV, 2023). The final hydrometeorological dataset consists of various daily variables aggregated at the watershed level in .csv format.
To better represent the different natures of hydrometeorological precursors of impact, we defined categorical indicators at the watershed level for the persistence degree of precipitation (IPP), intensity degree of precipitation (IIP), and pluvial/fluvial segmentation (IFP), based on available rain-gauge and river-gauge stations in each watershed. IPP categorizes the mean of p24h into five values (very low, low, medium, high, very high) corresponding to 0, 15, 30, 40, 60, and 120 mm per 24 h cut-off values. IIP categorizes the mean of maximum p1h into five values (very low, low, medium, high, very high) corresponding to 0, 5, 15, 30, 45, and 60 mm per 1 h cut-off values. The cut-off values for p24h and p1h are determined based on the yellow, orange, and red thresholds used in Euskalmet operational procedures (GV, 2023). IFP is based on the categorization of the mean of the maximum daily normalized river level (niv). IFP can take two values: PLU (pluvial) or FLU (fluvial). If niv is above 0.8, the event is classified as fluvial (FLU), and if below .8, it is considered pluvial (PLU).
2.4 Weather context data
The data and products used for weather context characterization are those routinely employed by Euskalmet for severe weather classification and analysis purposes (e.g., Egaña et al., 2005; Egaña and Gaztelumendi, 2018). These include sea level pressure maps, geopotential and temperature synoptic maps (850, 500 hPa), precipitation analysis maps, and various radar products. From these sources, different indicators are prepared at a daily level following Euskalmet's classification procedures for impact weather events (Gaztelumendi et al., 2023). Specifically, impact days are classified based on synoptic type, circulation shape, cloud systems, precipitation type, and severe weather typology (Egaña and Gaztelumendi, 2018). As a result, six different weather context categorical indicators for relevant impact days are prepared for each watershed at a daily level. Given the small size of the Basque Country, these indicators are the same for all watersheds.
Through various analyses of these categorical weather context indicators aggregated for the entire territory, we found that it is possible to classify flood impact events from a weather context perspective into three main classes: Cut-Off Lows configuration (C), Winter Frontal Systems (F), and Local Storms (T). These specific classes are included in a new categorical indicator, the Flood Weather Precursor Indicator (ITPI).
In Fig. 4 a tabular representation of derived impact indicators for the entire temporal period is shown, spatially aggregated by Cantabrian (VC) and Mediterranean (VM) basins, as well as for the whole territory (ALL). From the temporal affection perspective (ND), we find that during 10 % of the analyzed days, at least one claim is paid in some part of the studied domain, and only during 0.5 % of the days, more than 100 claims are paid. The number of days with any claims is quite similar between VC and VM, but clear differences appear with an increasing number of claims. From the social extension of impact perspective (NP), more than 80 % of claims are produced in VC, the mean number of claims is four times higher in VC than in VM, and around 16 % of total claims are produced during a single flooding day. In terms of the magnitude of impact (SE), more than 85 % of economic losses occur in VC (20 % during a single event). Focusing on spatial extension (NM), note that in an “average event”, four municipalities are affected (2 % of the total), and during the worst event, 28 % of municipalities are affected (45 % in the VC case and 16 % in the VM case).
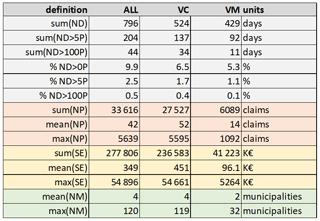
Figure 4Example of impact analysis for the entire domain (ALL) Cantabric (VC) and Mediterranean basins (VM) using derived impact indicators.
In Fig. 5 we present some derived indicators at the watershed level, considering impact and socio-economic indicators. Particularly, perPOB (% of total population in a particular watershed), perArea (% of total area corresponding to a particular watershed), ND (number of impact days), NM (number of municipalities), P_ND (number of claims/number of impact days), perP (% of total claims), perKE (% of total euros), P_POB (total claims/population), and KE_POB (total Euros/population). We observe that two Cantabrian watersheds, Urumea (affecting San Sebastian city) and Ibaizabal plus (affecting the Bilbao area), account for 45 % of claims and more than 50 % of Euros paid. The ratio of total claims per day (P_ND) is around 70 in the Urumea case, 50 in Oka, and 32 in Ibaizabal plus. Ratios of claims and euros per population (KE_POB and P_POB indicators) are higher in Oka, Urumea, Butrón, and Cadagua.
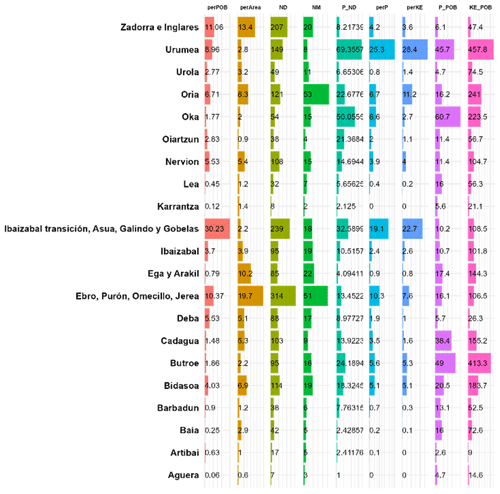
Figure 5Example of some derived indicators for the analyzed watersheds (see text for variable explanation).
In Fig. 6, we present some daily impact indicators temporally aggregated by seasonal mean and spatially aggregated by main basins (Cantabrian vs. Mediterranean), segmented by impact relevance for the entire studied period (2000–2021). Specifically, meanD, meanE, meanNM, and meanP represent the daily mean of the number of days, euros, municipalities, and claims during each season. numD is the number of days, percD is the % of days, and sumD, sumE, and sumP are the total sum of days, euros, and claims respectively. This figure illustrates how the number of claims with any degree of impact is higher during summer and lowest during spring. It also shows that the proportion of claims in less relevant impact events during summer is higher in the Mediterranean basin and that the proportion of claims in relevant impact events is much higher in the Cantabrian basin for any season.
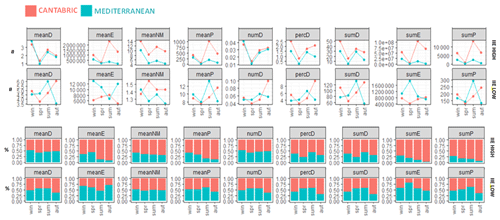
Figure 6Analysis based on different impact indicators absolute values (#) and relative (%) by season, basin, and impact degree. First and third rows for significant impact degree (IIE = HIGH) and second and fourth for lower impact degree (IIE = LOW). The bar shows the proportion, while the lines displays the values.
In Fig. 7 we present some maximum daily hydrometeorological indicators temporally aggregated by annual mean and spatially aggregated for all basins (ALL), East and West Cantabric basins (VCE, VCW) and Mediterranean basins (VM) segmented by impact relevance (NIA, LOW,HIGH) for all the studied period (2000–2021). We found that during more relevant impact days mean of max hydrometeorological indicators related with precipitation persistence (p24h … p168h) double the value of such indicators during low impact days that double the values that during NIA days. Precipitation indicators are in general higher in VCE and lower in VM. During impact days intense precipitation indicators (p10m, p30m, p1h) shows similar behavior for VCE and VCW. Mean maximum normalized river level is over 0.8 for more relevant impact events in the case of VCE and VCW and just over 0.6 in the case of VM.
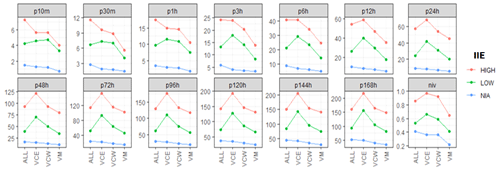
Figure 7Aggregated spatial (ALL, VCE, VCM, VM) mean daily values of various hydrometeorological indicators for the period 2000–2021 segmented by impact degree (NIA, LOW, HIGH).
In Fig. 8, we present some maximum daily hydrometeorologival indicators temporally aggregated by monthly mean and spatially aggregated for all basins, segmented by impact relevance (NIA, HIGH, and LOW) for the entire studied period. During the warm season, the mean of maximum hydro-meteo indicators of intense precipitation (p10m, p30m, p1h) is much higher than during the cold season. Such differences are higher as the impact becomes more relevant. During the cold season, the mean of maximum indicators of persistent precipitation (p24h, p48h, …, p168h) doubles the values of the warm season. Mean maximum normalized river level is over 0.8 for high impact events during the cold season and below 0.8 during the warm season.

Figure 8Aggregated monthly values for all the territory of various hydrometeorological indicators for the period 2000–2021, segmented by impact degree.
In Fig. 9, we show the impact behavior by fluvial/pluvial indicator (IFP). For all watersheds (ALL), pluvial (PLU) events are three times more frequent than fluvial (FLU) events, quite similar for VCE, which nearly doubles VCW, and more than three times in the VM case. All very high impact cases are fluvial, and the proportion of higher impact events is much more relevant for fluvial events and in Cantabrian basins (VCE and VCW). From a seasonal perspective, we see that although fluvial events are predominant during the cold season, they are plausible at any time, and although pluvial events are predominant during the warm season, they are plausible at any time.
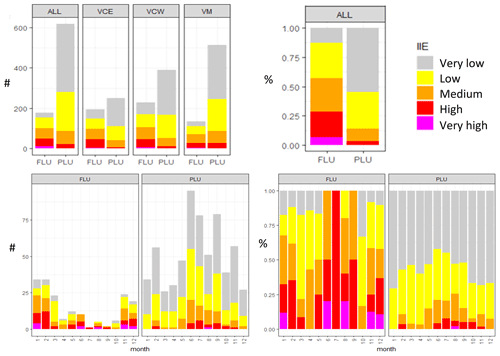
Figure 9Distribution of impact days by IFP (FLU and PLU) considering number of impact days (#) and percentage of total days (%) coloured by impact relevance (IIE). On top for spatial aggregation (ALL, VCE, VCW, VM) and below for monthly counts.
In Fig. 10, we present the weather context perspective. We can appreciate how the impact of F and C situations is more significant than that generated by T situations because the first two often generate fluvial events and more widespread consequences associated with persistent precipitation. During C situations, precipitation can also be intense and persistent. On the other hand, T situations are related to localized rainfall and generate localized impact associated with storms that produce intense, short-duration showers. In fact, we have events with very high impact in F and C situations, unlike in T situations, where the maximum degree of impact is high. F situations occur during the cold period between October and April, T situations occur in the warm season, and C situations can occur throughout the year. The most relevant events occur in the Cantabrian region.
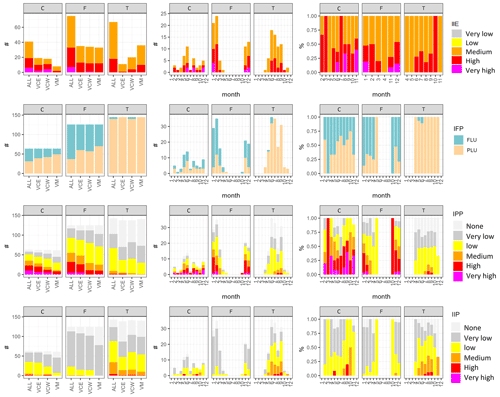
Figure 10Distribution of impact days by ITPI coloured by IIE, IFP, IPP, and IIP for spatial aggregation (ALL, VCE, VCW, VM) (left panels), monthly count (center panels), and monthly proportion (right panels).
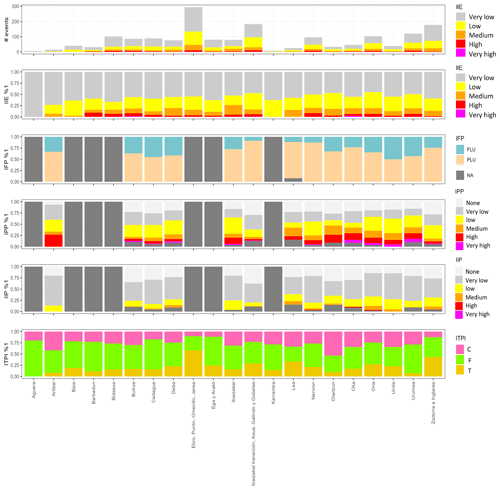
Finally, in Fig. 11, we summarize the results in a single figure as a watershed impact dashboard, featuring bar graphs presenting, for each watershed, the set of indicators defined for the impact and hydrometeorological characterization of floods during the studied period. Bar graphs are employed to provide a summarized perspective on key aspects related to flood characterization in selected watersheds. It is noteworthy that NA values (dark grey color) are present in areas where hydrometeorological data are unavailable.
In the context of climate change across different regions of the planet, flood events and their consequences show a tendency to increase (Quesada-Román, 2021; Mantovani et al., 2024), as do the research and studies analyzing these events and their consequences (Pinos and Quesada-Román, 2022). It is essential to analyze the vulnerability and risk exposure of populations to delineate and characterize the areas of greatest impact, allowing for appropriate measures to be taken for future extreme flood events. Decision-making must consider multifactorial variables, which can be concretized into different risk indicators (Ikirri et al., 2022). Additionally, analyzing different types of events in urban environments is particularly relevant given the high population density in these areas (Esdras Leite et al., 2024).
In our case, the characterization of floods and their impact is based on a series of qualitative and quantitative daily indicators that illustrate various aspects of a flood event at the watershed level. These indicators are constructed from damage data provided by the CCS. The use of insurance claims data when analyzing flood events is a relatively common practice where data are available (e.g., Gradeci et al., 2019; Cortés et al., 2018; Bernet et al., 2017). Hydrometeorological and general context indicators are based on quantitative observation data from instrumentation and certain weather context indicators.
Our ultimate goal is to condense various data sources and concepts, using visual data analytics techniques, to simplify the study of impact following a particular strategy towards full characterization:
-
Focusing on impact indicators that are spatially and temporally aggregated for the entire study period. In Fig. 4, for example, results for the whole territory and main basins are shown, allowing the quantification of substantial differences in impact behavior between the Mediterranean and Cantabrian slopes.
-
Including certain socio-economic indicators and impacts for each individual watershed. Figure 5 demonstrates how the combined use of numbers and color bars facilitates comparisons between different watersheds.
-
Incorporating the temporal perspective and combining impact and hydro-meteorological indicators. For instance, Fig. 6 presents various indicators segmented by seasons and impact significance. The use of absolute values and stacked bars helps discern the different seasonal patterns across various watersheds.
-
Analyzing the behavior of hydro-meteorological indicators for different watersheds based on impact classification. Figure 7 provides examples of the results for main basins, while Fig. 8 incorporates the temporal perspective with values aggregated across all basins, showing the seasonal pattern of accumulated precipitation distribution at different intervals and its relationship with impact.
-
Studying the impact of fluvial and pluvial events for each basin. Figure 9 illustrates this analysis for different spatial aggregations (ALL, VCE, VCW, VM) and the monthly distribution for ALL, highlighting the seasonality of fluvial and pluvial events and noting the higher degree of impact associated with fluvial events compared to pluvial ones.
-
Examining the influence of the weather context on the value of different indicators for each watershed. Figure 10 includes colored bar charts with various indicators for basin aggregations and their monthly distribution. This representation highlights significant differences in hydro-meteorological characteristics associated with impact, depending on the time of year and specific basin.
Unless all claims from the CCS are attributed to a common cause of “extraordinary inundation”, numerous minor impact events usually correspond to less impactful pluvial floods occurring during intense stormy precipitation events. More significant impact events are predominantly of a fluvial nature, occurring mainly in the eastern Cantabrian watersheds, while the proportion of less impactful pluvial events is higher in Mediterranean watersheds.
For a more comprehensive characterization of impact based on insurance data, detailed information about insurance penetration is necessary. Insurance penetration varies across different territories, and the number of claims and the economic amounts paid depend on the insured assets exposed to risk. Impact characterization could also benefit from incorporating more detailed data, such as postal code information, which is particularly relevant for urban pluvial floods. Additionally, the characterization could be enhanced by integrating additional data sources, such as social media, press reports, and emergency services, from the new Euskalmet impact weather catalogue (Gaztelumendi et al., 2023).
In this work, we have laid the foundations for a general semiautomatic procedure for data preparation, indicator extraction, analysis, and results presentation, enabling the characterization of flood events at the aggregated basin level in the BAC, based on indicators extracted from various data sources available in our territory. Although the proposed strategy is specifically designed for application in our context, we believe it can serve as inspiration for conducting similar free software-based exercises in other parts of the world.
Using R for developing various scripts facilitates the analysis and visualization of data through graphs, charts, and maps, aiding in the identification of patterns and relevant factors underlying flooding, characterizing these phenomena within the target catchments, and simplifying conclusion reporting.
The definition of various specific indicators appears to be an effective strategy for characterizing floods at the watershed level in BAC. It offers a new approach to effectively summarize and communicate the impact and context in which floods occur. The collection of qualitative and quantitative indicators calculated in this study constitutes the essential database for further correlation studies and to implement data-driven models based on machine learning techniques. Several projects are planned in the field of data-driven modeling for damage/impact and flood prediction at the Basque Meteorology Agency.
The R and Python code are not publicly accessible because they are for internal use.
The data sets are not publicly accessible because they are prepared for internal use.
SG conceived and conduct the study, set methodology, write the article, contribute to conceptualization, indicators definition, impact data preparation and visual data analytics, JE contribute to conceptualization, and weather context characterization, KOdA contribute to hydrological and meteorological data curation and indicators preparation.
The contact author has declared that none of the authors has any competing interests.
Publisher's note: Copernicus Publications remains neutral with regard to jurisdictional claims made in the text, published maps, institutional affiliations, or any other geographical representation in this paper. While Copernicus Publications makes every effort to include appropriate place names, the final responsibility lies with the authors.
This article is part of the special issue “EMS Annual Meeting: European Conference for Applied Meteorology and Climatology 2023”. It is a result of the EMS Annual Meeting: European Conference for Applied Meteorology and Climatology 2023, Bratislava, Slovakia, 3–8 September 2023.
We express our deepest gratitude for the funding provided by the Basque Government Security Department. Special thanks are extended for the data contributions from DAEM (hidrometeorological data), CCS (insurance claims data), and Geoeuskadi (geo-layers). We extend our sincerest appreciation for all the open-data and open-software community.
This paper was edited by Carlos Román-Cascón and reviewed by two anonymous referees.
Bernet, D. B., Prasuhn, V., and Weingartner, R.: Surface water floods in Switzerland: What insurance claim records tell us about the damage in space and time, Nat. Hazards Earth Syst. Sci., 17, 1659–1682, https://doi.org/10.5194/nhess-17-1659-2017, 2017.
Cardona, O. D., van Aalst, M. K., Birkmann, J., Fordham, M., McGregor, G., Perez, R., Pulwarty, R. S., Schipper, E. L. F., and Sinh, B. T.: Determinants of risk: exposure and vulnerability, in: Managing the Risks of Extreme Events and Disasters to Advance Climate Change Adaptation A Special Report of WG I and II of the IPCC, Cambridge University Press, Cambridge, UK, and New York, NY, USA, 65–108, https://www.ipcc.ch/site/assets/uploads/2018/03/SREX-Chap2_FINAL-1.pdf (last access: 11 October 2024), 2012.
Cashman, S. and Quinlan, J.: Data Science Workflows, Cengage Learning, ISBN 13:978-1337564530, 2018.
CCS: La cobertura de los riesgos extraordinarios en España, NIPO: 057-17-012-5, Depósito Legal: M-26418-2016, Ed Consorcio de compensación de seguros, 2018.
CCS: Estadistica de riesgos extraordinarios serie 1971–2022, NIPO: 094-20-062-6, Depósito Legal: M-23915-2016,Ed Consorcio de compensación de seguros, https://documentacion.fundacionmapfre.org/documentacion/publico/es/media/object.do?id=1135154&recordDownload=1 (last access: 11 October 2024), 2023.
Cortès, M., Turco, M., Llasat-Botija, M., and Llasat, M. C.: The relationship between precipitation and insurance data for floods in a Mediterranean region (northeast Spain), Nat. Hazards Earth Syst. Sci., 18, 857–868, https://doi.org/10.5194/nhess-18-857-2018, 2018.
DAEM: Caracterización y estudio meteorológico de situaciones de emergencia por precipitaciones (Urumea y Kadagua), Internal final documentation project, Tecnalia contract no. 050597, Coord.: Gaztelumendi, S., 2015.
DAEM: Caracterización y estudio meteorológico de situaciones de emergencia por precipitaciones en vertiente mediterranea (Zadorra y Bais), Internal final documentation project, Coord.: Gaztelumendi, S., M0090/16, 2016.
Egaña, J. and Gaztelumendi, S.: A study of Meteorological conditions during the historical August 1983 Basque Country floods, in: EMS Annual Meeting 2018 European Conference for Applied Meteorology and Climatology, 3–7 September 2018, Budapest, Hungary, https://doi.org/10.13140/RG.2.2.35899.49441, 2018.
Egaña, J., Gaztelumendi, S., Gelpi, I. R., and Mugerza, I.: Synoptic patterns associated to very heavy precipitation events in the Basque Country, EMS5/ECAM7 Utrecht Netherlands, 2005.
Egaña, J., Gaztelumendi, S., Pierna, D., Gelpi, I. R., Hernández, R., and Otxoa de Alda, K.: Flash-floods on Basque Country at the end of January 2009, EMS10/ECAC8, Zurich, Switzerland, https://doi.org/10.13140/RG.2.2.20695.75688, 2010.
Egaña, J., Gaztelumendi, S. Palacio, V., and Martija, M.: A case study of local floods in Urumea area (Basque Country), in: 15th EMS Annual Meeting 12th European Conference on Applications of Meteorology (ECAM) 7–11 September 2015, Sofia, Bulgaria, https://doi.org/10.13140/RG.2.2.23209.72803, 2015.
Egaña, J., Gaztelumendi, S., and Aranda, J. A.: Meteorological characterization of events that generate floods impact in north part of Basque Country, in: 16th EMS/11th ECAC, 12–16 September 2016, Trieste, Italy, https://doi.org/10.13140/RG.2.2.23209.72803, 2016.
Esdras Leite, M., Teixeira Dias, F., William Lopes, J., and Ferreira dos Santos, N.: Land use and environmental impacts: Flood model in a medium-sized Brazilian city as a tool for urban sustainability, Environ. Sci. Policy, 151, 103613, https://doi.org/10.1016/j.envsci.2023.103613, 2024.
EUSKALMET – Basque Meteorology Agency: Euskal Meteorologia Agentzia, https://www.euskalmet.euskadi.eus/hasiera/ (last access: 8 October 2023), 2022.
EUSTAT – Basque Statistical Office (EUSTAT): Datos estadísticos de la C.A de Euskadi, https://www.eustat.eus/indice.html (last access: 8 October 2023), 2022.
García Canales, C. and Nájera, A: El consorcio de compensación de seguros y la cobertura de los riesgos meteorologícos adversos, in: cap IV de Fenómenos meteorológicos adversos en España, AMV Ediciones, ISBN 978-84-96709-88. 2010.
Gaztelumendi, S., Egaña, J., Pierna, D., Palacio, V., Gelpi, I. R., Hernández, R., and Otxoa de Alda, K.: A study of a flashflood case in Basque Country: the 16th june 2010 event, in: EMS11/ECAM10, 12–16 September 2011, Berlin, Germany, https://doi.org/10.13140/RG.2.2.14194.58563, 2011.
Gaztelumendi, S., Egaña, J., Otxoa-de-Alda, K., Hernandez, R., Aranda, J., and Anitua, P.: An overview of a regional meteorology warning system, Adv. Sci. Res., 8, 157–166, https://doi.org/10.5194/asr-8-157-2012, 2012.
Gaztelumendi, S., Egaña, J., and Aranda, J. A.: Analysis of coastal impact in Basque Country, in: 16th EMS/11th ECAC, 12–16 September 2016, Trieste, Italy, https://doi.org/10.13140/RG.2.2.21532.00643, 2016a.
Gaztelumendi, S., Egaña, J., Liria, P., Gonzalez, M., Aranda, J. A., and Anitua, P.: The new Euskalmet coastal–maritime warning system, Adv. Sci. Res., 13, 91–96, https://doi.org/10.5194/asr-13-91-2016, 2016b.
Gaztelumendi, S., Egaña, J., and Aranda, J. A.: An analysis of flooding economic impact in Urumea area, in: 16th EMS Annual Meeting, 11th European Conference on Applied Climatology (ECAC), 12–16 September 2016, Trieste, Italy, https://doi.org/10.13140/RG.2.2.32227.48161, 2016c.
Gaztelumendi, S., Egaña, J., and Aranda, J. A.: Floods in Vitoria-Gasteiz: economic impact and meteorological causes, in: EMS Annual Meeting 2017, European Conference for Applied Meteorology and Climatology, 4–8 September 2017, Dublin, Ireland, https://doi.org/10.13140/RG.2.2.21429.76005, 2017.
Gaztelumendi S., Otxoa de Alda, K., Hernández, R., Maruri, M., Aranda, J. A., and Anitua, P.: The Basque Automatic Weather Station Mesonetwork in perspective, in: Proceedings 2018 WMO/CIMO Technical Conference on Meteorological and Environmental Instruments and Methods of Observation (CIMO TECO-2018), 8–11 October 2018, Amsterdam, the Netherlands, https://doi.org/10.25607/OBP-125, 2018.
Gaztelumendi, S., Egaña, J., Ruiz, M., and Iturrioz, E.: The Basque Impact Weather Catalogue, in: EMS Annual Meeting 2023, Bratislava, Slovakia, 4–8 September 2023, EMS2023-237, https://doi.org/10.5194/ems2023-237, 2023.
GEOEUSKADI: geoEuskadi. Datu Espazialen Egitura – Euskadiko DEA, https://www.geo.euskadi.eus/hasiera/ (last access: 10 October 2023), 2022.
Gradeci, K., Labonnote, N., Sivertsen, E., and Time, B.: The use of insurance data in the analysis of Surface Water Flood events – a systematic review, J. Hydrol., 568, 194–206, https://doi.org/10.1016/j.jhydrol.2018.10.060, 2019.
GV: Caracterización de las masas de agua de Euskadi, https://www.euskadi.eus/contenidos/libro/caracterizacion_masas_agua/es_12298/adjuntos/sintesis.pdf (last access: 10 October 2023), 2002.
GV: Protocolo de predicción, vigilancia y actuación ante fenómenos meteorológicos adversos, Procedimieto DAEM P005 v-11, Gobierno Vasco, https://www.euskadi.eus/contenidos/informacion/proto_meteo/eu_proto/adjuntos/PE-005-Avisos-de-Meteorologia-Adversa-V11-es.pdf (last access: 11 October 2024), 2023.
Hernandez, R., Otxoa de Alda, K., Gomez de Segura, J. D., and Gaztelumendi, S.: Processing of historical data from the Basque AWS network, in: WMO/CIMO Technical Conference on Meteorological and Environmental Instruments and Methods of Observation (CIMO TECO-2022) 10–13 October 2022, Paris, France, https://www.researchgate.net/publication/378004029_Processing_of_historical_data_from_the_Basque_AWS_network (last access: 10 October 2023), 2022.
Hijmans, R.: terra: Spatial Data Analysis, R package version 1.6-41, https://CRAN.R-project.org/package=terra (last access: 28 November 2023), 2022.
Ibisate, A., Ollero, A., and Ormaetxea, O.: Las inundaciones en la vertiente cantábrica del País Vasco en los últimos veinte años: principales eventos, consecuencias territoriales y sistemas de prevención, Serie Geográfica 9, Departamento de Geografía, Prehistoria y Arqueologia, Universidad del País Vasco, http://hdl.handle.net/10017/1097 (last access: 11 October 2024), 2000.
Ikirri, M., Faik, F., Echogdali, F. Z., Antunes, I. M. H. R., Abioui, M., Abdelrahman, K., Fnais, M. S., Wanaim, A., Id-Belqas, M., Boutaleb, S., Sajinkumar, K. S., and Quesada-Román, A.: Flood Hazard Index Application in Arid Catchments: Case of the Taguenit Wadi Watershed, Lakhssas, Morocco, Land, 11, 1178, https://doi.org/10.3390/land11081178, 2022.
Kabacoff, R.: Modern Data Visualization with R, CRC Press, ISBN 13:978-0367138831, 2018.
Lindsay, J. B. and Whitebox, G. A. T.: A case study in geomorphometric analysis, Comput. Geosci., 95, 75–84, https://doi.org/10.1016/j.cageo.2016.07.003, 2016.
Mantovani, J., Alcântara, E., Pampuch, L. A., Praga Baião, C. F., Park, E., Souza Custódio, M., Gozzo, L. F., and Bortolozo, C. A.: Assessing flood risks in the Taquari-Antas Basin (Southeast Brazil) during the September 2023 extreme rainfall surge, npj Nat. Hazards, 1, 9, https://doi.org/10.1038/s44304-024-00009-8, 2024.
Mugerza, I., Gaztelumendi, S., Egaña, J., and Gelpi, I. R.: Rainfall and snowmelt: a dangerous meld for flooding, in: 5th Annual Meeting of the European Meteorological Society (EMS), 12–16 September 2005, Utrecht, the Netherlands, https://doi.org/10.13140/RG.2.2.22477.72168, 2005.
Pebesma, E.: Simple Features for R: Standardized Support for Spatial Vector Data, R J., 10, 439–446, https://doi.org/10.32614/RJ-2018-009, 2018.
Pebesma, E. and Bivand, R.: Spatial Data Science: With applications in R, Chapman and Hall/CRC, https://doi.org/10.1201/9780429459016, 2023.
Pinos, J. and Quesada-Román, A.: Flood Risk-Related Research Trends in Latin America and the Caribbean, Water, 14, 10, https://doi.org/10.3390/w14010010, 2022.
Prieto, C. and Lamas, J. L.: Avenidas extraordinarias en el País Vasco, Geología y prevención de daños por inundaciones, IGME, 247–334, ISBN 84-7474-324-9, 1985.
PSF – Python Software Foundation: Welcome to Python.org, https://www.python.org/ (last access: 28 November 2023), 2021.
Quesada-Román, A.: Landslides and floods zonation using geomorphological analyses in a dynamic catchment of Costa Rica, Rev. Cartogr., 102, 125–138, https://doi.org/10.35424/rcarto.i102.901, 2021.
Quesada-Román, A.: Flood risk index development at the municipal level in Costa Rica: A methodological framework, Environ. Sci. Policy, 133, 98–106, 2022.
R Core Team: R: A language and environment for statistical computing, R Foundation for Statistical Computing, Vienna, Austria, http://www.R-project.org/ (last access: 28 November 2023), 2022.
Ruíz, M., Egaña, J., Gaztelumendi, S., Maruri, M., and Gelpi, I. R.: A case study of heavy and persistent rainfall, in: ERAD 2012, 25–29 June 2012, Toulouse, France, http://www.meteo.fr/cic/meetings/2012/ERAD/extended_abs/RCS_332_ext_abs.pdf (last access: 30 October 2023), 2012.
Santos, P. P., Pereira, S., Zezere, J. L., Tavares, A. O., Reis, E., Garcia, A. C., and Oliveria, S. C: R: A comprehensive approach to understanding flood risk drivers at the municipal level, J. Environ. Manage., 260, 110127, https://doi.org/10.1016/j.jenvman.2020.110127, 2020.
Solín, L. and Rusnák, M.: Preliminary flood risk assessment: Case study of systematic processing of available or readily derivable information, Water Environ. J., 34, 683–698. 2020.
Tang, J., Li, Y., Cui, S., Xu, L., Hu, Y., Ding, S., and Nitivattananon, V.: Analyzing the spatiotemporal dynamics of flood risk and its driving factors in a coastal watershed of southeastern China, Ecol. Indic., 121, 107134, https://doi.org/10.1016/j.ecolind.2020.107134, 2021.
Tate, E., Rahman, M. A., Emrich, C. T., and Sampon, C. C.: Flood exposure and social vulnerability in the United States, Nat. Hazards, 106, 435–45, 2021.
Tufte, R. E.: The Visual Display of Quantitative Information, in: 2nd Edn., Graphics Press, ISBN 13:978-0961392147 2001.
Tukey, J. W.: Exploratory Data Analysis, Addison-Wesley, ISBN 978-0201076165, 1977.
Urzainqui Miqueleiz, A.: Red Fluvial, Enciclopedia Auñamendi, https://aunamendi.eusko-ikaskuntza.eus/es/red-fluvial/ar-101744/ (last access: 28 November 2023), 2023.
Vojtek, M.: Indicator-based approach for fluvial flood risk assessment at municipal level in Slovakia, Sci. Rep., 13, 5014, https://doi.org/10.1038/s41598-023-32239-7, 2023.
Wickham, H.: ggplot2: Elegant Graphics for Data Analysis, Springer-Verlag, New York, ISBN 978-3-319-24277-4, 2016.
Wickham, H. and Grolemund, G.: R for data science, O'Reilly Media, ISBN 13:978-1491910399, 2017.
Wickham, H., François, R., Henry, L., Müller, K., and Vaughan, D.: dplyr: A Grammar of Data Manipulation, GitHub, https://github.com/tidyverse/dplyr (last access: 28 November 2023), 2023.
Wiley, M.: Efficient Data Management for Large Datasets, O'Reilly Media, ISBN 13:978-1801075764. 2021.
Wu, Q. and Brown, A.: `whitebox': `WhiteboxTools' R Frontend, R package version 2.2.0, https://CRAN.R-project.org/package=whitebox (last access: 28 November 2023), 2022.


