 | 24 Nov 2025
Intercomparison of measurements at climate reference stations in Germany on the influence of funnel heating of a precipitation device
Karsten Friedrich
Florian Imbery
Accurate and reliable long time series of precipitation data are essential for a variety of applications and for accurate quantification of climate change.
Such time series should be as homogeneous as possible, but certain changes in measurement conditions cannot be avoided. Parallel measurements are carried out at the German climate reference stations to analyse the effects of changes in the measurement systems, e.g. changing one measuring instrument to another. The aim of these parallel measurements is to identify measurement uncertainties and to analyse the comparability of the measurement systems in order to investigate homogeneity. In this study, the influence of funnel heating on precipitation measurement was analysed using the rain[e] device. General analyses show that the rain[e] sensor measures more precipitation than the PLUVIO sensor, for liquid precipitation regardless of the amount of precipitation. But for solid precipitation PLUVIO measures more. Differences in the equipment of the devices, such as heaters, could cause the measurement differences.
An investigation during winter of 2023/2024 showed that changing the funnel heater temperature setting in the rain[e] influences the amount of precipitation measured. A change in the funnel temperature by 2 °C changed the amount of precipitation by approx. 1.5 %.
- Article
(1777 KB) - Full-text XML
- BibTeX
- EndNote


Precipitation data homogenisation is a central process in climate research to ensure the accuracy and reliability of long-term climate records, which can be affected by factors such as changes in measuring instruments, station relocations or urbanisation effects (Domonkos et al., 2012; Knerr et al., 2019). By using homogenisation techniques, researchers can adjust precipitation data to create consistent and reliable long-term records for climate analysis and trend detection (Della-Marta, 2006).
To overcome these challenges, researchers often compare meteorological measurements from different sources to assess their reliability and consistency. This type of comparison is particularly important at climate reference stations, which are established to provide high-quality, long-term measurements of weather variables for monitoring and research purposes. To this end, the German Weather Service has established parallel measurements at climate reference stations to ensure accurate and precise measurements of meteorological parameters (Hannak et al., 2020, 2019), such as precipitation. These comparisons involve the analysis of different data sets from different measurement principles and instruments, and could be complemented and compared with satellite, reanalysis and model data. The aim is to ensure that precipitation measurements remain consistent before and after the change in measurement technology. These locations were selected as climate reference stations due to their long and homogeneous measurement series without station relocations, changes in the measurement environment and cover different natural areas in Germany. Nevertheless, new measuring instruments lead to changes in the measuring sensors and measuring methods. In order to investigate and filter out these differences without other influences that can lead to inhomogeneities, comparisons with alternative measuring instruments (e.g. other measuring methods) are carried out in parallel at climate reference stations in addition to the operational measuring instruments. This helps to trace possible inhomogeneities and breaks in the measurement time series back to a change of instrument (Kaspar et al., 2016). This article focuses in particular on the influence of funnel heating on precipitation measurement, which was not present in earlier generations of precipitation gauges.
In a first experiment, the main aim was to investigate the measurement differences between two precipitation instruments from OTT and Lambrecht, which were operated parallel at climate reference stations over a period of almost seven years. This was done in the context of both instruments being used consecutively in the operational measurement network of the German Weather Service. Potential measurement differences can be used to examine time series for possible breaks and inhomogeneities. In a second experiment and on the basis of the results from the first experiment, three of the rain[e] devices were operated with different device settings, in which the funnel heater, responsible for melting solid precipitation, is operated at different temperatures. The aim here is to find a temperature setting that can be used in the entire operational measuring network of the German Weather Service, as is currently the case. This type of comparison is particularly important for climate reference stations, which have been set up to provide high-quality, long-term measurements of weather variables for monitoring and research purposes. The aim is to ensure that precipitation measurements remain consistent before and after the change in measurement technology.
2.1 Data
Ten climate reference stations have been established to identify differences between measurement systems and instruments in different natural areas (Kaspar et al., 2016). A new automatic precipitation sensor, the rain[e] from Lambrecht, is in use in the DWD Measurement network since 2017. This is equipped with a wind shield and allows a combined precipitation measurement based on the weighing principle and an additional tipping bucket mechanism. Previously, Ott's PLUVIO device was used, which works exclusively by the weighing principle and was operated without wind shield within the network of the German Weather Service. Both devices have a ring heater on the upper edge of the device to prevent ice deposits. The rain[e] also has two additional heaters. A drain heater to ensure self-draining and a funnel heater to melt solid precipitation. The latter is set to a temperature of 5 °C in the entire measuring network of the German Weather Service. This means that if the outside temperature is below 5 °C, this heater starts up. A schematic sketch of the structure of the rain[e] can be found in Deutscher Wetterdienst (2025) on page 19 and Fig. 8. The three heaters shown here include the ring heater, funnel heater and drain heater. The change of sensors and the different equipment lead to uncertainties in the measurement results. All stations are equipped with a PLUVIO instrument without wind shield (see Fig. 1).
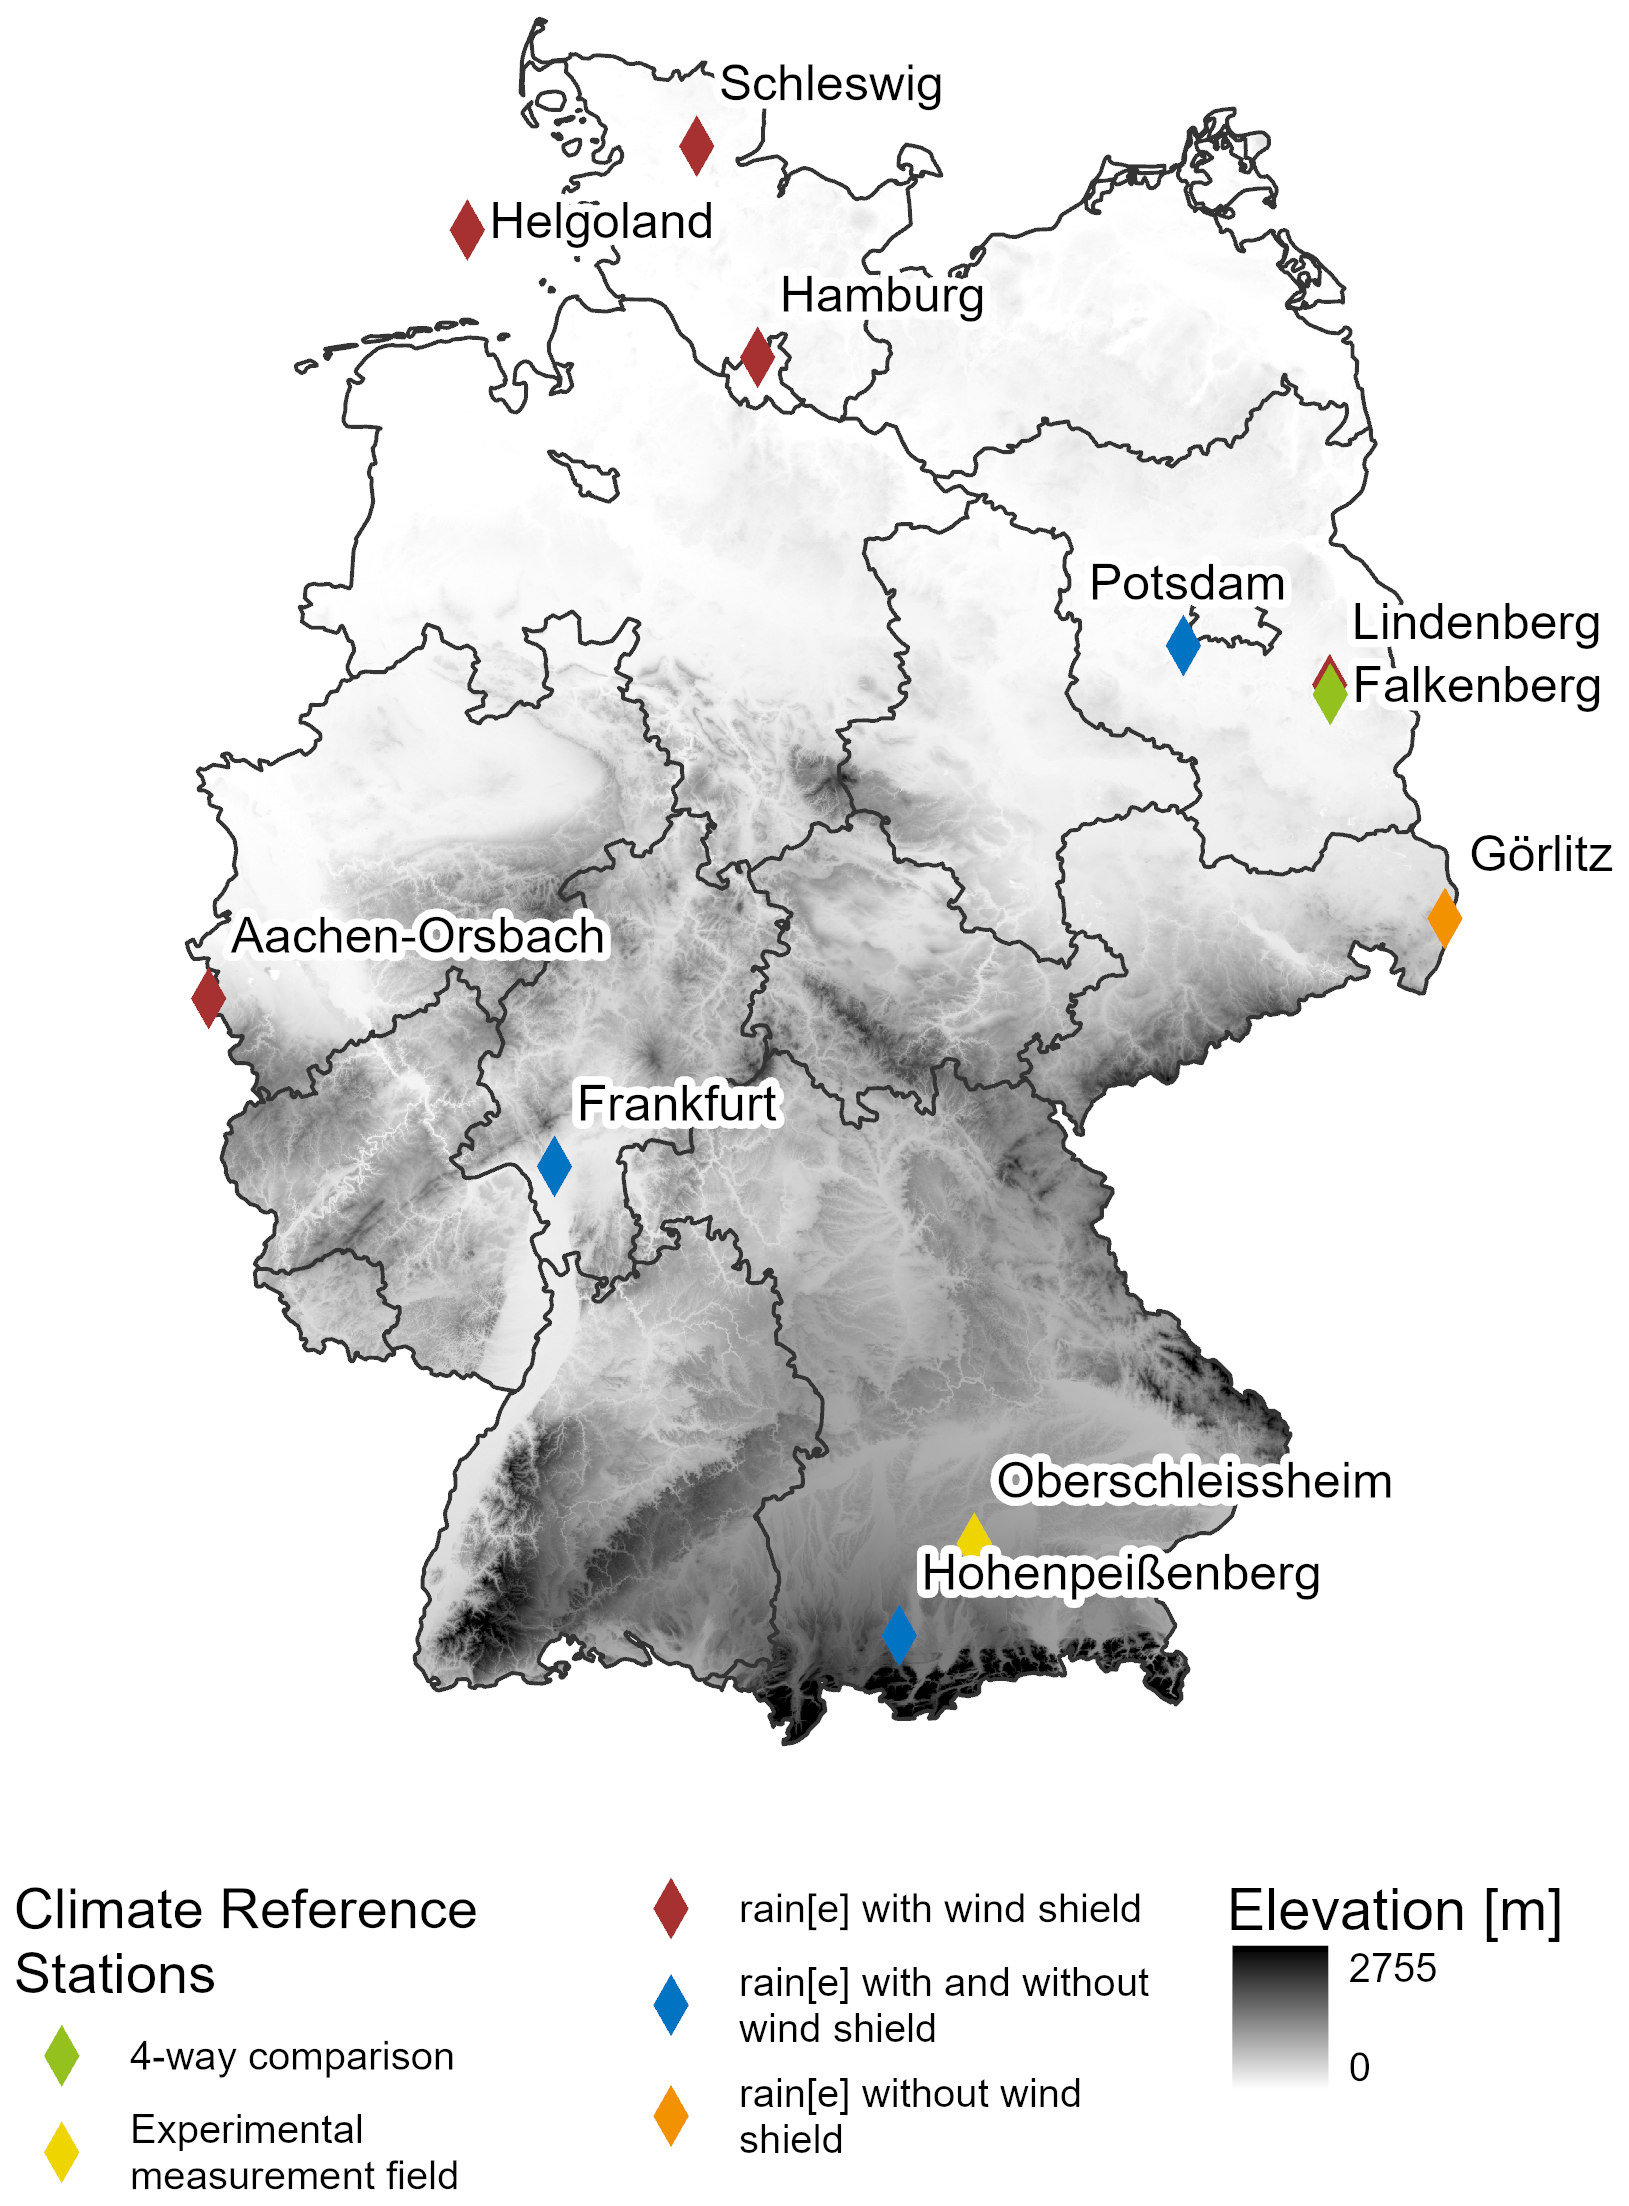
Figure 1Map of the climate reference stations in Germany and the respective equipment of the parallel precipitation gauges as well as the test field in Oberschleißheim and the two short comparisons in Oberstdorf and Garmisch-Partenkirchen (DEM using NASA JPL, 2013).
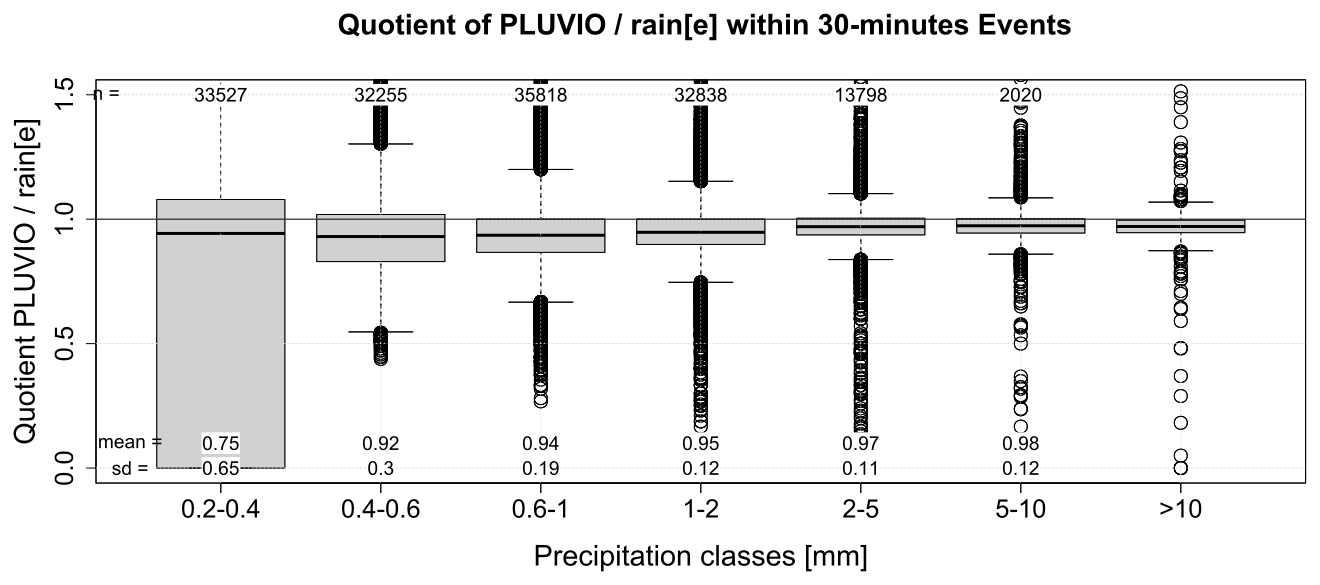
Figure 2Ratios of the defined precipitation events for all climate reference stations in the respective longest possible period. The ratio of the precipitation of PLUVIO without wind shield to that of rain[e] with wind shield is shown.
At the Görlitz station a rain[e] without wind shield is measured in parallel, at all other stations a rain[e] with wind shield. To investigate the influence of the wind shield on the measurement, another rain[e] without wind shield was installed at the stations Frankfurt, Hohenpeißenberg and Potsdam as well as at the experimental boundary layer measurement site in Falkenberg, where additionally a PLUVIO with wind shield is installed. The temporal resolution of the rain[e] measurements has been available in 1 and 10 min values since the start of the parallel measurement operation. Beginning with January 2020, the PLUVIO measurements were also recorded 1 min values; previously, only 10 min totals were available. The 10 min values are used for the analyses, so that a longer period can be considered. The wind speeds at a height of about 10 m (using a Ultrasonic Anemometer 2D compact of Thies company at all stations) are also used for further analyses, as well as the data from the distrometers (using a Laser Precipitation Monitor of Thies company) to obtain information on the form of precipitation (solid/liquid). The measuring devices used were regularly maintained and calibrated as part of the operational network, as the rain[e] with wind shield is also part of the operational measuring network.
2.2 Definition of Precipitation Events
First, precipitation events are defined. Such an event exists if the amount of precipitation is greater or equal than 0.25 mm in a rolling 30 min interval (of 10 min values) and precipitation is measured in at least two of the three 10 min intervals. In addition, both precipitation gauges (PLUVIO and rain[e]) must monitor this precipitation. For this purpose, the data series are synchronised (5 min offset of the PLUVIO measurement). Ratios are calculated from the precipitation totals determined for each event. The rain[e] measurement is defined as the reference here. Both the mean wind speed of the moving 30 min intervals (from 10 min values) and the precipitation form (solid or liquid) from the distrometer measurements are used to further subdivide the precipitation events.
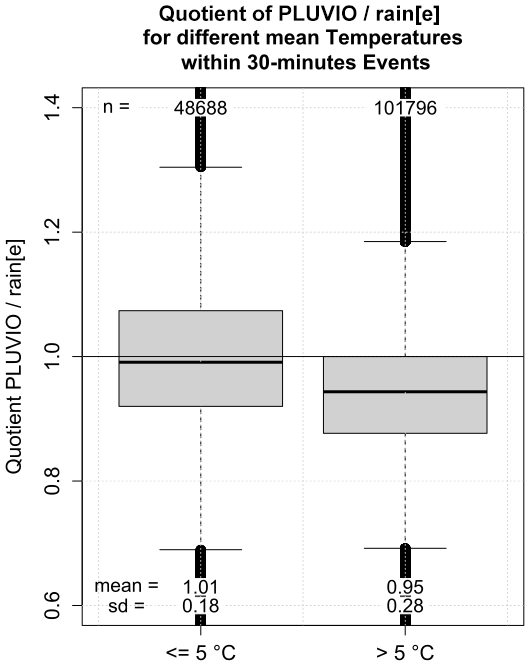
Figure 3Boxplots for all climate reference stations and the subdivision of precipitation events with regard to the form of precipitation into solid and liquid precipitation. The ratio of the precipitation of PLUVIO without wind shield to that of rain[e] with wind shield is shown.
General analyses have shown that the rain[e] device records more precipitation than the PLUVIO device, regardless of the amount of precipitation. For the evaluation, the ratios of all precipitation events defined in the Sect. 2.2. were subdivided according to the precipitation level of the rain[e] and displayed as box plots. In each case, the rain[e] instrument reading serves as the reference in the denominator.
Figure 2 shows the ratios of precipitation totals per event, where a value less than 1 means that the rain[e] device measured more precipitation than the PLUVIO. The variability is greatest for low rainfall totals, while the differences between the devices level out for higher rainfall totals. Across all precipitation classes, the rain[e] tends to measure more precipitation than the PLUVIO. If the precipitation events are categorised according to the type of precipitation (solid/liquid), the same picture emerges for liquid precipitation, with the rain[e] measuring more precipitation than the PLUVIO (see Fig. 3). However, for precipitation events with solid precipitation, it can be seen that the PLUVIO measures more precipitation than the rain[e] device. The differences in the precipitation sum between liquid and solid precipitation events are on average 5 %.
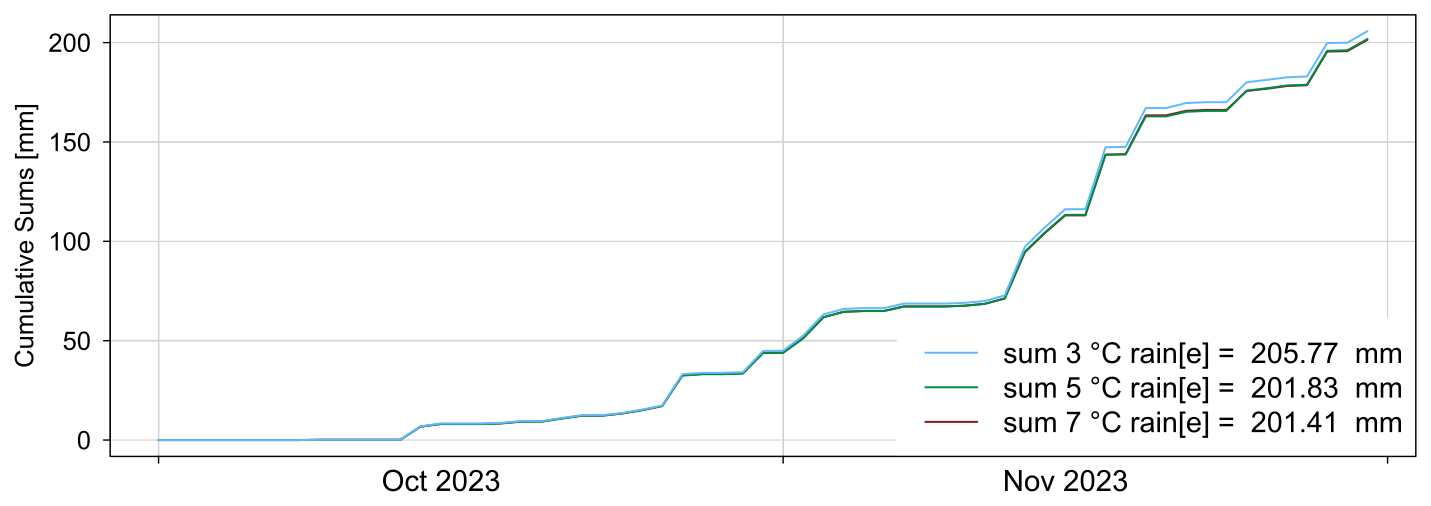
Figure 4Cumulative precipitation totals for three rain[e] devices without wind shield in Oberschleißheim with the same device settings for the period October and November 2023. The devices are labelled in the legend according to the target temperature which is set for the devices from 1 December.
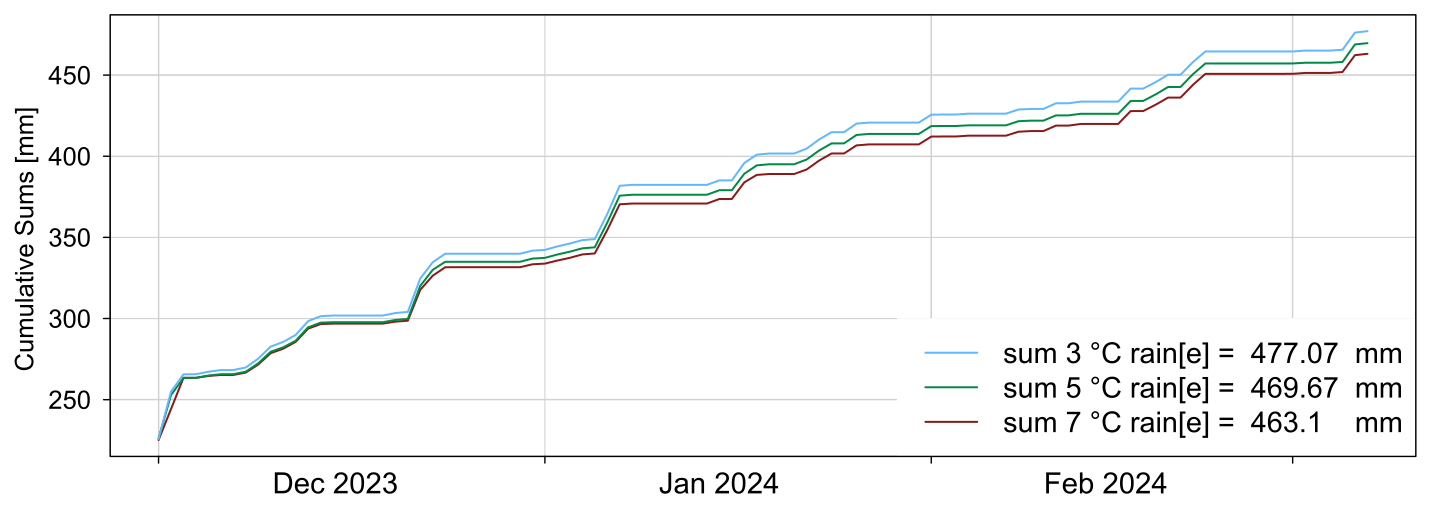
Figure 5Cumulative precipitation totals for three rain[e] devices without wind shield in Oberschleißheim with different device settings for the period 1 December 2023 to 8 March 2024. The devices are labelled in the legend according to the setting of the target temperature of the funnel heater.
It was not possible to homogenize the data on the basis of the findings obtained here. The measured differences between the two devices PLUVIO and rain[e] were so small and show measurement uncertainties which were not sufficient for the reliable detection of significant breaks in the data series. A previous study found that, precipitation gauges without wind protection might only record up to 50 % of the actual amount of precipitation when it is solid precipitation and the wind speed is above 5 m s−1 (Kochendorfer et al., 2017). This suggests that other properties may be responsible for the measurement differences. In this experiment, the ratio of the precipitation sums of PLUVIO and rain[e] was also examined as a function of precipitation type (solid/liquid) and the average wind speed within the 30 min events (not shown). It was found that with liquid precipitation there was a slight dependence on wind speed; the rain[e] consistently measured more precipitation, whereby the difference became smaller with higher wind speeds. In the case of solid precipitation, there was a clear increase in the measured precipitation of the PLUVIO device from a wind speed of over 10 m s−1, even though it is not equipped with a wind shield.
A possible reason for these measurement differences could be the different equipment of the two instruments, with several built-in heaters in the rain[e] instrument. Both instruments have a ring heater which prevents forming a snow cap. The rain[e] also has a drain heater and a funnel heating.
The latter is set to a target temperature of 5 °C throughout the DWD measuring network, i.e. if the outside temperature falls below 5 °C, the heater switches on and ensures that the precipitation does not freeze on the funnel and solid precipitation is melted. However, this can lead to an evaporation error. In order to investigate the exact effects of this possible error in more detail, a comparative test was started in autumn 2023 at the Oberschleißheim test site, in which three rain[e] devices without wind shields were installed in parallel over the winter of 2023/24 with different funnel temperatures. In an initial parallel operation in the months of October and November 2023, all devices were operated with exactly the same settings (funnel temperature at 5 °C) in order to determine and eliminate possible measurement differences between the devices. From 1 December 2023, the temperatures were then set to 3, 5 (reference instrument) and 7 °C.
Table 1Summarized results from the investigation into the influence of funnel heating on the rain[e] of Figs. 4 and 5.
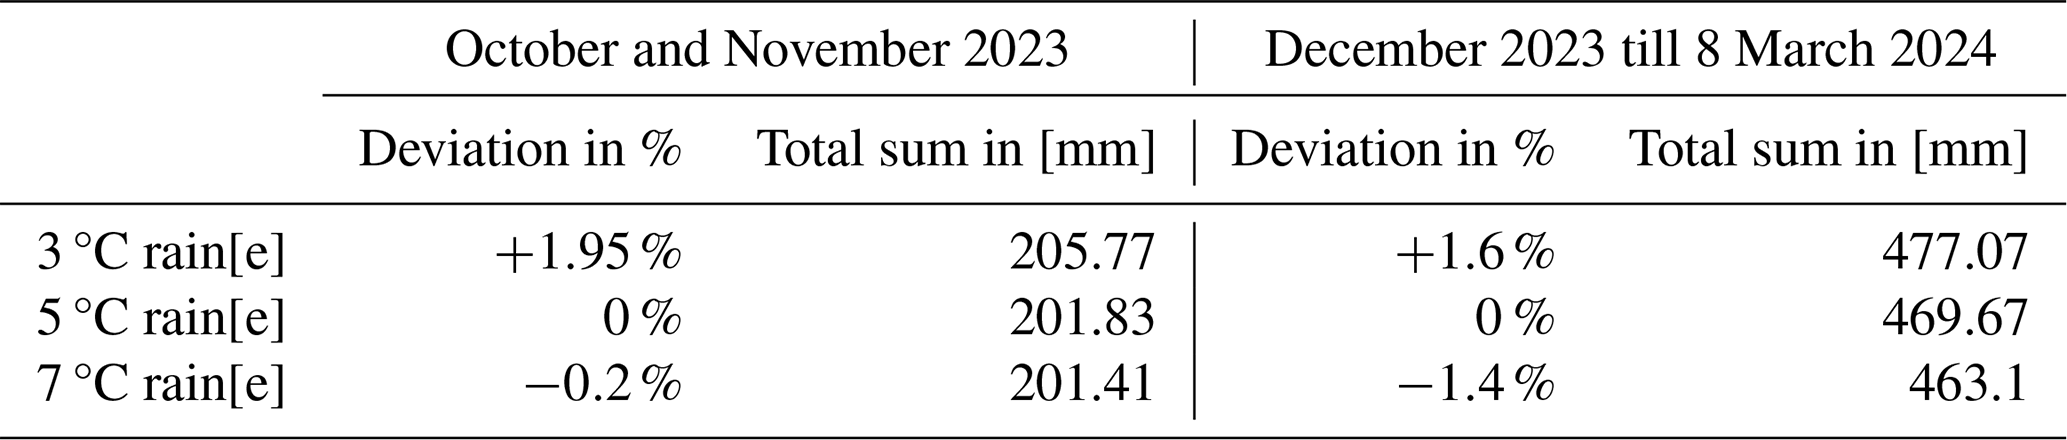
Figure 4 shows the cumulative precipitation totals for October and November 2023 for the three rain[e] devices with the same device settings. The devices are named according to the target temperature they will reach from 1 December 2023. It can be seen that the blue curve (3 °C rain[e]) records 1.95 % more precipitation than the other two devices (5 and 7 °C rain[e]). The difference between the latter two is only 0.21 %. According to the manufacturer, Lambrecht, all the differences are within the tolerance of the measurement uncertainty. However, to account for this error, the 3 °C rain[e] measurements have been corrected accordingly. The differences between 5 °C rain[e] and 7 °C rain[e] are so small that they are not corrected. After changing the target temperature of the funnel heater to 3 or 7 °C, precipitation events with solid precipitation occurred in the Munich area in early December and early/mid-January. At the end of the parallel test measurements on 8 March 2024, it can be seen that the rain[e] with a target temperature of 3 °C measured the most precipitation and the rain[e] with a target temperature of 7 °C measured the least precipitation (see Fig. 5). The percentage differences compared to the reference device (5 °C rain[e]) are 1.6 % more precipitation (3 °C rain[e]) and 1.4 % less precipitation (7 °C rain[e]). This experiment showed that changing the target temperature of the funnel heater in the rain[e] can lead to a change in the measured precipitation. In this particular case, the amount of precipitation changed by approximately 1.5 % when the hopper temperature was changed by 2 °C. It can be assumed that these differences are not due to measurement uncertainties, but represent a systematic error.
A study by Richter (1995) dealt with evaporation and wetting errors with the Hellmann manual measuring device. If the funnel is completely wetted, the error can amount to between 10 %–20 % of the measured quantity, which is particularly large for short showers. Over the year, systematic errors of around 3 %–5 % of the total amount of precipitation can be measured.
Leeper and Kochendorfer (2015) also show in their study that evaporation errors can occur in the collection container, especially in the summer months with high temperatures and solar radiation, which is attempted to be kept to a minimum by using evaporative suppressant. Such an evaporation error in the collection container does not play a role in the rain[e], as the device is self-draining. However, this shows that the evaporation error cannot be neglected at higher temperatures (due to solar radiation or the use of a heater).
Differences were found which indicate a systematic error. At this point, however, the data basis is still so small that a reliable homogenization of the data with regard to the heating setting can't be made.
The results of Figs. 4 and 5 are also summarized in Table 1.
A further attempt to investigate the differences between PLUVIO and rain[e] measurements on precipitation events with solid precipitation took place between December 2021 and May 2023 with parallel measurements from both instruments at the sites Oberstdorf and Garmisch-Partenkirchen. Unfortunately, there were hardly any precipitation events with solid precipitation in the two winters, so that no conclusions could be drawn about measurement differences in this weather situation.
The influence of a missing wind shield was not investigated in this experiment.
A comparison of two rain gauges (OTT's PLUVIO and Lambrecht's rain[e]) showed that the rain[e] measures more precipitation over the year. If we look at certain weather conditions, in this case the comparison of solid and liquid precipitation measurements, we can see that the rain[e] now records less precipitation.
One of the differences between the two devices is a funnel heating that melts solid precipitation in the rain[e]. However, this can also lead to an evaporation error if the heater is set too high.
In this study, a comparison was made between two identical Lambrecht rain[e]s on a test field in southern Germany. The aim of the study was to determine the influence of the funnel heating on the precipitation measurement. Three instruments were set up for this purpose. In a first, short phase, measurements were taken with the same settings in order to filter out measurement differences between the instruments and not to take them into account in the subsequent measurements. In a second phase, the funnel heaters were set at different temperatures (3, 5 and 7 °C). Over a period of 3 months from December 2023 to March 2024, it was shown that there is a systematic error in some snow events, i.e. a 2 °C change in the hopper heating leads to a change in precipitation of about 1.5 %. As the experiment only lasted one winter, it will be repeated in future winters.
Increasing the precipitation sum of the rain[e] device by changing the funnel heating would also change the ratio of the measured precipitation sums of PLUVIO and rain[e] (see Fig. 2). This change leads to a reduction in the mean value of the ratio and, due to the assumed constant variance, to a reduction in the standard deviation.
The software code underlying this study consists of R scripts for data preprocessing and the application of standard statistical methods to compare measurements. No novel algorithms or proprietary software were developed. The code is not publicly accessible, as its functionality is directly tied to comparative measurement data that are not publicly available. Publication of the code without the corresponding data would not allow meaningful reuse or replication. All statistical analyses were conducted using established methods implemented in widely available software environments (in this case R). References to these environments and packages are provided in the Methods section. No third-party or externally deposited code was used beyond standard statistical libraries.
The operational data used in this study are publicly accessible through the Climate Data Center (CDC) of Deutscher Wetterdienst. These data can be accessed via the CDC data repository at https://opendata.dwd.de/climate_environment/CDC/ (last access: 16 August 2024). The operationally used data are the rain[e] measurements from Figs. 2 and 3 and the temperature data from Fig. 3. The comparative measurement data collected within the framework of this project are not publicly available. Their publication was not foreseen in the project design, and therefore no repository deposition has been planned. Access to these data is restricted to the project team.
IK wrote the first draft of the article. The final version was revised by IK, FK and FI.
The contact author has declared that none of the authors has any competing interests.
Publisher’s note: Copernicus Publications remains neutral with regard to jurisdictional claims made in the text, published maps, institutional affiliations, or any other geographical representation in this paper. While Copernicus Publications makes every effort to include appropriate place names, the final responsibility lies with the authors. Views expressed in the text are those of the authors and do not necessarily reflect the views of the publisher.
This article is part of the special issue “EMS Annual Meeting: European Conference for Applied Meteorology and Climatology 2024”. It is a result of the EMS Annual Meeting 2024, Barcelona, Spain, 2–6 September 2024.
We would like to thank Alrik Selle and his team for installing and maintaining the test in Oberschleissheim. We would like to express our grateful thanks to Mike Molyneux from the Met Office, Mark Dutton from Newcastle University/UK, an anonymous reviewer and the editor for their valuable feedback on our study. The DEM data used in this study contain modified NASA JPL information. The NASA JPL is not responsible for any use that may be made of the Information or the data it contains.
This research was supported by the Deutscher Wetterdienst research program “Innovation in Applied Research and Development” (IAFE).
This paper was edited by Dan Hollis and reviewed by Mike Molyneux and Mark Dutton.
Della-Marta, P. M.: A method of Homogenizing the Extrems and Means of Daily Temperature Measurements, Journal of Climate, 19, 4179–4197, https://doi.org/10.1175/JCLI3855.1, 2006.
Deutscher Wetterdienst (Eds.): Einheitliche Beobachtungsanleitung für nebenamtliche Stationen (ANKONDA), Deutscher Wetterdienst, Offenbach am Main, https://kunden.dwd.de/ankonda/docs/Beobachterhandbuch-Ankonda.pdf (last access: 7 October 2025), 2025.
Domonkos, P., Venema, V., Auer, I., Mestre, O., and Brunetti, M.: The historical pathway towards more accurate homogenisation, Adv. Sci. Res., 8, 45–52, https://doi.org/10.5194/asr-8-45-2012, 2012.
Hannak, L., Friedrich, K., Imbery, F., and Kaspar, F.: Comparison of manual and automatic daily sunshine duration measurements at German climate reference stations, Adv. Sci. Res., 16, 175–183, https://doi.org/10.5194/asr-16-175-2019, 2019.
Hannak, L., Friedrich, K., Imbery, F., and Kaspar, F.: Analyzing the impact of automatization using parallel daily mean temperature series including breakpoint detection and homogenization, International Journal of Climatology, 40, 6544–6559, https://doi.org/10.1002/joc.6597, 2020.
Kaspar, F., Hannak, L., and Schreiber, K.-J.: Climate reference stations in Germany: Status, parallel measurements and homogeneity of temperature time series, Adv. Sci. Res., 13, 163–171, https://doi.org/10.5194/asr-13-163-2016, 2016.
Knerr, I., Dienst, M., Lindén, J., Dobrovolný, P., Geletic, J., Büntgen, U., and Esper, J.: Addressing the relocation bias in a long temperature record by means of land cover assessment, Theoretical and Applied Climatology, 137, 2853–2863, https://doi.org/10.1007/s00704-019-02783-2, 2019.
Kochendorfer, J., Rasmussen, R., Wolff, M., Baker, B., Hall, M. E., Meyers, T., Landolt, S., Jachcik, A., Isaksen, K., Brækkan, R., and Leeper, R.: The quantification and correction of wind-induced precipitation measurement errors, Hydrol. Earth Syst. Sci., 21, 1973–1989, https://doi.org/10.5194/hess-21-1973-2017, 2017.
Leeper, R. D. and Kochendorfer, J.: Evaporation from weighing precipitation gauges: impacts on automated gauge measurements and quality assurance methods, Atmos. Meas. Tech., 8, 2291–2300, https://doi.org/10.5194/amt-8-2291-2015, 2015.
Richter, D.: Ergebnisse methodischer Untersuchungen zur Korrektur des systematischen Meßfehlers des Hellmann-Niederschlagsmessers, Berichte des Deutschen Wetterdienstes, 194, Selbstverl. des Dt. Wetterdienstes, Offenbach am Main, 93 p., graph. Darst., https://dwdbib.dwd.de/retrosammlung/content/pageview/38929 (last acess: 7 October 2025), 1995.
NASA JPL: NASA Shuttle Radar Topography Mission Global 1 arc second (Version 3.0), NASA EOSDIS Land Processes DAAC [data set], https://doi.org/10.5067/MEaSUREs/SRTM/SRTMGL1.003, 2013.
Such time series should be consistent, but changes in the measurement conditions can't always be avoided. Parallel measurements are carried out at German climate reference stations in order to analyse the effects of changes in the measuring systems, e.g. when switching the device to another.
In this study, the influence of funnel heating on precipitation measurement was analysed.