 | 04 May 2018
Thermal and climatic zoning for construction in the southern part of Chile
Konstantin Verichev
Alisa Salimova
This paper presents the results of the updated boundaries of thermal zones in the tree southern regions of Chile, based on the method of heating degrees-days according to hourly temperature measurements at meteorological stations in the last decade. The Ministry of Housing and Urban Planning of Chile has not updated these boundaries since 1999. Using the Climatic Severity index method, the relative energy consumption of dwellings was analyzed for cooling and heating in summer and winter periods, respectively. The analysis revealed that, within the limits of a single thermal zone, the energy costs for cooling in the summer period of the same house may differ by 50 %.
- Article
(2509 KB) - Full-text XML
- BibTeX
- EndNote


The correct definition of climatic zones for building construction allows building materials to be adequately selected for different geographic regions, thus minimizing energy costs for heating and cooling (Carpio et al., 2014, 2015). Chile is the longest country in the world from north to south and is characterized by the presence of multiple climatic zones (from tropical climates in the north to the Antarctic in the far south) (Kottek et al., 2006). With the additional effect of the altitude zonation of the Andes, Chile's climates exhibit not only meridional variability, but also latitudinal variability (Sarricolea et al., 2016). Therefore, from the point of view of building climatology, Chile is a very interesting country for studying and developing this field of applied meteorology.
Chile maintains an official document to regulate construction norms and materials that should be used in different geographical parts of the country, known as Thermal Regulation (TR) of the General Ordinance of Urban Planning and Constructions of the Ministry of Housing and Urban Planning of Chile (MINVU) (Ministry of Housing and Urban Planning of Chile, 2009). In TR document, construction recommendations have been developed for seven thermal zones, which in turn were determined in 1999 by the heating degree-days (HDD) method with base temperature of 15 ∘C (HDD15 ∘C) (Ministry of Housing and Urban Planning of Chile, 2006). The degree-days method is widely used in the world and is used to determine climatic zones in more than 55 countries. Nonetheless, thermal zoning in Chile on the basis of the degree-days method has been criticized, firstly for taking into account only the energy costs of buildings for heating in winter (which makes this zoning uncommon and almost unused in northern Chile) (Bustamante, 2009; Bustamante et al., 2009; Ossio et al., 2012), and secondly for the reliance on meteorological data from 1999 made obsolete by the conditions of climate change (IPCC, 2013).
Three regions in the south of Chile were selected for our study. The La Araucania, Los Rios and Los Lagos regions are characterized by Mediterranean and temperate oceanic climate types, with relatively warm and rainy winters and relatively cool and dry summers. The construction of houses in these regions is mostly based on minimizing energy costs for heating buildings. In winter, these regions consume the most firewood for stove heating, which yields a high level of atmospheric pollution (Hernández and Arroyo, 2014; Ministry of the Environment of Chile, 2014).
Therefore, the main purpose of this work is to update the thermal zones based on meteorological station measurements over the past decade in the three southern regions of Chile; to analyze the feasibility of applying the Climate Severity Index method (de la Flor et al., 2006; Markus, 1982) for climatic zoning in construction for the studied regions; and to analyze the relative energy consumption of heating and cooling buildings in various thermal zones.
2.1 Method of degree-days
A widely used method of estimating the energy costs of buildings for heating and cooling. The annual number of HDD is calculated as the sum of the daily average positive differences between the comfort temperature inside the room and the outside temperature:
where Th is the hourly measured temperature value, the (+) sign indicates the necessity to sum only the positive differences between Tc and Th. In the case of cooling degree-days (CDD), it is necessary to sum only the positive difference between Th and Tc:
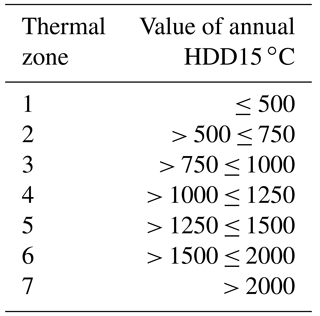
According to document TR MINVU, the comfort indoor temperature Tc in Chile is determined to be 15 ∘C, for comparison in the USA and Spain this temperature is 18 and 20 ∘C, respectively (Government of Spain, 2006; Owen, 2013). In Chile, thermal zoning for construction is based only on the annual values of HDD15 ∘C and defines 7 thermal zones (Table 1). The higher the value of HDD15 ∘C, the more energy is needed to heat and maintain a comfortable indoor temperature.
The wide application of the method of degree-days in construction climatology also imposes limitations. This method is based only on the thermal regime of a certain geographic area, and this method is optimally applicable in regions where solar radiation and wind speed have a negligible contribution to the thermal balance of the building. On the other hand, the use of this method is not entirely suitable for commercial buildings (Makhmalbaf et al., 2013), therefore in this work we consider residential buildings.
2.2 Climatic Severity Index method
This method was developed based on modeling the energy consumption of houses in 50 cities of Spain under different climatic conditions (Government of Spain, 2006; de la Flor et al., 2006). For this model, absolute values of energy consumption for heating and cooling of premises in each city were translated into relative indices (Summer Climatic Severity Index – SCSI and Winter Climatic Severity Index – WCSI) and normalized for energy consumption in the city of Madrid. The index of relative energy consumption for cooling and heating buildings was associated with the climatic values of meteorological indicators by the equation:
where R4m is the average monthly value of total solar radiation for the three summer and first autumn months [kWh m−2] and CDD4m is the average monthly value of cooling degree-days for 4 months calculated at indoor temperature of 20 ∘C.
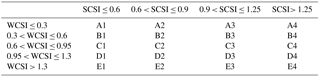
where R3m is the average monthly value of total solar radiation for the three winter months [kWh m−2], HDD3m is the average monthly value of heating degree-days for 3 months calculated at indoor temperature of 20 ∘C. The values of the letter coefficients for the two Eqs. (3) and (4) are presented in the paper de la Flor et al. (2006). Calculated indices at any geographical point allow the determination of the building climatic zones (Table 2). For Madrid, SCSI = 1.0 and WCSI = 1.0 and corresponds to the climatic zone D3 (Government of Spain, 2006; de la Flor et al., 2006).
2.3 Database
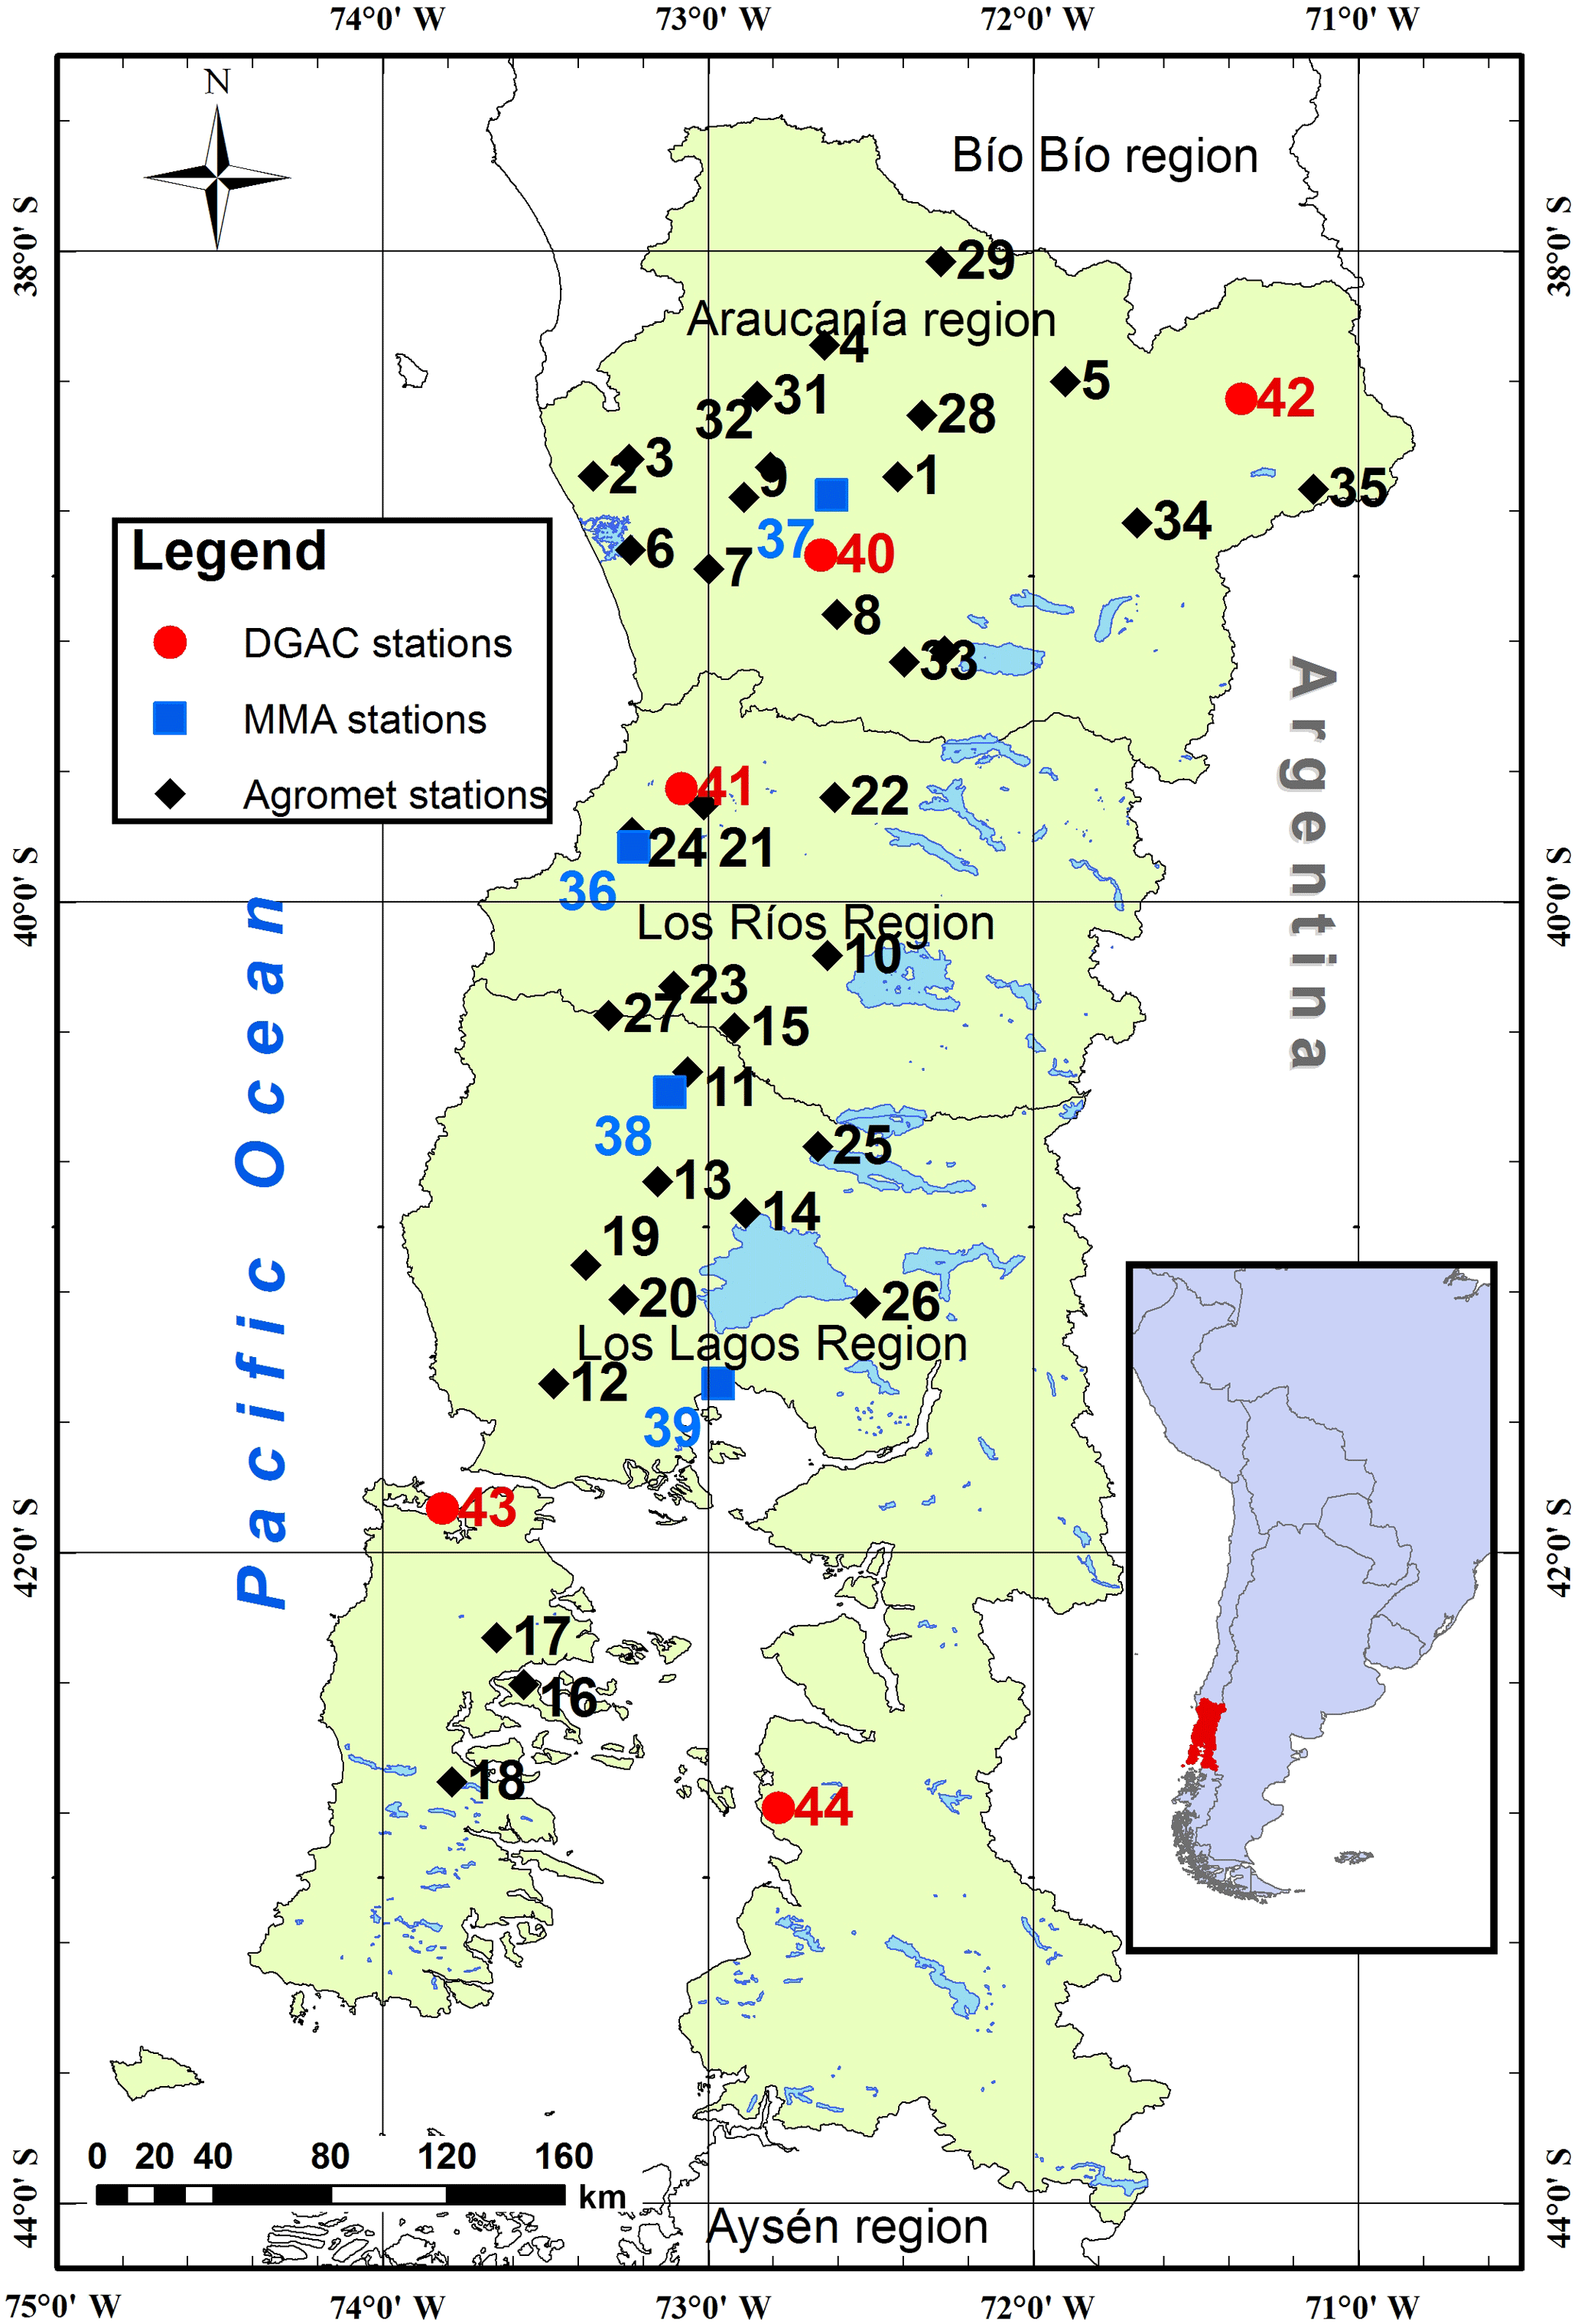
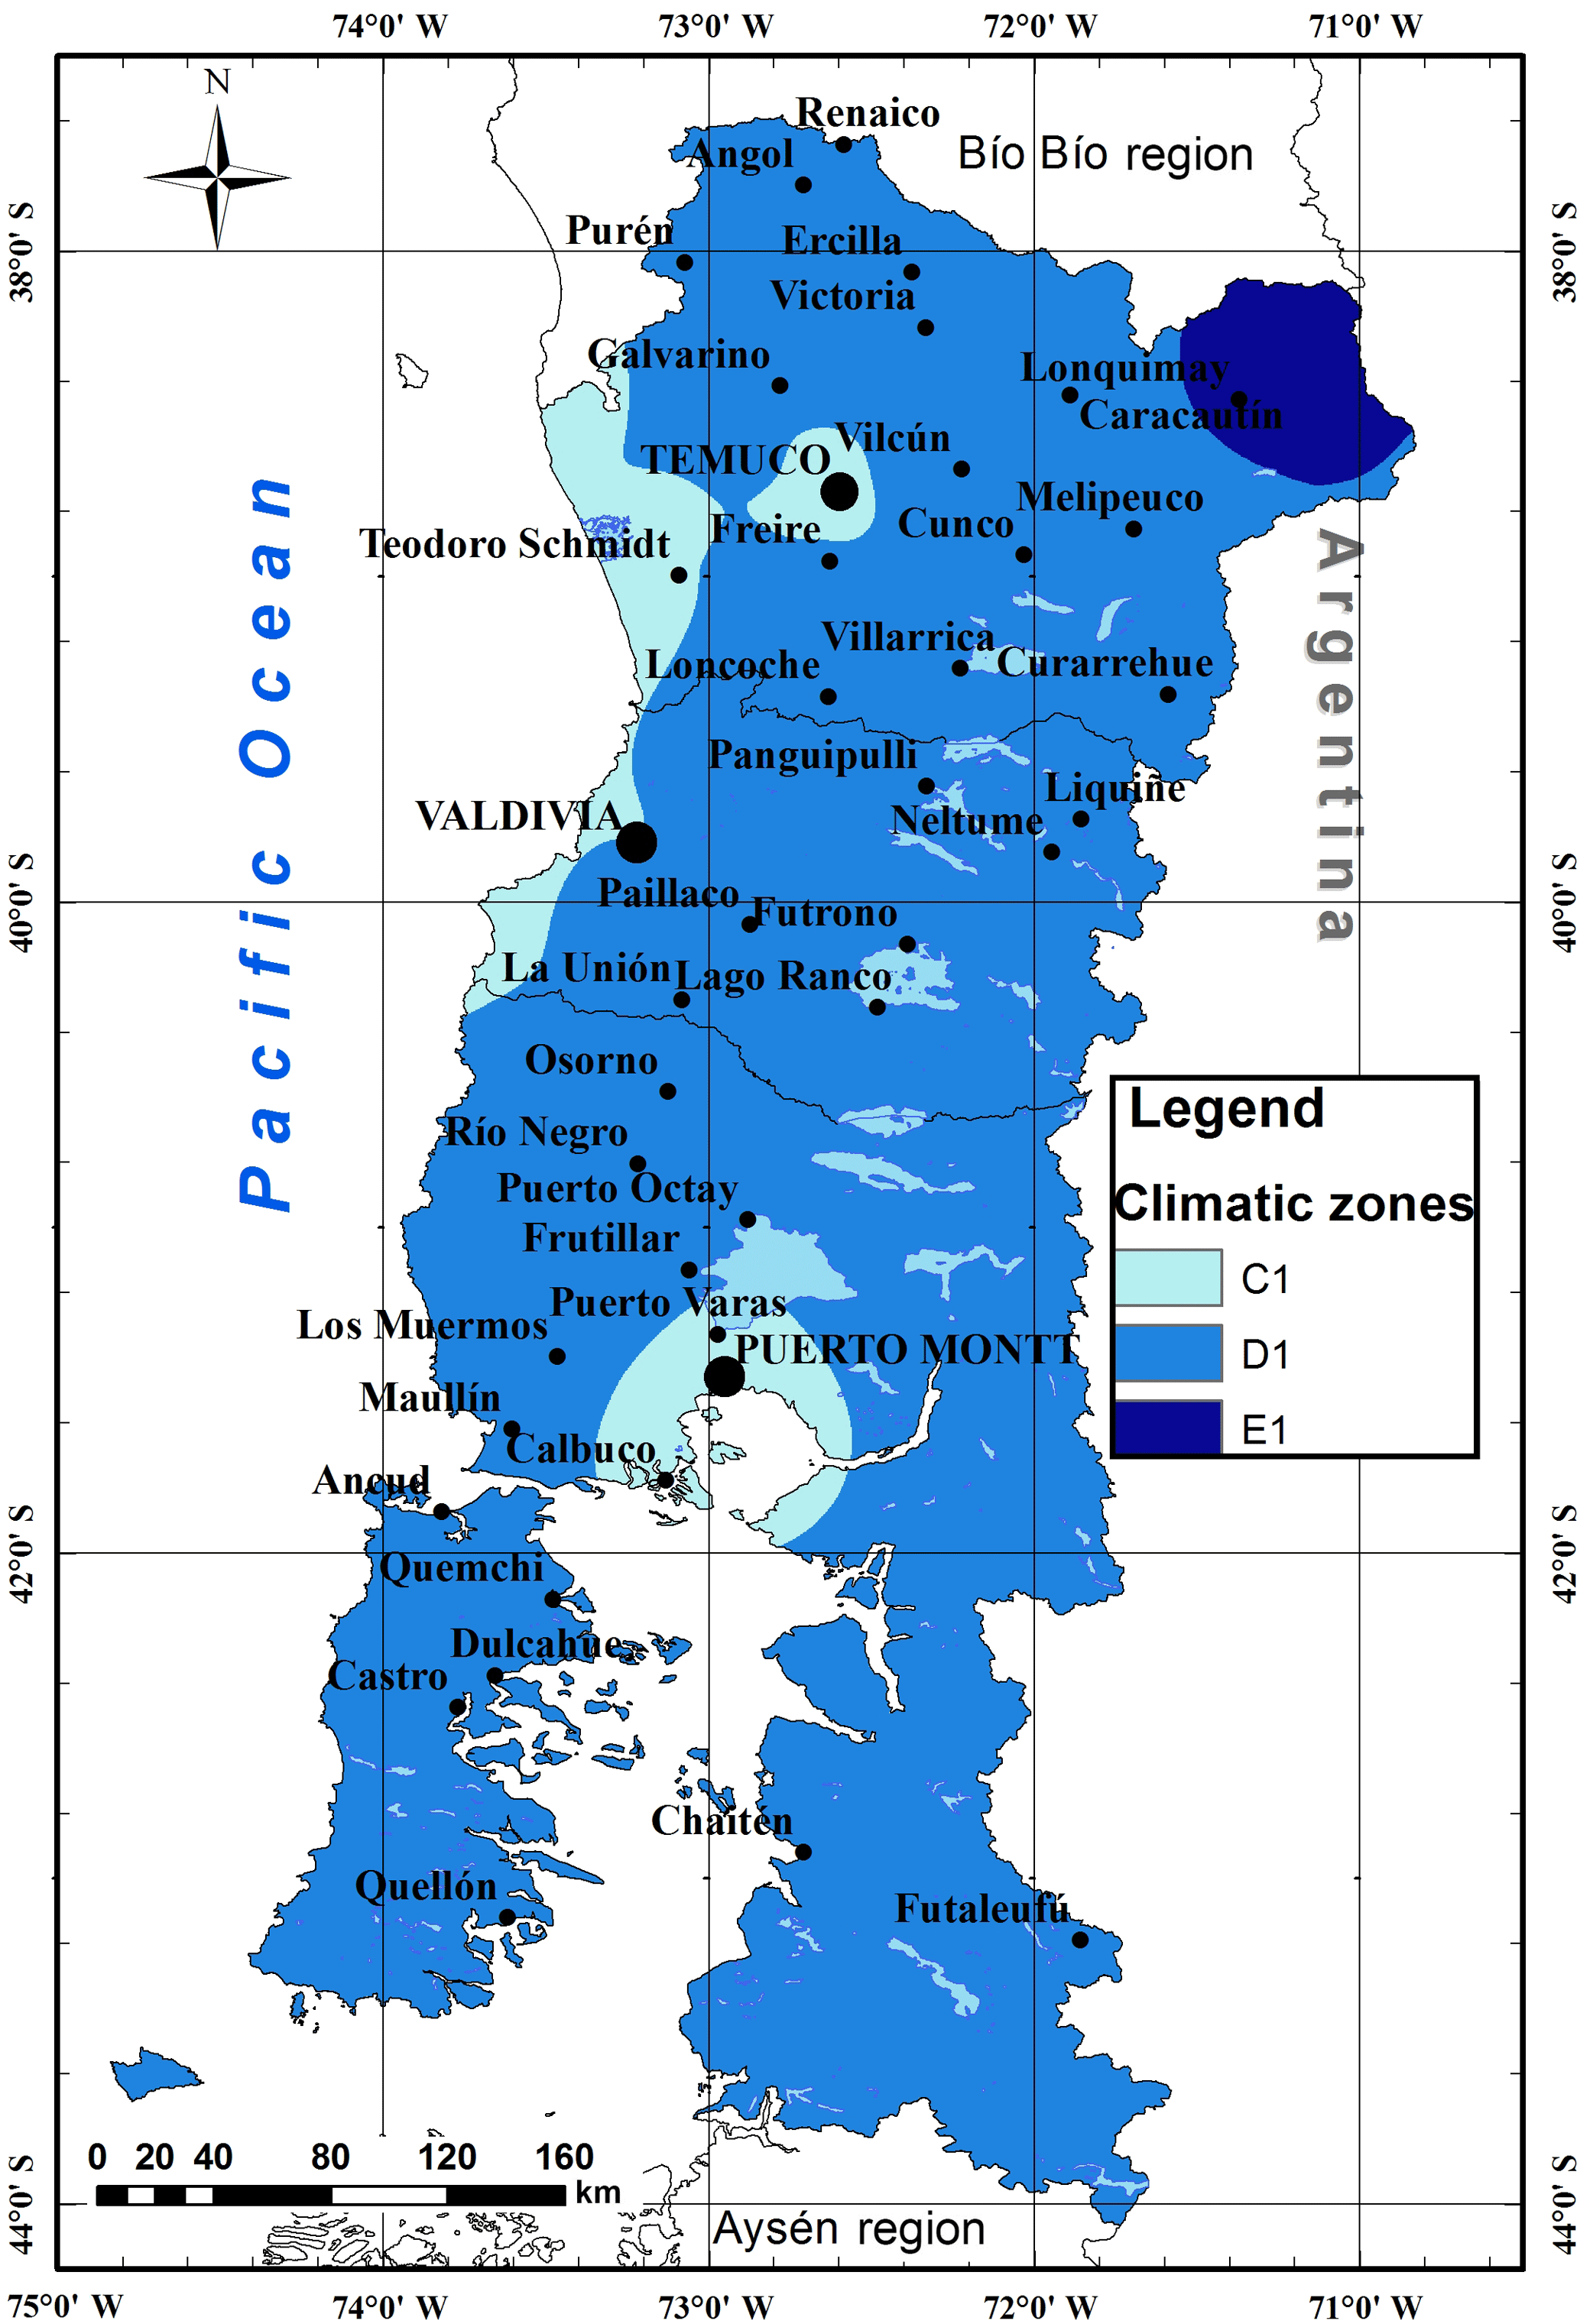
In this paper, we used the temperature and total solar radiation data obtained from the meteorological stations in the studied area of the Ministry of Agriculture of Chile (Agromet), the Ministry of Environment (MMA) and the Directorate General of Civil Aviation (DGAC), a total of 44 stations. Their spatial-geographical locations are shown in Fig. 1.
At the first stage of the study, the HDD15 ∘C values were calculated for 35 meteorological stations (Table 3) of the Agromet observing network. With the help of the ArcGIS program (ESRI, 2017) and the Kriging spatial interpolation method (Oliver and Webster, 1990), the distribution of this parameter in the investigated area was restored. New boundaries of the thermal zones were determined based on the data in Table 1 (Fig. 2b). For comparison, the old boundaries of thermal zones were determined by the boundaries of the communes of the Chilean regions and not on the basis of methods of spatial interpolation of data on HDD15 ∘C. Thus, a discrepancy exists between these and the thermal zones defined by modern meteorological data. Thus, around the cities of Temuco and Valdivia, the thermal zone 5 was replaced by zone 4. The southern shift of thermal zone 4 is due to climate changes that were also discovered in the southern shift of the Mediterranean-type climate (Kottek et al., 2006) in the area studied by Sarricolea et al. (2016). In the central Los Rios region and the northeastern Araucania region, the thermal zones instead shifted to colder climate.
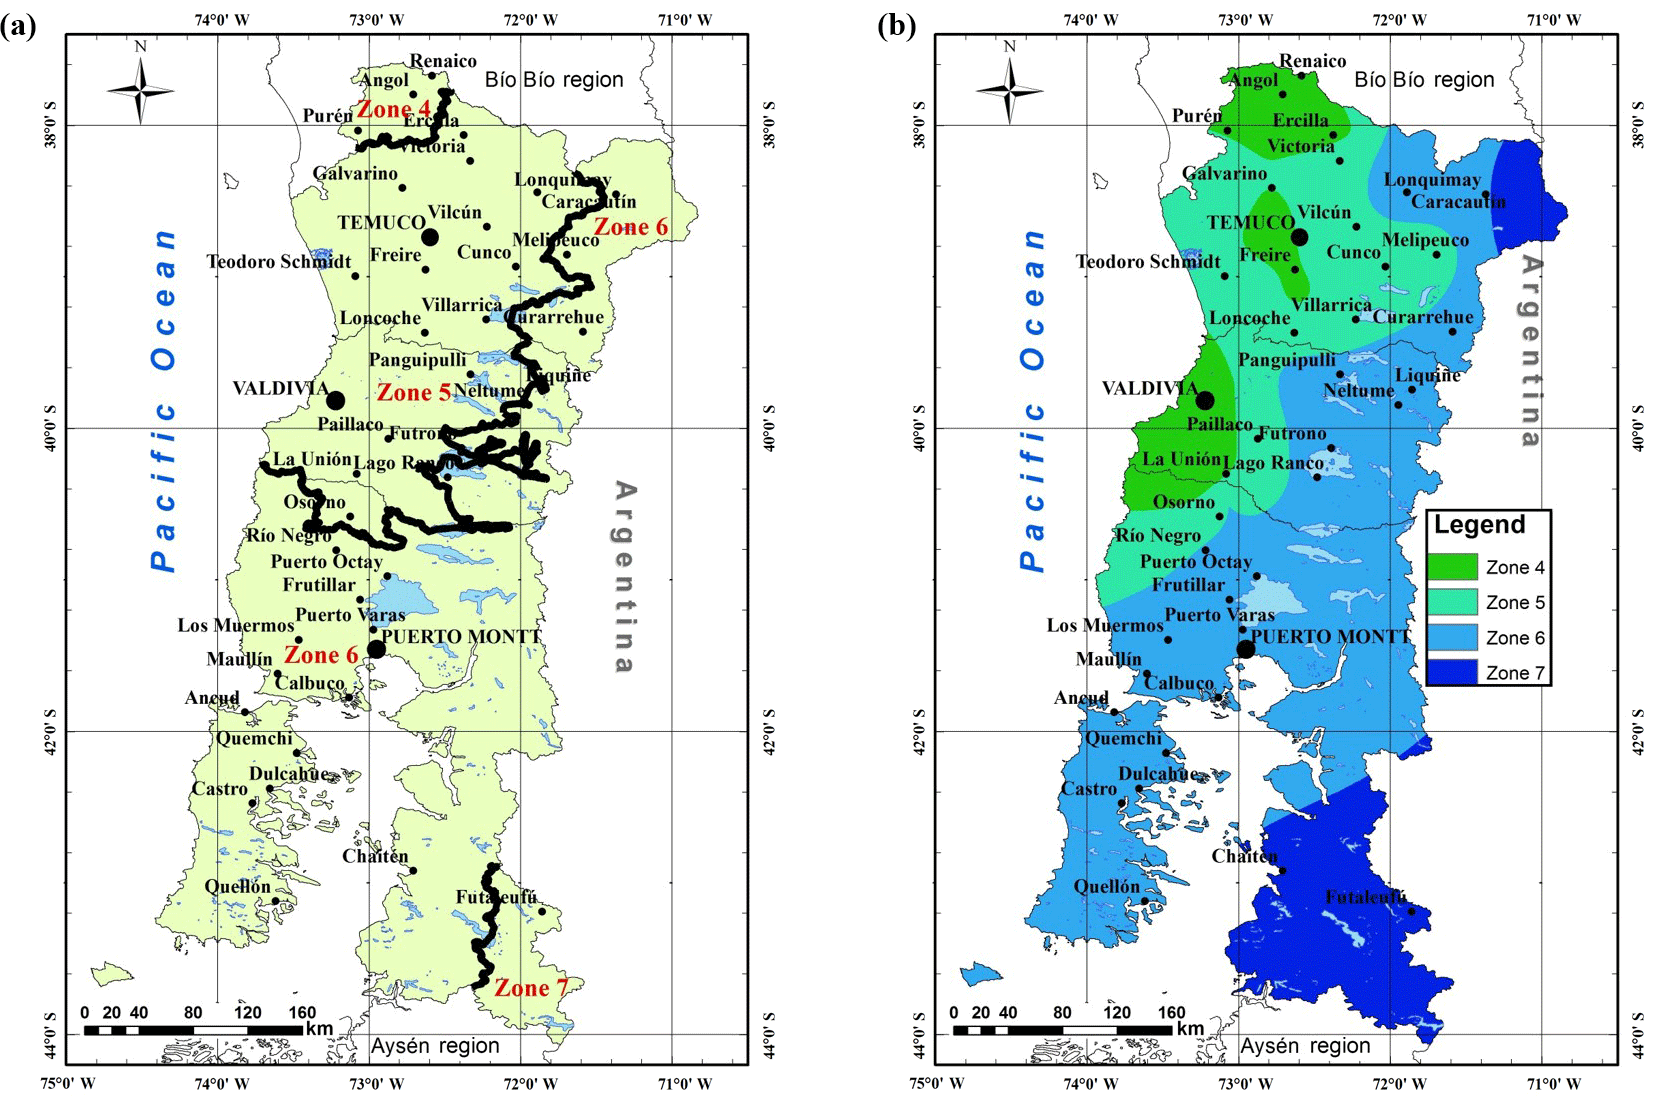

Figure 3Boxplot of the average monthly maximum and minimum temperatures over the last 30 years by the NCEP/NCAR reanalysis data and the total solar radiation by the climatological data of study area in Chile and continental part of Spain.
Table 3Calculated values of HDD15 ∘C (σ calculated for three or more annual averages), WCSI and SCSI for meteorological stations (95 % CI calculated for five or more annual averages) (No. of station according to Fig. 1).
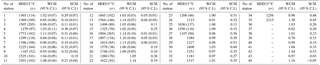
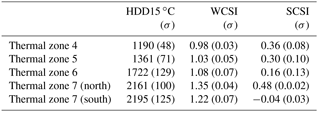
Table 4Average values of HDD, WCSI and CSCI for thermal zones of Chile of the study area.
In the central part of the Los Rios region, the houses previously constructed in zone 5 are now in zone 6, resulting in large energy costs to maintain a comfortable indoor temperature. In the case of changing zone 5 to zone 4 the energy of heating of dwellings can be reduced; further, the costs of insulation materials of future houses will be reduced.
Therefore, it is important to update the climatological information regularly, because this influences costs of construction.
In the second phase of the study, to justify the adequacy of the use of Eqs. (3) and (4) for calculation WCSI and SCSI in the climatic conditions of Chile, we analyzed the climatic data of solar radiation in summer and winter in Chile (Ministry of Energy of Chile, 2017) and Spain (Sancho et al., 2012), as well as the climatic values of the average monthly maximum and minimum temperatures in summer and winter by the NCEP/NCAR reanalysis data (NOAA, 2018), respectively (Fig. 3). The summer period for Chile is defined between the months of December and March, and the winter period between the months of June and August. The summer period for Spain is defined between the months of June and September, and the winter period between the months of December and February. The graphs show a relatively significant degree of similarity between the thermal and radiation regimes in the study area and in Spain.
WCSI and SCSI values for all meteorological stations were calculated from temperature and actinometrical measurements. If no solar radiation data was available at a station, model data of total solar radiation was obtained from the Ministry of Energy of Chil “Explorador solar” website (Ministry of Energy of Chile, 2017).
We can see the minimum WCSI = 0.7 at station number 39, and WCSI maximum = 1.44 at station number 42 (see Table 3), which means that the identical house (from a constructive and architectural point of view) located near the station number 39 will have an energy consumption level for heating of 74 % less compared to if this house was near the station 42.
Based on the data in Table 3, and using the Kriging interpolation method, the spatial distributions of WCSI and SCSI for the studied area were recovered. On the basis of climatic zoning (Table 2) climatic zones for construction in the studied area were restored (Fig. 4). It can be seen that most of the region studied is attributed to the climatic zone D1, minor areas to the zones C1 (around major cities and the north-western oceanic coast) and E1 (in the northeast).
All calculated SCSI values were less than 0.66 (Table 3); therefore, for the energy consumption of cooling houses in summer, the entire studied area is referred to the summer climatic zone number 1. Winter climatic zone D corresponds to the energy consumption level of buildings for winter heating in the city of Madrid.
The definition of the Spanish construction climatic zones will allow us to further simulate energy consumption by houses according to the norms and recommendations that the Spanish government developed. And to make a comparison with the use of houses, which will be obtained when simulating the construction norms of the Chilean government. Chilean building codes emphasize energy efficiency for heating in winter, while Spanish building codes target both winter and summer
At the last stage of the study, we considered the relationship between the two methods of climatic zoning for construction. The boundaries of the thermal zones (Fig. 2 on the right) and the spatial grid of 0. (latitude × longitude) were taken as the basis of the analysis and the values of the HDD15 ∘C, WCSI and SCSI parameters were restored for each grid unit. The total values of the average parameters for each thermal zone are presented in Table 4. The discrepancy was determined in zone 7, which is represented by two sections – northern and southern (Fig. 2b). The northern section in the region has an average value of SCSI = 0.49 (0.02) and the southern section has the value SCSI = −0.04 (0.03), which indicates that the difference between the energy consumption for cooling identical building in summer can reach 50 % within the same thermal zone.
Negative values of SCSI indicate that with a high probability in this part of the study area there will be no cost for cooling the houses during the summer period to a comfortable temperature of 20 ∘C.
We can see that for the study area the difference in energy consumption is equal to the identical building located in the northern part of the thermal Zone 7 will be 37 % more than if this building was located in zone 4.
In the work (Martín-Consuegra et al., 2016), the authors note that in Madrid (WCSI = 1.0), which is located in the winter climatic zone D, a single-family house built according to modern standards (Government of Spain, 2006) has costs for heating 64.4 kWh m−2 yr−1, while the old houses built before 1979, have an average level of consumption for heating 130–150 kWh m−2 yr−1.
In another work (Bustamante, 2009), the author notes that in the city of Temuco (WCSI = 0.99, zone D), a similar single-family house consumes 131 kWh m−2 yr−1 for heating, with this house built according to building codes and recommendations of the Government of Chile (Ministry of Housing and Urban Planning of Chile, 2009) for the thermal zone in which the city is located.
In work (Martín-Consuegra et al., 2016), the average energy costs for cooling a single-family house built before 1979 in Madrid are estimated at 26.5 kWh m−2 yr−1, hence a similar house in the climatic conditions of the research area in Chile will have a power consumption for cooling between 0 and 13 kWh m−2 yr−1 in the places where SCSI = 0.48.
The application of more stringent building codes and recommendations will help reduce energy costs in the first place for heating houses in the study area, but this should be further verified by modeling energy consumption and natural experiments.
With the use of meteorological stations data, the boundaries of thermal zones in the three southern regions of Chile have been updated. Over the past decade, importantly noted is the tendency of shifting the warmer zones to the south, as compared to the old borders of 1999, is noted. For example, the area of thermal zone 4 increased by 2.5 times and shifted by about 2.5∘ latitude to the south.
The application of the Climatic Severity Index method allowed us to obtain an estimate of the relative energy consumption of houses in thermal zones. The presence of significant differences in the theoretical estimation of the energy consumption of buildings for cooling in summer within the limits of one thermal zone raises the question of the adequacy of the use only of hating degree-days method for thermal zoning in the construction of Chile.
Boundaries of thermal zones should be revised and evaluated with modeling of energy consumption of buildings in future studies in others parts of Chile.
Data are available through email request to the corresponding author.
The authors declare that they have no conflict of interest.
This article is part of the special issue “17th EMS Annual Meeting: European Conference for Applied Meteorology and Climatology 2017”. It is a result of the EMS Annual Meeting: European Conference for Applied Meteorology and Climatology 2017, Dublin, Ireland, 4–8 September 2017.
This work was funded by the following research project: CONICYT FONDECYT
11160524.
Edited by: Lucien Wald
Reviewed by: three anonymous referees
Bustamante, W.: Guia de Diseño para la Eficiencia Energética en la Vivienda Social, edited by Ministerio de Vivienda y Urbanismo, Pontificia Universidad Católica de Chile, Santiago, Chile, 203 pp., available at: http://www.minvu.cl/incjs/download.aspx?glb_cod_nodo=20070402125030&hdd_nom_archivo=Guía de dise~no para la Eficiencia Energética en la vivienda social.pdf (last access: 14 April 2018), 2009.
Bustamante, W., Cepeda, R., Martínez, P. and Santa María, H.: Eficiencia energética en vivienda social: un desafío posible, in: Camino al Bicentenario – Propuestas para Chile, Pontificia Universidad Católica de Chile, 253–282, ISBN 978-956-14-1035-0, 2009.
Carpio, M., Garcia-Maraver, A., Ruiz, D. P., Martinez, A., and Zamorano, M.: Energy rating for green buildings in Europe, WIT Trans. Ecol. Environ., 190 381–394, https://doi.org/10.2495/EQ140371, 2014.
Carpio, M., Jódar, J., Rodíguez, M. L., and Zamorano, M.: A proposed method based on approximation and interpolation for determining climatic zones and its effect on energy demand and CO2 emissions from buildings, Energ. Buildings, 87, 253–264, 2015.
de la Flor, F. J. S., Lissén, J. M. S., and Domínguez, S. Á.: A new methodology towards determining building performance under modified outdoor conditions, Build. Environ., 41, 1231–1238, https://doi.org/10.1016/j.buildenv.2005.05.035, 2006.
ESRI: ArcGIS, available at: http://www.esri.com/arcgis/about-arcgis, last access: 18 April 2017.
Government of Spain: Código Técnico de la Edificación (CTE), Ministerio de la Vivienda, Government of Spain, Real Decreto 314/2006 de 17 de marzo, BOE 74 (2006), 11816–11831, 2006.
Hernández, Y. and Arroyo, R.: Estudio de episodios de altas concentraciones de MP10 en Temuco y configuraciones sinópticas asociadas, Strat. Rev. la Dir. Meteorológica Chile, 24, 1–24, 2014.
IPCC: Climate Change 2013: The Physical Science Basis. Contribution of Working Group I to the Fifth Assessment Report of the Intergovernmental Panel on Climate Change, Cambridge University Press, UK and New York, NY, USA, 2013.
Kottek, M., Grieser, J., Beck, C., Rudolf, B., and Rubel, F.: World map of the Köppen-Geiger climate classification updated, Meteorol. Z., 15, 259–263, https://doi.org/10.1127/0941-2948/2006/0130, 2006.
Makhmalbaf, A., Srivastava, V., and Wang, N.: Simulation-based weather normalization approach to study the impact of weather on energy use of buildings in the U.S, 13th Conference of international building performance simulation association 2013, 1436–1444, available at: http://www.ibpsa.org/proceedings/BS2013/p_2453.pdf (last access: 23 April 2018), 2013.
Markus, T. A.: Development of a cold climate severity index, Energ. Buildings, 4, 277–283, https://doi.org/10.1016/0378-7788(82)90057-3, 1982.
Martín-Consuegra, F., Aja, A. H., José, I. O. S., and Alonso, C.: Energy needs and vulnerability estimation at an urban scale for residential neighbourhoods heating in Madrid (Spain), Proc. PLEA 2016 Los Angeles – 32th Int. Conf. Passiv. Low Energy Archit. Cities, Build. People Towar. Regen. Environ., 3, 1413–1418, available at: http://oa.upm.es/44264/ (last access: 14 April 2018), 2016.
Ministry of Energy of Chile: Explorador de Energía Solar para Autoconsumo. Ministerio de Energía, Gobierno de Chile, Facultad de Ciencias Físicas y matemáticas Universidad de Chile, available at: http://walker.dgf.uchile.cl/Explorador/Solar3/, last access: 18 April 2017.
Ministry of Housing and Urban Planning of Chile: Manual de Aplicación, Reglamentación Térmica, Ordenanza General de Urbanismo y Construcciones (art. 4.1.10), par. I-IV, Ministerio de Vivienda y Urbanismo de Chile, 2006.
Ministry of Housing and Urban Planning of Chile: Ordenanza general de urbanismo y construcciones, Ministerio de Vivienda y Urbanismo de Chile, Decreto Supremo 47 de 1992, 2009.
Ministry of the Environment of Chile: Planes de Descontaminacion Atmosferica, 34, available at: http://portal.mma.gob.cl/wp-content/uploads/2014/08/articles-56174_Plan_Descont_Atmosferica_2014_2018.pdf (last access: 14 April 2018), 2014.
NOAA: National Oceanic & Atmospheric Administration NCEP/NCAR Reanalysis, available at: https://www.esrl.noaa.gov/psd/data/gridded/data.ncep.reanalysis.html, last access: 5 February 2018.
Oliver, M. A. and Webster, R.: Kriging: a method of interpolation for geographical information systems, Int. J. Geogr. Inf. Syst., 4, 313–332, https://doi.org/10.1080/02693799008941549, 1990.
Ossio, F., Veas, L., and De Herde, A.: Constructive Standards for Adapted Thermal Performance of Educational Buildings in Chile, PLEA2012 – 28th Conf. Oppor. Limits Needs Towar. an Environ. responsible Archit., 2012.
Owen, M. S. (Ed.): ASHRAE Handbook – Fundamentals, ASHRAE, 2013.
Sancho, J., Riesco, J., and Jiménez, C.: Atlas de Radiación Solar en España utilizando datos del SAF de Clima de EUMETSAT, Minist. Agric., 162 available at: https://www.aemet.es/documentos/es/serviciosclimaticos/datosclimatologicos/atlas_radiacion_solar/atlas_de_radiacion_24042012.pdf (last access: 14 April 2018), 2012.
Sarricolea, P., Herrera-Ossandon, M., and Meseguer-Ruiz, Ó.: Climatic regionalisation of continental Chile, J. Maps, 5647, 1–8, https://doi.org/10.1080/17445647.2016.1259592, 2016.