 | 28 Oct 2020
Changes in satellite-based cloud parameters in the Baltic Sea region during spring and summer (1982–2015)
Margit Aun
The satellite-based cloud climate data record CLARA-A2 has been used to analyse regional average time-series and regional maps of trends in the Baltic Sea region, 1982–2015. The investigated cloud parameters were total fractional cloud cover and cloud top height. Cloud observations from the Tartu-Tõravere meteorological station were used as reference data for the same period. Fractional cloud cover from CLARA-A2 was in a good agreement with in situ data regarding the maxima and minima years and a downward trend in March over the 1982–2015 period. In June the fractional cloud cover interannual variability was very high and no clear trend was seen. For cloud top heights summer and spring regional averages showed opposite signs of the trend: for June positive and for March negative. Winter and autumn seasons have been left out of analysis due to too large uncertainties in cloud products over latitudes higher than 60∘.
- Article
(808 KB) - Full-text XML
- BibTeX
- EndNote


For the Baltic Sea region, two climate change assessment reports that draw on peer-reviewed scientific papers have been compiled (The BACC Author Team, 2008; The BACC II Author Team, 2015). The general conclusion of ongoing warming that will continue throughout the 21st century has been reached (The BACC Author Team, 2008). In the past century, there has been an increase in temperature of more than 0.7 K in the region, which is larger than the global average temperature increase of 0.5 K.
For other climate variables, the changes are not so univocal: cloudiness and solar radiation at the surface have had remarkable inter-annual and inter-decadal variations and no clear tendencies over the Baltic Sea region. A decrease in cloud cover and an increase in sunshine duration are observed in the south while opposite trends are revealed in the north (The BACC II Author Team, 2015). Similarly, to average European tendencies in the 1990s, all these trends switched signs in northern Europe (Russak, 2009; Stjern et al., 2009; Parding et al., 2014). The reversing of the decreasing trend in atmospheric transparency and direct radiation in the 1990s is generally attributed to air quality improvement due to less aerosol emissions (e.g. Ohvril et al., 2009), but Stjern et al. (2009) and Parding et al. (2014) stress the role of clouds and the atmospheric circulation to surface solar radiation. Pfeifroth et al. (2018a) also refer to the importance of cloud parameters' changes as a reason for increasing surface solar radiation in Europe.
All aforementioned assessments of trends and variability of cloud cover in the Baltic Sea region rely almost entirely on total cloud cover as measured by eye-observations at synoptic stations (The BACC Author Team, 2008; The BACC II Author Team, 2015). The number of cloud observations in SYNOP stations is diminishing, meaning other data sources are needed for climate studies. In recent years with the increasing length of satellite data, a series of climate data records (CDR) have been made available. Several of them include data about cloud parameters, that are considered to have quality permitting climate monitoring (Karlsson and Devasthale, 2018). This enables analysis of the variability of the regional distribution of solar radiation and cloud parameters in northern Europe, over the area what is often left out from the papers about general trends in Europe. The last is done due to limitations in the quality and availability of solar radiation data over higher than 60∘ N latitudes (Pfeifroth et al., 2018a, 2018b). Nevertheless, Riihelä et al. (2015) has carried out a validation of satellite-based data sets over Finland and Sweden and found that satellite-based surface solar radiation indicates the same positive overall trend as in situ measurements between the 1980s and 2010s. We will go further from radiation to cloud parameters.
We have selected March and June, the two months, when strong trends in cloud amounts have been detected (Keevallik and Russak, 2001; Russak, 2009; Stjern, 2009). In these months the amount of low clouds showed clear upward trends in 1955–2007 (Russak, 2009). We avoid computing trends of seasonal averages as the value and sign of trends vary strongly from month to month within a season (Keevallik and Russak, 2001). The reliability of the satellite cloud cover trends is assessed by comparing them with Tartu-Tõravere (Estonia) meteorological station's monthly data.
The main aim of this paper is to give an overview of the regional variability and trends in cloud cover and cloud top height in March and June during the years 1982–2015 in the Baltic Sea region/Northern Europe. The added value of the study is framing the analysis of the territorial distributions of cloudiness from satellites with earlier in situ studies over northern Europe.
2.1 Region and site description
The area under investigation covers the Baltic Sea region from 52 to 70∘ N and 5 to 32∘ E (Fig. 1). For comparison of satellite data to ground observations, Tõravere meteorological station in Estonia (58∘16′ N 26∘28 E), belonging to Baseline Surface Radiation Network (BSNR), is chosen (Fig. 1). It is also a station where a study of long-term changes in cloudiness (Russak, 2009) and atmospheric transparency (Ohvril et al., 2009) have been carried out and is, therefore, one of the influencers for the current work. It is also one of the three northern stations included in the European analysis of solar radiation from satellites by Pfeifroth (2018b).
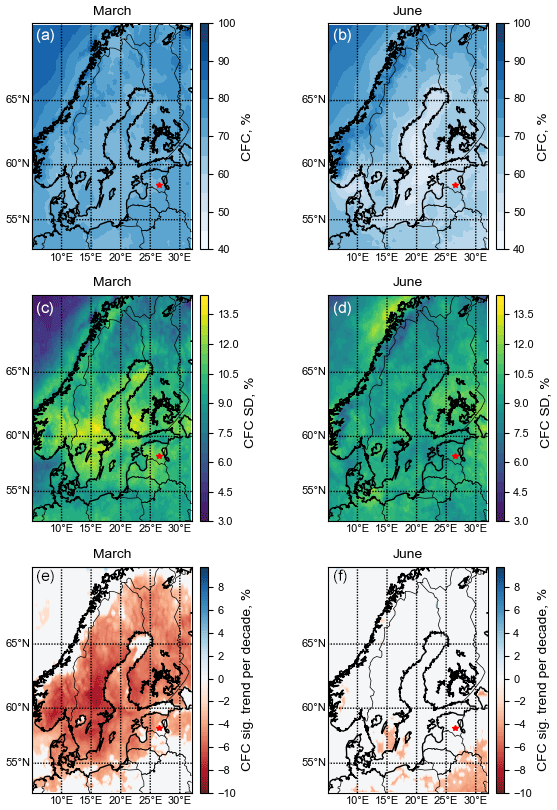
Figure 1Monthly mean CFC 1982–2015 (a, b), standard deviation of CFC 1982–2015 (c, d) and its significant trends from 1982 to 2015 (e, f) for March (a, c, e) and June (b, d, f). Based on CLARA-A2 climate data record. The location of Tõravere station is marked with a red star.
Ground observations in the Tõravere meteorological station are made every 3 h. Total cloud cover is estimated in tenths. For comparison with satellite data daily and monthly averages for March and June were calculated.
2.2 Satellite data
The data used in this study is from the European Organisation for the Exploitation of Meteorological Satellites (EUMETSAT) Satellite Application Facility on Climate Monitoring (CM SAF, http://www.cmsaf.eu, last access: 16 May 2020). As the cloud products from geostationary satellites do not cover a large portion of the selected region, the use of data from polar-orbiting satellites is needed. The focus is on data from CM SAF of CLoud, Albedo, and Radiation data record, edition 2 (CLARA-A2) (Karlsson et al., 2017a). CLARA-A2 covers a period of 34 years, from 1982 to 2015. Data from Advanced Very High Resolution Radiometer (AVHRR) onboard polar-orbiting NOAA and EUMETSAT MetOp satellites have been used for creating the data record. Until 1992 only one satellite was measuring at a time, since then at least two satellites have been available.
For studying changes in the cloud parameters, cloud fraction cover (CFC), and cloud top height (CTH) products were chosen. CFC is defined as the fraction of cloudy pixels per grid square compared to the total number of analysed pixels in the grid square (percentage points, which is simply %). CTH is the altitude of cloud tops over ground topography in meters (CM SAF, 2017).
CLARA-A2 cloud CDR quality was evaluated in depth by Karlsson and Hakansson (2018) and intercompared with the other three long-term satellite-derived cloud CDRs by Karlsson and Devasthale (2018). The latter states that over the northern mid-latitudes all four CDRs agree well in CFC with the Cloud-Aerosol Lidar and Infrared Pathfinder Satellite Observations (CALIPSO) reference dataset, for CTH the results are more diverged. For CTH, the bias of −840 m has been shown by validation studies, but at the same time, large underestimations have been found for thin clouds and overestimation for boundary level clouds (CM SAF, 2017). Nevertheless, trends in the cloud heights are similar to the other data sets (Karlsson and Devasthale, 2018). According to the validation report, CLARA-A2 CFC is on average 3 % lower than CFC from surface synoptic observations (SYNOP) and the Cloud-Aerosol LIDAR with Orthogonal Polarization (CALIOP) and the precision of monthly CFC is 7 % compared to SYNOP (Bojanowski et al., 2018).
The area under study reaches up to 70∘ N, where from November to February little or no surface solar radiation is available, and surfaces may be covered by snow and ice for most of the year. Sometimes, mainly over subpolar regions in winter, the AVHRR channels used for collecting the data are insufficient to distinguish between the albedo of bright surfaces and clouds, as well as between the temperature of snow-covered surfaces and clouds. This quality reduction affects both parameters we use.
2.3 Methods
For the analysis, data was taken from CM SAF in a 0.25∘ latitude-longitude grid and monthly CFC and CTH data for March and June were used. For both selected products, averages over the region for March and June were found for each year from 1982 to 2015 along with standard deviation (SD). Also, the temporal average and SD (1982–2015) for each grid point for both months were calculated. Trends in CFC and CTH were found from the anomalies of monthly values of 1982 to 2015 based on a simple linear model using CM SAF R Toolbox (Kothe et al., 2019). The significance was determined at a 95 % confidence level.
3.1 CFC general statistics
Average CFC for the selected region was 72.6 % (SD 4.8 %) in March and 64.2 % (SD 8.6 %) in June, 1982–2015. In the majority of years (30 out of 34), the regional average was higher in March compared to June, on average by 8.4 % (Fig. 2). In 1992, the CFC was estimated extremely low in June – 44.7 %. For single grid points in March, the maximal average CFC over the period was 91.5 % and the minimal – 64.0 %. Higher averages occurred over the Norwegian Sea and North-East of the region, lower values were found over and around the Baltic Sea (Fig. 1). For June, the maximal average was 90.8 % and the minimal – 46.6 %. In June, the regional CFC distribution was very similar to March: higher over the Norwegian Sea and the mountain ranges in Norway and lower over the Baltic Sea. But this time a strong contrast in cloudiness between the sea and coasts was pronounced (Fig. 1). For both months, the highest interannual variability was in the middle of the region over the coastal areas of Sweden and Finland, in March also the area of Bothnian Bay stood out. These were mostly the areas where lower average CFC values were found (Fig. 1).
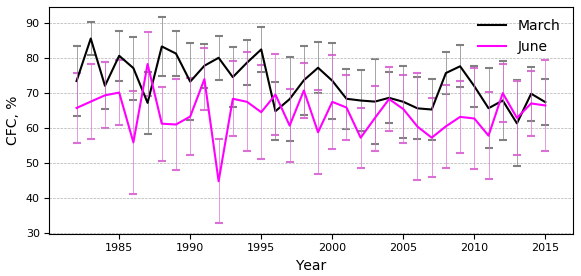
Figure 2Monthly average CFC over the entire region 1982 to 2015 for March (black) and June (magenta) from CLARA-A2 with SDs.
3.2 Changes in CFC
Regionally averaged monthly CFC values had a general decline in March, while there was no clear trend in June (Fig. 2). In March, there has been a significant decrease in fractional cloud cover in most of the Baltic Sea region since 1982 (Fig. 1). An increase was present only over the Norwegian Sea (not significant and therefore not seen from the figure). In June, a slight increase in cloud cover has been found over the Bothnian Sea, the Gulf of Finland as well as over the Norwegian Sea, but all these trends were insignificant. Only over some southern parts of the region, significant positive trends have been detected in June.
3.3 Comparison of satellite and in situ CFC data in March
To proceed with the earlier study of Russak (2009), we compared the observations from Tõravere station with cloud fraction data from CLARA-A2, but also CM SAF CLoud property dAtAset using SEVIRI – Edition 2 (CLAAS-2), and ClOud Fractional Cover dataset from METeosat First and Second Generation (COMET) (Fig. 3). The last two sets are based on geostationary METEOSAT satellites. We used the grid point from the satellite dataset in which the station was located. All four data sets showed similar years of maxima and minima, but the SYNOP data showed somewhat higher CFC values compared to CLARA-2. The average values for the period were 73 % and 70 %, respectively. It is the same 3 % deviation as in the CLARA-A2 validation report (CM SAF, 2017). The trend of decreasing cloudiness for CLARA-A2 was stronger (−3 % per decade) than from ground observations (−1 % per decade). Both trends were insignificant and there was a very high inter-annual variability. The actual value of the trend strongly depends on the endpoints of the period analysed. Our results from satellite data confirmed the results by Russak (2009), that around 1990 the CFC values started to decrease in Estonia, and the trend has lasted until the end of the study period.
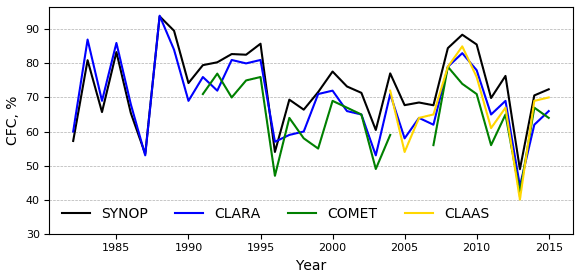
Figure 3Comparison of monthly cloud fractions from Tõravere SYNOP station with satellite CFC of CLARA-A2, CLAAS-2, COMET in March 1982–2015 (or for the period available).
3.4 CTH
The same statistics as for CFC were calculated for cloud top heights. The monthly average CTH over the region was higher in June than in March for most of the years, as expected due to higher temperatures in summer (Fig. 4). Exceptions were found in 1990, 1992, 2014, and 2015. The average CTH over the region and period was 3812 m in March and 4343 m in June. But the inter-annual variability in CTH was higher for March (SD 461 m) compared to June (SD 288 m). Overall, in both months, the clouds over the sea were higher than over the coastal areas (Fig. 5). In summer the difference in cloud heights between northern and southern parts was also seen. Over the Scandinavian mountains, the clouds tended to be closer to the surface than over other regions. The inter-annual variability of CTH presented by the SD plots showed high values over the northern Baltic Sea in March, in June the highest variability was over the southeastern part of the area. The trend analysis gave almost no significant trends in the region; therefore, this figure was not included in the paper. Interestingly, for the shorter period of 2004-2015, the trend was positive in March and negative in June.
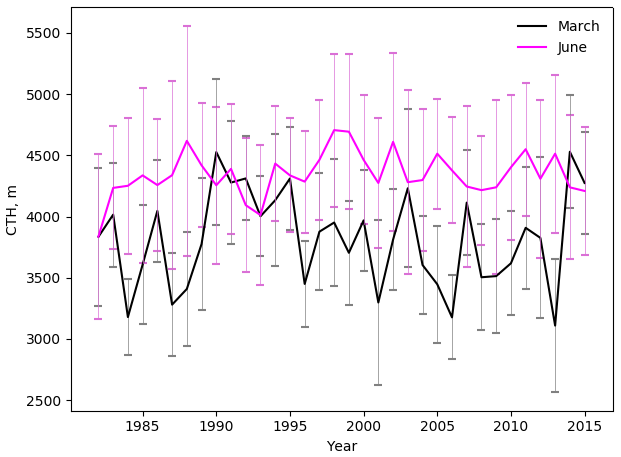
Figure 4Monthly average CTH over the entire region 1982 to 2015 for March (black) and June (magenta) from CLARA-A2 with SDs.
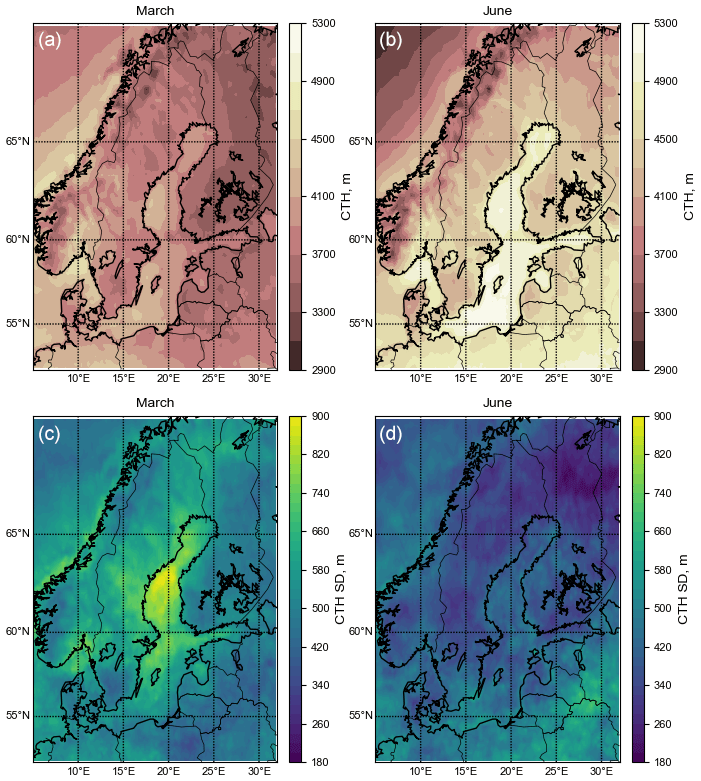
Figure 5Monthly mean CTH 1982–2015 (a, b) and standard deviation of CTH 1982–2015 (c, d) for March (a, c) and June (b, d). Based on CLARA-A2 climate data record.
The availability of climate data records by EUMETSAT, ESA, and NASA enables the study of regional trends in European cloud parameters. From the global or European view, there is a decreasing trend in annual cloud cover from 1982 to 2015. The strength of the calculated trend varies, depending on the CDR used (Karlsson and Devasthale, 2018). Most of this decrease emanates from mid-latitude regions to where our study area also mostly belongs. We found that northern Europe was one of the areas where mostly a strong decrease in cloud cover had taken place in 1982–2015. This has been found also in earlier studies, but only partly, as the very general European studies from satellite data avoid higher latitudes than 60∘ N (Pfeifroth et al., 2018a, b) or rely just on in situ observations (Russak, 2009; Chiacchio and Wild, 2010; Stjern et al., 2014; Parding et al., 2014). Including higher latitudes constrains studying of the cloud products in autumn and winter as in the northern parts of the region the quality is considered low then and needs improvements in further versions of CDR (Karlsson and Hakansson, 2018). Earlier studies (Pfeifroth et al., 2018b) have also left out the years up to 1992, as only one satellite was measuring then. We decided to take the entire available period for CLARA-A2 as the latter limitation influences mostly southern areas.
We found that in 1982–2015 over a very large part of the Baltic Sea region cloud fraction had decreased in March. Lower monthly cloud amounts may come from either fewer clouds on average in each day or more days are clear or nearly clear. We know from Russak (2009) that in March the amount of low clouds is determined by large-scale drivers whereas the in situ cloud amounts in Estonian stations are highly correlated then. This kind of large-scale driver may be associated with large scale atmospheric circulation. Chiacchio and Wild (2010) have found several significant correlations between the cloud amount of some types (Cu, Cb, and St) in stations and the North Atlantic Oscillation (NAO) index. Nevertheless, our first simple calculations for correlating March CFC with the monthly NAO index did not result in significant correlations. As the cloudiness decrease could be associated with more frequent clear weather, then the parameter that shows directly anticyclonic circulation would be preferred. The hypothesis is that due to the earlier beginning of springs, atmospheric circulation is shifted towards more anticyclonic patterns already during March.
Only a few studies are available about changes in cloud heights either from in situ (Parding et al., 2014) or satellite observations (Karlsson and Devasthale, 2018). The global annual trend is lowering in heights, but the European has a rather slight increase (Karlsson and Devasthale, 2018). Parding et al. (2014) find also an increase in annual cloud base height for Bergen in Norway during the atmospheric brightening period. For the whole study region, we got opposite short-term tendencies in spring and summer: CTH increased in March and decreased in June. At the same time, the time series was highly variable in March. Whether the regional average values for some years, when the clouds were higher in March than in June (1990, 1992, 2014, and 2015) are realistic, is difficult to decide while no comparison data are available. It is reasonable to compare the satellite CTH-s with cloud heights from some reanalysis, to get a better understanding of interannual variability. While June is the month when the local conditions play the largest role in low cloud generation (Russak, 2009), then analysing the time series of some convection index might help to explain the interannual variability in this month.
As CTH product highly depends on the numerical model from where the atmospheric profiles are received, then the uncertainty here is remarkably higher than for CFC. Satellite data miss some high semitransparent clouds; therefore, the CTH-s is probably lower than in reality in months when there is more often Cirrus.
The most prominent feature from June's plots was the strong contrasts in CTH as well as in CFC along the coastlines of the Baltic Sea. There were fewer clouds and they were higher over the sea compared to the land surfaces. Fewer clouds over the sea could be explained with the orographic rise of air over the land that initiates more clouds. This effect often occurs in early summer, when the boundary layer is thicker over the land compared to the sea. But to explain why the clouds are higher over the sea compared to land is difficult. To study whether this difference in level is real, radiation data measured over the sea are needed. Riihelä et al. (2015) find the same jump in surface solar radiation in CLARA-A1 and claim this to be a real phenomenon. Nevertheless, this issue needs further research.
In conclusion, we may say that our results give a detailed overview of the regional and seasonal trends in cloud cover and cloud top height in the Baltic Sea area. To our knowledge, this study offers the first detailed insight into the cloud top height distributions in this region. With further improvements in the cloud products from satellites also in the polar winter regions, the regional distributions may be calculated for autumn and winter months. With this study, we have addressed follow-up studies about the reasons for high interannual variability in cloud amounts and heights, possible connections to atmospheric circulation, and the underlying surface.
All analysed EUMETSAT CM SAF climate data records are freely accessible through the CM SAF Web User Interface (https://wui.cmsaf.eu, last access: 16 May 2020) and DOI reference: CLARA-A2 data: doi:10.5676/EUM_SAF_CM/CLARA_AVHRR/V002 (Karlsson et al., 2017b), CLAAS-2 data doi:10.5676/EUM_SAF_CM/CLAAS/V002 (Finkensieper et al., 2016), COMET data 10.5676/EUM_SAF_CM/CFC_METEOSAT/V001 (Stöckli et al., 2017). Observational data can be accessed through a request from Estonian Weather Service (http://www.ilmateenistus.ee/?lang=en, last access: 16 May 2020).
PP prepared the manuscript with major contributions from MA. PP performed the satellite and in situ data comparison analysis. MA performed the CFC and CTH analyses. Both authors contributed to the results.
The authors declare that they have no conflict of interest.
This article is part of the special issue “19th EMS Annual Meeting: European Conference for Applied Meteorology and Climatology 2019”. It is a result of the EMS Annual Meeting: European Conference for Applied Meteorology and Climatology 2019, Lyngby, Denmark, 9–13 September 2019.
We are grateful to the EUMETSAT's Satellite Application Facility on Climate Monitoring for the data and software.
This research has been supported by the Estonian Research Council (grant no. PSG202) and the the European Regional Development Fund within National Programme for Addressing Socio-Economic Challenges through R&D (grant no. RITA1/02-52-07).
This paper was edited by Monika Lakatos and reviewed by three anonymous referees.
Bojanowski, J. S., Stöckli, R., Duguay-Tetzlaff, A., Finkensieper, S., and Hollmann, R.: Performance Assessment of the COMET Cloud Fractional Cover Climatology across Meteosat Generations, Remote Sens., 10, 804, https://doi.org/10.3390/rs10050804, 2018.
Chiacchio, M. and Wild, M.: Influence of NAO and clouds on long-term seasonal variations of surface solar radiation in Europe, J. Geophys. Res., 115, D00D22, https://doi.org/10.1029/2009JD012182, 2010.
CM SAF: Product User Manual: CM SAF Cloud, Albedo, Radiation data record, AVHRR-based, Edition 2 (CLARA-A2), Cloud Products, 2017.
Finkensieper, S., Meirink, J.-F., van Zadelhoff, G.-J., Hanschmann, T., Benas, N., Stengel, M., Fuchs, P., Hollmann, R., and Werscheck, M.: CLAAS-2: CM SAF CLoud property dAtAset using SEVIRI – Edition 2, Satellite Application Facility on Climate Monitoring, https://doi.org/10.5676/EUM_SAF_CM/CLAAS/V002, 2016.
Karlsson, K.-G. and Devasthale, A.: Inter-Comparison and Evaluation of the Four Longest Satellite-Derived Cloud Climate Data Records: CLARA-A2, ESA Cloud CCI V3, ISCCP-HGM, and PATMOS-x, Remote Sens., 10, 1567, https://doi.org/10.3390/rs10101567, 2018.
Karlsson, K.-G. and Håkansson, N.: Characterization of AVHRR global cloud detection sensitivity based on CALIPSO-CALIOP cloud optical thickness information: demonstration of results based on the CM SAF CLARA-A2 climate data record, Atmos. Meas. Tech., 11, 633–649, https://doi.org/10.5194/amt-11-633-2018, 2018.
Karlsson, K.-G., Anttila, K., Trentmann, J., Stengel, M., Fokke Meirink, J., Devasthale, A., Hanschmann, T., Kothe, S., Jääskeläinen, E., Sedlar, J., Benas, N., van Zadelhoff, G.-J., Schlundt, C., Stein, D., Finkensieper, S., Håkansson, N., and Hollmann, R.: CLARA-A2: the second edition of the CM SAF cloud and radiation data record from 34 years of global AVHRR data, Atmos. Chem. Phys., 17, 5809–5828, https://doi.org/10.5194/acp-17-5809-2017, 2017a.
Karlsson, K.-G., Anttila, K., Trentmann, J., Stengel, M., Meirink, J. F., Devasthale, A., Hanschmann, T., Kothe, S., Jääskeläinen, E., Sedlar, J., Benas, N., van Zadelhoff, G.-J., Schlundt, C., Stein, D., Finkensieper, S., Håkansson, N., Hollmann, R., Fuchs, P., and Werscheck, M.: CLARA-A2: CM SAF cLoud, Albedo and surface RAdiation dataset from AVHRR data – Edition 2, Satellite Application Facility on Climate Monitoring, https://doi.org/10.5676/EUM_SAF_CM/CLARA_AVHRR/V002, 2017b.
Keevallik, S. and Russak, V.: Changes in the amount of low clouds in Estonia (1955–1995), Int. J. Climatol., 21, 389–397, https://doi.org/10.1002/joc.618, 2001.
Kothe, S., Hollmann, R., Pfeifroth, U., Träger-Chatterjee, C., and Trentmann, J.: The CM SAF R Toolbox – A Tool for the Easy Usage of Satellite-Based Climate Data in NetCDF Format, ISPRS Int. J. Geo-Inf., 8, 109, https://doi.org/10.3390/ijgi8030109, 2019.
Ohvril, H., Teral, H., Neiman, L., Kannel, M., Uustare, M., Tee, M., Russak, V., Okulov, O., Jõeveer, A., Kallis, A., Ohvril, T., Terez, E. I., Terez, G. A., Gushchin, G. K., Abakumova, G. M., Gorbarenko, E. V., Tsvetkov, A. V., and Laulainen, N.: Global dimming and brightening versus atmospheric column transparency, Europe, 1906–2007, J. Geophys. Res., 114, D00D12, https://doi.org/10.1029/2008JD010644, 2009.
Parding, K., Olseth, J. A., Dagestad, K. F., and Liepert, B. G.: Decadal variability of clouds, solar radiation and temperature at a high-latitude coastal site in Norway, Tellus B, 66, 25897, https://doi.org/10.3402/tellusb.v66.25897, 2014.
Pfeifroth, U., Bojanowski, J. S., Clerbaux, N., Manara, V., Sanchez-Lorenzo, A., Trentmann, J., Walawender, J. P., and Hollmann, R.: Satellite-based trends of solar radiation and cloud parameters in Europe, Adv. Sci. Res., 15, 31–37, https://doi.org/10.5194/asr-15-31-2018, 2018a.
Pfeifroth, U., Sanchez-Lorenzo, A., Manara, V., Trentmann, J., and Hollmann, R.: Trends and variability of surface solar radiation in Europe based on surface- and satellite-based data records, J. Geophys. Res.-Atmos., 123, 1735–1754, https://doi.org/10.1002/2017JD027418, 2018b.
Riihelä, A., Carlund, T., Trentmann, J., Müller, R., and Lindfors, A. V.: Validation of CM SAF Surface Solar Radiation Datasets over Finland and Sweden, Remote Sens., 7, 6663–6682, https://doi.org/10.3390/rs70606663, 2015.
Russak, V.: Changes in solar radiation and their influence on temperature trend in Estonia (1955–2007), J. Geophys. Res., 114, D00D01, https://doi.org/10.1029/2008JD010613, 2009.
Stjern, C. W., Kristjánsson, J. E., and Hansen, A. W.: Global dimming and global brightening—an analysis of surface radiation and cloud cover data in northern Europe, Int. J. Climatol., 29, 643–653, https://doi.org/10.1002/joc.1735, 2009.
Stöckli, R., Duguay–Tetzlaff, A., Bojanowski, J., Hollmann, R., Fuchs, P., and Werscheck, M.: CM SAF ClOud Fractional Cover dataset from METeosat First and Second Generation – Edition 1 (COMET Ed. 1), Satellite Application Facility on Climate Monitoring, https://doi.org/10.5676/EUM_SAF_CM/CFC_METEOSAT/V001, 2017.
The BACC Author Team: Assessment of climate change for the Baltic Sea basin, Springer, 474 pp., https://doi.org/10.1007/978-3-540-72786-6, 2008.
The BACC II Author Team: Second assessment of climate change for the Baltic Sea Basin, Springer, https://doi.org/10.1007/978-3-319-16006-1, 501 pp., 2015.