 | 08 Apr 2020
Behind the scenes of an interdisciplinary effort: conception, design and production of a flyer on climate change for the citizens of Hamburg
Tanja Blome
Katharina Bülow
Juliane El Zohbi
Peter Hoffmann
Juliane Petersen
Susanne Pfeifer
Diana Rechid
Daniela Jacob
The goal of an interdisciplinary team of scientists at the Climate Service Center Germany (GERICS) was to make the findings of the special report IPCC SR1.5 more accessible to the citizens of Hamburg. Therefore, a flyer was created that is understandable to non-climate scientists, visually attractive and generates interest. It contains up-to-date climate information, readily understandable texts and several graphical visualisations. The team has been working intensively on analysing and processing further the consequences of a 1.5 ∘C global warming for the Hamburg metropolitan region. While the team's natural scientists elaborated the impacts on specific climate indices, other team members focused on the visualisation and communication of the results.
- Article
(2060 KB) - Full-text XML
- BibTeX
- EndNote


Global mean surface temperatures have already warmed approximately 1 ∘C above pre-industrial levels, and climate change is becoming visible in many different variables, e.g., rising sea levels, melting glaciers, and more pronounced extreme events. In 2015, the world's states agreed in Paris to limit global warming to “well below 2 degrees Celsius above pre-industrial levels and to pursue efforts to limit the temperature increase even further to 1.5 degrees Celsius” (UNFCCC, 2019). Since then, further progress has been made to implement the Paris Agreement, however, emissions reductions are still far from being sufficient. As long as emissions are not drastically reduced, global warming will continue. Consequently, the impacts for nature and humans will increase in the coming decades.
In this context, the Intergovernmental Panel on Climate Change (IPCC) in October 2018 published a Special Report (IPCC SR1.51) that assessed, among other aspects, the expected impacts for the environment and societies at global warming levels of 1.5 and 2 ∘C, respectively (IPCC, 2018). The results comprehensively show that, regardless of the specific level of warming, inevitable changes will occur that will pose major challenges to the environment and to human societies. It is thus an important task to adapt to and prepare for unavoidable future changes of climatic variables.
The effects of climate change, for instance altered precipitation patterns or temperature extremes, differ regionally. In order to enable effective adaptation on the local level, meaningful information on climate and climate change is necessary on the respective spatial scale. There are many studies available for Germany on the observed climatic changes and the related impacts, as well as on those to be expected for the future, including more regional literature for northern Germany or for Hamburg (e.g., Meinke et al., 2018; Wiesner et al., 2018; Schlünzen et al., 2010). However, these are predominantly detailed studies with a clearly scientific character. Thus, a gap was identified, and it was felt that products that provide information related to the SR1.5 in a tangible as well as readily understandable way are missing for the Metropolitan Region of Hamburg (MRH).
The fate of the Australia's coral reefs by the end of the 21st century might be too remote and abstract for most of Hamburg's citizens. To the contrary, the effect of climate change on fruit farming in the “Altes Land”, an important agricultural area right next to Hamburg, is intuitively relevant for the reader, similar to climatic variables that many have already experienced as influencing their living quality, e.g., hot and humid conditions. Thus, the Climate Service Center Germany (GERICS), located in Hamburg, created a flyer that provides such specific information for the Metropolitan Region of Hamburg (Jacob et al., 2018a). With the aim of delivering readily understandable and useful information to citizens of the MRH, special emphasis was put into the processing of climate data into tangible variables, and on an appealing, meaningful communication. Key to achieving this aim was an interdisciplinary team of natural and social scientists, the use of state of the art climate data, and to work along the principles of effective visual communication.
To this end, the 8-page flyer “Die Metropolregion Hamburg in einer ∘C wärmeren Welt” intends to break down the comprehensive material provided by the SR1.5 and by regional climate models into concrete, useful information for a specific region, in order to support awareness building and adaptation to climate change in the Metropolitan Region of Hamburg.
Here, the methods used for preparing the flyer are presented. Beginning with the description of the interdisciplinary teamwork, followed by the specification of the guiding principles employed for the writing and visualisation processes and finally a compilation of existing knowledge of present climate in the MRH and the calculation of future climate changes based on regional climate model data.
2.1 Interdisciplinary teamwork and workflow
The team for the creation of this flyer was highly interdisciplinary, ranging from meteorology and oceanography to geography and architecture. In order to work efficiently and effectively on the project, a discussion about this collaboration's key aspects took place right in the beginning (based on Defila et al., 2006):
-
consensus, in order to specify project aims, the workflow as well as administrative topics;
-
integration, in order to clarify each team member's role and unite relevant results to one joint outcome;
-
diffusion, in order to determine appropriate communication channels to reach the target groups.
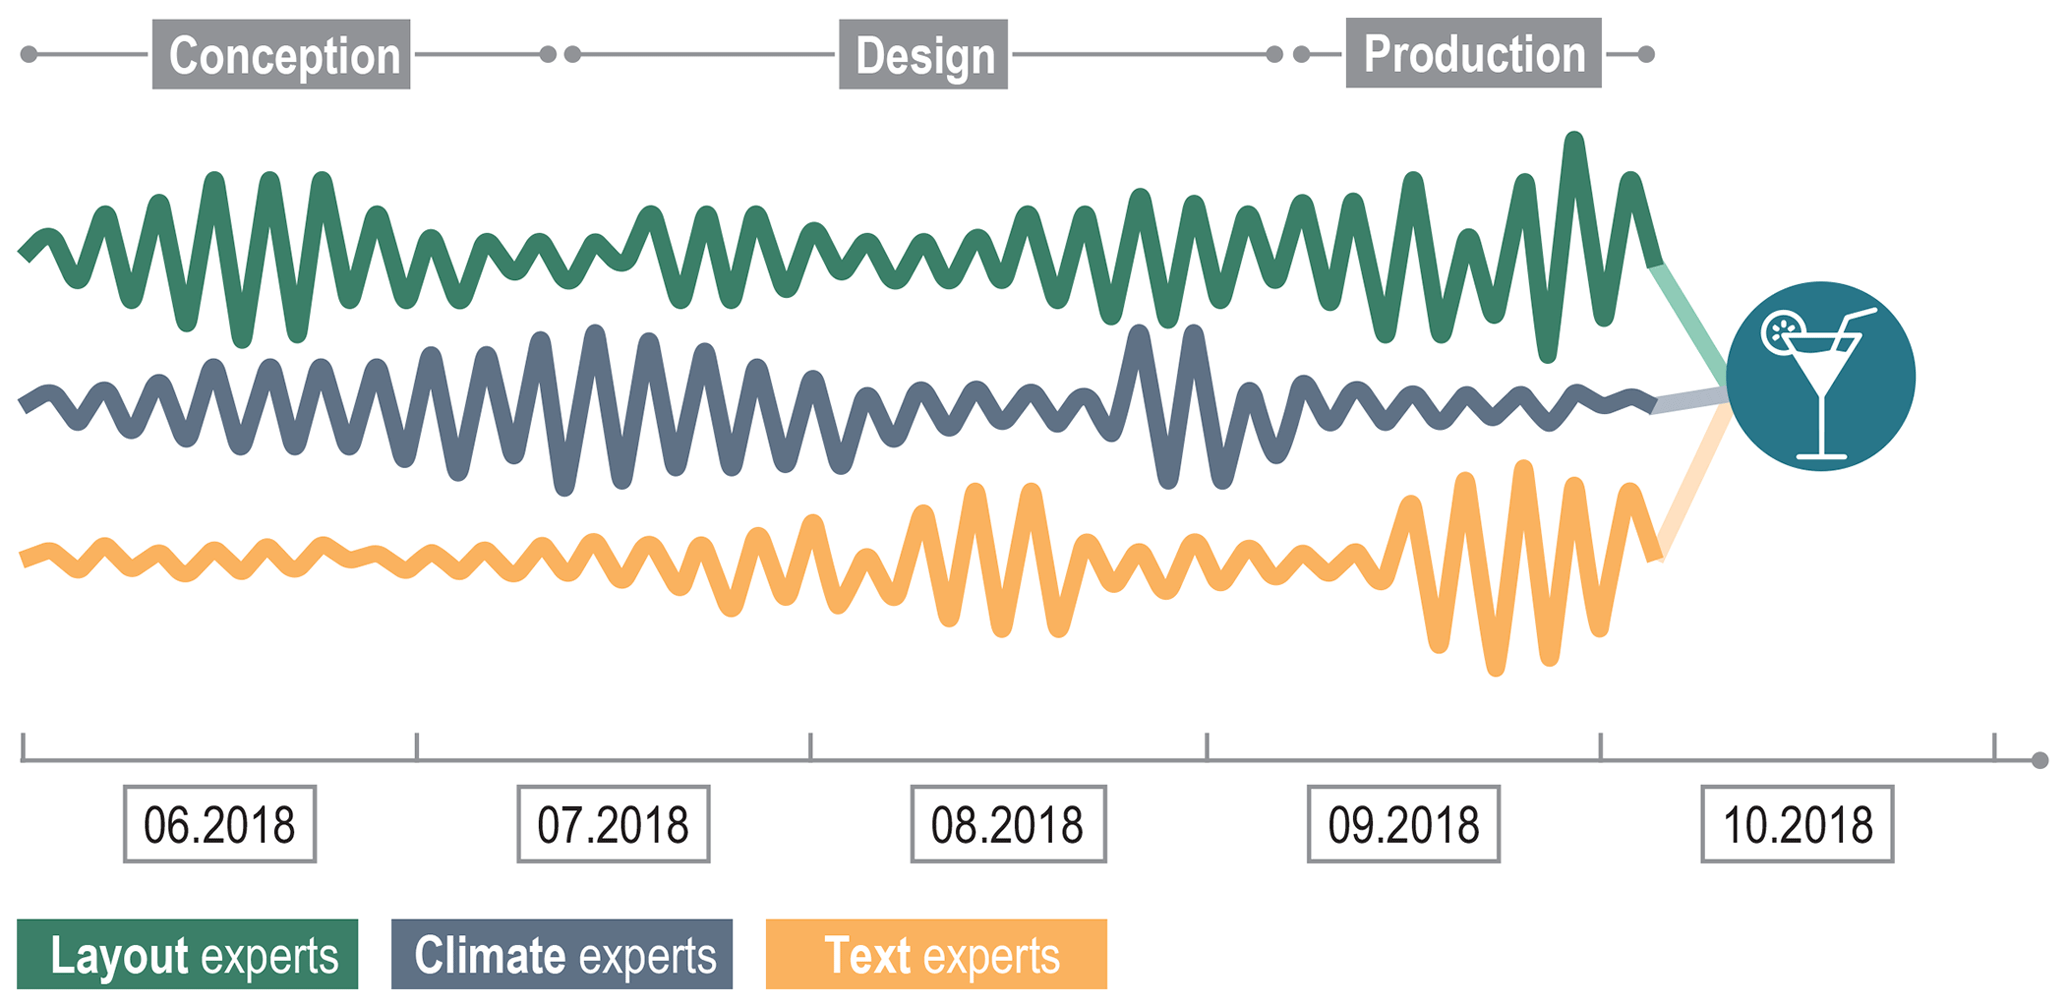
This discussion was crucial for the successful and timely development of this flyer, since the available time was limited to only a few months and marked by a non-relocatable deadline. As it is shown in Fig. 1, the team was split into three groups, each with a specific focus that corresponds with the members' expert knowledge. On the one hand, these teams worked independently in their respective areas of accountability and, thus, experienced distinct work intensities. On the other hand, the teams were in close dialogue with each other to stay informed and – very importantly – ensure that the results are gradually integrated into the flyer.
In order to assure the flyer's quality, it was reviewed multiple times by the GERICS-colleagues as well as by friends and acquaintances of the team. The feedback has been discussed and integrated regularly. After the finalisation and publication of the flyer, the team celebrated its successful teamwork and used this occasion to reflect on the workflow.
2.2 Guiding principles for communication
The overall intention for the work on the flyer was to create information material that is understandable to non-climate scientists and visually attractive. Ideally, it should generate interest at first sight and provide useful information for the citizens of Hamburg. Thus, the concept of an “authentic voice” was chosen as an overarching aim, following Corner et al. (2018) as well as Corner and Clarke (2017).
This was achieved through certain principles that guided the development of the flyer. First, it is important to relate scientific results and knowledge to the “real world”, through finding connections to what matters to a reader in her or his everyday life. For example, relating scientific results to the chosen region and experienceable time scales helps to digest rather abstract scientific findings into tangible variables that directly evoke an association. For example, in the flyer some citizens of Hamburg are depicted doing outdoor activities on a hot and humid day, which is an exhausting experience for everyone. Secondly, we tried to orient ourselves along the communicative principles of visual effectiveness and of the human perspective. These aspects include the combination of graphs, visuals, text, and numbers, and of storytelling and featuring of examples in an anecdotic style. Third, the scientific robustness was ensured by state-of-the-art data and methods, transparency, and traceability. The communication of the scientific consensus, however, was intensively discussed within the team. In order to find a balance between scientific precision and common comprehensibility, several external people reviewed the proposed formats and, hence, considerably supported the clear communication of the indices' robustness.
2.3 Climate data
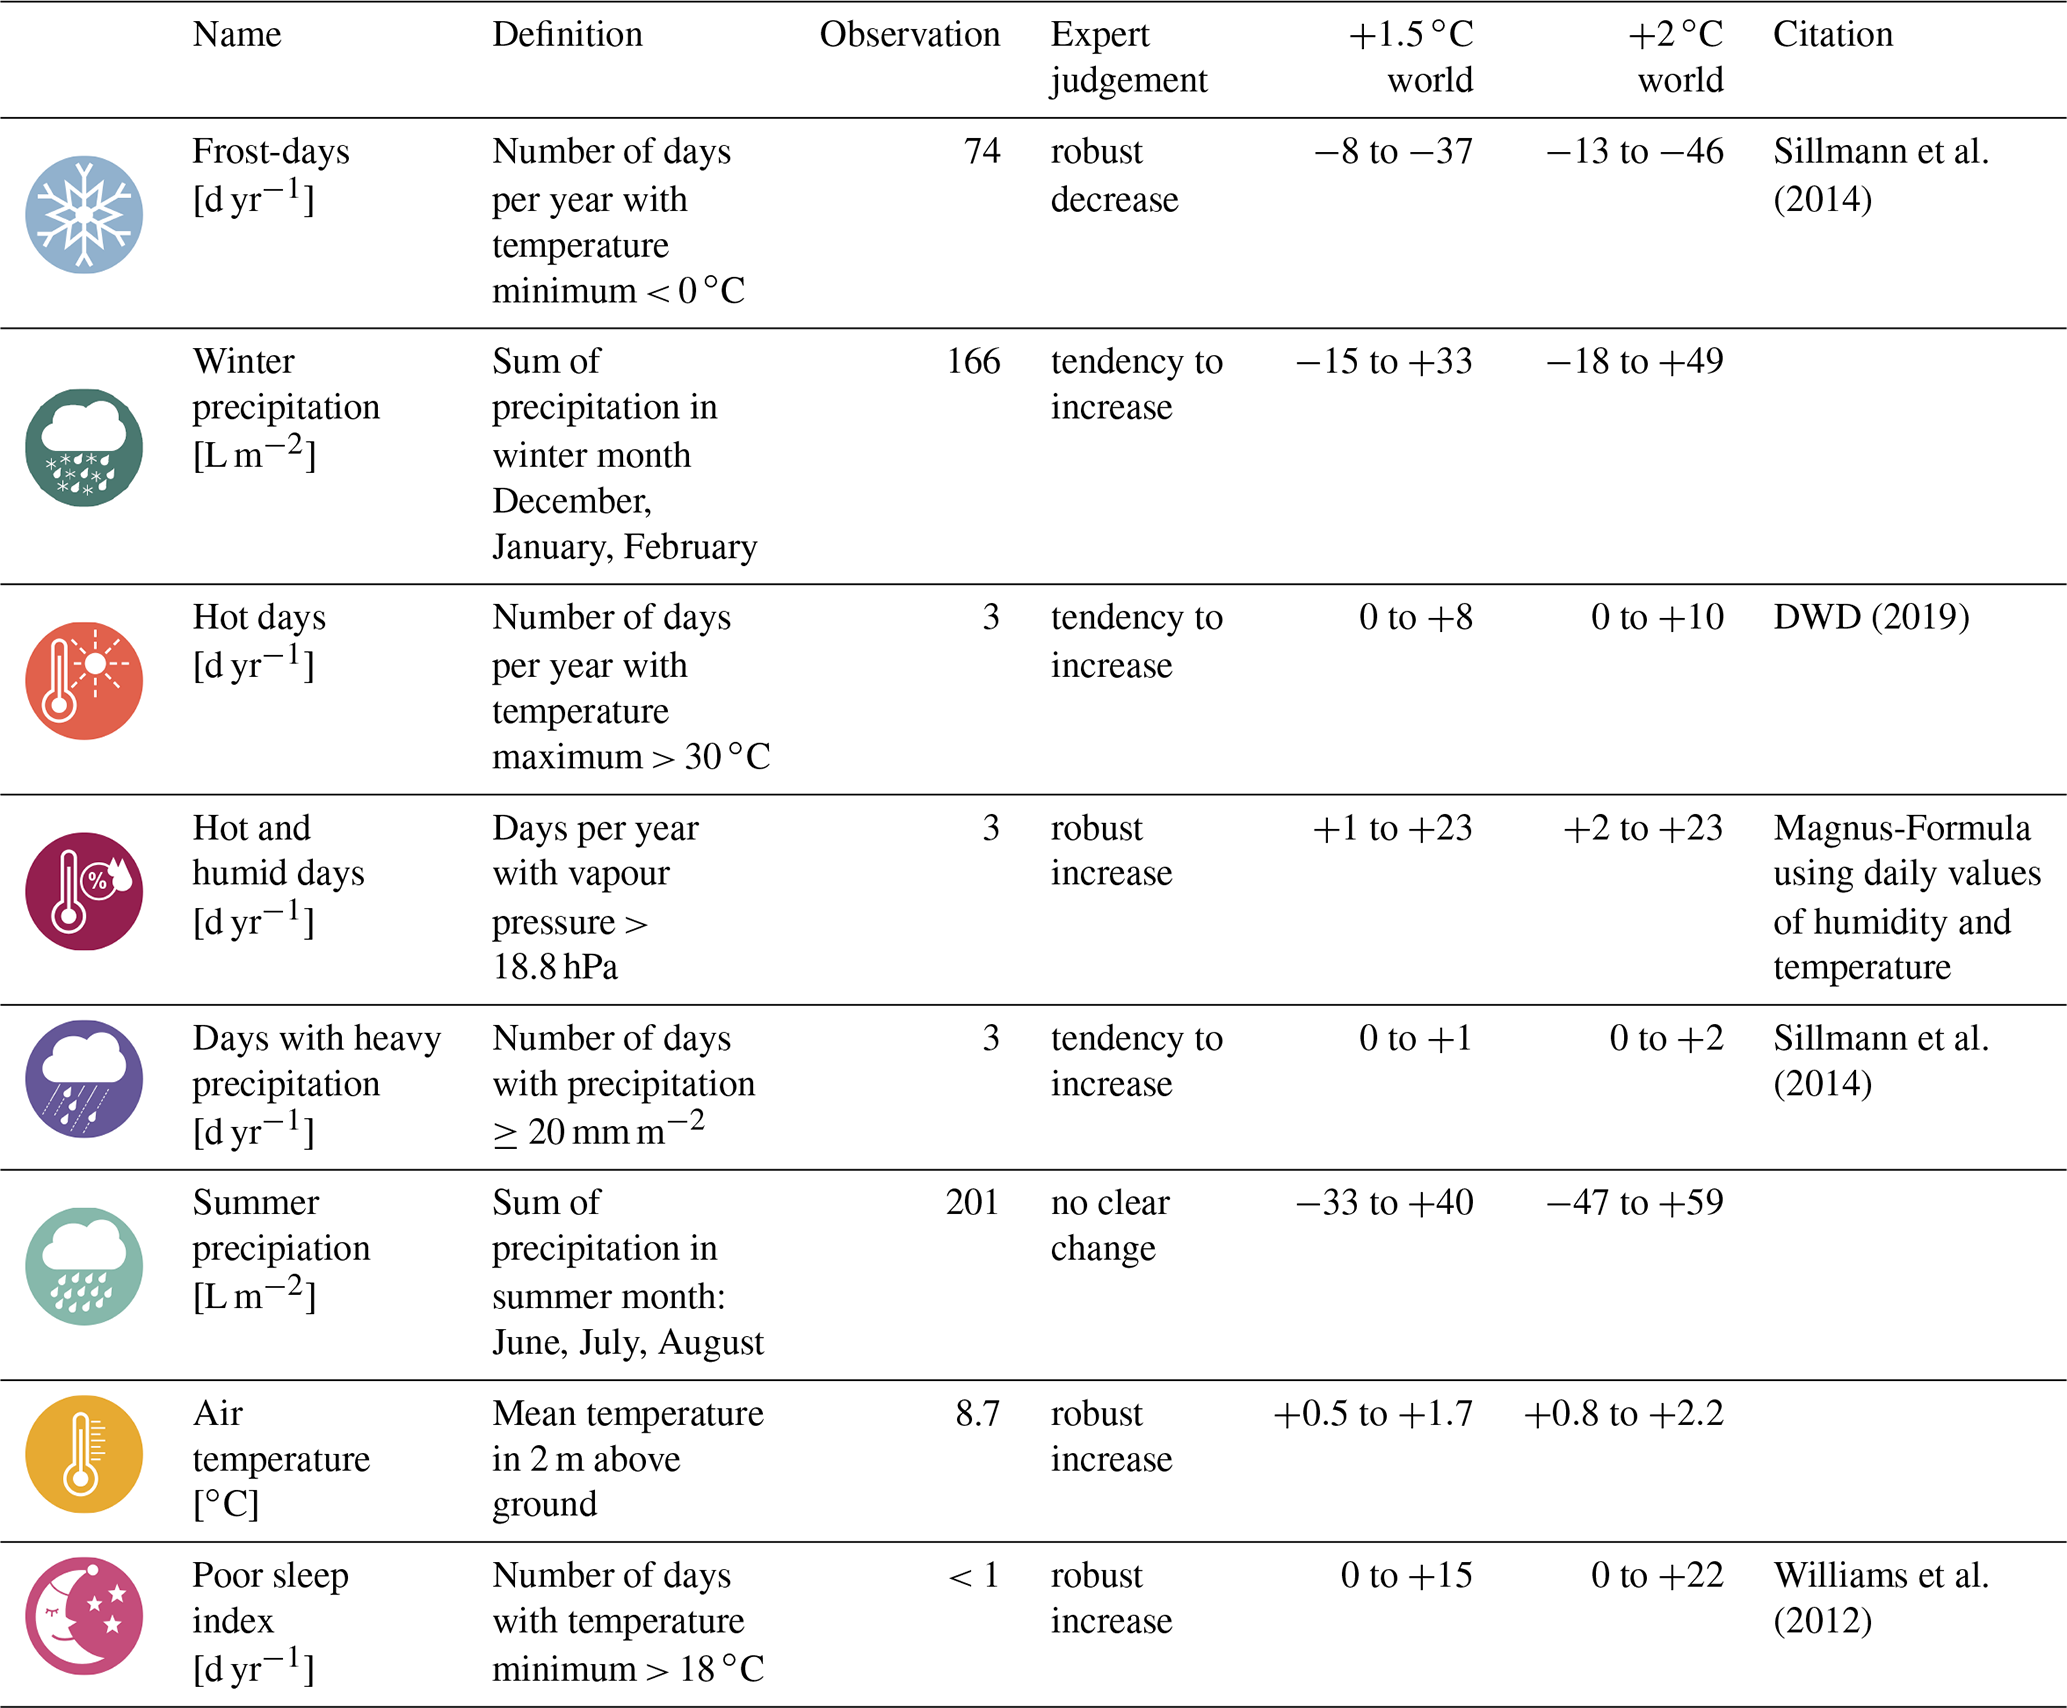
For MRH, there are already studies that deal with past and present climate conditions as well as with the urban climate of Hamburg (e.g., Brasseur et al., 2017; Meinke et al., 2018; Wiesner et al., 2018; Schlünzen et al., 2010). The findings of these studies are summarized for the flyer in a concise and understandable way. A graph that depicts the temperature anomalies in the last decades with respect to the average of the period from 1961 to 1990 at the German Meteorological Service (DWD) station Hamburg-Fuhlsbüttel was added in order to visualize the already observed changes (∼1.2 ∘C since 1951). While there are studies that deal with the future climate of the MRH (Meinke et al., 2018; Wiesner et al., 2018) no specific information about future climate change effects in a 1.5 or 2 ∘C world were available. Therefore, a large number of climate indices have been calculated and particular climate indices, relevant for the inhabitants, were selected. Table 1 lists the indices presented in the flyer, their definition, their value calculated from observations for present climate and their range of change within the 1.5 and 2 ∘C world including information on robustness and expert judgment.
Table 1List of the indices presented in the flyer, their definition and their range of change within the 1.5 and 2 ∘C world including an information on robustness.
The indices for the present climate were calculated from observational datasets REGNIE (Rauthe et al., 2013) and EOBS (Haylock et al., 2008). For the future climate, they were calculated from climate projections of the EURO-CORDEX regional climate model (RCM) ensemble (Bülow et al., 2018; Jacob et al., 2018b, 2014; Teichmann et al., 2018; Kotlarski et al., 2014). All regional climate projections used for the flyer are not bias corrected and are publicly available at the Earth System Grid Federation (ESGF).
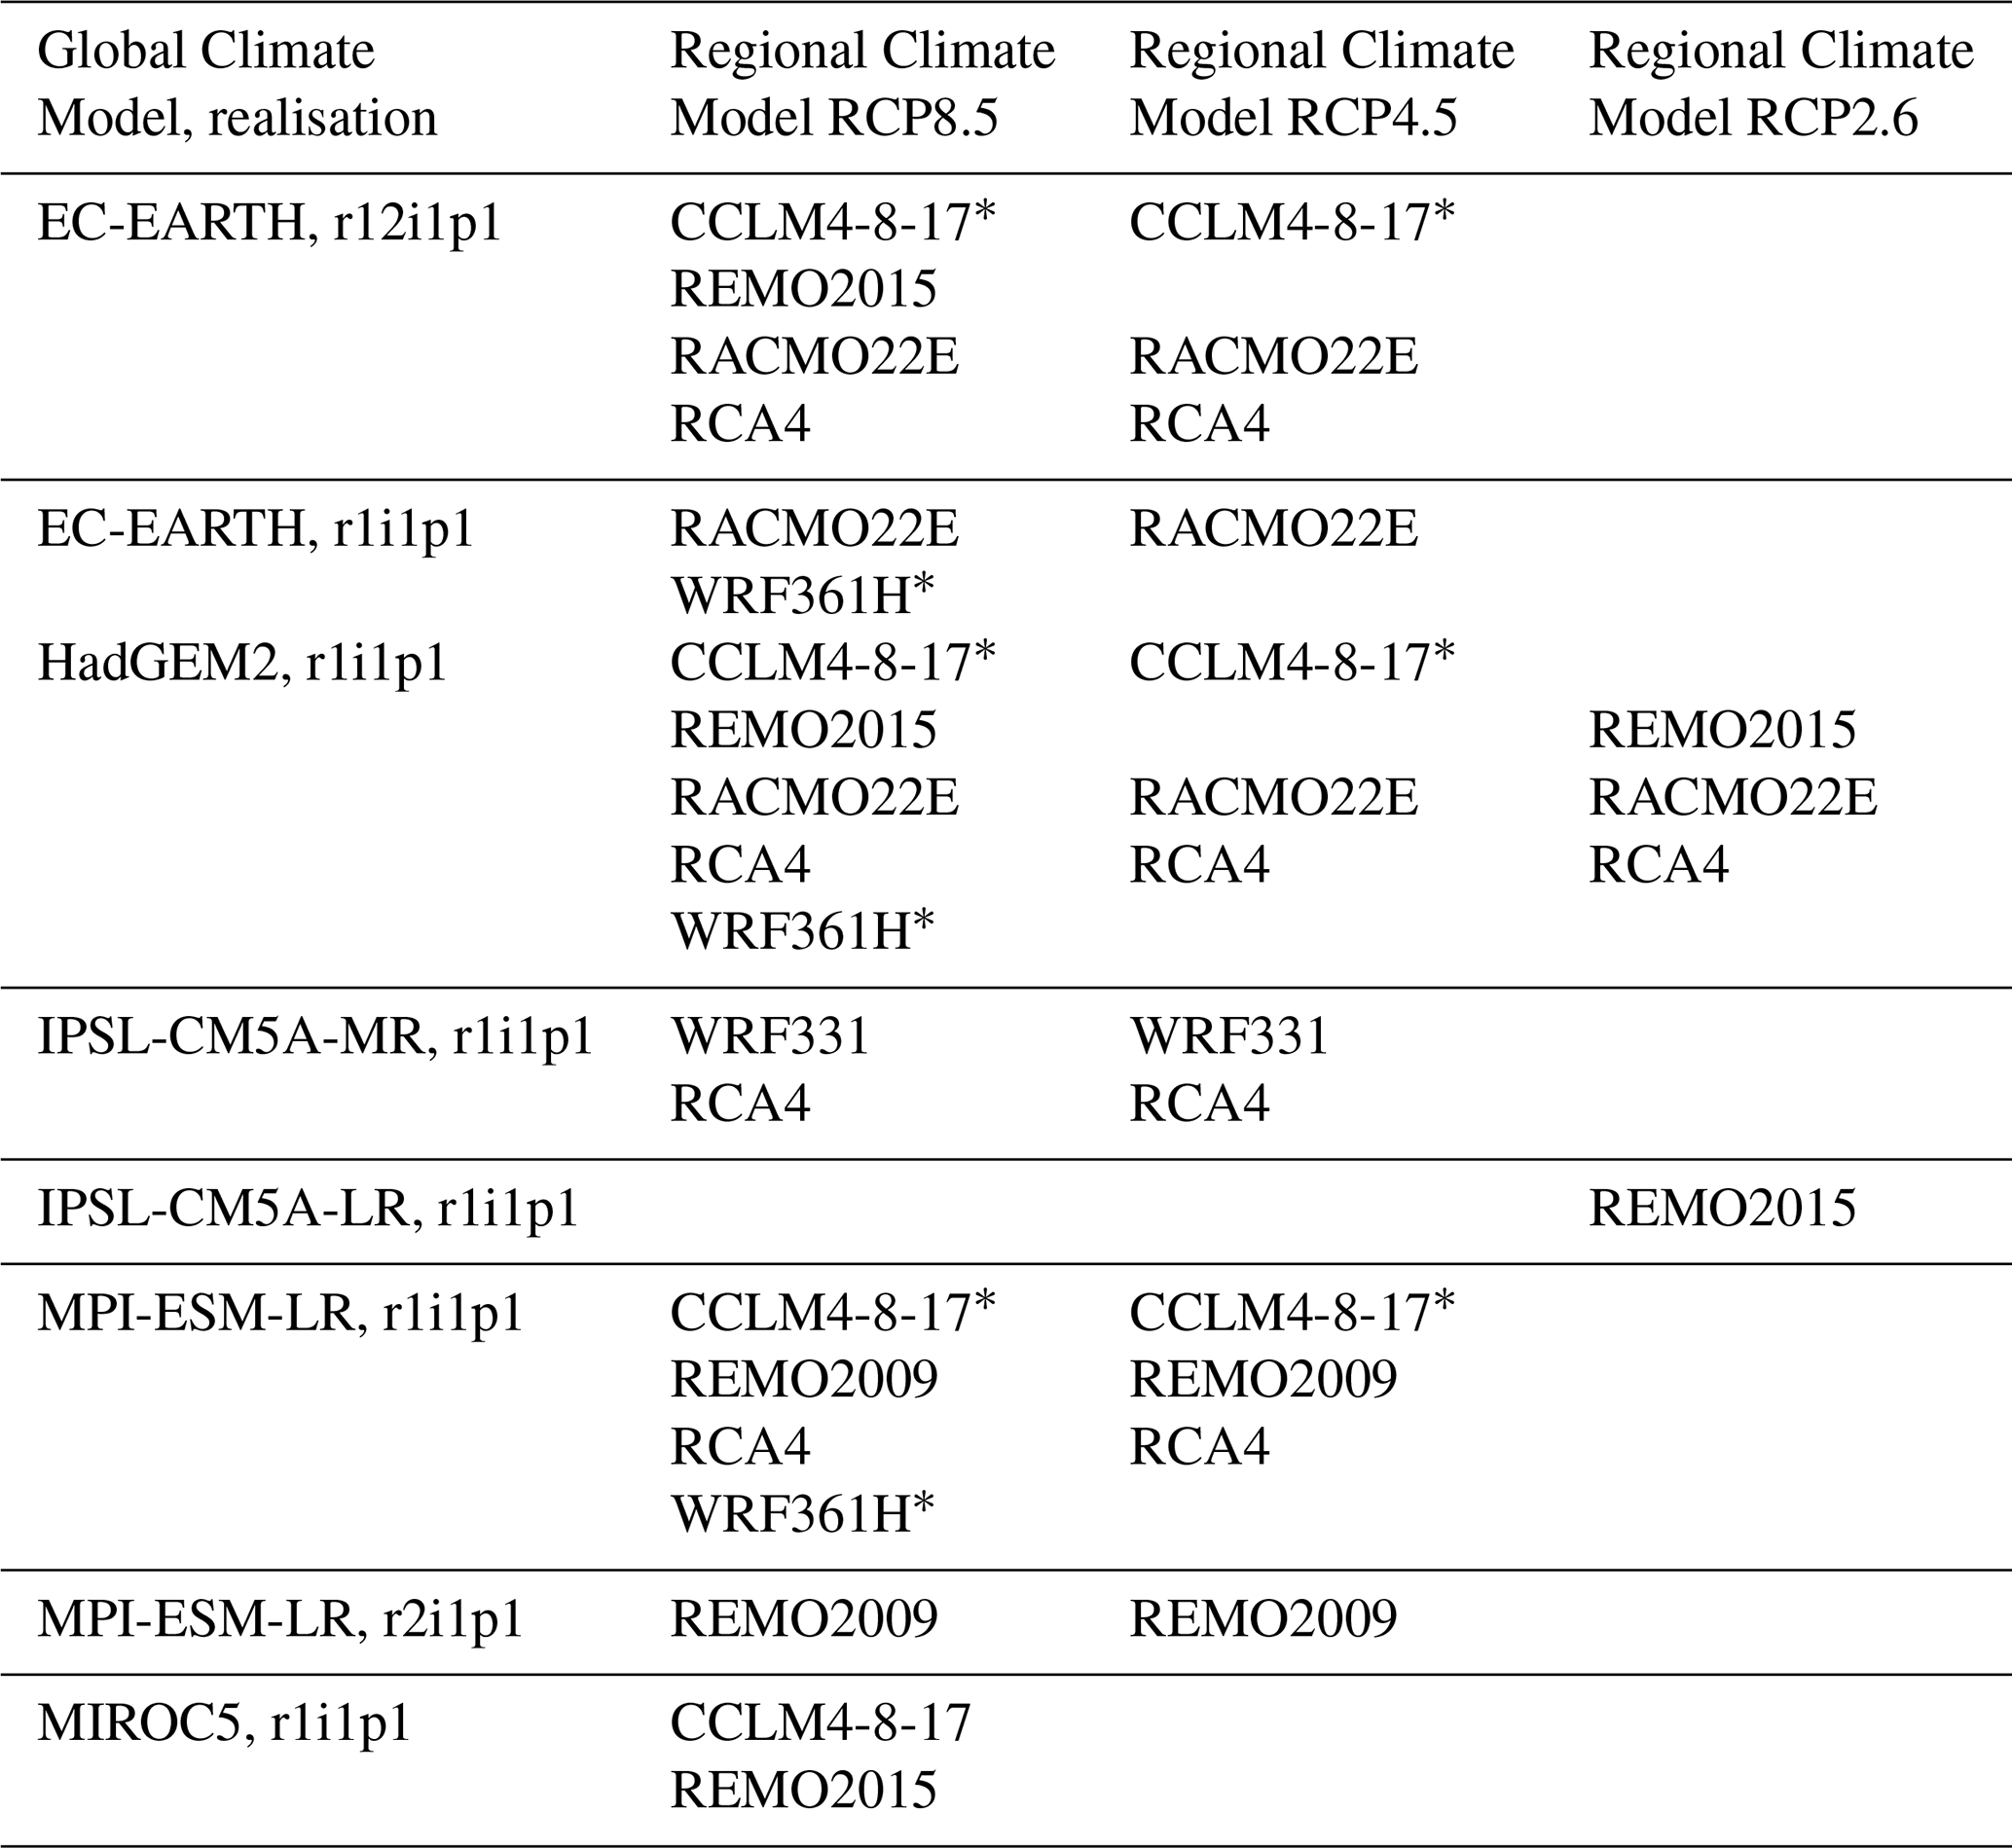
The corresponding future time periods for the 1.5 and 2 ∘C world, respectively, were selected following the method by Vautard et al. (2014). For each driving global climate model (GCM) the 30-year periods that reach a mean global temperature increase of 1.5 and 2 ∘C compared to the pre-industrial level were identified and the corresponding RCM data selected to calculate the indices. The change of each index was calculated as a mean difference between the 1.5 and 2 ∘C world time period and the time period 1971–2000 averaged over the MRH. Table 2 lists all RCM simulations and their forcing GCM, which have been used to calculate the climate indices.
Table 2List of the regional climate simulations used to calculate the indices. All simulations are publically available at the ESGF (https://esgf-data.dkrz.de/projects/esgf-dkrz/, last access: 3 December 2019). * Not used for the index hot and humid days.
After the calculations of the changes for each RCM of the ensemble, the robustness of these changes was determined using the following definitions: Increases/decreases are robust if more than 66 % of the simulations face into one direction and at least 66 % of these changes are statistically significant. Increases/decreases have a tendency if more than 66 % of the simulations face into one direction and less than 66 % of these changes are statistically significant (see also Mastrandrea et al., 2010). All other changes are denoted as no clear change. The significance was tested with the Mann–Whitney-U test using the 90 % confidence level (Pfeifer et al., 2015).
In order to introduce the reader to the topic of 1.5 ∘C global warming, the double gatefold flyer follows a targeted structure: a cover and a back page with relevant overarching information, two text-heavy pages and four rather graphical pages at the core of the flyer (see Fig. 2).

The cover page directs the reader on the topic with its title and stylized illustration of the MRH, as well as the coloured symbols of the analysed climate indices. The subtitle “Vom Alten Land bis zum Michel” was deliberately chosen so that the citizens feel directly addressed by the landmark of the city Hamburg, the “Michel”, and the orchard of the MRH, the “Altes Land”. Furthermore, these two local reference points indicate the bandwidth of climate change effects in the MRH.
The first rather textual page of the flyer introduces the topic and methods. The importance of a limitation of global warming to 1.5 ∘C is discussed and broken down from a global to regional (Germany) and local (Metropolitan Region) perspective. Furthermore, the section “What does this flyer show?” presents briefly the scientific methods und provides a first overview on the analysed climate indices. A link offers the possibility for a further in-depth study of the methodology and data basis, thus making it verifiable and transparent, while at the same time increasing the comprehensibility of the flyer. The second text-heavy page introduces the current climate and the already observed climatic changes in the MRH and the city of Hamburg. With the aid of a graph, anomalies of annual mean temperatures with regard to the reference period of 1961 to 1990 are shown that clearly visualise Hamburg's rising temperatures.
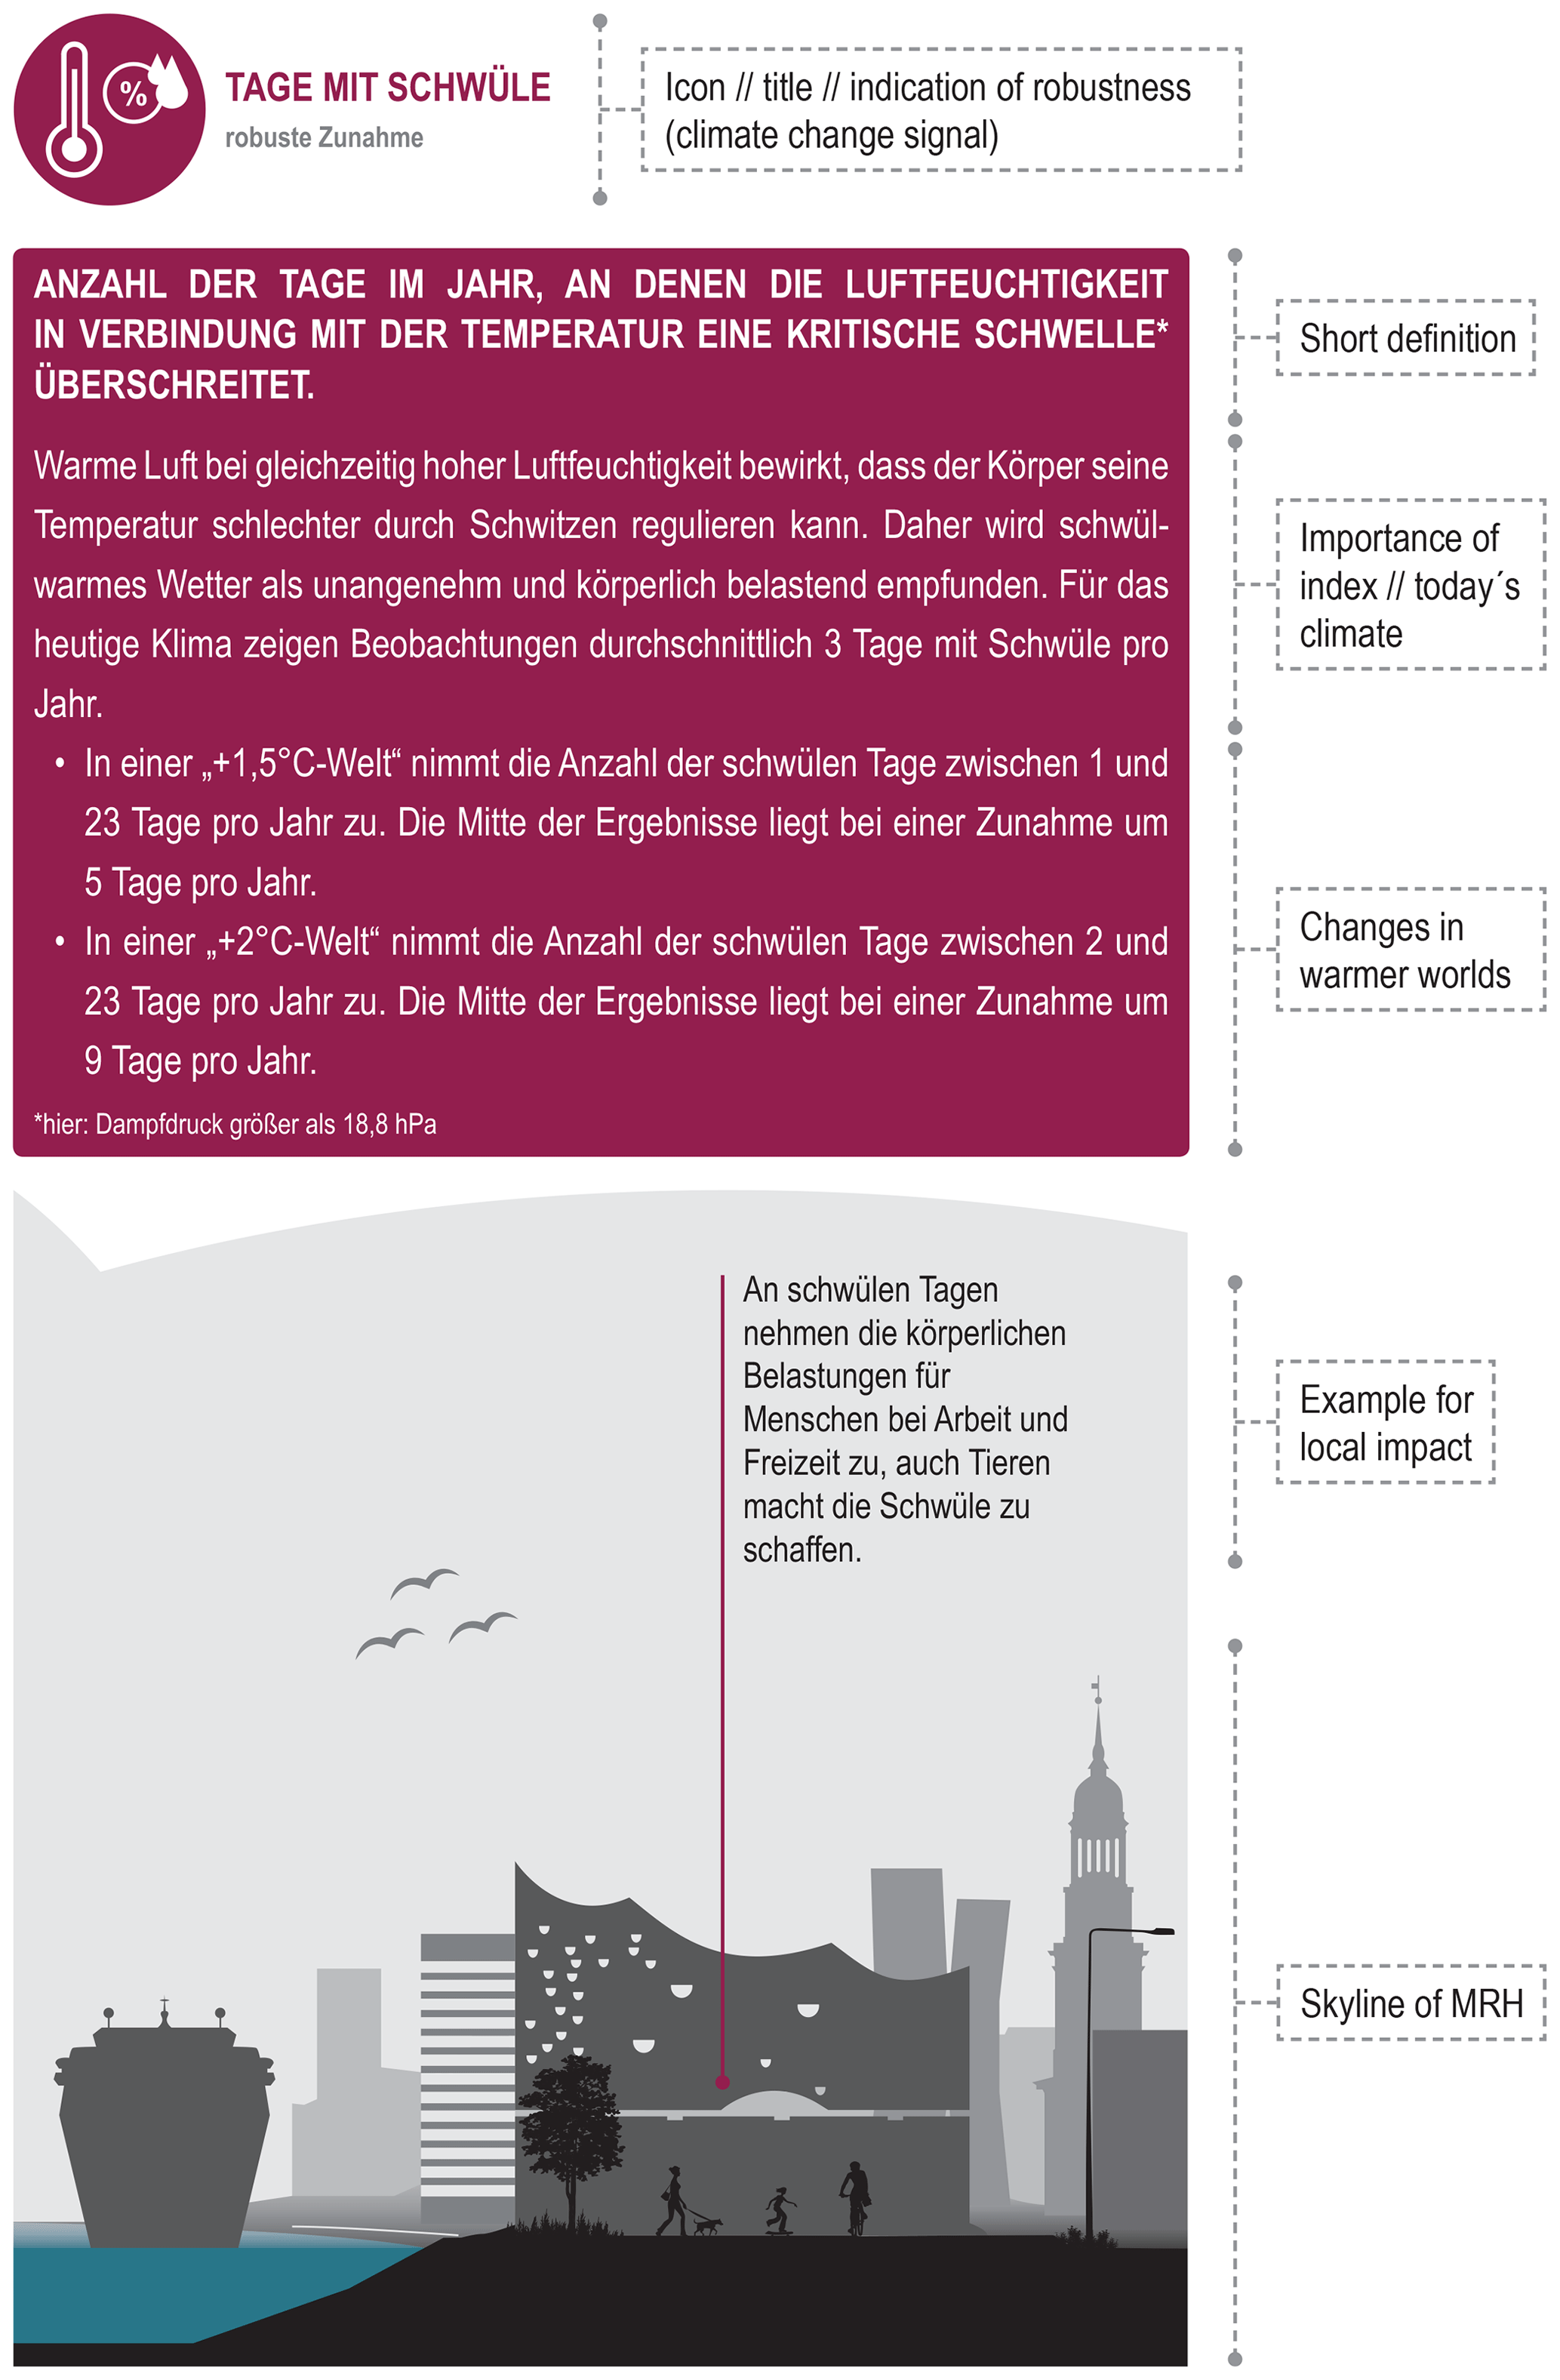
The four inner pages represent the centrepiece of the flyer. Eight climate indices are shown – frost days, winter and summer precipitation, hot and humid days, days with heavy rainfall, air temperature and a poor sleep index –and visually supported by the skyline of the MRH. All indices follow the same structure: the icon of the index with its title and an indication of the robustness of the climate change signal, the definition of the index and an explanation why this index is important. Additionally, the observation of today's climate, the changes in a +1.5 and +2 ∘C warmer world is presented for the MRH and supplemented with a specific example of a local impact, which is connected to the skyline of MRH (see Fig. 3).
Lastly, the flyer's back page contains the publishing information, such as the data basis or the picture credits, and a link to a webpage with further information (GERICS, 2020). This webpage provides a list of references and detailed background information about the data basis, namely the indices, their robustness as well as the data sources.
Of course, the flyer has been printed by a local printery on eco-friendly recycling paper.
The flyer was well received according to the collected feedback and, despite the tight deadline, was delivered in time. The reason for this has been engaged project members, still many lessons are learned and things could be improved. The lessons learned during the whole process of producing and disseminating the flyer can be subdivided into three categories: First, issues related to the scientific challenges, second to the management of the project, and third to the technical aspects.
Scientifically, the range of possible impacts of climate change in cities such as Hamburg is large. Therefore, a number of climate indices were calculated. However, to cover the impacts in more detail, more time should be allocated for developing advanced indices. Here, better use of the different disciplinary views on climate change impacts by the team members should be made. Some impacts that are relevant for Hamburg, such as changes in storm surges, are not yet covered by the fields of expertise at GERICS. Consequently, collaborations with external institutions are needed to include additional analysis of such impacts in a new or updated flyer.
With respect to managing the project, it was beneficial to split the responsibilities due to the large workload and the broad range of working items. Therefore, the intrinsic interests of the individual team members were utilized and, for example, tasks were assigned that were close to individual team members' own research and competences. Furthermore, the interdisciplinary teamwork was guided by two heads – one of them was responsible for a smooth workflow (set-up meetings, check deadlines, allocate the work, etc.) and one of them supervised the scientific content (development of the analysis, selection of indices, etc.). Another lesson learned relates to proofreading. Firstly, the amount of time that has to be dedicated to this work item was way larger than we initially expected. Secondly, the stakeholder involvement should have been more intensive, e.g., by adding more feedback loops. Feedback from the citizens of Hamburg suggests that the text could have been shorter and more concise. Additionally, the strategies for dissemination should be developed fairly early in the project. In the finalization phase we did not have sufficient time left to properly prepare for this important step. Therefore, we had to catch up on appropriate communication channels, such as municipal district offices or public libraries, after the flyer is publication.
Some technical issues that came up during the process are related to the support of the project planning and management, to the data and code sharing, and to the re-use of the existing data processing and analysing software. To avoid such issues, stronger emphasis should be placed on planning and source code management software. Another small but very crucial technical aspect is the need for test printing of the flyer to avoid issues with the colour depth or with the paper quality.
An interesting and visually attractive flyer for the citizens of Hamburg was developed, which describes the MRH in 1.5 and 2 ∘C warmer world. A large amount of climate data was processed for the present climate and future climate and the relevant information for the citizens compiled and visualised. An interdisciplinary team with a wide range of expertise was necessary to create such a product. The challenges that come with such a project were successfully tackled and the experience gained during the whole process will help future projects. For instance, suggestions concerning the time management of the dissemination strategy and proofreading can be given. Furthermore, is seen as a crucial step to involve additional institutes with their respective expertise, e.g., on sea level rise.
Moreover, the feedback from the dissemination of the flyer suggested reducing the amount of text. Therefore, a second flyer2 was printed, which only contains a short introductory text, the silhouette and the climate indices - namely for today's climate as well as under climate change in a 1.5, 2, 3 and 4 ∘C world (Jacob et al., 2019). In this regard, a formalised evaluation of the flyer`s impact on society could be of great value for the development of subsequent products. It is, however, still open to discussions how to assess societal impact of research and thus, further research has to be carried out (Schuck-Zöller et al., 2018).
All simulations used in this paper are available at the Earth System Grid Federation (ESGF), further information can also be found on the GERICS website (ESGF, 2019; GERICS, 2019). Datasets for observations are available for EOBS: https://www.ecad.eu//download/ensembles/download.php (last access: 13 January 2020) (Cornes et al., 2018) and REGNIE: https://opendata.dwd.de/climate_environment/CDC/grids_germany/daily/regnie/ (last access: 13 January 2020) (DWD Climate Data Center, 2020).
BS prepared the manuscript with major contributions from KB, TB, PH and JP, further contributions of SP, DR, JEZ and DJ. All authors contributed to the project.
The authors declare that they have no conflict of interest.
This article is part of the special issue “19th EMS Annual Meeting: European Conference for Applied Meteorology and Climatology 2019”. It is a result of the EMS Annual Meeting: European Conference for Applied Meteorology and Climatology 2019, Lyngby, Denmark, 9–13 September 2019.
We thank Anke Schlünsen-Rico for the internal review and her comments that greatly improved the manuscript. Furthermore, we thank the EURO-CORDEX consortium and the climate modelling groups for producing and making their model output available.
The article processing charges for this open-access publication were covered by a Research Centre of the Helmholtz Association.
This paper was edited by Tanja Cegnar and reviewed by Rasmus Benestad and one anonymous referee.
Brasseur, G. P., Jacob, D., and Schuck-Zöller, S.: Klimawandel in Deutschland – Entwicklung, Folgen, Risiken und Perspektiven, Springer Spektrum, Berlin, Heidelberg, 2017.
Bülow, K., Hübener, H., Keuler, K., Menz, C., Spekat, A., and Steger, C.: User tailored results of a regional climate model ensemble to plan adaption to the changing climate in Germany, Adv. Sci. Res., 16, 241–249, https://doi.org/10.5194/asr-16-241-2019, 2018.
Corner, A. and Clarke, J.: Talking Climate: From Research to Practice in Public Engagement, Palgrave Macmillan imprint, Cham, 2017.
Corner, A., Shaw, C., and Clarke, J.: Principles for effective communication and public engagement on climate change: A Handbook for IPCC authors, Climate Outreach, Oxford, 2018.
Cornes, R., van der Schrier, G., van den Besselaar, E. J. M., and Jones, P. D.: An Ensemble Version of the E-OBS Temperature and Precipitation Datasets, J. Geophys. Res.-Atmos., 123, 9391–9409, https://doi.org/10.1029/2017JD028200, 2018.
Defila, R., Di Giuolio, A., and Scheuermann, M.: Forschungsverbundmanagement. Handbuch für die Gestaltung inter- und transdisziplinärer Projekte, vdf, Zürich, 2006.
DWD – Deutscher Wetterdienst: Glossar, available at: https://www.dwd.de/DE/service/lexikon/Functions/glossar.html?lv2=101094&lv3=101162, last access: 8 October 2019.
DWD Climate Data Center (CDC): REGNIE – Raster der täglichen Niederschlagshöhe für Deutschland, available at: https://opendata.dwd.de/climate_environment/CDC/grids_germany/daily/regnie/, last access: April 2020.
ESGF – Earth System Grid Federation: Welcome to the DKRZ ESGF-CoG Node, available at: https://esgf-data.dkrz.de/projects/esgf-dkrz/, last access: 22 October 2019.
GERICS – Climate Service Center Germany: Eine globale Erwärmung von 1,5 ∘C: Was bedeutet das für die Metropolregion Hamburg?, available at: https://www.gerics.de/products_and_publications/publications/IPCC/detail/078103/index.php.de, last access: 22 October 2019.
GERICS – Climate Service Center Germany: GERICS and the IPCC Special Report on Global Warming of 1.5 ∘C, available at: https://www.gerics.de/products_and_publications/publications/IPCC/index.php.en, last access: 9 January 2020.
Haylock, M. R., Hofstra, N., Klein Tank, A. M. G., Klok, E. J., Jones, P. D., and New, M.: A European daily high-resolution gridded data set of surface temperature and precipitation for 1950–2006, J. Geophys. Res.-Atmos., 113, D20119, https://doi.org/10.1029/2008JD010201, 2008.
IPCC – Intergovernmental Panel on Climate Change: Global Warming of 1.5 ∘C, in: An IPCC Special Report on the impacts of global warming of 1.5 ∘C above pre-industrial levels and related global greenhouse gas emission pathways, in the context of strengthening the global response to the threat of climate change, sustainable development, and efforts to eradicate poverty, edited by: Masson-Delmotte, V., Zhai, P., Pörtner, H.-O., Roberts, D., Skea, J., Shukla, P. R., Pirani, A., Moufouma-Okia, W., Péan, C., Pidcock, R., Connors, S., Matthews, J. B. R., Chen, Y., Zhou, X., Gomis, M. I., Lonnoy, E., Maycock, T., Tignor, M., and Waterfield, T., available at: https://www.ipcc.ch/sr15/download/ (last access: 10 December 2019), 2018.
Jacob, D., Petersen, J., Eggert, B., Alias, A., Christensen, O. B., Bouwer, L. M., Braun, A., Colette, A., Deque, M., Georgievski, G., Georgopoulou, E., Gobiet, A., Menut, L., Nikulin, G., Haensler, A., Hempelmann, N., Jones, C., Keuler, K., Kovats, S., Kröner, N., Kotlarski, S., Kriegsmann, A., Martin, E., van Meijgaard, E., Moseley, C., Pfeifer, S., Preuschmann, S., Radermacher, C., Radtke, K., Rechid, D., Rounsevell, M., Samuelsson, P., Somot, S., Soussana, J.-F., Teichmann, C., Valentini, R., Vautard, R., Weber, B., and Yiou, P.: EURO-CORDEX: New high-resolution climate change projections for European impact research, Reg. Environ. Change, 14, 563–578, https://doi.org/10.1007/s10113-013-0499-2, 2014.
Jacob, D., Blome, T., Bülow, K., Fischer-Bruns, I., Hoffmann, P., Kriegsmann, A., Otto, J., Petersen, J., Pfeifer, S., Rechid, D., Steuri, B., and Viktor, E.: Die Metropolregion Hamburg in einer ∘C wärmeren Welt: Vom Alten Land bis zum Michel, available at: https://www.gerics.de/products_and_publications/publications/IPCC/hamburg1.5/index.php.de (last access: 10 October 2019), 2018a.
Jacob, D., Kotova, L., Teichmann, C., Sobolowski, S. P., Vautard, R., Donnelly, C., Koutroulis, A. G., Grillakis, M. G., Tsanis, I. K., Damm, A., Sakalli, A., and van Vliet, M. T. H.: Climate Impacts in Europe Under +1.5 ∘C Global Warming, Earth's Future, 6, 264–285, https://doi.org/10.1002/2017EF000710, 2018b.
Jacob, D., Blome, T., Bülow, K., Kriegsmann, A., Petersen, J., Pfeifer, S., Rechid, D., and Steuri, B.: Die Metropolregion Hamburg in einer wärmeren Welt: Regionale Klimaänderungen unter verschiedenen globalen Erwärmungsraten, available at: https://www.gerics.de/products_and_publications/publications/IPCC/detail/079242/index.php.de, last access: 10 October 2019.
Kotlarski, S., Keuler, K., Christensen, O. B., Colette, A., Déqué, M., Gobiet, A., Goergen, K., Jacob, D., Lüthi, D., van Meijgaard, E., Nikulin, G., Schär, C., Teichmann, C., Vautard, R., Warrach-Sagi, K., and Wulfmeyer, V.: Regional climate modeling on European scales: a joint standard evaluation of the EURO-CORDEX RCM ensemble, Geosci. Model Dev., 7, 1297–1333, https://doi.org/10.5194/gmd-7-1297-2014, 2014.
Mastrandrea, M. D., Field, C. B., Stocker, T. F., Edenhofer, O., Ebi, K. L., Frame, D. J., Held, H., Kriegler, E., Mach, K. J., Matschoss, P. R., Plattner, G.-K., Yohe, G. W., and Zwiers, F. W.: Guidance Note for Lead Authors of the IPCC Fifth Assessment Report on Consistent Treatment of Uncertainties. Intergovernmental Panel on Climate Change (IPCC), available at: https://wg1.ipcc.ch/SR/documents/ar5_uncertainty-guidance-note.pdf (last access: 3 December 2019), 2010.
Meinke, I., Rechid, D., Tinz, B., Maneke, M., Lefebvre, C., and Isokeit, E.: Klima der Region – Zustand, bisherige Entwicklung und mögliche Änderungen bis 2100, in: Hamburger Klimabericht – Wissen über Klima, Klimawandel und Auswirkungen in Hamburg und Norddeutschland, edited by: von Storch, H., Meinke, I., and Claußen, M., Springer, Berlin, Heidelberg, 2018.
Pfeifer, S., Bülow, K., Gobiet, A., Hänsler, A., Mudelsee, M., Otto, J., Rechid, D., Teichmann, C., and Jacob, D.: Robustness of ensemble climate projections analyzed with climate signal maps: Seasonal and extreme precipitation for Germany, Atmosphere, 6, 677–698, https://doi.org/10.3390/atmos6050677, 2015.
Rauthe, M., Steiner, H., Riediger, U., Mazurkiewicz, A., and Gratzki, A.: A Central European precipitation climatology – Part I: Generation and validation of a high-resolution gridded daily data set (HYRAS), Meteorol. Z., 22, 235–256, https://doi.org/10.1127/0941-2948/2013/0436, 2013.
Schlünzen, K. H., Hoffmann, P., Rosenhagen, G., and Riecke, W.: Long-term changes and regional differences in temperature and precipitation in the metropolitan area of Hamburg, Int. J. Climatol., 30, 1121–1136, https://doi.org/10.1002/joc.1968, 2010.
Schuck-Zöller, S., Brinkmann, C., and Rödder, S.: Integrating Research and Practice in Emerging Climate Services – Lessons from Other Transdisciplinary Dialogues, in: Communicating Climate Change Information for Decision-Making, edited by: Serrao-Neumann, S., Coudrain, A., and Coulter, L., Springer Climate, https://doi.org/10.1007/978-3-319-74669-2_8, 2018.
Sillmann, J., Donat, M. G., Fyfe, J. C., and Zwiers, F. W.: Observed and simulated temperature extremes during the recent warming hiatus, Environ. Res. Lett., 9, 064023, https://doi.org/10.1088/1748-9326/9/6/064023, 2014.
Teichmann, C., Bülow, K., Otto, J., Pfeifer, S., Rechid, D., Sieck, K., and Jacob, D.: Avoiding extremes: Benefits of staying below +1.5 ∘C compared to +2.0 ∘C and +3.0 ∘C global warming, Atmosphere, 9, 1–19, https://doi.org/10.3390/atmos9040115, 2018.
UNFCCC – United Nations Framework Convention on Climate Change: Paris Agreement: essential elements, available at: https://unfccc.int/process-and-meetings/the-paris-agreement/the-paris-agreement, last access: 3 December 2019.
Vautard, R., Gobiet, A., Sobolowski, S., Kjellström, E., Stegehuis, A., Watkiss, P., Mendlik, T., Landgren, O., Nikulin, G., Teichmann, C., and Jacob, D.: The European climate under a 2 ∘C global warming, Environ. Res. Lett., 9, 034006, https://doi.org/10.1088/1748-9326/9/3/034006, 2014.
Wiesner, S., Bechtel, B., Fischereit, J., Gruetzun, V., Hoffmann, P., Leitl, B., Rechid, D., Schlünzen, K. H., and Thomsen, S.: Is It Possible to Distinguish Global and Regional Climate Change from Urban Land Cover Induced Signals? A Mid-Latitude City Example, Urban Sci., 2, 1–22, https://doi.org/10.3390/urbansci2010012, 2018.
Williams, S., Nitschke, M., Sullivan, T., Tucker, G. R., Weinstein, P., Pisaniello, D. L., Parton, K. A., and Bi, P.: Heat and health in Adelaide, South Australia: Assessment of heat thresholds and temperature relationships, Sci. Total Environ., 414, 126–133, https://doi.org/10.1016/j.scitotenv.2011.11.038, 2012.
Full title of the SR1.5: Global warming of 1.5 ∘C: an IPCC special report on the impacts of global warming of 1.5 ∘C above pre-industrial levels and related global greenhouse gas emission pathways, in the context of strengthening the global response to the threat of climate change, sustainable development, and efforts to eradicate poverty.
The cited flyers are available on the GERICS webpage: https://www.gerics.de/products_and_publications/publications/IPCC/index.php.en (last access: 9 January 2020).