 | 29 Jan 2021
How weather influenced the mood of people during the COVID-19 lockdown in Catalonia: a review of Twitter posts
Alex Sancliment
Jofre Janué
This article is the result of a campaign done during the COVID-19 lockdown in Catalonia. The Television of Catalonia audience was involved in an action to inform about the weather from their own homes by posting Twitter videos. Some of the videos were shown on air in the weather segment of the television station's main news programs. We have correlated participation in the campaign with meteorological and public health data and found that weather is related to the mood of people when using social media platforms such as Twitter.
- Article
(1629 KB) - Full-text XML
- BibTeX
- EndNote


The pandemic caused by the spread of the new coronavirus SARS-CoV-2 had a strong incidence in Catalonia, an autonomous region in the NE of the Iberian peninsula (Fig. 1). Igualada, one of the biggest cities in central Catalonia, was one of the first areas to be placed under lockdown in Europe, days before the total lockdown of the entire country imposed by the Spanish authorities from 15 March 2020. The Spanish lockdown was one of the strictest in Europe and consisted in the closure of all non-essential activities, the suspension of academic activity and the reduction of public transport and other public services. This lockdown was even more restrictive during the two weeks starting on 31 March, when the Spanish authorities suspended nearly all the remaining activities following a surge in COVID-19 incidence.
After the first case of the virus was identified in Catalonia on 25 February and until June, more than 58 000 people were diagnosed with the virus, and 12 408 of them died. The most acute phase of the pandemic in the region was from 26 March and 12 April, with over 300 daily deaths, reaching a record-high on 30 March with 414 victims. 30 April was the first day with less than 100 deaths. The combined effect of health and lockdown measures with the rise of temperatures (Tobias and Molina, 2020) at the beginning of May led to a decrease in the number of deceased, getting below 50 a day on 10 May. Starting on the first Saturday of May (2 May), citizens were allowed again to walk in the street by groups of ages in the first of several phases of the de-escalation from the lockdown.
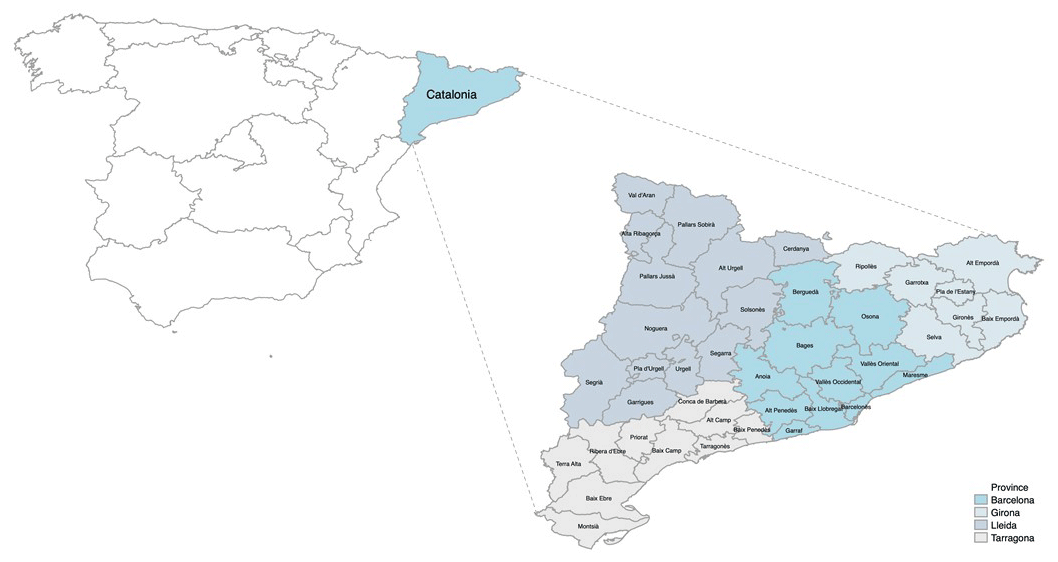
Figure 1Counties of Catalonia and location of the region in the context of Spain.
During the lockdown the Catalan public TV (Televisió de Catalunya, TV3), a TV channel with two main news programs every day at noon and in the evenings, reached its highest audiences in the last decade. The weather segment of 5 min at the end of each news programme had more than 400 000 viewers at its noon edition and 700 000 viewers for its evening edition, according to Kantar media (2021). On 18 March, viewers were encouraged to send short videos explaining the current weather conditions at home using the Twitter hashtag “ElTempsdesdecasaTV3”, which translates to “Weather from home TV3”. Some of the videos were shown on air in the weather segment of the main news. The campaign was a big success and thousands of viewers, most of them non-professional weather observers, sent their videos from over half of the country's towns and cities (Fig. 2).
It is well known that weather influences people's behaviour and activity, and plays a role in a person's mood (Golder and Macy, 2011; Park et al., 2013). Temperature and humidity have an influence in depressive moods (Modoni and Tosi, 2016), with people living under higher temperatures being less predisposed to depression. During the pandemic lockdown people were forced to stay at home. Studies have shown that Spanish users used social media to inform themselves and to buy products like nuts, cheese and chocolate, or desserts, to improve their mood during this period (Laguna et al., 2020). It was a difficult time for most. Emergency events, and those related to mass coverage, are some of those most suitable for the use and sharing of information on Twitter (Hughes and Palen, 2009). The total lockdown, with millions of people staying at home, with anger in their present and future health security, can be a good case study.
The Twitter campaign “ElTempsdesdecasaTV3” lasted from 18 March until 10 May. The viewers of El Temps, the weather segment of TV3, were asked to post short videos on Twitter about the current weather conditions as seen from their own home windows and terraces (following the rules of the lockdown imposed by Spanish authorities). The video was accompanied with a speech about the place, time and temperature of the location where the video had been taken. During this period a total of 5787 videos were posted on the social media platform Twitter. We conducted a study of the number of posts per day, the owner of each Twitter account, and the location of each video.
We collected daily data of cases confirmed from a positive polymerase chain reaction (PCR) test and mortality between 18 March and 10 May 2020. Data was provided by the Health Evaluation and Quality Agency of Catalonia (AQuAS). Daily average, minimum and maximum ambient temperature, absolute humidity and solar radiation levels were provided by the Meteorological Service of Catalonia (MeteoCat).
We estimated the average meteorological factors in Catalonia as the average for Barcelona, Tarragona, Lleida and Girona, the four capital cities of the Catalan provinces; Igualada, the most affected city during the first weeks of the pandemic and located near the centre of Catalonia; and Tortosa and La Seu d'Urgell, two towns representative of the south and the Pyrenees regions.
From 18 March to the end of the month there were 1244 videos mentioning the hashtag “ElTempsdesdecasaTV3” on Twitter, coming from 382 different locations. April had 3852 participations from 626 different locations. The month of May, until 10 May, had 691 videos from 247 locations.
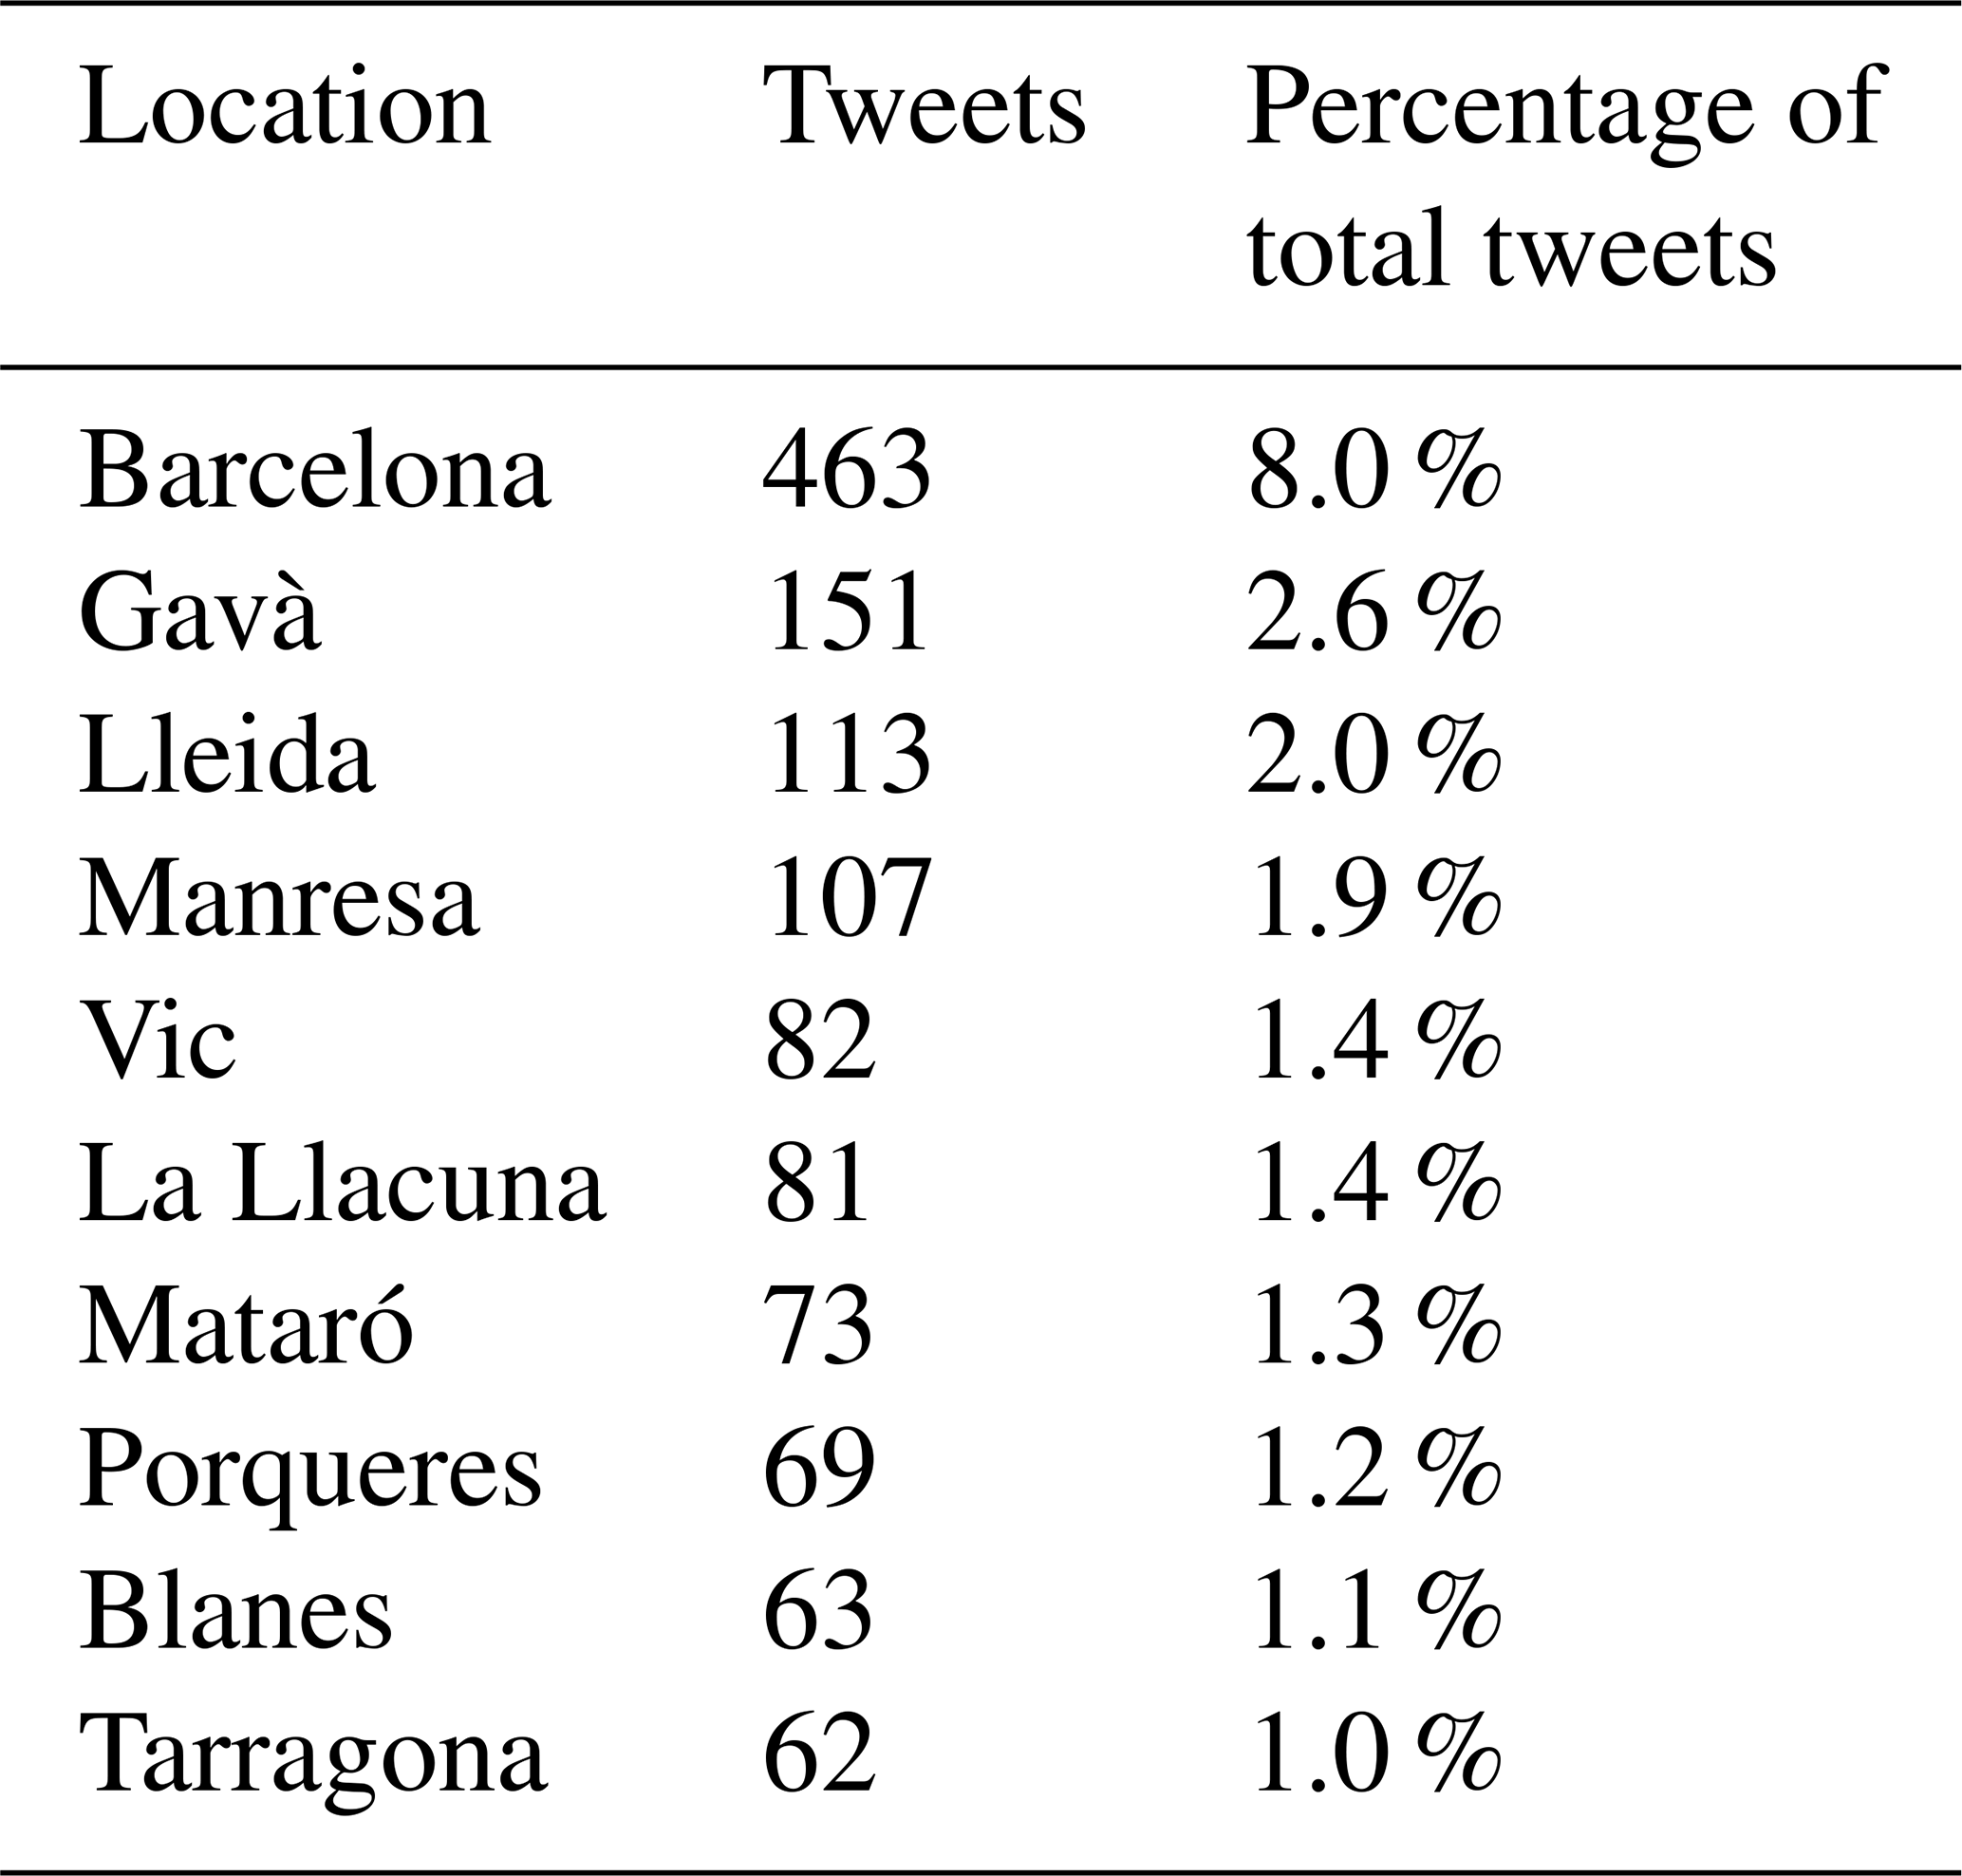
With a total of 5787 videos with the hashtag, the average was 107 videos a day, with a maximum of 208 participations on 19 April. The 10 cities with more participation, which include Barcelona and other highly-populated areas, represent nearly a quarter of the posts (Table 1).
Table 1Locations with a higher share of the total number of tweets.
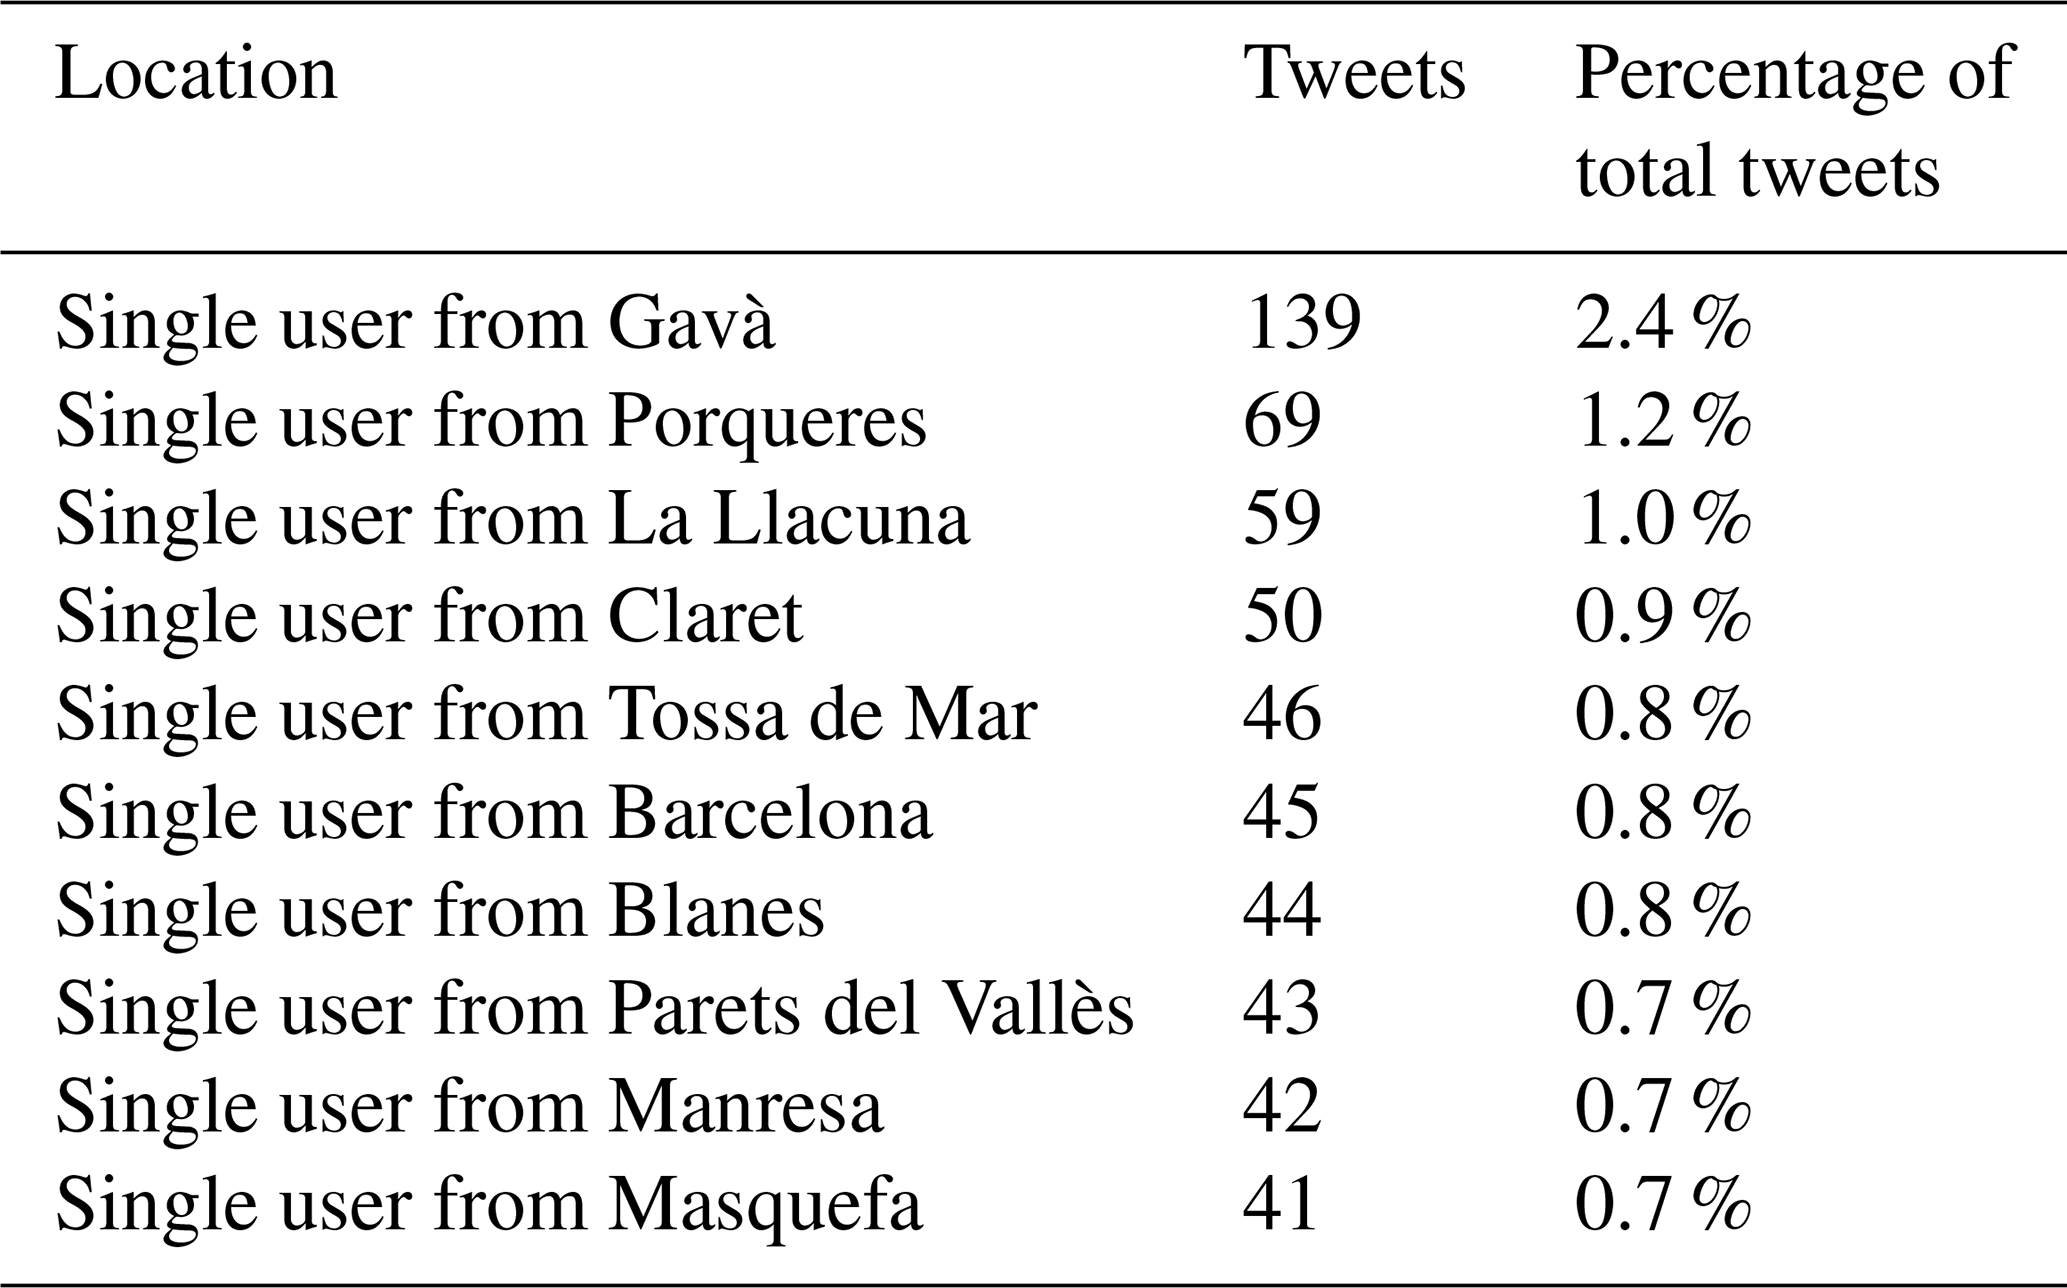
Most of the participants made one or two contributions to the campaign, though three participants were responsible for 267 videos and the 10 most active participants represent a tenth of the total number of posts (Table 2).
Table 2Users with a higher share of the total number of tweets.
More than half of the municipalities of Catalonia sent at least one tweet for the campaign, with tweets coming from 778 different locations. Figure 2 shows the geographical participation distribution along the Twitter campaign. Most populated areas had more participants, while rural areas had less, even none.
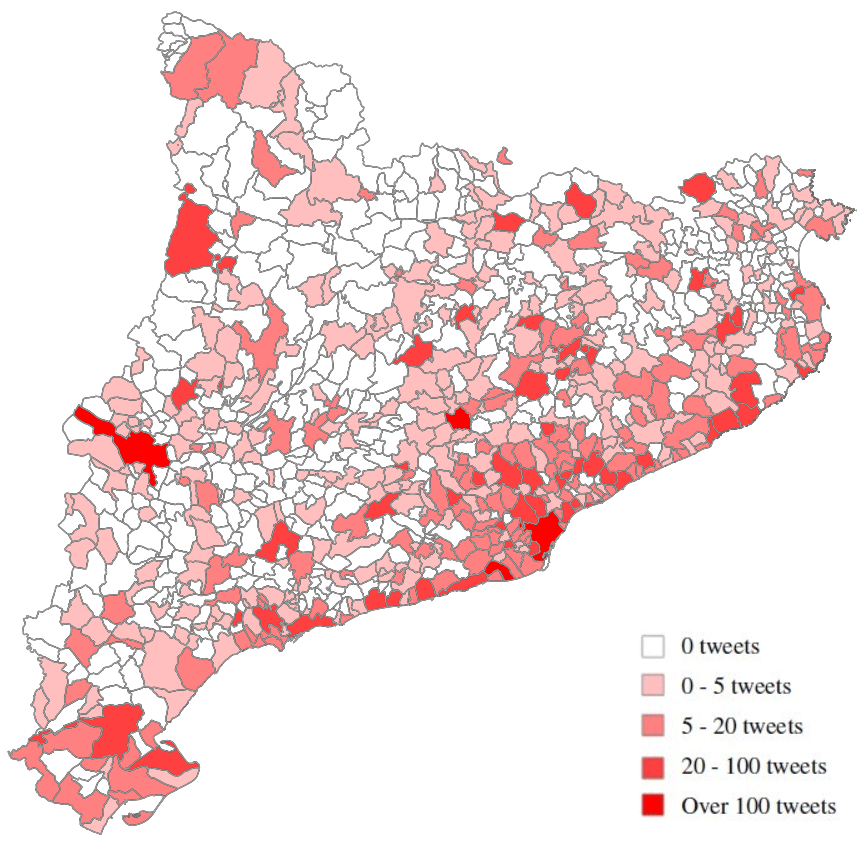
Figure 2Spatial distribution of the tweets.
Figure 3 shows participation, number of cases per day, and daily deaths in Catalonia. The number of tweets increased until mid-April, and after that diminished as the number of cases and daily deaths decreased until the end of the lockdown period.
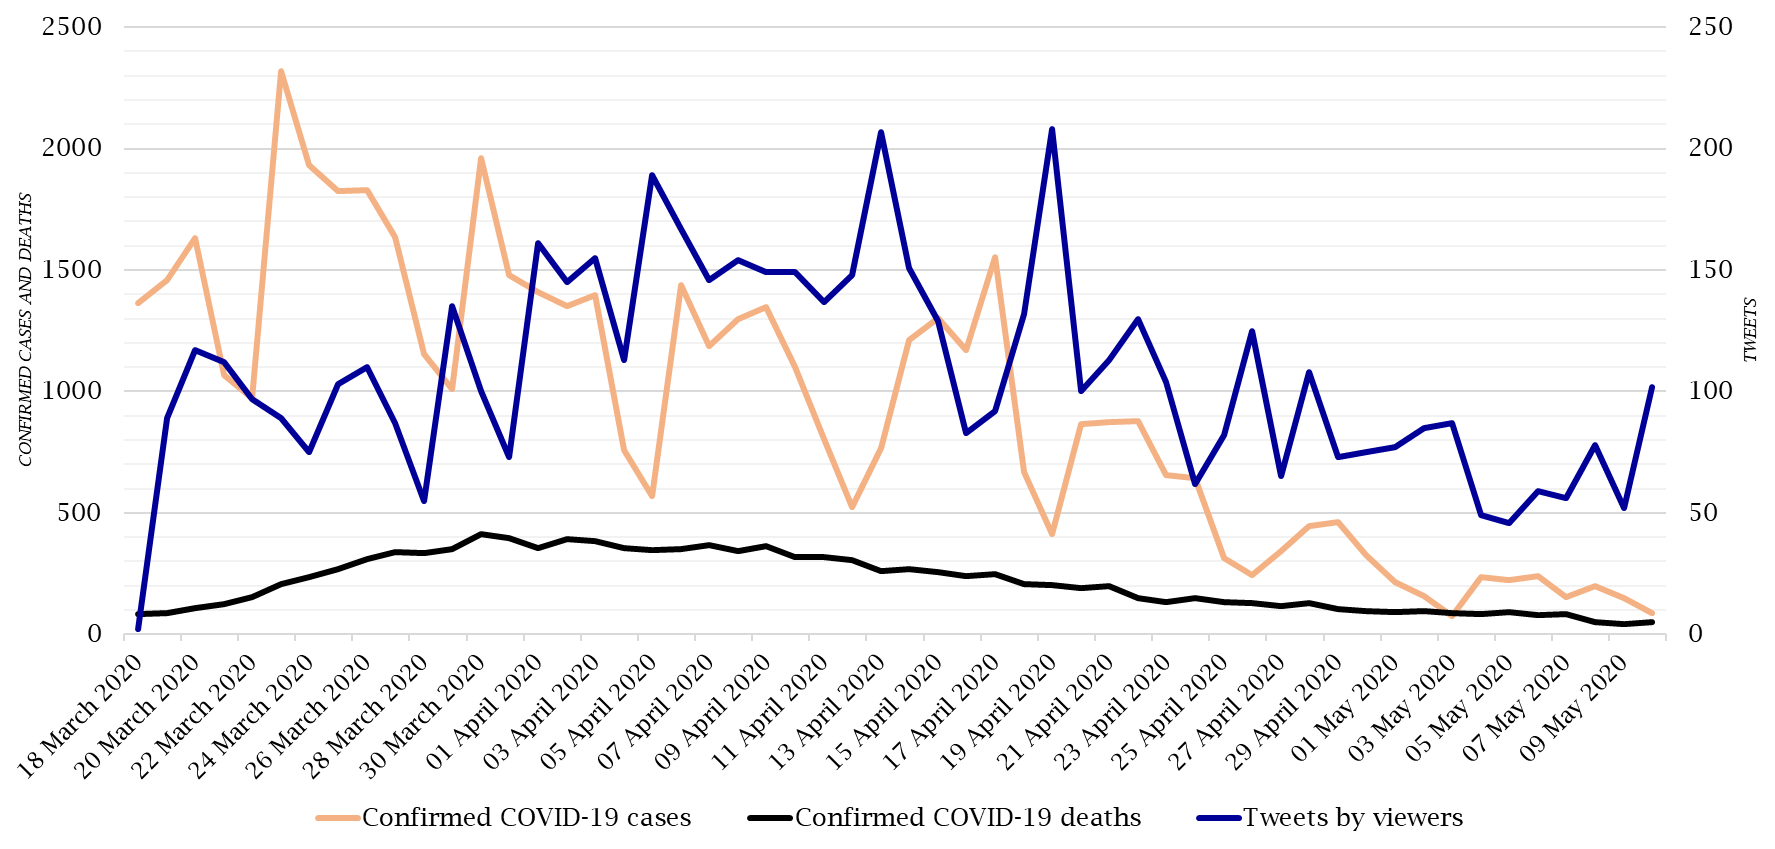
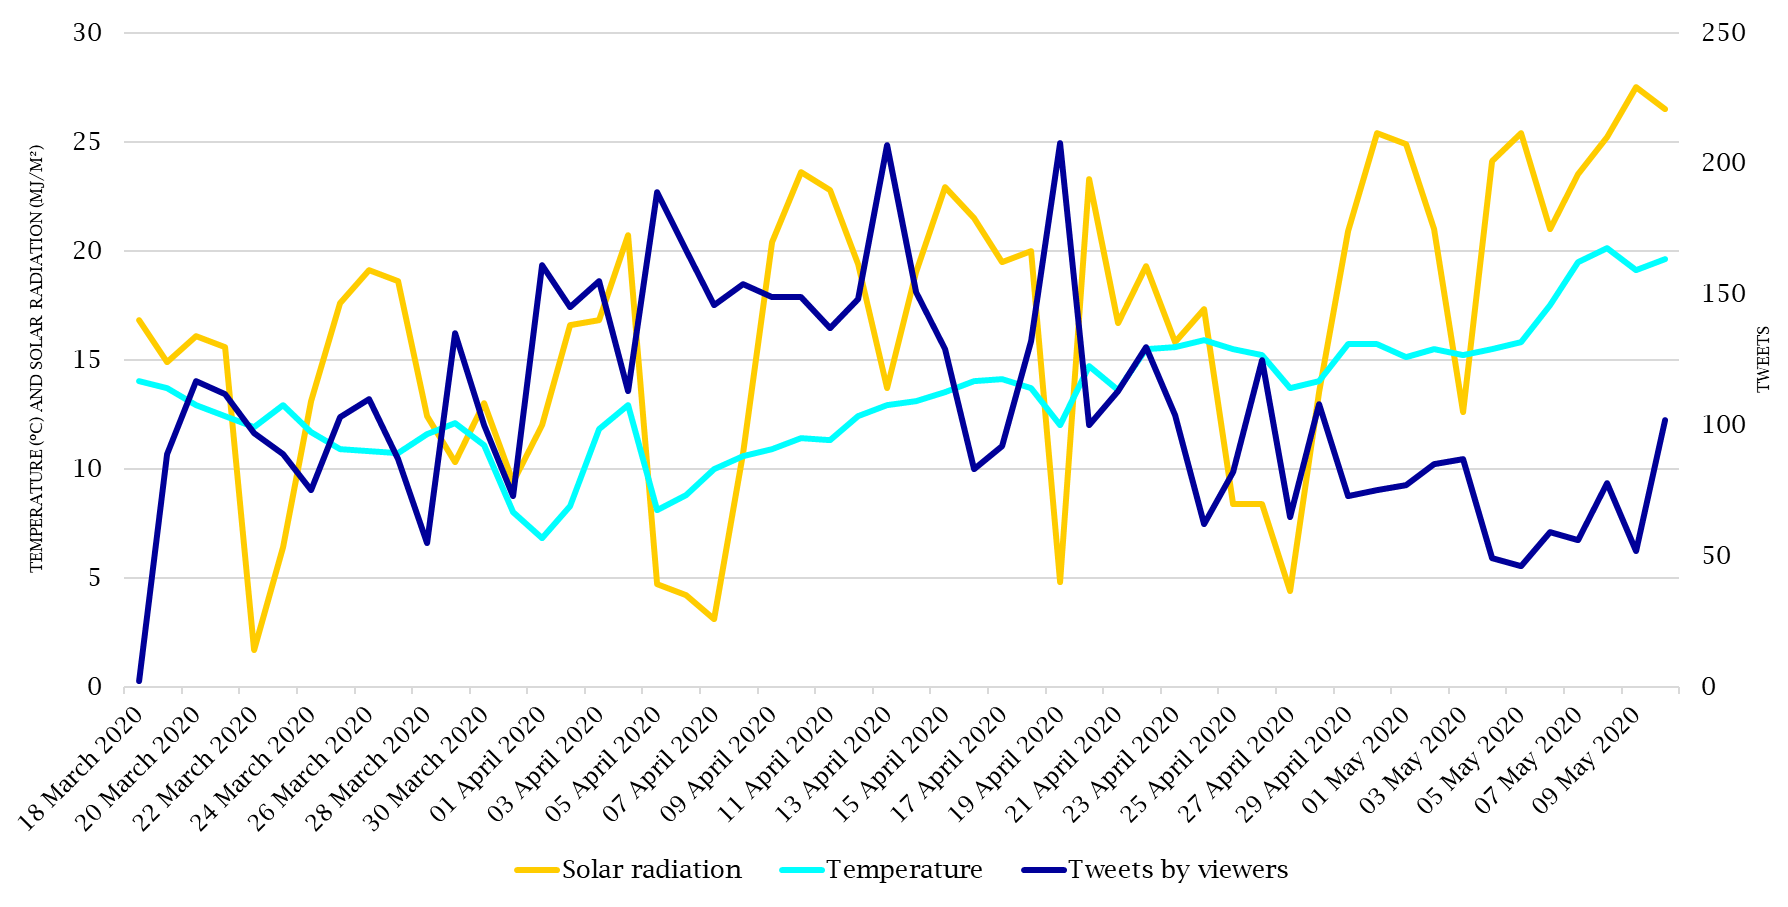
Figure 4 shows participation, mean temperature and mean solar radiation. Participation in the campaign tends to diminish with the increase in temperature and in the amount of solar radiation. It is notable that the days with less solar radiation are those with a significant increase in participation. The maximum participation day, 19 April, with 208 tweets, was a day of extensive and heavy precipitation across Catalonia. The five days with more participation were also correlated with rainy days, while the 5 d with less participation were days with no significant weather nor clouds.
In a visual comparison with the ratio of incidence cases per 100 000 population, and county mean temperature (Fig. 5), we only find that most of the participants came from areas with more population and in this case with more COVID-19 incidence, and also from coastal areas with warmer temperatures.
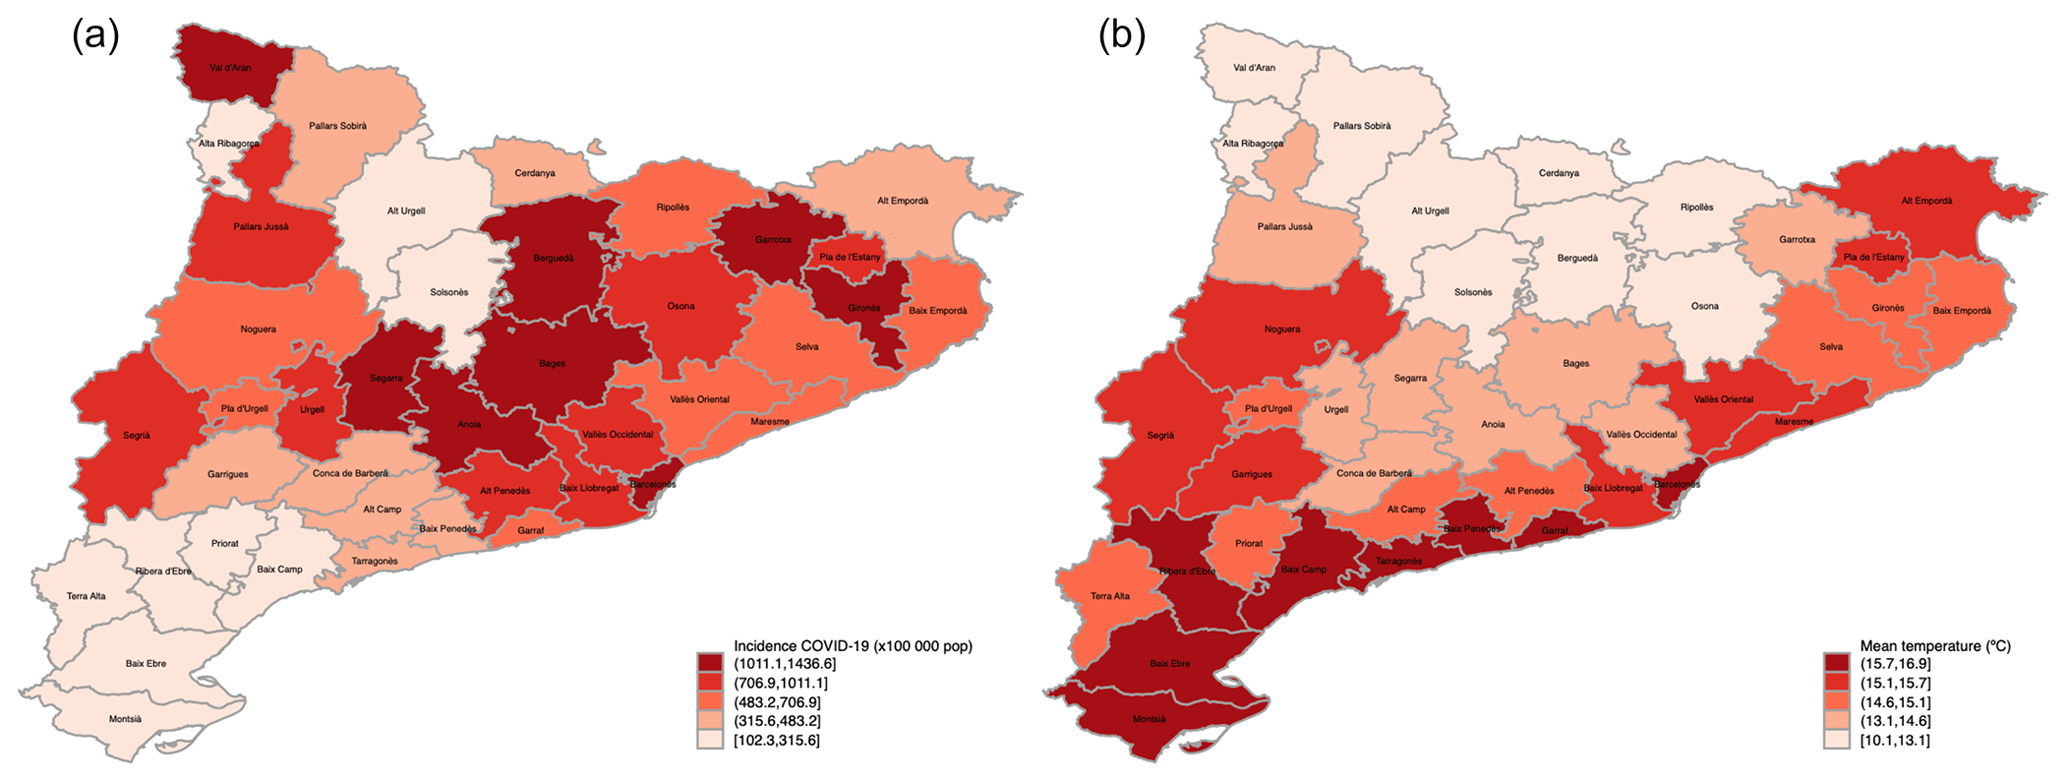
Figure 5(a) COVID-19 incidence (cases per 100 000 pop.); (b) Mean temperature (∘C) (Tobias et al., 2021).
The Covid-19 pandemic affected the mood of people in Catalonia in many ways: the anger of the increasing number of infected persons, the number of daily deaths, the sadness feelings for those who lost beloved ones, and the loneliness and bewilderment of many families. The lockdown period forced an entire society to stay at home, with very few distractions or social interaction.
Social media and TV programs, especially news segments, were – to a large extent – the main source of communication and information from the outside for many. The campaign ElTempsdesdecasaTV3 was a welcomed proposal by people at home, to follow what was happening in other places of the country, giving them something to do and to talk about while in lockdown.
Participation in the campaign had an ascending curve from the beginning of March until mid-April with winter temperatures and few hours of sun. From the second half of the month of April, when the mean temperature was over 15 ∘C and with the increase in sunlight, the participation tendency changed and suddenly decreased.
Rainy days are sparse in Catalonia, around 80 d a year or less in most cities. The days with precipitation, those with sudden decrease in solar radiation (Fig. 4), are the days with more tweets with videos of the campaign. This shows that weather conditions had an immediate effect on people's moods and attitudes, leading to an increase in social media posts related to the campaign.
After 2 May people were allowed to go out from their homes, and participation in the campaign decreased because the mood changed, leading to the suspension of the campaign. The population did not need any more of the campaign, so it was cancelled.
Online dataset published by the Health Evaluation and Quality Agency of Catalonia (AQuAS) for the COVID-19 data. 20 Online dataset published by Catalonia's Meteorological Service (MeteoCat) for the weather data.
TM and AS conceived the idea of this paper. AS extracted the Twitter data and JJ extracted the COVID19 and meteorological data and performed the graphs. TM and AS wrote the manuscript.
The authors declare that they have no conflict of interest.
This article is part of the special issue “Applied Meteorology and Climatology Proceedings 2020: contributions in the pandemic year”.
This paper was edited by Tanja Cegnar and reviewed by Haleh Kootval and one anonymous referee.
Golder, S. A. and Macy, M. W.: Diurnal and Seasonal Mood Vary with Work, Sleep, and Daylength Across Diverse Cultures, Science, 1878–1881, https://doi.org/10.1126/science.1202775, 2011.
Hughes, A. L. and Palen, L.: Twitter adoption and use in mass convergence and emergency events, Int. J. Emergency Management, 6, 248–260, https://doi.org/10.1504/IJEM.2009.031564, 2009.
Kantar media: Medición de audiencias, available at: https://www.kantarmedia.com/es/soluciones/medicion-de-audiencias, last access: 26 January 2021.
Laguna, L., Fiszman, S., Puerta, P., Chaya, C., and Tárrega, A.: The impact of COVID-19 lockdown on food priorities. Results from a preliminary study using social media and an online survey with Spanish consumers, Food Qual. Prefer., 86, 104028, https://doi.org/10.1016/j.foodqual.2020.104028, 2020.
Modoni, G. E. and Tosi, D.: Correlation of weather and moods of the Italy residents through an analysis of their tweets, in: 2016 IEEE 4th International Conference on Future Internet of Things and Cloud Workshops (FiCloudW), IEEE, 216–219, https://doi.org/10.1109/W-FiCloud.2016.53, 2016.
Park, K., Lee, S., Kim, E., Park, M., Park, J., and Cha, M.: Mood and Weather: Feeling the Heat?, Proceedings of the International AAAI Conference on Web and Social Media, 7, available at: https://ojs.aaai.org/index.php/ICWSM/article/view/14451 (last access: 26 January 2021), 2013.
Tobias, A. and Molina, T.: Is temperature reducing the transmission of COVID-19, Environ. Res., 186, 109553, https://doi.org/10.1016/j.envres.2020.109553, 2020.
Tobias, A., Molina, T., Rodrigo, M., and Sáez, M.: Meteorological factors and incidence of COVID-19 in Catalonia (Spain): A MultiI-County study, WMO/AGU Meteorological and Environmental Factors in the COVID-19 Pandemic Symposium, available at: https://agu.confex.com/agu/COVIDsymp2020/meetingapp.cgi/Paper/663692 last access: 26 January 2021.