LES study of precipitation/condensation dependance on cumulus clouds dynamics
LES study of precipitation/condensation dependance on cumulus clouds dynamicsLES study of precipitation/condensation dependance on cumulus clouds dynamicsYefim L. Kogan
NorthWest Research Associates, Inc. Redmond, WA 98052-5164, USA
Abstract
Parameters affecting condensation/evaporation rates (CR/ER) in trade wind cumulus
clouds were analyzed using LES model simulations. The model was initialized
with data observed during the RICO field project, and simulated in a rather
large km3 domain. 2031 clouds were
analyzed seeking relationships between CR/ER and thermo-dynamical cloud
parameters. The condensation/evaporation rates were analyzed by stratifying
the clouds by their size. The analyzed parameters included, among others,
integral mass and buoyancy fluxes, as well as cloud and rain water and drop
concentration.
The results revealed rather remarkable relationship between integral
condensation/evaporation rate and integral upward mass flux. Identified
relathionship may be useful for parameterization of subgrid latent heat in
meso and large-scale models.
Received: 15 Jan 2021 – Revised: 23 Apr 2021 – Accepted: 23 Apr 2021 – Published: 19 May 2021
1 Introduction
The latent heat release plays an important role in predicting the
thermodynamic structure of cumulus convection. Its accurate formulation is
challenging in meso and large-scale models, not least because of sub-grid
scale microphysical variability. The goal of our LES study is to investigate
the phase transition process which is the source of latent heat release in
convective clouds, and, specifically, its dependance on cloud
thermo-dynamical variables. The LES model we use (SAMBM) employs the
dynamical core of the System for Atmospheric Modeling (SAM, Khairoutdinov
and Randall, 2003) and the Bulk Microphysics tuned for shallow Cu convection
(BM, Kogan, 2013). The observations from the RICO field campaign (vanZanten
et al., 2011) were used for initializing the LES simulations conducted in a
rather large km3 domain ( grid points).
Over the course of the 32 h run, the simulation data was saved every 30 min; from this archive a total of 2031 clouds were selected for
analysis. Our initial attempt of using the “brute force” statistical
approach to relate phase transition rates to the dynamical parameters did
not succeed because of the complexity of the cloud system, consisting of
clouds at various stages of their development. A better approach proved to
be separation of the entire dataset into subsets stratified by the cloud
size, maturity, parameters of precipitation.
Specifically, we employed the method used previously for PDF
parameterization development (Kogan and Mechem, 2014, 2016); namely, the
dataset was sorted by cloud top height and divided into four groups G1–G4,
each of which condenses approximately equal amount of water vapor per
second. The groups G1–G2 represented small clouds (1346 in G1 and 483 in
G2). mostly at the growing stage, while groups G3–G4 (137 clouds in G3 and
65 in G4) contained mature or decaying clouds.
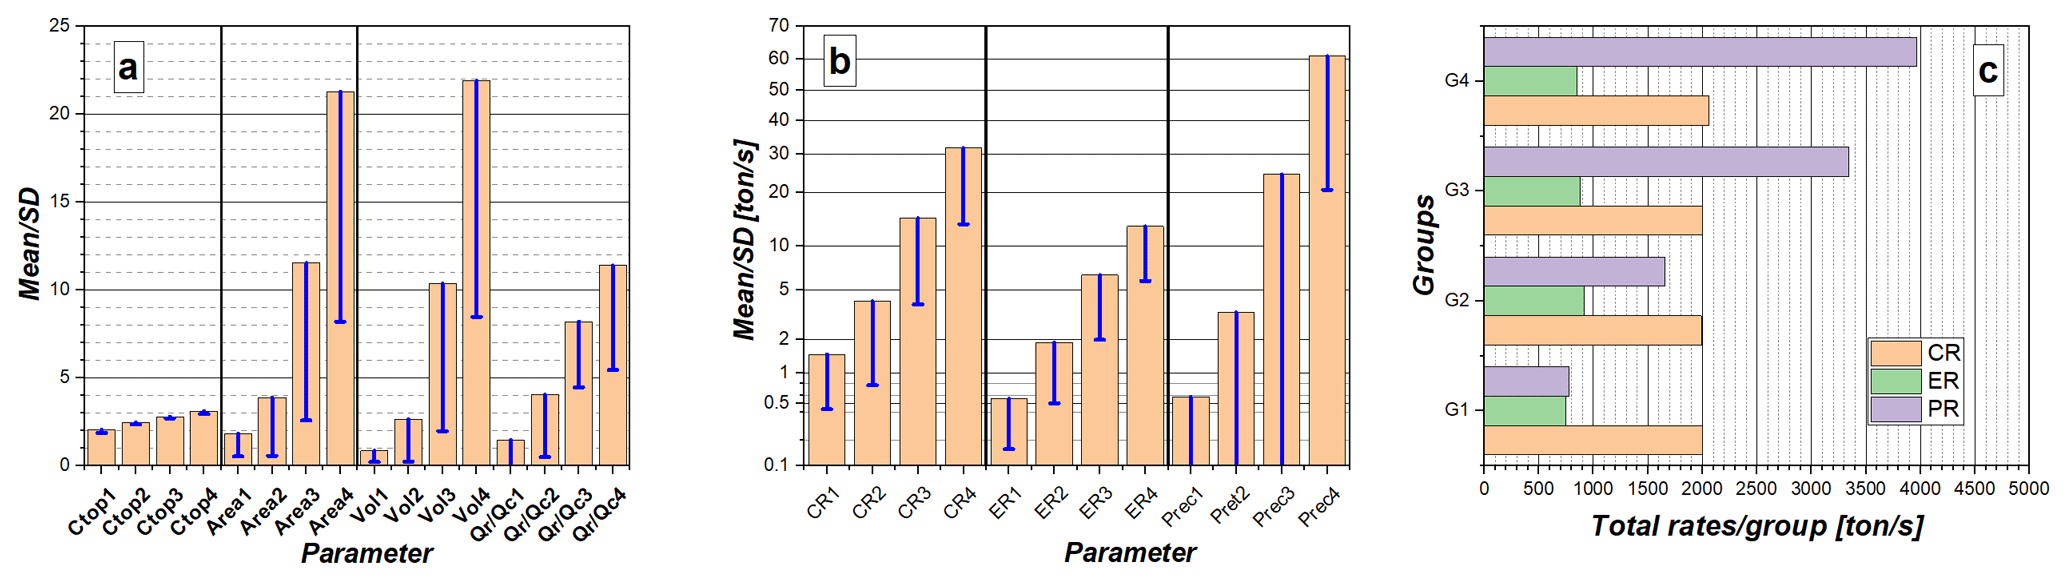
Figure 1Mean and standard deviation of cloud physical parameters in each of
the four groups. (a) cloud top, surface area, volume (Ctop, Area, Vol – in
km, km2, km3, respectively), and rain to cloud water ratio (in
percentages divided by a factor of 10); (b) per cloud
condensation/evaporation and precipitation rate (PR – integrated over the
cloud surface area) in t/s; (c) total CR/ER/PR integrated over the group
(t/s).
Figure 1 shows mean and standard deviation of selected physical and
precipitation cloud parameters in each group. G1 clouds are most numerous;
they are also the smallest with cloud tops varying in the range from 1.34 to
2.3 km. Their mean projected surface area is on average less than 2 km2
and mean volume is less than 1 km3. The linear increase by only 300 m
in cloud height from G2 to G3, and further to G4 is accompanied by an
exponential increase in cloud area and volume (Fig. 1a), as well as cloud
and rain water (not shown). Ratio of rain to cloud water growth seems to be
lagging behind the growth of cloud volume, e.g., nearly nine-fold increase
in cloud volume from G2 to G4 results in less than three-fold increase in
QR4/QC4. This does not imply, however, that larger clouds condense less
effectively; it simply reflects the acceleration in rain formation as clouds
grow larger.
Mean condensation/evaporation rates (CR/ER) shown in Fig. 1b are more in line
with the increase in volume (note the probability scale on the y-axis). So,
about nine-fold increase in Vol4/Vol2 ratio corresponds to about eight time
increase in CR4/CR2, and about seven times increase in ER4/ER2. Obviously,
the majority of clouds in groups G1 and G2 are at a growing stage, as their
condensation rates are larger than the precipitation rates (PR), while the
opposite is true for larger clouds in G3–G4 (Fig. 1b).
Even larger, exponential increase is seen when analyzing PR. For clouds in G1
PRs are very small, only 0.6 mm/h. Clouds in G2 are three time larger in
volume, but their PRs are six times larger. The clouds in G3 have about four
times larger volumes than G2 clouds, but their PRs increase more than seven
times. Even more dramatic difference exists for G4 clouds, where nine times
increase in volume leads to 18 times larger precipitation rates.
While Fig. 1a–b show mean cloud parameters in each group, the Fig. 1c shows
total contribution of these parameters, i.e. integrated over the whole group.
Each group, by design, contributes approximately equal amount of
condensation per second. The fraction of evaporation to condensation rates
(ER/CR) is on average about 40 %–45 %. This fraction is smaller for G1 and
G4 clouds (37.4 % and 41.4 %), while larger for G2–G3 clouds (45.9 % and
44.0 %). Evidently, G1 clouds are predominantly growing, therefore
evaporation lags behind condensation, while G2–G3 clouds are at a mature
stage, and have already well formed quasi-stable dynamical updraft/downdraft
structure where condensation and evaporation ls balanced. Larger rain water
content in G4 clouds contributes more to precipitation and somewhat less to
evaporation, which may explain the reduced fraction of evaporation in G4
(41.4 %) compared to G3 clouds.
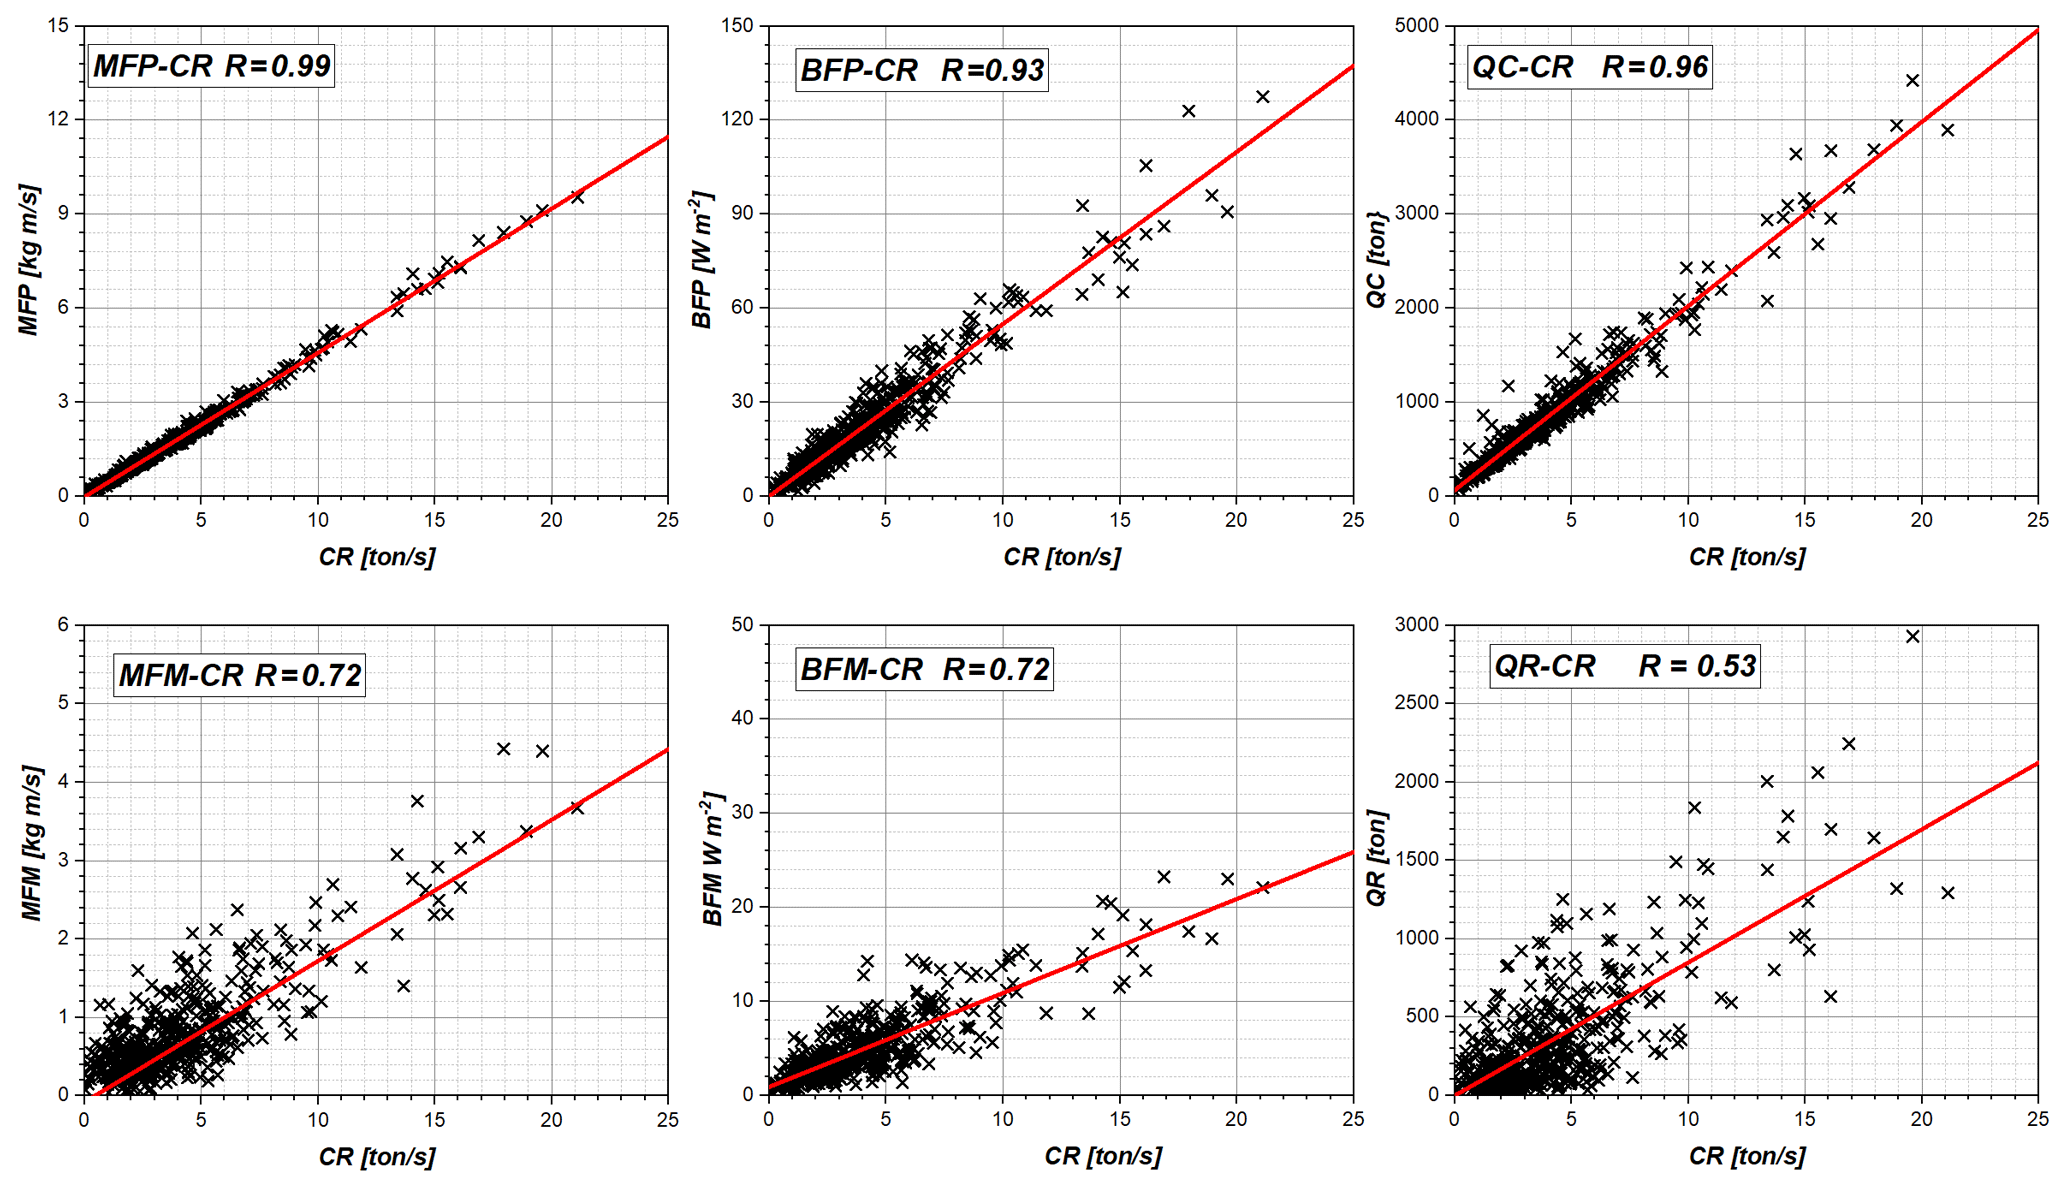
Figure 2Correlation of condensation rate (CR) with parameters denoted in plot
legends. Group G2 R is the correlation coefficient.
Together G4 and G3 account for three quarter of total precipitation; G1 and
G2 contribute, respectively 8 % and 17 %. As already mentioned, these groups
precipitate less than condense, i.e., they are still growing, while G3, and
especially G4 clouds precipitate about 70 % and 100 % more than condense,
that is, they are losing water and, therefore, at the stage of decay.
Analysis of correlation between CR/ER and the thermodynamical parameters which
may affect CR/ER was conducted for clouds in each group separately. The analyzed
parameters were integrated over the whole cloud volume. These include: up
and down mass flux MF (defined as air density ρ times vertical velocity:
ρW), cloud and rain water content (QC and QR), up and down buoyancy flux
BF (defined as . where cp is the specific heat of
air and θ′ is the virtual temperature perturbation). As the variables
were integrated over the whole cloud, and the size of the cloud volume is on
the order of billions of cubic meters, it is convenient to normalize the
variables by a unit volume V0=109 m3 (≡1 km3).
Figure 3Correlation plots of: (a–d) ER with mass and buoyancy flux for G2
clouds, (e–f) – CR/ER with upward mass flux MFP for clouds from
all groups combined. R is the correlation coefficient, S is the slope of
the linear fit shown by the red line.
Figure 2 shows, as an example, results of the correlation analysis for clouds
in G2; the results for clouds in other groups are similar. One can note
exceptionally high correlation between condensation rate and upward (Plus)
mass flux (MFP). Correlation between CR and upward buoyancy flux (BFP) is also high,
but weaker than with MFP. Similar strong correlation exists with cloud water
QC. As one might expect, the correlation between condensation and downward
(Minus) fluxes (MFM, BFM), as well as rain parameters (QR) is weaker. For other
cloud groups results are similar with the same conclusion: the strongest
correlation is between CR and MFP.
The evaporation rate (ER) (Fig. 3) also has stronger correlation with the
upward (MFP) than with downward mass flux (MFM) (Fig. 3a–b). Buoyancy flux
determines ER worse than upward mass flux (Fig. 3c–d), however, its downward
component (BFM) correlates with ER slightly stronger than its upward component
BFP. All in all, it is rather remarkable that the upward mass flux is the
parameter which defines both condensation and evaporation in a cloud.
What is also remarkable, is that the slope of the linear fit approximating
the correlation between CR/ER and MFP only slightly depends on cloud group, i.e., on
cloud top height. The scatter plots in Fig. 3e–f illustrate this fact which
can be expressed as a linear relationship between phase transition rate
(PTR) and upward mass flux:
where α= 2.06 for condensation (PTR ≡ CR) and α=−0.85 for evaporation (PTR ≡ ER).
3 Conclusion
Based on the LES model data, we analyzed condensation/evaporation
parameters, and their correlation with thermodynamical parameters of
trade-wind cumulus convective clouds. A very strong correlation was found
not only between the condensation, but also evaporation rate and upward mass
flux (all parameters were integrated over the whole cloud volume). While
good correlation between the upward mass flux and condensation is not
surprising (obviously due to larger supersaturation in stronger updrafts),
the very high correlation coefficient (R=0.99), as well as the role of the
upward mass flux in determining the evaporation rate, is remarkable. Whether
this finding will hold for vertically dependent variables needs to be
further investigated.
Code availability
The software code for data analysis was developed by the author and is available upon request.
Data availability
Analysis data is available upon request from the author.
Competing interests
The author declares that there is no conflict of interest.
Special issue statement
This article is part of the special issue “Applied Meteorology and Climatology Proceedings 2020: contributions in the pandemic year”.
Acknowledgements
This investigation was supported by ONR Grant
N00014-20-1-2050. The author is grateful to Vaughan Phillips and
anonymous reviewer for constructive comments. The computing for this project
was performed at the OU Supercomputing Center for Education and Research
(OSCER) at the University of Oklahoma.
Financial support
This research has been supported by the Office of Naval Research (grant no. N00014-20-1-2050).
Review statement
This paper was edited by Emily Gleeson and reviewed by Vaughan Phillips and one anonymous referee.
References
Khairoutdinov, M. F. and Randall, D. A.: Cloud resolving modeling of
the ARM summer 1997 IOP: Model formulation, results, uncertainties, and
sensitivities, J. Atmos. Sci., 60, 607–625, 2003.
Kogan, Y. L.: A Cumulus Cloud Microphysics Parameterization for
Cloud-Resolving Models, J. Atmos. Sci., 70, 1423–1436, 2013.
Kogan, Y. L. and Mechem, D. B.: A PDF based microphysics parameterization
for shallow cumulus clouds, J. Atmos. Sci., 71, 1070–1089, 2014.
Kogan, Y. L. and Mechem, D. B.: A PDF-Based Formulation of Microphysical
Variability in Cumulus Congestus Clouds, J. Atmos. Sci., 73, 167–184, 2016.
VanZanten, M. C., Stevens, B., Nuijens, L., Siebesma, A. P., Ackerman, A. S., Burnet, F., Cheng, A., Couvreux, F., Jiang, H., Khairoutdinov, M., Kogan, Y., Lewellen, D. C., Mechem, D., Nakamura, K., Noda, A., Shipway, B. J., Slawinska, J., Wang, S., and Wyszogrodzki, A.: Controls on precipitation and cloudiness in simulations of trade-wind cumulus as observed during RICO, J. Adv. Model. Earth Syst., 3, M06001, https://doi.org/10.1029/2011MS000056, 2011.
Based on the LES model data, a very strong correlation was found not only between the condensation, but also evaporation rate and upward mass flux. While good correlation between the upward mass flux and condensation is not surprising, the very high correlation coefficient (R = 0.99), as well as the role of the upward mass flux in determining the evaporation rate, is remarkable and may be important for future latent heat parameterization development.
Based on the LES model data, a very strong correlation was found not only between the...