 | 17 Nov 2023
Intercomparing the quality of recent reanalyses for offshore wind farm planning in Germany's exclusive economic zone of the North Sea
Thomas Spangehl
Michael Borsche
Deborah Niermann
Frank Kaspar
Semjon Schimanke
Susanne Brienen
Thomas Möller
Maren Brast
In order to facilitate offshore wind farm tenders, Deutscher Wetterdienst (DWD, Germany's national meteorological service) provides reanalysis data and quality assessments to Bundesamt für Seeschifffahrt und Hydrographie (BSH, Federal Maritime and Hydrographic Agency). The regional reanalysis COSMO-REA6 is used besides the global reanalysis ERA5. New reanalyses and derived products getting available are (i) the regional reanalysis CERRA (C3S), (ii) COSMO-R6G2, a successor of COSMO-REA6 which is currently produced by DWD and (iii) HoKliSim-De, a convection-permitting climate simulation for Germany with COSMO-CLM as a regional downscaling of ERA5. In the present study, the quality of the different data sets for offshore wind energy application is compared using in-situ measurements of the wind speed and wind direction from the top anemometer and vane of the FINO1 research platform and satellite-based data of the near-surface wind speed from the Copernicus Marine Environment Monitoring Service (CMEMS) and the EUMETSAT Satellite Application Facility on Climate Monitoring (CM SAF).
Evaluation at FINO1 focuses on the time period prior to the installation of nearby wind farms to avoid wake effects. COSMO-REA6, CERRA and HoKliSim-De show only small biases and resemble the observed distribution of the wind speed at FINO1 whereas ERA5 shows slightly lower values of the wind speed at 100 m. All model-based products tend to slightly underestimate the occurrence of south-westerly wind directions and overestimate wind directions from West to Northwest. Smallest directional biases are analysed for COSMO-REA6. Analysis of the windstorm CHRISTIAN suggests that ensemble information is required for the representation of individual extreme events.
Evaluation of the near-surface wind speed using satellite-based data is performed for an area around the German Exclusive Economic Zone (EEZ) of the North Sea. The median bias of ERA5 and COSMO-REA6 is close to zero. CERRA shows a systematic overestimation of the near-surface wind speed compared to the satellite-based reference datasets. By contrast, a slight underestimation is analysed for HoKliSim-De. The bias distribution analysed for a first simulation stream of COSMO-R6G2 is similar to COSMO-REA6 which provides initial indication for the applicability of the new product.
- Article
(1963 KB) - Full-text XML
- BibTeX
- EndNote


The German energy transition demands the increasing usage of renewable energy resources. According to the latest German legislation the proportion of renewable energy in total electricity needs shall rise to more than 80 % by 2030 and reach 100 % in 2035. One contribution to reach these goals is the increased construction of wind farms within the German Exclusive Economic Zone (EEZ). Following the Offshore Wind Energy Act as amended in 2022 and entered into force on 1 January 2023 (Ger. Windenergie-auf-See-Gesetz, Ger. abbr. WindSeeG 2023, WindSeeG, 2023) the installed capacity of offshore wind energy installations shall increase to a total of at least 30 GW by 2030, to a total of at least 40 GW by 2035 and to a total of at least 70 GW by 2045. On 31 December 2021 there were 7.8 GW installed (BNetzA, 2023).
The effective usage of the available space and the economic and environmental planning require knowledge on the meteorological and climatological conditions. Detailed information of the frequency distribution of the wind speed and wind direction is required for individual wind farm planning. The interannual variability needs to be addressed, e.g. to assess the representativeness of typically one-year long on-site measurement campaigns. Information on the geographical distribution and temporal variability of the wind speed and direction is needed for planning of the energy system including power supply facilities and offshore areas for site tenders. As wind speed profiles and turbulence rely on the atmospheric stability, additional insight is gained by the representation of the atmospheric boundary layer.
Global and regional atmospheric reanalyses provide detailed information of the wind speed and wind direction at hub heights of modern wind turbines. In order to facilitate offshore wind farm tenders, Deutscher Wetterdienst (DWD, Germany's national meteorological service) provides reanalysis data and quality assessments to Bundesamt für Seeschifffahrt und Hydrographie (BSH, Federal Maritime and Hydrographic Agency). Currently, the regional reanalysis COSMO-REA6 (Bollmeyer et al., 2015), maintained by DWD, is used besides the global reanalysis ERA5 (Hersbach et al., 2020), produced by the European Centre for Medium-Range Weather Forecasts (ECMWF).
Recently the Copernicus European Regional Re-Analysis (deterministic system, CERRA-DET and ensemble of data assimilations, CERRA-EDA (cf. Wang and Randriamampianina, 2021)), funded by the European Commission, has been made available (Schimanke et al., 2021a, b). Moreover, DWD currently produces COSMO-REA6 Generation 2 (COSMO-R6G2) constituting a successor of COSMO-REA6 (Kaspar et al., 2020). Furthermore, a convection-permitting climate simulation for Germany with COSMO-CLM, as a regional downscaling of ERA5, was produced by DWD and selected variables were published (Brienen et al., 2022).
Several sources of observational data are available for quality assessment of the model-based products. In January 2002, the Federal Government of Germany decided the construction of three research platforms (FINO1, FINO2 and FINO3) in the North Sea and the Baltic Sea, in order to foster the exploitation of renewable energy by the use of offshore wind turbines (https://www.fino-offshore.de/, last access: 6 November 2023). The first platform, FINO1 located in the North Sea, was commissioned in September 2003. FINO measurements were already used by a number of studies as a reference for the evaluation of wind speed variability in different reanalysis products (e.g. Borsche et al., 2016; Niermann et al., 2019; Brune et al., 2021).
While the FINO measurements are restricted to a specific geographic location satellite-based data provide information on the near-surface wind field. A series of studies (Winterfeldt et al., 2011; Geyer et al., 2015; von Storch et al., 2017) rely on near-surface winds retrieved from the SeaWinds scatterometer on board QuikScat to demonstrate the added value of regional hindcasts over the driving global reanalysis.
Wind information from satellite borne instruments such as scatterometer or radiometer is based on measurements in the microwave spectrum. Here the wind driven gravity and capillary waves on the sea surface backscatter the radar beam or influence the surface emissivity and hence the upwelling radiance. Thus, the retrieved wind information is most representative for the level directly above the sea surface (Andersson et al., 2010; Winterfeldt et al., 2011).
Methods are available to estimate the wind speed at hub heights of modern offshore turbines from the near-surface wind speed (Sedefian, 1980; Hsu et al., 1994). Under neutral atmospheric stability conditions the assumption of a logarithmic wind speed profile can be made. Moreover, Monin-Obukhov theory provides empirical formulas to estimate wind speed profiles for non-stable and stable conditions, all showing increasing wind speed with height. However, depending on the state of the atmosphere this is not always applicable.
For example, during spring the thermal land sea contrast and differences in surface roughness favour the occurrence of low-level jets (LLJ) which show maximum wind speeds at heights between 50 and 200 m (Kalverla et al., 2019). Similarly, Rausch et al. (2022) find a maximum occurrence of LLJ's during spring and summer and a most frequent jet core height of around 120 m a.g.l. (above ground level) when analysing ground based wind lidar and radiosonde data for coastal areas of the German Bight.
When verifying model-based data with observations care must be taken that wake effects from individual turbines and large-scale wake effects from wind farms are commonly not sufficiently represented in reanalyses and climate simulations. At FINO1 the commissioning and operation of nearby wind farms leads to a significant reduction of the annual mean wind speed after 2009 which is not seen in reanalyses (Podein et al., 2022). There is multiple evidence from satellite imaginary, research aircraft measurements and numerical model simulations that the wakes from large wind farms can be several tens of kilometres in length under stable atmospheric stratification (Platis et al., 2018). Wakes of more than 100 km length are seen for very large wind farms in large eddy simulations (Maas and Raasch, 2022) under certain meteorological conditions.
Moreover, high-resolution climate model simulations employing a wind farm parameterization that considers the wind turbines as a sink of kinetic energy (KE) and source of turbulent kinetic energy (TKE) at rotor height indicate a distinct effect of offshore wind farms on power generation downstream of wind farms as well as on the near-surface wind field and climate (Akhtar et al., 2021, 2022).
In the present study the quality of recent regional reanalyses for offshore wind farm planning in Germany's EEZ of the North Sea is assessed and compared to the quality of simulations without data assimilation by using in-situ observations from FINO and satellite-based data products as observational reference.
The structure of the manuscript is as follows. Section 2 introduces the reanalysis, simulation and observational data. In addition, the statistical methods used for evaluation are briefly discussed. Results are presented in Sect. 3 focusing on interannual to multi-annual variability of wind speed, frequency distribution of wind speed and wind direction, and assessment of extreme wind speeds during wind storm CHRISTIAN at near-turbine hub height using FINO1 measurements as reference. Wind storm CHRISTIAN, 27–29 October 2013, led to severe damage in Western and Central Europe. Furthermore, the spatial variability of near-surface wind speed using different satellite-based data products as reference is assessed. Section 4 provides discussion of results and conclusions.
In this section the used regional and global reanalyses, the simulations without data assimilation, the in-situ observations, and satellite-based data products are described. Moreover, the methods used to process (time series manipulation, regridding) and statistically analyse (histogram, shape parameters, box-plot) the data are briefly explained.
2.1 Reanalyses
2.1.1 COSMO-REA6
The regional reanalysis COSMO-REA6 was developed within the Hans-Ertel-Centre for Weather Research (Kaspar et al., 2020). COSMO-REA6 is based on DWD's former operational NWP model COSMO. The model is well documented and has intensively been used by the meteorological community. The regional reanalysis is based on COSMO model version 4.25 which was operational at DWD from 26 September to 12 December 2012. The model domain is adjusted to match the EURO-CORDEX region. The configuration used incorporates a horizontal resolution of 6 km with a non-hydrostatic model formulation. In the vertical the terrain following hybrid coordinate system consists of 40 main levels with 10 levels in the lowest 1000 m. The top level is located at 22 700 m (∼40 hPa). The numerical core of the model is integrated with a time step of 50 s. For data assimilation COSMO-REA6 employs a Newtonian relaxation scheme (nudging) to combine prognostic model variables with observations. Observations of wind, temperature, humidity, geopotential and station pressure are assimilated stemming from radiosondes, SYNOP stations, ships, buoys or aircrafts. No satellite data is assimilated by COSMO-REA6. In addition, an external analysis scheme is used for (i) snow depth, (ii) sea surface temperature and sea ice and (iii) soil moisture. The soil moisture scheme uses 2 m temperature observations for the derivation of optimized soil moisture fields. It should be noted that the assimilation of non-conventional observations such as satellite data (radiances) is not always possible by the nudging technique, as the observations have to be available in the model space rather than the observation space (Bollmeyer et al., 2015). Data from the global reanalysis ERA-Interim (6-hourly data) serves as boundary for COSMO-REA6. More details on the configuration and results of the regional reanalysis system are specified by Bollmeyer et al. (2015). Data of COSMO-REA6 is publicly available as part of DWD's open data (https://opendata.dwd.de/climate_environment/REA, last access: 6 November 2023). An overview of evaluation studies and application examples with a focus on renewable energy is illustrated by Kaspar et al. (2020).
2.1.2 COSMO-REA2
COSMO-REA2 is a convective-scale reanalysis nested into COSMO-REA6. The model domain constitutes a slightly enlarged version of COSMO-DE thereby covering Germany and adjacent areas. COSMO model version 5.00.2 is used. The horizontal resolution is about 2 km. There are 50 vertical levels with the model top at 22 km. In addition to the continuous nudging of conventional observations a latent heat nudging scheme is used. A detailed description of COSMO-REA2 is given by Wahl et al. (2017).
2.1.3 COSMO-REA6 Generation 2 (COSMO-R6G2)
In order to extend the COSMO-based reanalysis and to provide regional reanalysis data with short delay from real time DWD is currently producing a successor of COSMO-REA6 (COSMO-REA6 Generation 2, hereafter referred to as COSMO-R6G2) using ERA5 as boundary conditions and a newer model version (Kaspar et al., 2020). Hourly data from ERA5 is used as lateral boundaries. Moreover, the benefit of incorporating ERA5T to generate near real-time data has to be evaluated. COSMO model Version 5.04d was operationally used by DWD from 12 December 2016 to 23 March 2017 and is the latest model version that was operationally used with nudging. Therefore, COSMO-R6G2 uses COSMO model version 5.04d4. Here we present results from a first simulation stream for 2018.
2.1.4 ERA5
ERA5 is the fifth generation ECMWF atmospheric reanalysis and covers the period from 1940 to present. It is based on the Integrated Forecasting System (IFS) Cy41r2 which was operational in 2016 (Hersbach et al., 2020). The spatial horizontal resolution is 0.28∘ or 31 km (spectral truncation T639). In the vertical there are 137 levels from the surface to the model top located at 0.01 hPa or 80 km. 4DVar is used for the assimilation of a variety of conventional and satellite based observational data. ERA5 includes information about uncertainties for all variables at reduced spatial and temporal resolutions. Quality-assured monthly updates of ERA5 are published within 3 months of real time. Preliminary daily updates of the dataset are available to users within 5 d of real time. A detailed description and evaluation results are given by Hersbach et al. (2020). Access to the data is provided by Meteorological Archival and Retrieval System (MARS) and Copernicus Climate Data Store (CDS).
2.1.5 Copernicus European Regional Re-Analysis (CERRA)
The CERRA system builds on the HARMONIE script system cycle 40h1.2. Several changes and optimisations in the script system have been made, compared to the reference version of HARMONIE, to make the model run more efficiently in a re-analysis production environment. The ALADIN synoptic scale physics scheme is used including several updates from later cycles that are backported to fit with cy40h1.2. The model runs with a 5.5 km horizontal grid spacing and with 106 vertical levels. The model domain is somewhat larger than the Euro-CORDEX domain. It runs with a 3 h cycle producing 6 h forecasts at all analysis times except at 00:00 and 12:00 UTC where 30 h forecasts are produced. Information about sea surface temperature and sea ice are obtained from the Operational Sea Surface Temperature and Sea Ice Analysis (OSTIA) database (Donlon et al., 2012; Stark et al., 2008). The boundary information is taken from the ERA5 output. Upper air observations are introduced into the model through a three-dimensional variational (3D-Var) data assimilation scheme (e.g. Gustafsson et al., 2001; Lindskog et al., 2001; Brousseau et al., 2008). Included observations are the conventional observations, i.e. observations from SYNOP stations, ships, buoys aircrafts and radiosondes, together with satellite radiances from the early Microwave Sounding Unit (MSU) to the latest Infrared Atmospheric Sounding Interferometer (IASI). In addition, ground-based Global Navigation Satellite Systems (GNSS), radio occultation GNSS, scatterometer winds, atmospheric motion vectors and surface observations from local sources are used in the analyses. A new way of creating and updating the background error covariance matrix is used in order to follow the current weather regime and to allow for possible evolutions in the weather over the reanalysis period (El-Said et al., 2022). The surface assimilation uses an optimal interpolation assimilation scheme for the surface observations (e.g. Taillefer, 2002; Seity et al., 2011). The observations included are relative humidity and temperature at 2 m height obtained from SYNOP stations as well as the snow water equivalent. Also, for the surface assimilation additional observations from local sources are included. In the present study the 10 and 100 m wind speed and direction of CERRA are used (Schimanke et al., 2021b, a). The following data is used from the deterministic system (CERRA-DET). Monthly averages of the 10 m wind speed are calculated from the 3-hourly analyses (hereafter referred to as CERRA-an). The hourly 100 m wind speed and direction are obtained from forecasts (CERRA-fc) using lead time hours T+1, T+2 and T+3 (T = analysis time step). Direct comparison of CERRA-an and CERRA-fc reveals only small differences. In addition to CERRA-DET, hourly data of 100 m wind speed from the ensemble of data assimilations (CERRA-EDA, lead time hours T+1, …, T+6 used) is analysed. CERRA-EDA is a 10-member ensemble of 3D-Var data assimilations with a 6 h cycle and 11 km horizontal grid spacing.
2.2 Simulations without data assimilation: climate simulation (COSMO-CLM) and wind atlas (WRF)
2.2.1 High resolution simulation with COSMO-CLM (HoKliSim-De)
HoKliSim-De (“High resolution COSMO-CLM climate simulation with ERA reanalysis forcing for Germany”) is a nearly 50-year dataset which downscales the European reanalysis datasets ERA40 (Uppala et al., 2005, for the years 1971–1978) and ERA5 (Hersbach et al., 2020, for 1979–2019) on a higher-resolution grid for Germany. The regional climate model COSMO-CLM (COSMO model in CLimate Mode; Rockel et al., 2008; Steger and Bucchignani, 2020) is used for this downscaling in a convection-permitting setup. The COSMO-CLM is the climate version of the limited-area weather forecast model COSMO (Baldauf et al., 2011; Doms et al., 2013) and it is the community model of the German regional climate research community jointly further developed by the CLM-Community (http://www.clm-community.eu, last access: 6 November 2023). It has been proven to be suitable for regional climate model simulations at grid scales between 1 and 50 km in Central Europe in numerous studies (e.g. Berg et al., 2013; Kotlarski et al., 2014; Brienen et al., 2016; Ban et al., 2021). In a recent study by Borgers et al. (2023), COSMO-CLM is evaluated and used to study cluster-scale wake effects of wind farms in the North Sea.
A horizontal grid spacing of 0.0275∘ (∼3 km) is used together with 50 vertical levels and 25 s time stepping. The simulation starts in December 1969 with 13 months spin-up time and is extended regularly close to real-time. Currently, the most commonly used variables of this dataset are available for the time period 1971–2019 on the DWD node of the ESGF (Earth System Grid Federation) as version V2022.01 (https://esgf.dwd.de/projects/dwd-cps/hoklisim-v2022-01, last access: 6 November 2023, Brienen et al., 2022). The model domain covers 461x481 grid points and is centered around Germany. The forcing at the lateral boundaries has been updated every hour for the ERA5 period in a direct nesting approach. For ERA40, 6-hourly boundary data from an intermediate nesting simulation at 0.11∘ (∼12 km) have been used, which had been run using the same configuration as in the EURO-CORDEX-CMIP5 simulations with COSMO-CLM (see e.g. Kotlarski et al., 2014; Vautard et al., 2021). For this study, the wind components which have been interpolated inside the model to the 100 m a.g.l. are investigated.
2.2.2 NEWA (New European Wind Atlas)
The New European Wind Atlas (NEWA) covers the 30-year period from 1989 to 2018. The Weather Research and Forecasting (WRF) model was used together with ERA5 as driving reanalysis for a series of one-way nested simulations. The simulation’s design is optimised to represent wind speed distributions in complex terrain. Three nested domains with a resolution of 27, 9 and 3 km were used. Spectral nudging was applied in the outer domain to incorporate the observed large-scale atmospheric patterns. The simulations consist of 7 d periods using a spin-up of 24 h to achieve equilibrium of the mesoscale flow with the terrain. In the vertical the model incorporates 61 levels with the model top at 50 hPa. Data is available for 30 min intervals for wind energy relevant parameters. Details are given by Hahmann et al. (2020) and Dörenkämper et al. (2020). Data for 2005–2018 is publicly available via the website https://map.neweuropeanwindatlas.eu/ (last access: 6 November 2023). The WRF model output was further downscaled to create the microscale atlas. In the present study the mescoscale data at 3 km resolution is used.
2.3 FINO observations
2.3.1 FINO (Ger. Forschungsplattformen in Nord- und Ostsee)
The FINO research platforms facilitate the exploration of offshore conditions and help to determine the effects of offshore wind energy development on marine flora and fauna. Masts have been erected on the working platforms of FINO1, FINO2 and FINO3, on which the most important meteorological parameters, in particular wind speed and direction at different heights, are measured. In addition, a complete set of hydrographic data is collected. Moreover, the forces induced by wind and waves are measured in the foundation area (Leiding et al., 2016).
In the present study measurements of wind speed and direction at FINO1 are used. Wind direction data is taken from the highest measurement level available for this parameter at 91 m a.m.s.l. (above mean sea level). The wind speed time series stems from the top anemometer at 102 m a.m.s.l. At this height the effect of the mast on the wind speed measurement is assumed to be small. The mast effect is corrected by applying a mast correction to the wind speed data (Leiding et al., 2016). The mast correction depends on the wind direction. The simultaneous wind direction measurement of the wind vane at 91 m is included in each corrected wind speed value in order to be able to carry out the mast correction (UL International GmbH, personal communication, 2022). Moreover, measurements are influenced by a lightning protection cage which leads to slightly lower wind speeds in 4 narrowly pronounced wind direction sectors (Leiding et al., 2016). Here we estimate the overall error for all wind directions to be less than 1 %. The time series of wind speed and direction consist of 10 min averages. Hourly data at full hours is used to enable comparability with available model output data. Additional information on measurement uncertainties and data availability is indicated by Leiding et al. (2016).
2.4 Satellite observations
2.5 Copernicus Marine Environment Monitoring Service or Copernicus Marine Service (CMEMS)
Monthly averaged near-surface wind speed is obtained from CMEMS. The CMEMS wind product WIND_GLO_PHY_L4_MY_012_006, https://doi.org/10.48670/moi-00185, is used. The product incorporates scatterometer observations to correct for persistent biases in hourly ERA5 model fields. Bias corrections are based on scatterometer observations from Metop-A, Metop-B, Metop-C ASCAT (0.125∘) and QuikSCAT SeaWinds (0.25∘). The bias corrections are calculated over 20 d centered around the time of interest. Therefore, averaging hourly wind speeds from this product over a month includes some observations (10 d) from both the previous and next month (PUM, CopernicusMarineService, personal communication, 2023). The product provides stress-equivalent Level-4 wind components at 10 m at 0.125 and 0.25∘ horizontal spatial resolution and covers the period from August 1999 to February 2023. The stress-equivalent wind does not rely on the assumption of neutral stability (de Kloe et al., 2017). In the present study data at 0.125∘ horizontal spatial resolution is used. Hourly near-surface wind speed is calculated from components. Monthly values are obtained from the hourly wind speed by arithmetic averaging. In a previous version of the manuscript the Metop/ASCAT based monthly average wind speed of the WIND_GLO_PHY_CLIMATE_L4_REP_012_003 product was used. The WIND_GLO_PHY_CLIMATE_L4_REP _012_003 product was withdrawn in the November 2022 release of CMEMS and was replaced by WIND_GLO_PHY_CLIMATE_L4_MY_012_003 (CopernicusMarineService, personal communication, 2023). This new product contains monthly averaged ERA5 stress-equivalent wind fields (components), corrected for persistent biases based on scatterometer observations. These bias corrections are calculated for the wind components and have been demonstrated to provide improved surface wind fields. Bias corrections for wind speed have been calculated as well, but compared to the vector components, their statistical and physical interpretation is more complex and requires further study. For this reason, wind speed has not been included in the monthly product (yet) (CopernicusMarineService, personal communication, 2023). As is documented in the WIND_GLO_PHY_CLIMATE_L4_MY_012_003 product QUID for the vector components, differences between the hourly and the monthly bias correction are small (QUID, CopernicusMarineService, personal communication, 2023). Therefore, the present study uses the hourly wind speed components provided by WIND_GLO_PHY_L4_MY_012_006, https://doi.org/10.48670/moi-00185, to calculate monthly averaged wind speed as outlined above.
2.5.1 Hamburg Ocean Atmosphere Parameters and Fluxes from Satellite Data (HOAPS), version 4.0 + extension
This dataset contains gridded Thematic Climate Data Records (TCDR) (1987–2014, Andersson et al., 2017) + extension (2015–2020) of wind speed at 10 m from the Hamburg Ocean Atmosphere Parameters and Fluxes from Satellite Data (HOAPS) climatology compiled by the Satellite Application Facility on Climate Monitoring (CM SAF). HOAPS is a completely satellite-based climatology of precipitation, evaporation, freshwater budget, latent heat flux, total column water vapour, near-surface specific humidity and near-surface wind speed over the global ice-free oceans. All variables are derived from recalibrated and intercalibrated measurements from SSM/I and SSMIS passive microwave radiometers, except for the SST, which is taken from AVHRR measurements (Andersson et al., 2010). The near-surface wind speed is retrieved with a 1D-Var retrieval scheme. The data is provided as monthly averages on a regular latitude/longitude grid with a spatial resolution of 0.5×0.5∘.
2.6 Methodology
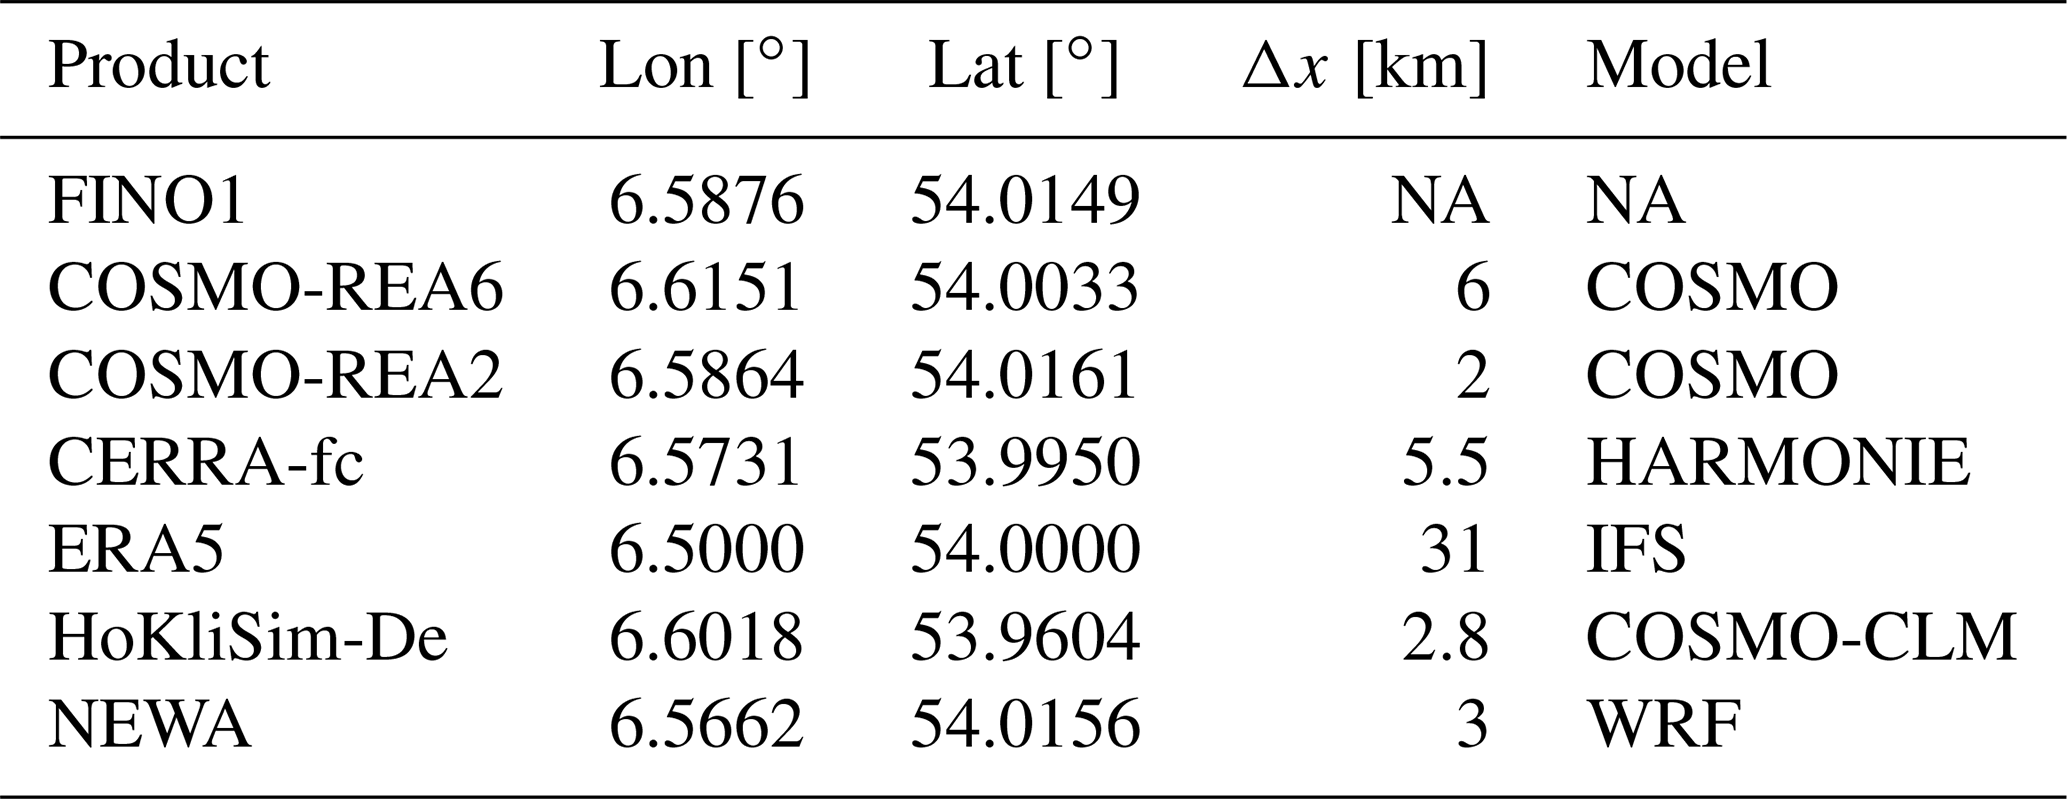
Model grid points used for evaluation with FINO measurements are selected according to a nearest neighbour approach (Table 1). For comparison with the mast measurements the model data is vertically interpolated to a height of 100 m above mean sea level (a.m.s.l). Linear vertical interpolation is used for COSMO-REA6.
Table 1Coordinates of grid point assigned to FINO1, nominal horizontal resolution and model of different products are shown. Moreover, coordinates of FINO1 station tower are shown. NA stands for not applicable.
To enable direct comparability with available model output data 10 min averages of the FINO measurements at full hours are used (results for time period 2004–2009 presented in Sect. 3.1). Moreover, the dates of the model data are chosen to match the available FINO observations, i.e. data at dates where observations are missing are discarded in the model data base.
Distribution parameters of the hourly wind speed data are obtained by fitting a Weibull distribution function to the wind speed histogram (1 m s−1 histogram bins used). For comparison with the satellite-based reference data 10 m wind speed from models is used. All model-based products are regridded to the geographical grid of the reference data used. Box-plots are created for monthly averages of the grid box data.
Results are presented separately for the evaluation using in-situ measurements of FINO1 and satellite-based data as reference. Evaluation using FINO data concentrates on assessment of temporarily high resolved data at heights near 100 m. Evaluation using satellite-based data focuses on monthly averages of gridded data for an investigation area around the German EEZ of the North Sea.
3.1 Evaluation using in-situ measurements at FINO1 as reference
The quality of the different reanalyses is assessed by comparison with in-situ measurements of the wind speed and wind direction at FINO1. For the wind speed the measurements of the top anemometer at 102 m a.m.s.l. are used. Wind direction is measured at 91 m a.m.s.l. The FINO1 research platform is located in the southern part of Germany's EEZ in the North Sea, ca. 45 km (ca. 24 nautical miles) north of the Isle Borkum in a water depth of about 30 m of the shelf sea. The exact coordinates are 54∘00′53.5′′ N, 6∘35′15.5′′ E (https://www.fino1.de/en/location.html, last access: 6 November 2023).
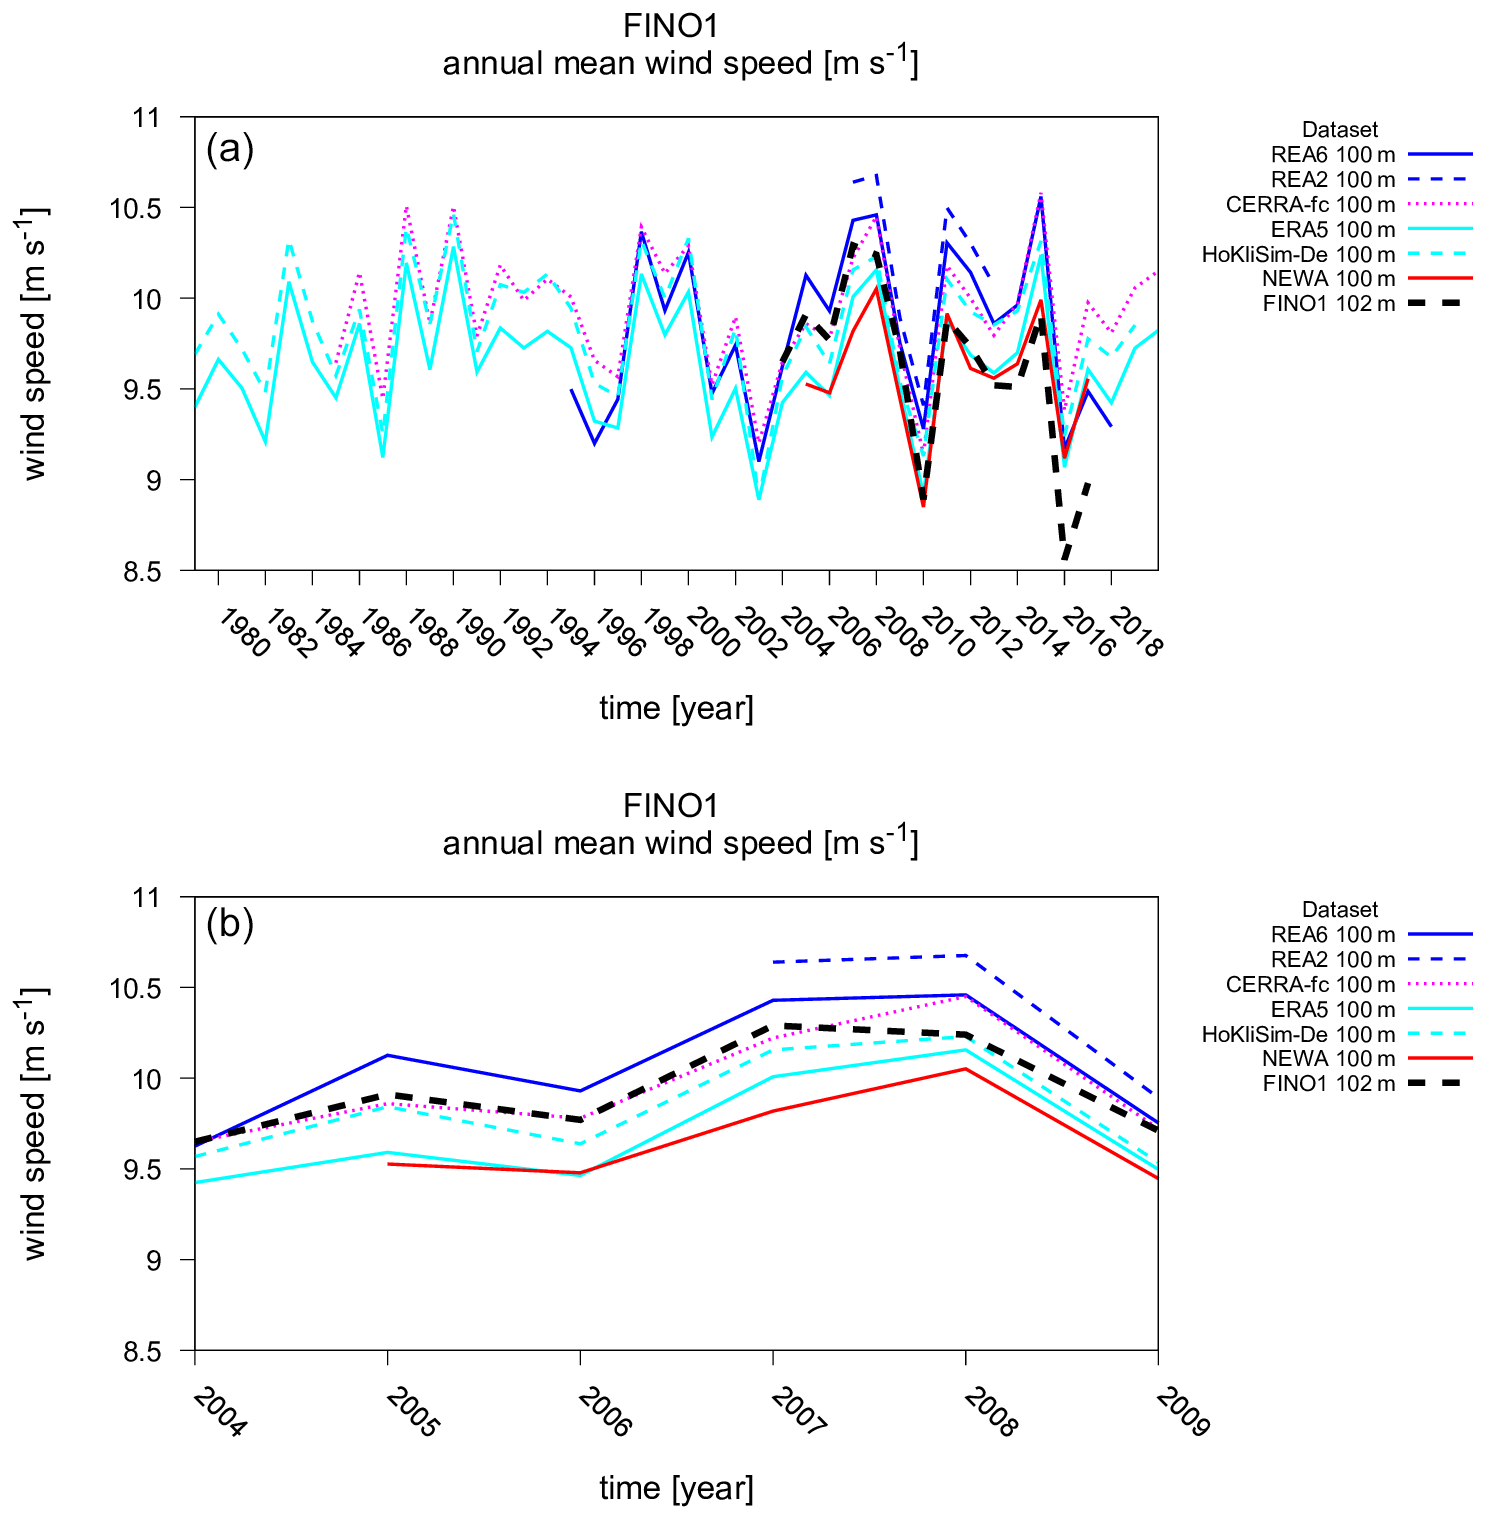
Figure 1Annual mean wind speed at 100 m for model based products at FINO1 grid points. Results are shown for (blue solid curve) COSMO-REA6, (blue dashed curve) COSMO-REA2, (purple dotted curve) CERRA-fc, (cyan solid curve) ERA5, (cyan dashed curve) HoKliSim-De and (red solid curve) NEWA. Results obtained from FINO1 measurements at 102 m are additionally shown (bold black dashed curve). The time period is (a) 1979–2020 and (b) 2004–2009.
3.1.1 Interannual to multi-annual variability
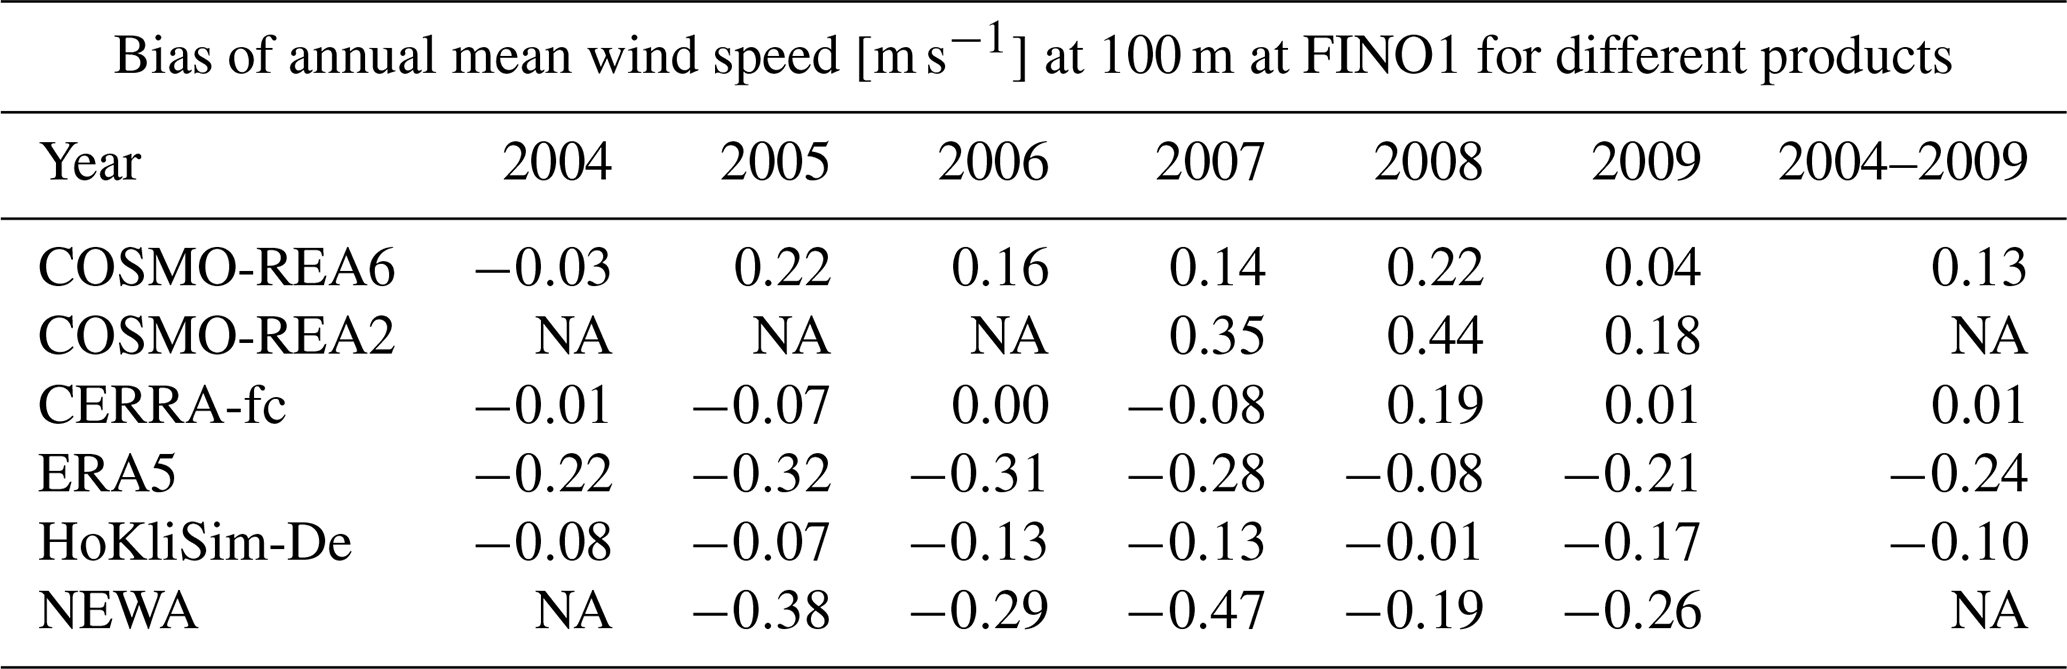
The wind speed at heights near 100 m shows considerable interannual variability. During the period from 2004 to 2017 the observed annual mean wind speed at FINO1 ranges from a maximum of 10.29 m s−1 in 2007 to a minimum of 8.56 m s−1 in 2016 (Fig. 1a). The mast corrected data is not available for January 2018 to August 2019. Therefore, observations 2018 onwards are not shown. The commissioning of the wind farms Alpha Ventus in the direct vicinity east of FINO1 in 2010, Borkum Riffgrund I (2015) to the southeast and Trianel Windpark Borkum (2015) to the northwest led to a reduction of the wind speed at FINO1 (Podein et al., 2022). For this reason, the evaluation of the reanalyses and other model-based products using FINO1 in-situ measurements as reference focuses on the undisturbed period from 2004 to 2009. For this period the data availability of the mast corrected wind speed measurements is 95 % or higher for every individual year. Here the observed annual mean wind speed ranges from 9.65 m s−1 in 2004 to 10.29 m s−1 in 2007 (Fig. 1b). All model-based products capture the interannual variability during the undisturbed period. Contrary to the observations all model-based products including the global and regional reanalyses, the regional downscaling simulation with COSMO-CLM and the wind atlas product show maximum wind speed in 2008 and only second highest wind speed in 2007. Biases of individual years range from −0.47 m s−1 (2007) for NEWA to 0.44 m s−1 (2008) for COSMO-REA2 (Table 2). ERA5 shows a negative bias of −0.24 m s−1 for 2004–2009. The bias is consistently negative over the individual years. A negative bias of −0.10 m s−1 is found for HoKliSim-De for the same time period. Again, the bias is consistently negative but smaller than for ERA5 for every individual year (Table 2). On the other hand, COSMO-REA6 shows a positive bias of 0.13 m s−1 which is predominantly positive for the individual years. The smallest bias of only 0.01 m s−1 for 2004–2009 is found for CERRA. Likewise, the bias is smallest for most of the individual years. For the years 2004 to 2009 there is no evidence for any systematic change of the bias over time for any of the products (Table 2). With regard to the analysis of the undisturbed time period it is concluded that the observations are within the uncertainty range of the reanalyses (COSMO-REA6, CERRA, ERA5). Moreover, the regional downscaling simulation HoKliSim-De shows a smaller bias compared to the driving ERA5 dataset.
Table 2Bias of annual mean wind speed [m s−1] at 100 m for model based products at FINO1 grid cells. FINO1 anemometer measurements at 102 m are used as reference. NA stands for not available.
Besides interannual variability the time series indicate multi-annual variations of the wind speed. Higher than average wind speed values are seen for years 1998 to 2000 which are consistently represented by regional reanalyses (COSMO-REA6, CERRA), HoKliSim-De and ERA5 (Fig. 1a). A larger offset between ERA5 and the higher resolution products CERRA and HoKliSim-De is seen for 1992 to 1995. Likewise, the offsets between the different products are not necessarily stable over time. For example, COSMO-REA6 shows a positive offset for most years, except for 1995, 1996 and 2017, 2018 where COSMO-REA6 shows lower wind speed values than other products.
3.1.2 Frequency distribution of wind speed and wind direction
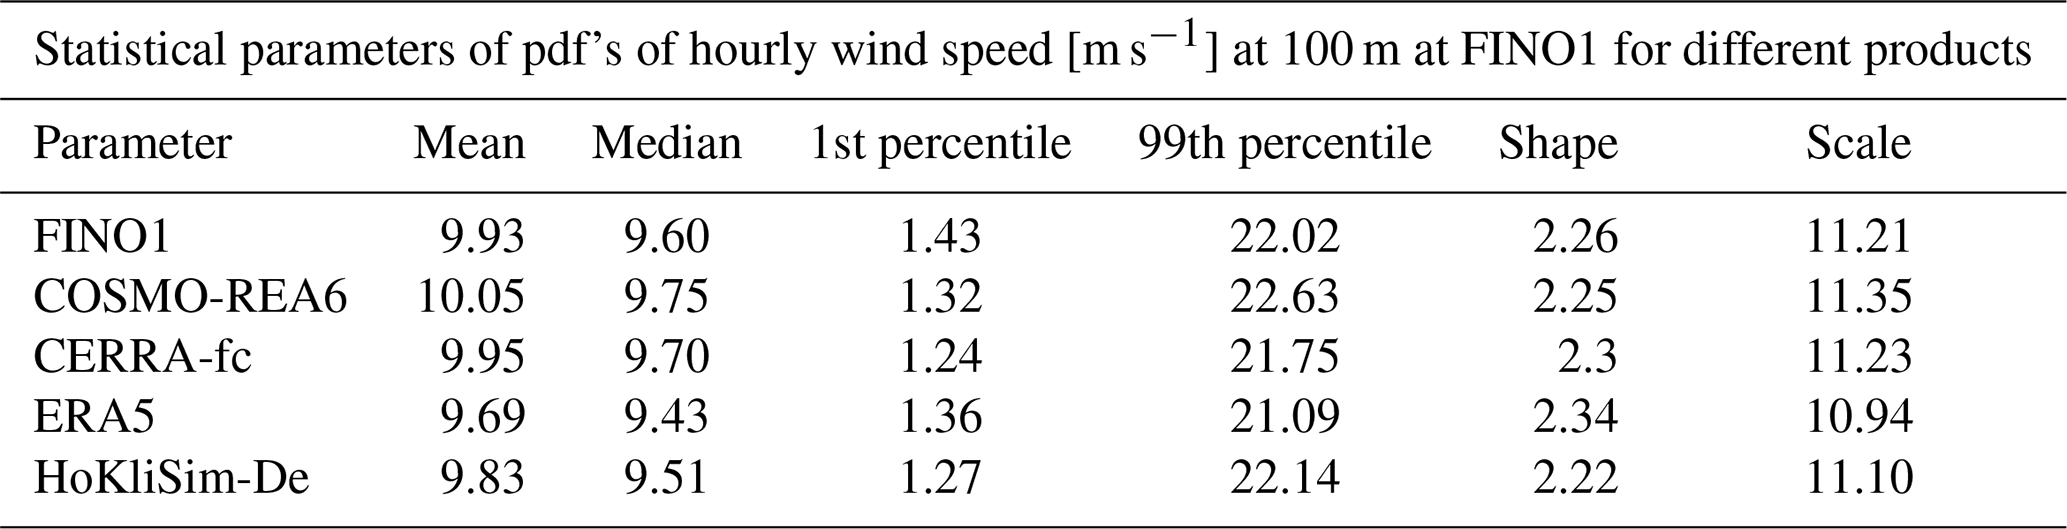
The frequency distribution of wind speed for 2004–2009 from FINO1 measurements at 102 m shows maximum values betwen 8 and 11 m s−1, as indicated by the grey histogram in Fig. 2. The regional reanalyses COSMO-REA6 and CERRA, the global reanalysis ERA5 and the regional downscaling simulation HoKliSim-De (model-based products shown in blue) resemble the observed frequency distribution of wind speed (observations shown in grey) for FINO1. For better readability of the following discussion the statistical parameters of the pdf's shown in Fig. 2 are summarised in Table 3. The distribution obtained from COSMO-REA6 shows a slight shift towards higher values compared to the observations, which is manifested by a marginally higher mean value of 10.05 m s−1 compared to the observed valued of 9.93 m s−1, likewise a marginally higher median ( m s−1), 99th percentile value ( m s−1) and scale parameter ( m s−1). COSMO-REA6 and the observations show a nearly perfect match for the shape parameter (), which confirms the good agreement seen for the other parameters (Fig. 2a). CERRA shows a very good agreement with the observed mean value ( m s−1) and a marginally larger median value ( m s−1). The underestimation of the 99th percentile value seen for CERRA ( m s−1) is slightly more pronounced than for COSMO-REA6. The shape parameter () and the scale parameter ( m s−1) of CERRA are in good agreement with observations for the time period considered here (Fig. 2b). The frequency distribution of ERA5 is slightly shifted towards lower values compared to observations. This shift is reflected by a slightly lower mean ( m s−1), median ( m s−1), 99th percentile value ( m s−1), and scale parameter ( m s−1) (Fig. 2c). The frequency distribution of HoKliSim-De is characterised by a slight underestimation of the mean ( m s−1), median ( m s−1), and scale parameter ( m s−1). The underestimation of these parameters is less pronounced than for ERA5. The 99th percentile value ( m s−1) is in good agreement with observations indicating that the higher resolution improves the representation of extreme wind speeds (Fig. 2d). All model-based products show a slight underestimation of the 1st percentile value compared to the observations.
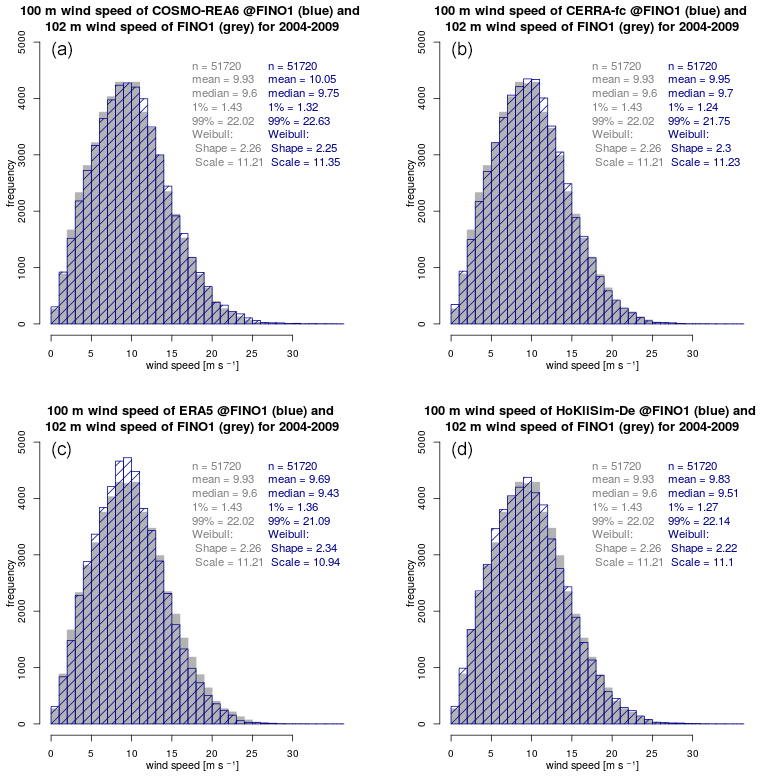
Figure 2Frequency distribution of hourly wind speed at 100 m for model based products at FINO1 grid points (blue). Results are shown for (a) COSMO-REA6, (b) CERRA-fc, (c) ERA5 and (d) HoKliSim-De. Results obtained from FINO1 measurements at 102 m are additionally shown (grey). Values indicate the number of observations (n), the average [m s−1], median [m s−1], 1st and 99th percentile value [m s−1]. Moreover, the shape parameter (dimensionless) and scale parameter [m s−1] of the estimated Weibull distribution are shown. Histograms display absolute numbers. The time period is 2004–2009.
Table 3Satistical parameters of the pdf's of hourly wind speed [m s−1] at 100 m for model based products at FINO1 grid cells. FINO1 anemometer measurements at 102 m are used as reference. The time period is 2004–2009. The values correspond to the histograms shown in Fig. 2.
Wind roses consisting of 16 pre-defined sectors (N, NNE, NE, ENE, E, ESE, SE, SSE, S, SSW, SW, WSW, W, WNW, NW, NNW), where each sector covers an angle of 22.5∘, are used to analyse the frequency distribution of the wind direction at heights near 100 m. The analysis is performed for the time period 2004 to 2009. First, results for the whole year are discussed (Fig. 3). In a second step, the statistics of the four seasons (DJF, MAM, JJA, SON) are briefly addressed (Fig. A1).
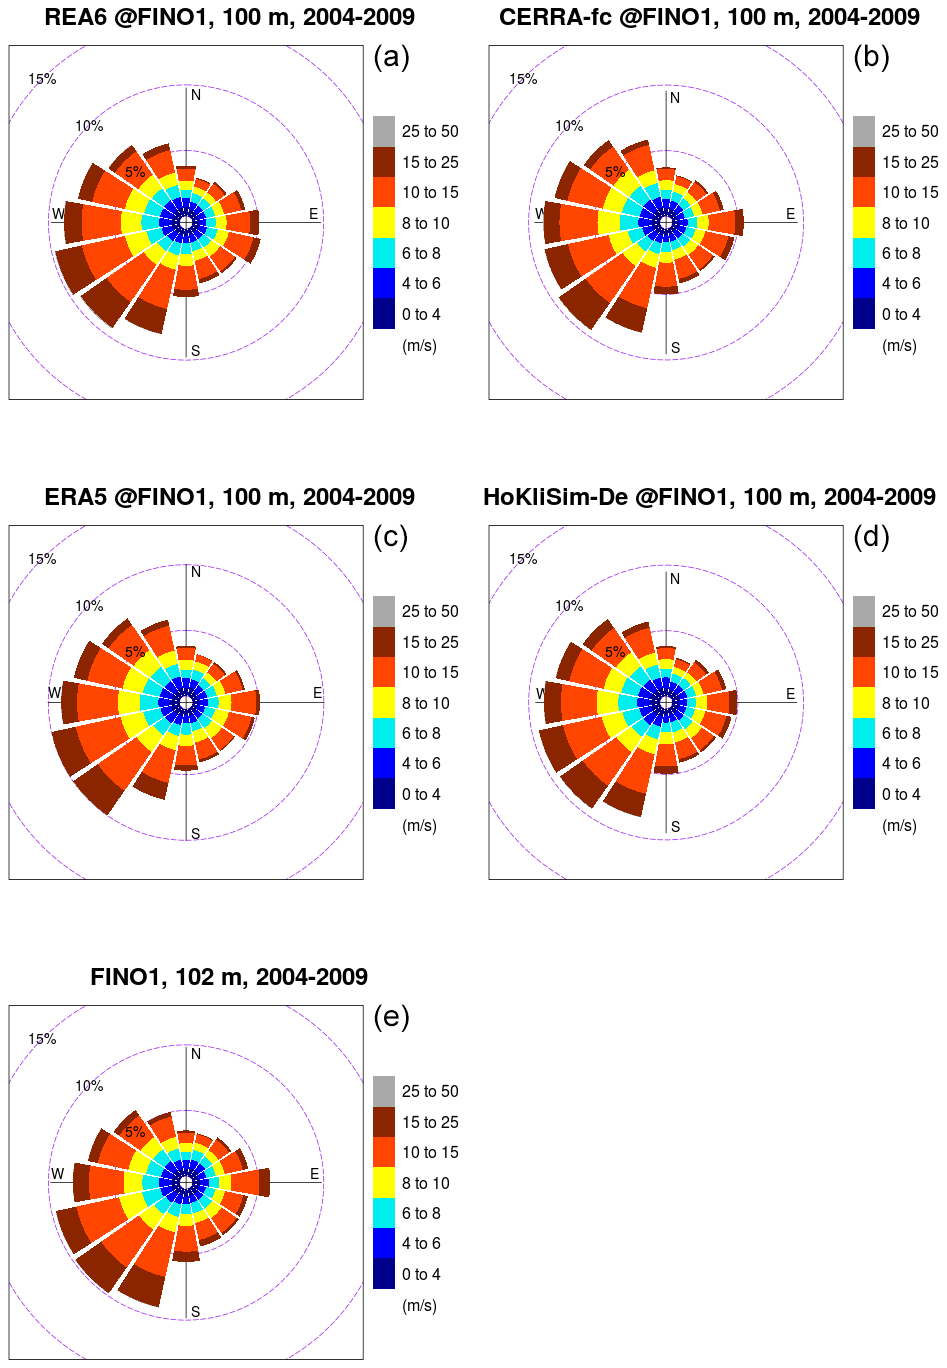
Figure 3Wind rose of hourly wind speed and direction at 100 m for model based products at FINO1 grid points. Results are shown for (a) COSMO-REA6, (b) CERRA-fc, (c) ERA5 and (d) HoKliSim-De. Results obtained from (e) hourly FINO1 measurements (10 min averages) of wind speed at 102 m and wind direction at 91 m are additionally shown. The time period is 2004–2009.
The wind rose of the observations at FINO1 shows a maximum relative frequency of nearly 10 % at the SW sector and slightly lower relative frequencies of about 9 % at the neighbouring sectors SSW and WSW (Fig. 3e). Lower relative frequencies are apparent decreasing from 6 % at W to about 5 % at NNW. Most of the sectors from N over E to S show relative frequencies of less than 5 %. Here only the S sector and the E sector show values slightly above the 5 % level. Sector E depicts a secondary maximum of about 6 %.
The wind rose of COSMO-REA6 (Fig. 3a) is in line with observations (Fig. 3e). Differences of less than 1 percent are seen for most sectors. COSMO-REA6 slightly underestimates the frequent occurrence of the south-westerly wind directions seen in observations, especially for sector SSW. By contrast, the occurrence of wind directions at sectors W to NNW is somewhat more frequent in COSMO-REA6. In addition, the relative maximum at sector E is less pronounced in COSMO-REA6 and shifted to sector ESE. Wind speeds above 15 m s−1 are predominately found for south-westerly wind directions in COSMO-REA6, which is consistent with the measurements (Fig. 3e).
Similarly, the wind roses of CERRA, ERA5 and HoKliSim-De are in good agreement with observations. The underestimation of the wind directions at south-westerly sectors (WSW, SW, SSW) and overestimation at the sectors W to NNW is somewhat more pronounced in CERRA (Fig. 3b) than in COSMO-REA6. However, CERRA shows the absolute maximum at sector SW which is consistent with observations. Moreover, CERRA resembles but underestimates the observed secondary maximum at sector E. ERA5 shows a clear underestimation of the relative frequency at sector SSW. On the other hand, populations at sectors W to NNW are slightly overestimated when compared to measurements. The relative maximum at sector E is only weakly pronounced in ERA5 (Fig. 3c). HoKliSim-De shows a slight underestimation at sectors SSW to WSW, which is most pronounced at sector SSW (Fig. 3d). By contrast, populations at sectors W to NNW are noticeably overestimated by HoKliSim-De. The secondary maximum at sector E is captured by HoKliSim-De but less pronounced than in the FINO1 observations (Fig. 3e).
Further quality assessment is provided by analysis of the different seasons (Appendix A). One outstanding feature is the systematic underestimation of south-westerly wind directions by the model based products. A systematic underestimation of south-westerly wind directions is also reported by Hahmann et al. (2020) for NEWA simulations with WRF. A more detailed interpretation of results is beyond the scope of the present study.
3.1.3 Windstorm CHRISTIAN
The correct representation of extreme wind speeds in the reanalysis systems is shown for storm CHRISTIAN as an example: CHRISTIAN developed over north-western and central Europe in late October 2013 and, with a travelled distance of 1200 km in 12 h, was classified as a fast-moving storm (Deutscher Wetterdienst, 2013). Across Europe, there were at least 15 deaths, severe destruction and traffic chaos. Affected areas were around the English Channel, in the Netherlands, north-western Germany, parts of Denmark and southern Sweden (CEDIM, 2013). On 26 October, CHRISTIAN developed as a secondary cyclone, of the low-pressure system BURKHARD over the western Atlantic (Deutscher Wetterdienst, 2013). On 27 October, the first gusts with wind speeds of up to 133 km h−1 were recorded along the Breton coast. On 28 October, CHRISTIAN continued to track north-eastward and crossed the south of Great Britain with a core pressure of 977 hPa. With a further decrease in pressure to 968 hPa, CHRISTIAN then moved towards the northwest coast of Denmark, triggering the highest wind speeds in the North Sea between 13:00 and 14:00 UTC (Deutscher Wetterdienst, 2013). Peak wind speeds in northern Germany and Denmark exceeded 190 km/h. In the course of 29 October, CHRISTIAN continued as winter storm with hurricane strength and moved towards southern Sweden and Finland. The extreme wind speeds at noon on 28 October in the North Sea are also reflected in the various reanalyses in Fig. 4. It shows a comparison of hourly wind speed at 100 m at FINO1 between COSMO-REA6, CERRA and CERRA-EDA, ERA5, HoKliSim-De, NEWA and the observations. The time series of 7 d in Fig. 4a emphasizes that except NEWA all products are very well able to represent amplitude and phase of the storm passage. NEWA significantly underestimates the maximum wind speeds and also reaches the peak too early. Figure 4b shows 28 October in more detail. Here, the 10 min observations show that there is a short-term wind decrease to 30 m s−1 between the peaks at 11:00 and 13:00 UTC. This pattern cannot be reflected by the reanalyses because of the only hourly temporal resolution of the available data. The maximum wind intensity is best reproduced by the regional products COSMO-REA6 and CERRA, where COSMO-REA6 even slightly overestimates the maximum wind speeds. ERA5 and HoKliSim-De, however, show a slight underestimation. Figure 4b also points out a 1 h temporal shift between the deterministic and ensemble-based CERRA product, that has to be investigated further.
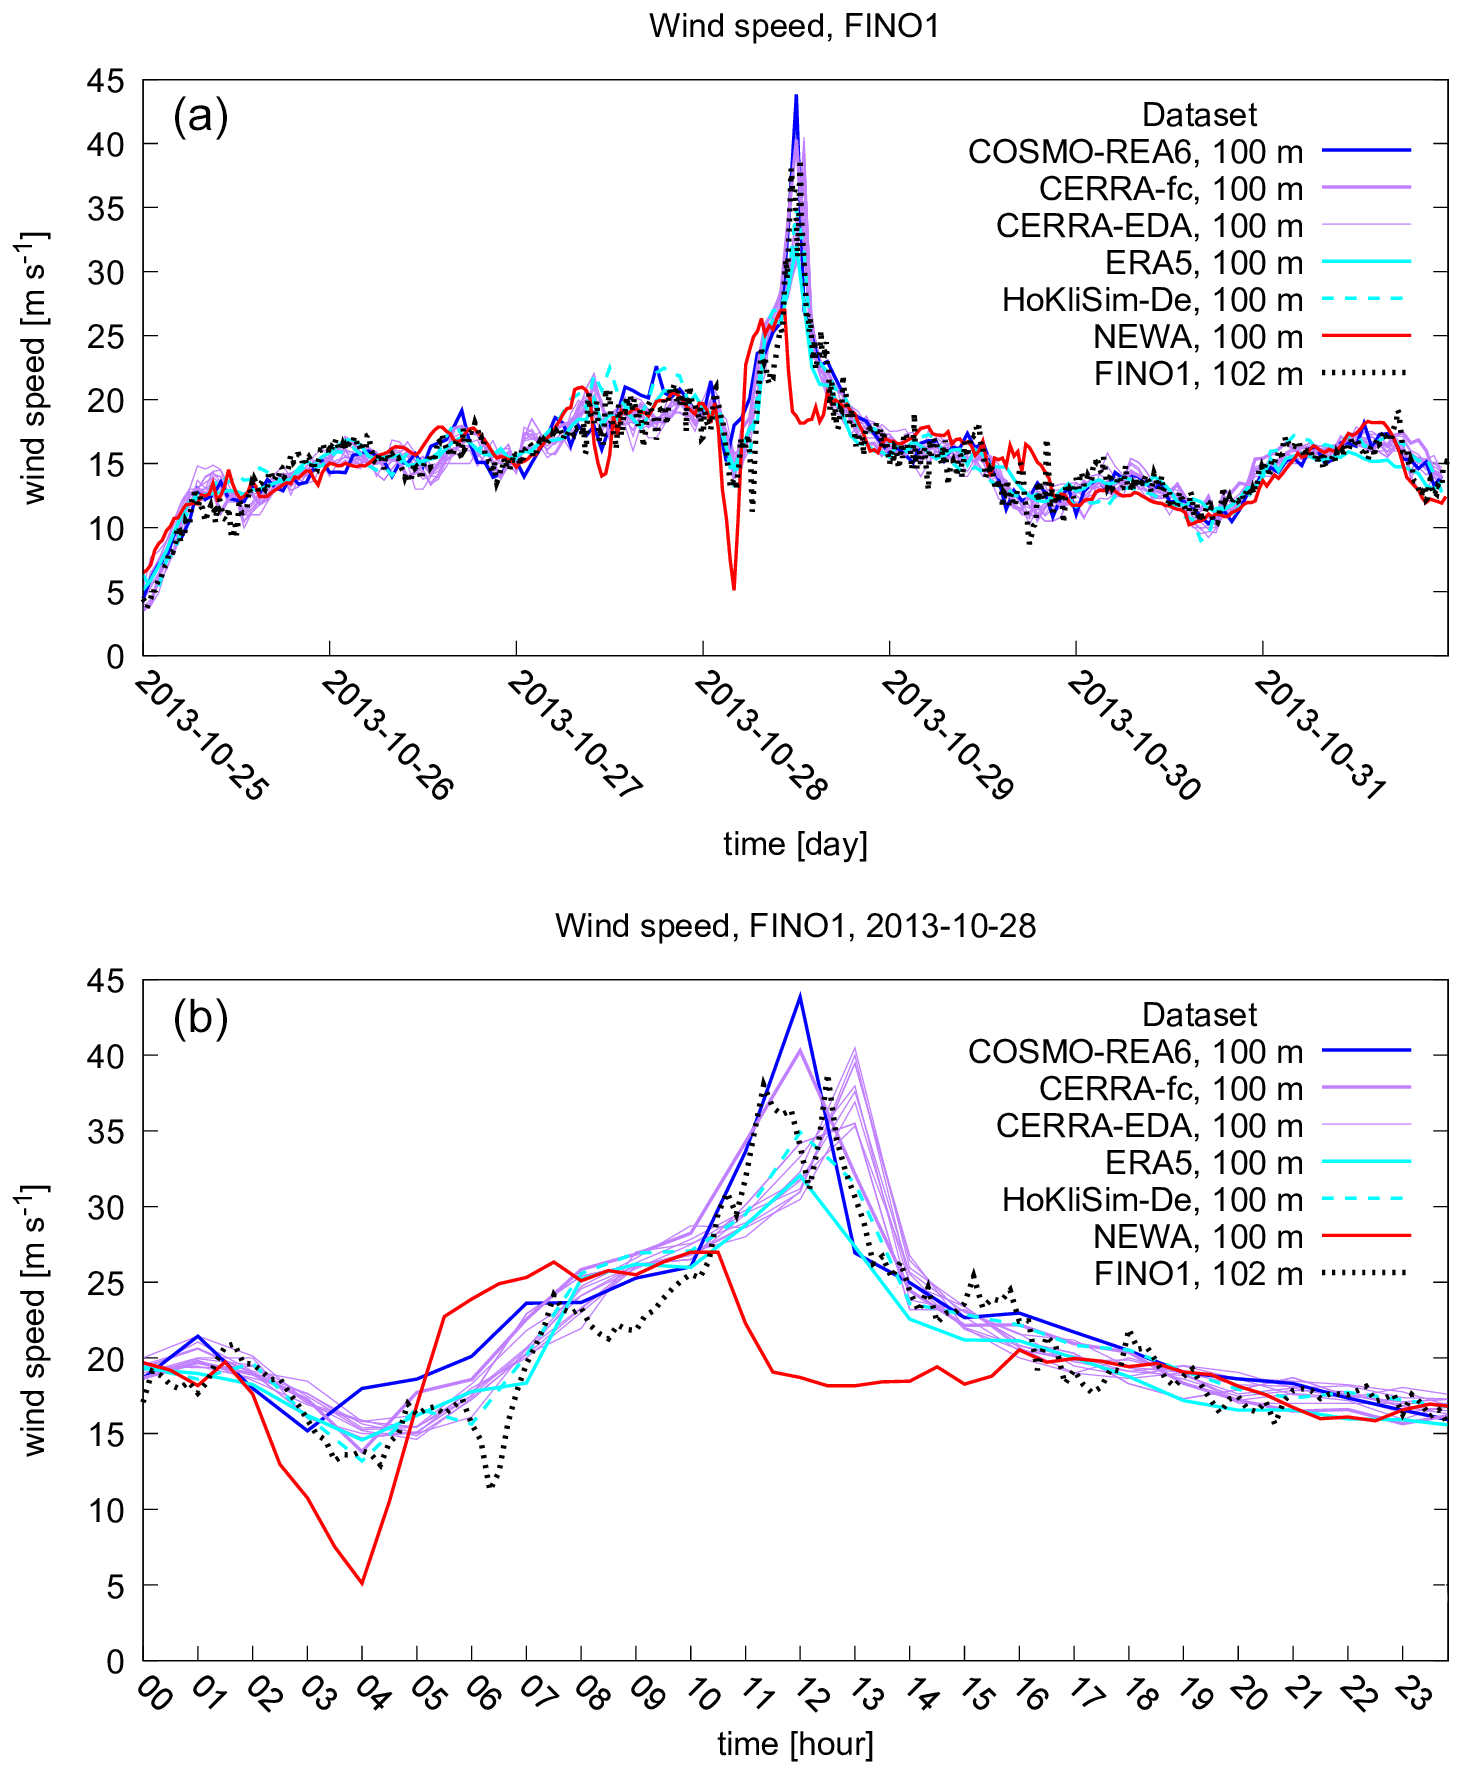
Figure 4Hourly wind speed at 100 m for model based products at FINO1 grid points during windstorm CHRISTIAN. Results are shown for (blue solid curve) COSMO-REA6, (purple solid curve) CERRA-fc, (purple solid thin curves) CERRA-EDA, (cyan solid curve) ERA5, (cyan dashed curve) HoKliSim-De and (red solid curve) NEWA. Results obtained from FINO1 measurements at 102 m (10 min averages) are additionally shown (bold black dashed curve). The time period is (a) 25–31 October 2013 and (b) 28 October 2013.
3.2 Comparison against satellite-based products
Biases of monthly mean near-surface wind speed are analysed using a selection of grid points embedded in a geographical area covering the German EEZ of the North Sea (3.0 to 8.5∘ E, 53.5 to 56 degrees North). 10 m wind speed is used from models. Two different satellite-based data products are used as observational reference. The approach enables an assessment of the near-surface wind field.
The first product (WIND_GLO_PHY_L4_MY_012_006, hereafter referred to as Scatterometer and Model (e5)) incorporates scatterometer observations used to correct for persistent biases in hourly ERA5 model fields. The second product (HOAPS version 4.0 + extension, hereafter referred to as HOAPS, CMSAF) is based on passive microwave sensor measurements. Due to coarser spatial resolution and missing data near the coast the HOAPS dataset does not cover the complete study area chosen for this analysis. For the covered area HOAPS shows a slightly lower 10 m wind speed average when compared to the Scatterometer and Model (e5) reference dataset from CMEMS (−0.18 m s−1 for 2008 to 2017).
Biases are calculated and discussed separately for the ten year period 2008 to 2017 and for the year 2018. The analysis for 2018 incorporates in addition results for COSMO-R6G2. The year 2018 is characterized by a comparably low value of the annual mean wind speed at FINO1 as indicated by reanalyses (cf. Sect. 3.1).
3.2.1 Distribution of biases
For the ten-year time period comparison against the Scatterometer and Model (e5) (CMEMS) dataset the median bias is nearly zero for ERA5 and COSMO-REA6 (Fig. 5, top left panel). In 50 % of the cases (lower to upper quartile range indicated by the blue boxes) the bias is within −0.2 to 0.2 m s−1. Larger biases are found as indicated by the whiskers.
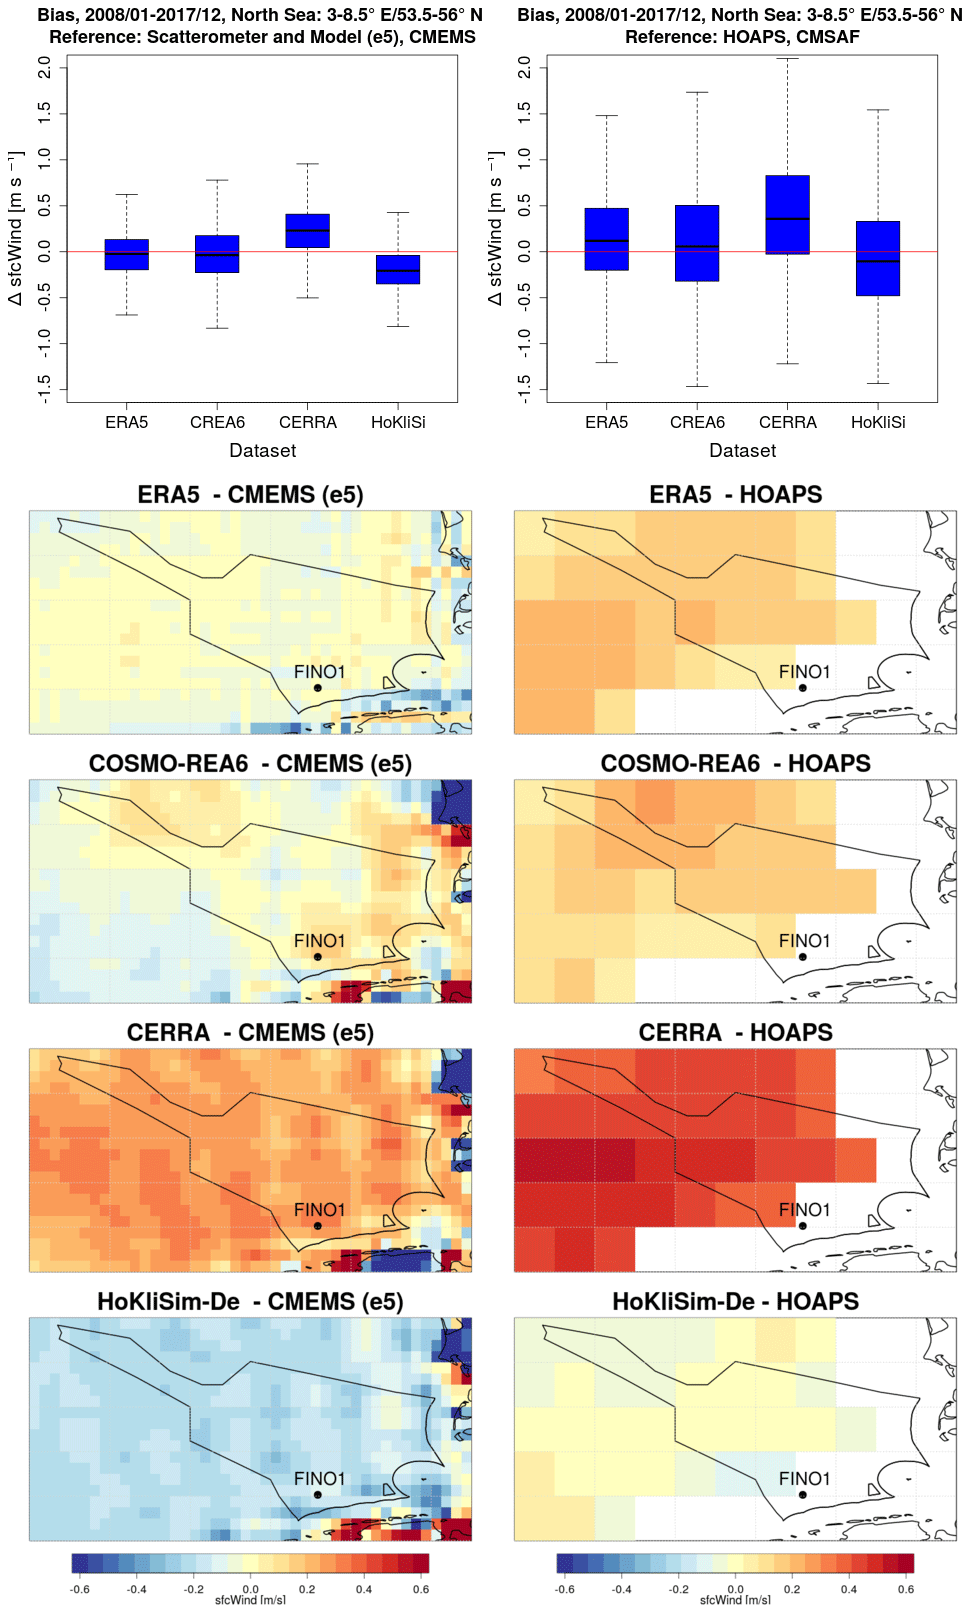
Figure 5Bias distribution of near-surface wind speed [m s−1] for grid points embedded in geographical area covering the German Exclusive Economic Zone of the North Sea. The spatiotemporal bias distribution is illustrated by (top row panels) Box–Whisker plots for the two different satellite based reference data sets (left panel) Scatterometer and Model (e5) from CMEMS and (right panel) HOAPS from CMSAF. Values outside the whiskers (whisker length never exeeds 1.5 IQR (interquartile range)) not shown. All calculations are based on monthly data. Geographical area is 3–8.5∘ E, 53.5–56∘ N. Maps of the multi-year averaged bias of (from 2nd to 5th row panels) ERA5, COSMO-REA6, CERRA and HoKliSim-De compared to (left panels) Scatterometer and model (e5) from CMEMS and (right panels) HOAPS from CMSAF for the considered geographical area are additionally shown. Black contours display the geographical position of the German Exclusive Economic Zone. FINO1 is additionally shown. The time period is 2008–2017.
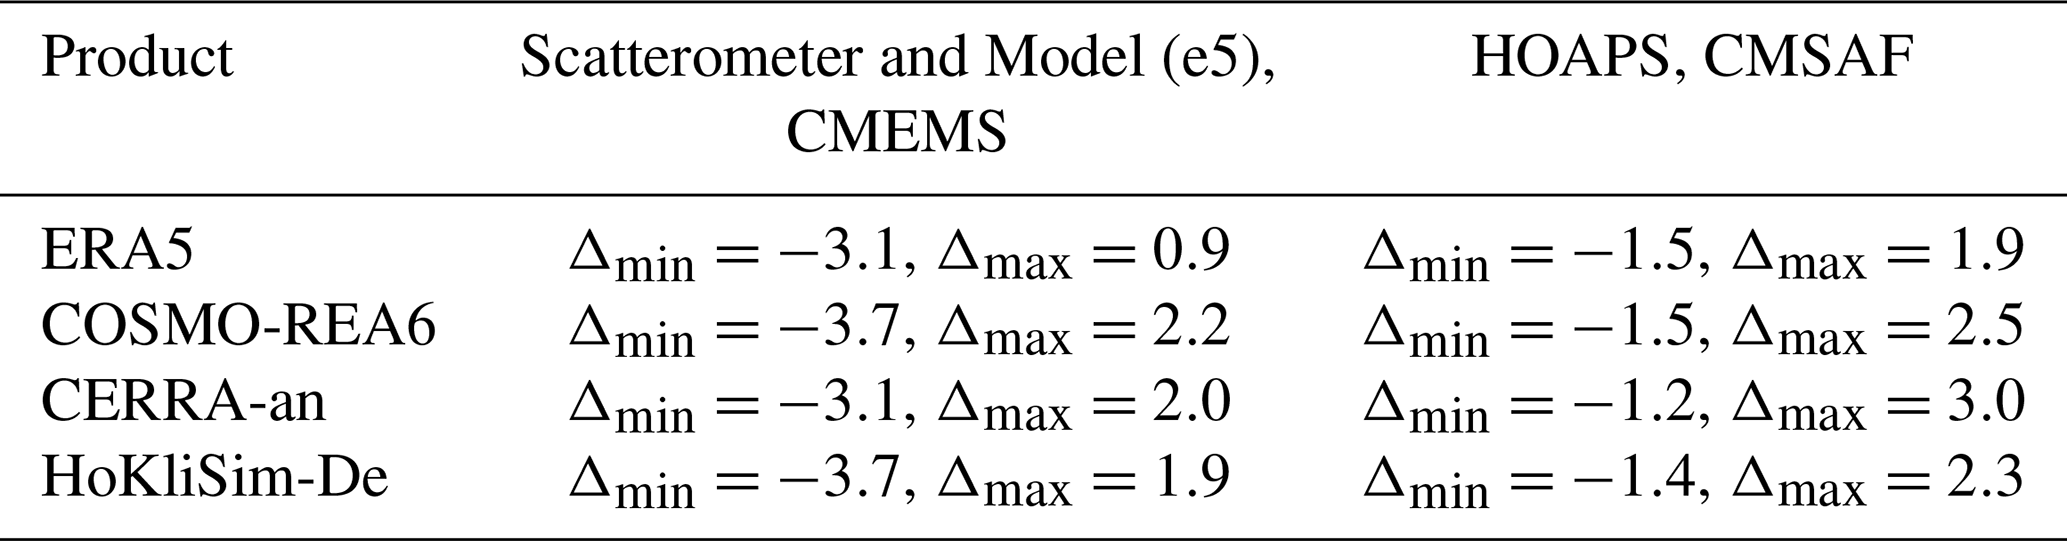
The maximum negative bias of ERA5 is −3.1 m s−1 in contrast to the maximum positive bias of 0.9 m s−1 (Table 4). A systematic shift towards positive bias values is found for CERRA as indicated by the median bias of 0.2 m s−1 and the lower to upper quartile ranging from 0.05 to 0.35 m s−1. Compared to ERA5 a similar maximum negative bias of −3.1 m s−1 is found compared to a larger maximum positive bias of 2.0 m s−1. Larger maximum negative and positive biases of −3.7 and 2.2 m s−1 are found for COSMO-REA6 (Table 4). Contrary to CERRA the bias distribution of HoKliSim-De shows a shift towards negative values with the median bias of about −0.2 m s−1 (Fig. 5, top left panel).
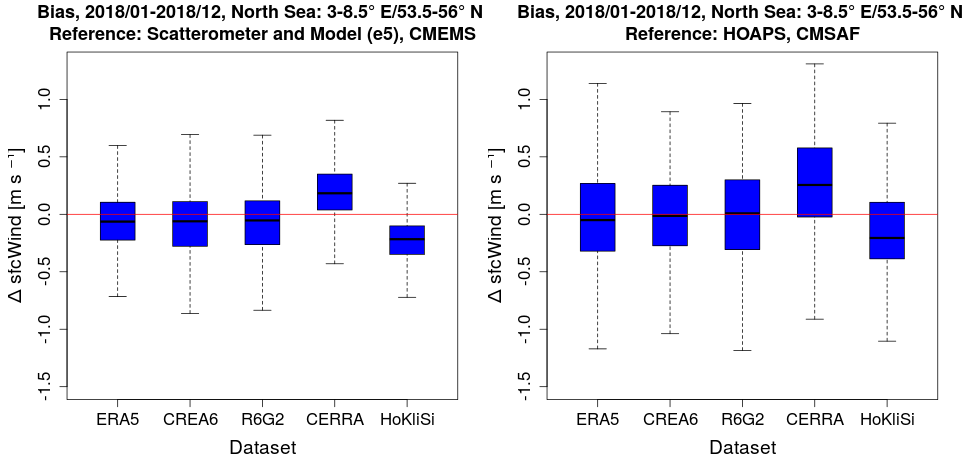
Figure 6As Fig. 5 (top row panels), but for year 2018. Results for COSMO-R6G2 are shown in addition.
Table 4Maximum and minimum bias of monthly mean near-surface wind speed [m s−1] of grid boxes embedded in geographical area covering the German Exclusive Economic Zone of the North Sea. Biases are calculated for the various model-based products using two satellite based data products as reference. The time period is 2008–2017.
A slight shift of the bias distribution towards positive values is seen for ERA5 and COSMO-REA6 when using the HOAPS dataset as reference (Fig. 5, right panels). For CERRA the shift towards positive bias values seen earlier is confirmed. HoKliSim-De shows a marginal shift towards negative bias values. Results confirm that HOAPS shows slightly lower mean near-surface wind speeds when compared to the other reference data set thereby favouring more positive bias values (Fig. 5, Table 4). The HOAPS dataset does not cover the full study area due to the coarser spatial resolution and missing values near the coastline.
The CMEMS dataset combines scatterometer measurements with ERA5 and is therefore not purely based on measurements. HOAPS is purely satellite-based and therefore provides independent data, e.g. for evaluation of COSMO-REA6 where no satellite data is assimilated. However, HOAPS is subject to sampling uncertainties due to sparser data coverage which is clearly reflected by the larger range of biases (Fig. 5, top row panels and Table 4). Maps of the spatial bias distribution facilitate the interpretation of the Box-Whisker plots. The multi-year average bias shows only moderate spatial variations (Fig. 5, row 2 to 5 panels). Larger biases are seen along the coast for the Scatterometer and Model (e5), CMEMS dataset. As noted earlier HOAPS does include missing data near the shore. From the spatiotemporal analysis we conclude that consistent results are found for the median bias indicating comparably small deviations of the near-surface wind speed for ERA5 and COSMO-REA6 from the satellite-based reference datasets, a slight shift of the bias distribution towards positive values for CERRA and a minor shift towards negative values for HoKliSim-De.
3.2.2 Evaluation of bias for 2018
Results for 2018 partly confirm findings for 2008–2017. For example, CERRA shows a tendency towards positive bias values. Moreover, a shift towards negative bias values is clearly seen for HoKliSim-De (Fig. 6). Compared to the analysis for 2008–2017 the median bias of ERA5 and COSMO-REA6 is slightly more negative when using Scatterometer and Model (e5) (CMEMS) as reference (Fig. 6, left panel). The median bias of both ERA5 and COSMO-REA6 is close to zero when choosing the HOAPS dataset as reference (Fig. 6, right panel). Note that both ERA5 and COSMO-REA6 show comparatively low annual mean wind speed values at 100 m when compared to other model-based products at the position of FINO1 (cf. Sect. 3.1).
Results for COSMO-R6G2 are similar to COSMO-REA6 for both reference datasets (Fig. 6). The median bias of COSMO-R6G2 is slightly negative for the Scatterometer and Model (e5) (CMEMS) reference and close to zero when choosing HOAPS as reference. Therefore, results for COSMO-R6G2 provide first indication of the suitability of the new product.
Detailed meteorological data and information is required to assess the potential wind farm profitability. In this study, new model-based regional reanalyses and a regional downscaling simulation are investigated with regard to their applicability for offshore wind farm planning. Different reference data sets are used for quality assessment. In-situ measurements of the wind speed and wind direction at heights near 100 m of the research platform FINO1 are used to analyse data of high temporal resolution. The analysis focuses on the time period from 2004 to 2009 prior to the installation of surrounding wind farms to avoid the influence of wake effects on the FINO1 measurements (e.g. Podein et al., 2022). Consistent biases are found for this undisturbed period that do not vary much over time. Larger variations between the different products are evident for other time periods. Here the question arises how uncertainties on longer time-scales and further back in time can be addressed (e.g. Krieger et al., 2021). In summary, the choice of the analysis period provides a profound basis for further quality assessment.
The observed annual mean wind speed varies between 9.65 m s−1 in 2004 and 10.29 m s−1 in 2007 during the analysis period. Such a difference in wind speed translates to a 21 % difference in wind energy density since wind energy content of the air flow increases with the third power of the wind speed. ERA5, COSMO-REA6, CERRA and HoKliSim-De capture the interannual variations of the wind speed during this period. The regional reanalyses COSMO-REA6, CERRA and the regional downscaling simulation HoKliSim-De show only small biases and resemble the distribution of the hourly wind speed measurements (10 min averages used). By contrast, ERA5 slightly underestimates the wind speed measurements near 100 m at FINO1. The regional downscaling simulation HoKliSim-De shows smaller biases than ERA5 and reveals added value with respect to the representation of extreme wind speeds.
Wind direction and its variability are known to affect wind-farm power output (Porté-Agel et al., 2020). Wind roses are used to analyse the representation of the wind direction and respective wind speed. All model-based products tend to slightly underestimate southwesterly wind directions and to overestimate wind directions from West to Northwest. The same systematic deviation is reported for wind atlas simulations with WRF (Hahmann et al., 2020). COSMO-REA6 is comparatively close to the observed wind roses and shows only small directional biases.
Wind power plants are shut down when cut-out wind speeds are exceeded to reduce maintenance costs and to avoid damage (Gliksman et al., 2023). Analysis of the windstorm CHRISTIAN, which led to extreme wind speeds of more than 35 m s−1 on 28 October 2013 at FINO1, illustrates how far the model-based products are able to capture such an extreme event. The amplitude and timing of the peak is captured by COSMO-REA6, CERRA-fc, ERA5 and HoKliSim-De. COSMO-REA6 slightly overestimates the maximum wind speed whereas ERA5 shows a slight underestimation. In CERRA-EDA the peak is shifted by 1 h but the amplitude is within the ensemble spread. While HoKliSim-De captures the timing and amplitude of the peak, NEWA fails to capture the windstorm at FINO1. Therefore, the choice of the downscaling area might affect the quality of the results, besides data assimilation methods and model formulation.
Finally, various satellite-based gridded data products are used for the evaluation of the near-surface wind speed. The analysis is performed based on monthly averages for an area around the German EEZ of the North Sea. The analysis focuses on the ten-year time period from 2008 to 2017. In addition, the year 2018 is analysed. Consistent results are found using two different reference dataset from CMEMS and CMSAF. For the ten-year period the median of the bias distribution is close to zero for ERA5 and COSMO-REA6. A systematic shift towards positive bias values is analysed for CERRA. By contrast, HoKliSim-De shows a shift towards negative bias values. Analogue biases are found for 2018. Here evaluation results for COSMO-R6G2 are similar to COSMO-REA6 which provides first indication for the applicability of the new product. Large biases are found for monthly averages at individual grid boxes indicating that further aspects such as the sampling and retrieval methods and associated uncertainties of the satellite data needs to be considered for a more detailed evaluation. Also, wake effects need to be considered (e.g. Akhtar et al., 2022) which are not explicitly accounted for by the reanalyses and simulations we use. Moreover, additional analysis of the vertical wind profile is required. For example, as shown by Spangehl and Tinz (2021) for wind farm site investigations near FINO1, the vertical wind speed profiles obtained for COSMO-REA6 and ERA5 are in good agreement but the ERA5 median of the wind speed shows slightly lower values at higher levels. Future evaluation work should therefore make use of available data from measurement campaigns with ground-based lidar instruments (https://pinta.bsh.de, last access: 6 November 2023) to improve our knowledge on the vertical wind profile.
The wind roses of the model-based products (COSMO-REA6, ERA5, CERRA, and HoKliSim-De) are similar to the observed wind roses for all four seasons (Fig. A1), yet there are some systematic differences. In DJF the south-westerly wind directions occur most frequently in the model-based products, which is in accordance with the FINO1 observations. However, all model-based products tend to slightly underestimate the occurrence of south-westerly wind directions. By contrast they show a slightly too frequent occurrence of the wind directions from sector W to sector NNW when compared to observations. A similar behaviour is evident for MAM. Here the observations show maximum occurrences at sector E and sector SW. The maximum at sector SW seen in observations is shifted to sector WSW in all model-based products. The maximum at sector E is captured by the model-based products though slightly underestimated. This underestimation goes along with slightly too frequent occurrences of wind directions in sector ESE. In JJA the observations show a clear maximum at sector WSW. Here only COSMO-REA6 shows maximum occurrences at the same sector. In CERRA and HoKliSim-De this maximum is shifted to sector W. In DJF observations show maximum occurrences at sector SSW. A similar maximum is apparent in COSMO-REA6 and HoKliSim-De. In ERA5 this maximum is shifted to sector SW. The seasonal variations shown (Fig. A1) are similarly represented by marine observations (ships, buoys, platforms) for the North Sea (Bundesamt für Seeschifffahrt und Hydrographie, 2023a).
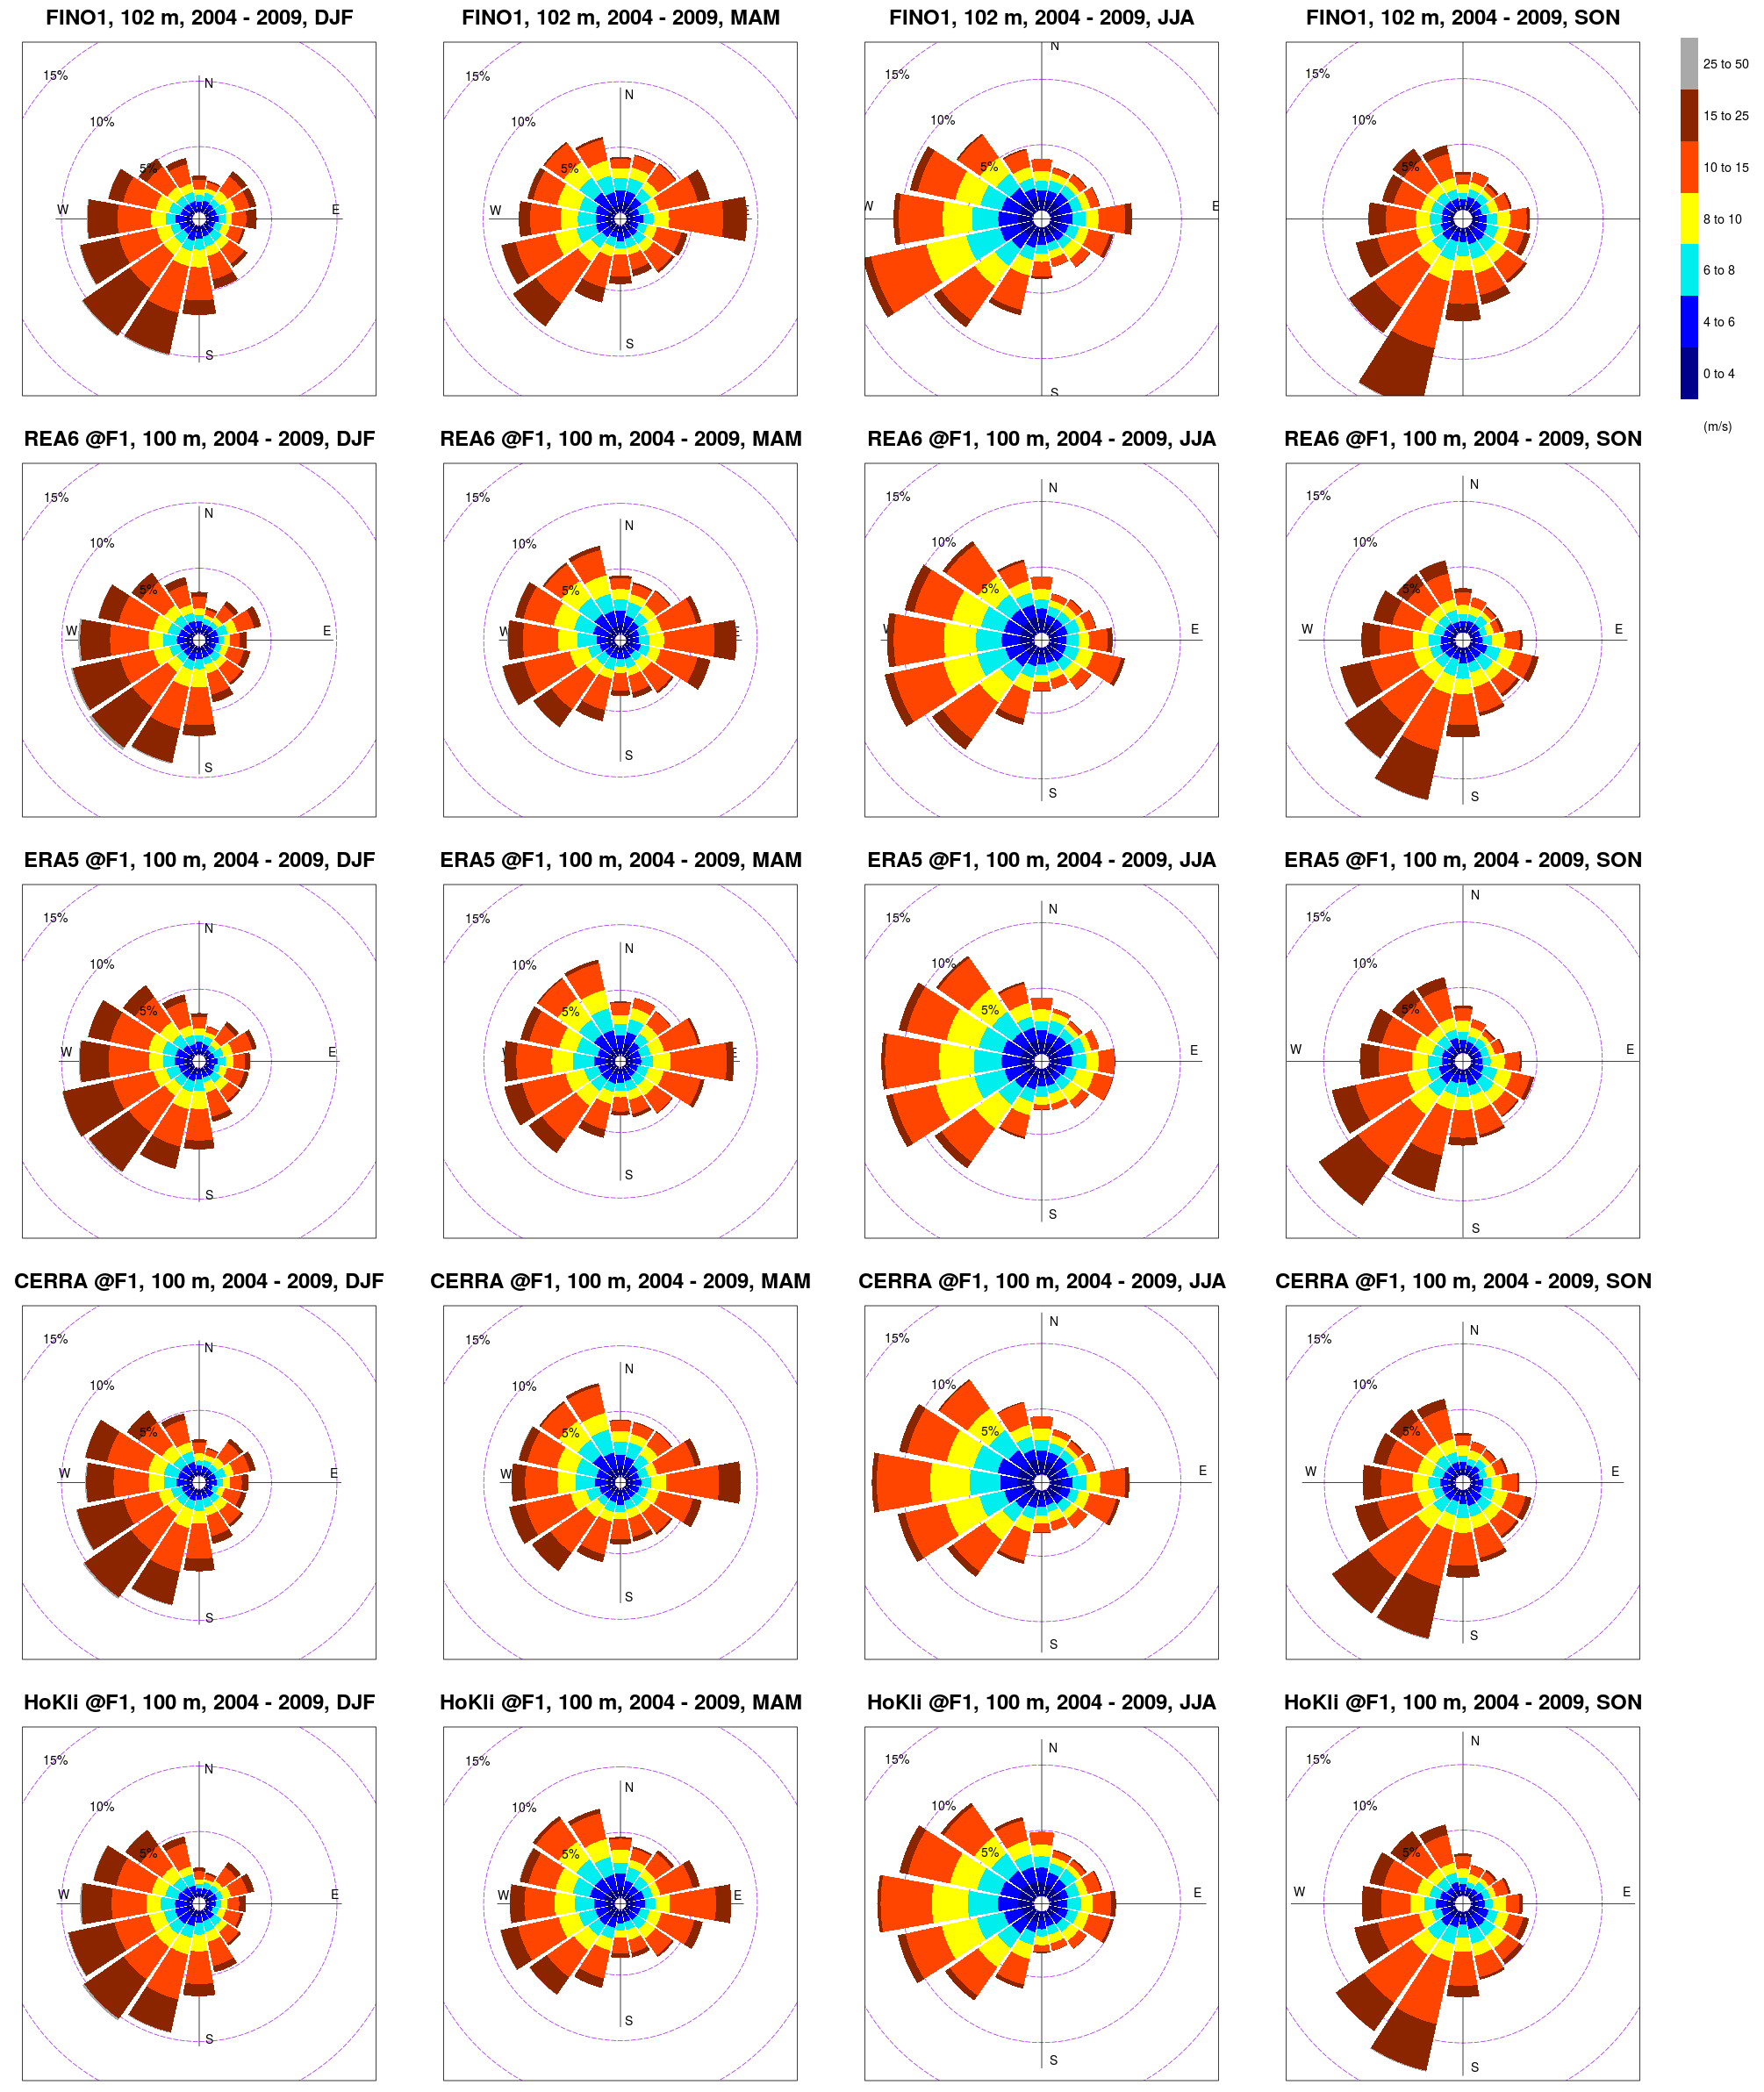
Figure A1Wind rose of hourly wind speed and direction at FINO1 for heights at or near 100 m. Results are shown for seasons (column 1 to 4 panels) DJF, MAM, JJA and SON. First row panels show results obtained from hourly FINO1 measurements (10 min averages) of wind speed at 102 m and wind direction at 91 m. Consequtive rows show results at FINO1 grid points of model-based products (row 2 panels) COSMO-REA6, (row 3 panels) ERA5, (row 4 panels CERRA-fc and (row 5 panels) HoKliSim-De. The time period is 2004–2009.
FINO data was downloaded from http://fino.bsh.de (last access: 6 November 2023). Data was made available by the FINO (Forschungsplattformen in Nord- und Ostsee) initiative, which was funded by the German Federal Ministry of Economic Affairs and Climate Action (BMWK) on the basis of a decision by the German Bundestag, organised by the Projekttraeger Juelich (PTJ) and coordinated by the German Federal Maritime and Hydrographic Agency (BSH). FINO data is now available via the new Insitu-Portal of BSH https://www.bsh.de/EN/TOPICS/Monitoring_systems/MARNET_monitoring_network/FINO/fino_node.html (Bundesamt für Seeschifffahrt und Hydrographie, 2023b).
NEWA data is obtained from the New European Wind Atlas, a free, web-based application developed, owned and operated by the NEWA Consortium. For additional information see https://www.neweuropeanwindatlas.eu/ (NEWA Consortium, 2023).
This study has been conducted using EU Copernicus Marine Service Information. The WIND_GLO_PHY_L4_MY_012_006, https://doi.org/10.48670/moi-00185 (EU Copernicus Marine Service, 2023), product is used in the final version of the manuscript.
The ERA5 reanalysis data are publicly and freely available from the producers at the Copernicus Climate Data Store (CDS; Hersbach et al., 2023, https://doi.org/10.24381/cds.adbb2d47), or via ECMWF's Meteorological Archival and Retrieval System (MARS).
The COSMO-REA6 reanalysis data are publicly available at DWD's Open Data Server (https://opendata.dwd.de/climate_environment/REA/COSMO_REA6/, Deutscher Wetterdienst, 2023).
The Hamburg Ocean Atmosphere Parameters and Fluxes from Satellite Data – HOAPS – 4.0 (Andersson et al., 2017, https://doi.org/10.5676/EUM_SAF_CM/HOAPS/V002) are available from EUMETSAT Satellite Application Facility on Climate Monitoring (CM SAF) via https://wui.cmsaf.eu, © (2023) (EUMETSAT, 2023).
Selected parameters of HoKliSim-De are available via https://doi.org/10.5676/DWD/HOKLISIM_V2022.01 (Brienen et al., 2022).
Date from the Copernicus European Regional Re-Analysis (CERRA) are publicly and freely available from the producers at the Copernicus Climate Date Store (CDS; https://doi.org/10.24381/cds.38b394e6, Schimanke et al., 2021a, https://doi.org/10.24381/cds.622a565a, Schimanke et al., 2021b).
All authors contributed to the results and evaluation presented here. TS wrote the first draft of the manuscript. SSc contributed to integrating CERRA. SB contributed to integrating HoKliSim-De.
The contact author has declared that none of the authors has any competing interests.
Publisher's note: Copernicus Publications remains neutral with regard to jurisdictional claims made in the text, published maps, institutional affiliations, or any other geographical representation in this paper. While Copernicus Publications makes every effort to include appropriate place names, the final responsibility lies with the authors.
This article is part of the special issue “EMS Annual Meeting: European Conference for Applied Meteorology and Climatology 2022”. It is a result of the EMS Annual Meeting: European Conference 2022. The corresponding presentation was part of session UP3.6: Global and regional reanalyses.
The authors thank Anja Niedorf (DWD) and Marc Schröder (DWD) for the provision of data from EUMETSAT CM SAF (HOAPS v4 and its extension).
The authors thank Andrea Hahmann and one anonymous reviewer for their helpful comments.
Part of this research has been supported by the BMBF programme ClimXtreme (grant no. 01LP1904A).
This paper was edited by Eric Bazile and reviewed by Andrea Hahmann and one anonymous referee.
Akhtar, N., Geyer, B., Rockel, B., Sommer, P. S., and Schrum, C.: Accelerating deployment of offshore wind energy alter wind climate and reduce future power generation potentials, Sci. Rep., 11, 11826, https://doi.org/10.1038/s41598-021-91283-3, 2021. a
Akhtar, N., Geyer, B., and Schrum, C.: Impacts of accelerating deployment of offshore windfarms on near-surface climate, Sci. Rep., 12, 18307, https://doi.org/10.1038/s41598-022-22868-9, 2022. a, b
Andersson, A., Fennig, K., Klepp, C., Bakan, S., Graßl, H., and Schulz, J.: The Hamburg Ocean Atmosphere Parameters and Fluxes from Satellite Data – HOAPS-3, Earth Syst. Sci. Data, 2, 215–234, https://doi.org/10.5194/essd-2-215-2010, 2010. a, b
Andersson, A., Graw, K., Schröder, M., Fennig, K., Liman, J., Bakan, S., Hollmann, R., and Klepp, C.: Hamburg Ocean Atmosphere Parameters and Fluxes from Satellite Data – HOAPS 4.0, EUMETSAT [data set], https://doi.org/10.5676/EUM_SAF_CM/HOAPS/V002, 2017. a, b
Baldauf, M., Seifert, A., Förstner, J., Majewski, D., Raschendorfer, M., and Reinhardt, T.: Operational Convective-Scale Numerical Weather Prediction with the COSMO Model: Description and Sensitivities, Mon. Weather Rev., 139, 3887–3905, https://doi.org/10.1175/MWR-D-10-05013.1, 2011. a
Ban, N., Caillaud, C., Coppola, E., Pichelli, E., Sobolowski, S., Adinolfi, M., Ahrens, B., Alias, A., Anders, I., Bastin, S., Belšić, D., Berthou, S., Brisson, E., Cardoso, R. M., Chan, S. C., Christensen, O. B., Fernández, J., Fita, L., Frisius, T., Gšparac, G., Giorgi, F., Goergen, K., Haugen, J. E., Hodnebrog, Ø., Kartsios, S., Katragkou, E., Kendon, E. J., Keuler, K., Lavin-Gullon, A., Lenderink, G., Leutwyler, D., Lorenz, T., Maraun, D., Mercogliano, P., Milovac, J., Panitz, H.-J., Raffa, M., Remedio, A. R., Schär, C., Soares, P. M. M., Srnec, L., Steensen, B. M., Stocchi, P., Tölle, M. H., Truhetz, H., Vergara-Temprado, J., de Vries, H., Warrach-Sagi, K., Wulfmeyer, V., and Zander, M. J.: The first multi-model ensemble of regional climate simulations at kilometer-scale resolution, part I: evaluation of precipitation, Clim. Dynam., 57, 275–302, https://doi.org/10.1007/s00382-021-05708-w, 2021. a
Berg, P., Wagner, S., Kunstmann, H., and Schädler, G.: High resolution regional climate model simulations for Germany: part I – validation, Clim. Dynam., 40, 401–414, https://doi.org/10.1007/s00382-012-1508-8, 2013. a
BNetzA: Monitoringbericht 2022 von Bundesnetzagentur und Bundeskartellamt, https://data.bundesnetzagentur.de/Bundesnetzagentur/SharedDocs/Mediathek/Monitoringberichte/monitoringberichtenergie2022.pdf (last access: 6 November 2023), 2023. a
Bollmeyer, C., Keller, J. D., Ohlwein, C., Wahl, S., Crewell, S., Friederichs, P., Hense, A., Keune, J., Kneifel, S. ., Pscheidt, I., Redl, S., and Steinke, S.: Towards a high-resolution regional reanalysis for the European CORDEX domain, Q. J. Roy. Meteorol. Soc., 141, 1–15, https://doi.org/10.1002/qj.2486, 2015. a, b, c
Borgers, R., Dirksen, M., Wijnant, I. L., Stepek, A., Stoffelen, A., Akhtar, N., Neirynck, J., Van de Walle, J., Meyers, J., and van Lipzig, N. P. M.: Mesoscale modelling of North Sea wind resources with COSMO-CLM: model evaluation and impact assessment of future wind farm characteristics on cluster-scale wake losses, Wind Energ. Sci. Discuss. [preprint], https://doi.org/10.5194/wes-2023-33, in review, 2023. a
Borsche, M., Kaiser-Weiss, A. K., and Kaspar, F.: Wind speed variability between 10 and 116 m height from the regional reanalysis COSMO-REA6 compared to wind mast measurements over Northern Germany and the Netherlands, Adv. Sci. Res., 13, 151–161, https://doi.org/10.5194/asr-13-151-2016, 2016. a
Brienen, S., Früh, B., Walter, A., Trusilova, K., and Becker, P.: A Central European precipitation climatology Part II: Application of the high-resolution HYRAS data for COSMO-CLM evaluation, Meteorol. Z., 25, 195–214, https://doi.org/10.1127/metz/2016/0617, 2016. a
Brienen, S., Haller, M., Brauch, J., and Früh, B.: HoKliSim-De COSMO-CLM climate model simulation data version V2022.01, DWD [data set], https://doi.org/10.5676/DWD/HOKLISIM_V2022.01, 2022. a, b, c
Brousseau, P., Bouttier, F., Hello, G., Seity, Y., Berre, L., Montmerle, T., Auger, L., and Malardel, S.: A prototype convective-scale data assimilation system for operation: the Arome-RUC, in: HIRLAM Tech. Rep., vol. 68, 23–30, CNRM – Centre national de recherches météorologiques, CNRM-GAME, Météo-France and CNRS, Toulouse, France, http://www.umr-cnrm.fr/ (last access: 6 November 2023), 2008. a
Brune, S., Keller, J. D., and Wahl, S.: Evaluation of wind speed estimates in reanalyses for wind energy applications, Adv. Sci. Res., 18, 115–126, https://doi.org/10.5194/asr-18-115-2021, 2021. a
Bundesamt für Seeschifffahrt und Hydrographie: Nordsee-Handbuch, südöstlicher Teil: Lister Tief bis Ems, in: 7th Edn., Hamburg, Rostock, 399 pp., ISSN 2190-037X, 2023a. a
Bundesamt für Seeschifffahrt und Hydrographie: Forschungsplattformen in Nord- und Ostsee, FINO data, Bundesamt für Seeschifffahrt und Hydrographie [data set], https://www.bsh.de/EN/TOPICS/Monitoring_systems/MARNET_monitoring_network/FINO/fino_node.html (last access: 6 November 2023), 2023b. a
CEDIM: Orkantief “Christian”, West- und Mitteleuropa, 27.–29.10.2013, CEDIM – Center for Disaster Management and Risk Reduction Technology, http://www.wettergefahren-fruehwarnung.de/Ereignis/20131031_e.html(last access: 17 February 2023), 2013. a
de Kloe, J., Stoffelen, A., and Verhoef, A.: Improved Use of Scatterometer Measurements by Using Stress-Equivalent Reference Winds, IEEE J. Select. Top. Appl. Earth Obs. Remote Sens., 10, 2340–2347, https://doi.org/10.1109/JSTARS.2017.2685242, 2017. a
Deutscher Wetterdienst: Orkantief CHRISTIAN am 28. Oktober 2013, https://www.dwd.de/DE/leistungen/besondereereignisse/stuerme/20131028_orkantief_christian.pdf (last access: 17 February 2023), 2013. a, b, c
Deutscher Wetterdienst: COSMO-REA6 at DWD open data server, Deutscher Wetterdienst [data set], https://opendata.dwd.de/climate_environment/REA/COSMO_REA6/ (last access: 6 November 2023), 2023. a
Doms, G., Förstner, J., Heise, E., Herzog, H.-J., Mironov, D., Raschendorfer, M., Reinhardt, T., Ritter, B., Schrodin, R., Schulz, J.-P., and Vogel, G.: A Description of the Nonhydrostatic Regional COSMO-Model, Part II Physical Parameterizations, DWD, https://doi.org/10.5676/DWD_pub/nwv/cosmo-doc_5.00_II, 2013. a
Donlon, C. J., Martin, M., Stark, J., Roberts-Jones, J., Fiedler, E., and Wimmer, W.: The Operational Sea Surface Temperature and Sea Ice Analysis (OSTIA) system, Remote Sens. Environ., 116, 140–158, https://doi.org/10.1016/j.rse.2010.10.017, 2012. a
Dörenkämper, M., Olsen, B. T., Witha, B., Hahmann, A. N., Davis, N. N., Barcons, J., Ezber, Y., García Bustamante, E., González-Rouco, J. F., Navarro, J., Sastre-Marugán, M., Sīle, T., Trei, W., Žagar, M., Badger, J., Gottschall, J., Sanz Rodrigo, J., and Mann, J.: The Making of the New European Wind Atlas – Part 2: Production and evaluation, Geosci. Model Dev., 13, 5079–5102, https://doi.org/10.5194/gmd-13-5079-2020, 2020. a
El-Said, A., Brousseau, P., Ridal, M., and Randriamampianina, R.: Towards Full Flow-Dependence: New Temporally Varying EDA Quotient Functionality to Estimate Background Errors in CERRA, J. Adv. Model. Earth Syst., 14, e2021MS002637, https://doi.org/10.1029/2021MS002637, 2022. a
EU Copernicus Marine Service: WIND_GLO_PHY_L4_MY_012_006, EU Copernicus Marine Service [data set], https://doi.org/10.48670/moi-00185, 2023. a
EUMETSAT: CM SAF – Product navigator, https://wui.cmsaf.eu (last access: 6 November 2023), 2023. a
Geyer, B., Weisse, R., Bisling, P., and Winterfeldt, J.: Climatology of North Sea wind energy derived from a model hindcast for 1958–2012, J. Wind Eng. Indust. Aerodynam., 147, 18–29, https://doi.org/10.1016/j.jweia.2015.09.005, 2015. a
Gliksman, D., Averbeck, P., Becker, N., Gardiner, B., Goldberg, V., Grieger, J., Handorf, D., Haustein, K., Karwat, A., Knutzen, F., Lentink, H. S., Lorenz, R., Niermann, D., Pinto, J. G., Queck, R., Ziemann, A., and Franzke, C. L. E.: Review article: A European perspective on wind and storm damage – from the meteorological background to index-based approaches to assess impacts, Nat. Hazards Earth Syst. Sci., 23, 2171–2201, https://doi.org/10.5194/nhess-23-2171-2023, 2023. a
Gustafsson, N., Berre, L., Hörnquist, S., Huang, X.-Y., Lindskog, M., Navascués, B., Mogensen, K., and Thorsteinsson, S.: Three-dimensional variational data assimilation for a limited area model, Tellus A, 53, 425–446, https://doi.org/10.3402/tellusa.v53i4.12198, 2001. a
Hahmann, A. N., Sīle, T., Witha, B., Davis, N. N., Dörenkämper, M., Ezber, Y., García-Bustamante, E., González-Rouco, J. F., Navarro, J., Olsen, B. T., and Söderberg, S.: The making of the New European Wind Atlas – Part 1: Model sensitivity, Geosci. Model Dev., 13, 5053–5078, https://doi.org/10.5194/gmd-13-5053-2020, 2020. a, b, c
Hersbach, H., Bell, B., Berrisford, P., Hirahara, S., Horányi, A., Muñoz-Sabater, J., Nicolas, J., Peubey, C., Radu, R., Schepers, D., Simmons, A., Soci, C., Abdalla, S., Abellan, X., Balsamo, G., Bechtold, P., Biavati, G., Bidlot, J., Bonavita, M., De Chiara, G., Dahlgren, P., Dee, D., Diamantakis, M., Dragani, R., Flemming, J., Forbes, R., Fuentes, M., Geer, A., Haimberger, L., Healy, S., Hogan, R. J., Hólm, E., Janisková, M., Keeley, S., Laloyaux, P., Lopez, P., Lupu, C., Radnoti, G., de Rosnay, P. C., Rozum, I., Vamborg, F., Villaume, S., and Thépaut, J.-N.: The ERA5 global reanalysis, Q. J. Roy. Meteorol. Soc., 146, 1999–2049, https://doi.org/10.1002/qj.3803, 2020. a, b, c, d
Hersbach, H., Bell, B., Berrisford, P., Biavati, G., Horányi, A., Muñoz Sabater, J., Nicolas, J., Peubey, C., Radu, R., Rozum, I., Schepers, D., Simmons, A., Soci, C., Dee, D., Thépaut, J.-N.: ERA5 hourly data on single levels from 1940 to present, Copernicus Climate Change Service (C3S) Climate Data Store (CDS) [data set], https://doi.org/10.24381/cds.adbb2d47, 2023. a
Hsu, S. A., Meindl, E. A., and Gilhousen, D. B.: Determining the Power-Law Wind-Profile Exponent under Near-Neutral Stability Conditions at Sea, J. Appl. Meteorol. Clim., 33, 757–765, https://doi.org/10.1175/1520-0450(1994)033<0757:DTPLWP>2.0.CO;2, 1994. a
Kalverla, P. C., Duncan Jr., J. B., Steeneveld, G.-J., and Holtslag, A. A. M.: Low-level jets over the North Sea based on ERA5 and observations: together they do better, Wind Energ. Sci., 4, 193–209, https://doi.org/10.5194/wes-4-193-2019, 2019. a
Kaspar, F., Niermann, D., Borsche, M., Fiedler, S., Keller, J., Potthast, R., Rösch, T., Spangehl, T., and Tinz, B.: Regional atmospheric reanalysis activities at Deutscher Wetterdienst: review of evaluation results and application examples with a focus on renewable energy, Adv. Sci. Res., 17, 115–128, https://doi.org/10.5194/asr-17-115-2020, 2020. a, b, c, d
Kotlarski, S., Keuler, K., Christensen, O. B., Colette, A., Déqué, M., Gobiet, A., Goergen, K., Jacob, D., Lüthi, D., van Meijgaard, E., Nikulin, G., Schär, C., Teichmann, C., Vautard, R., Warrach-Sagi, K., and Wulfmeyer, V.: Regional climate modeling on European scales: a joint standard evaluation of the EURO-CORDEX RCM ensemble, Geosci. Model Dev., 7, 1297–1333, https://doi.org/10.5194/gmd-7-1297-2014, 2014. a, b
Krieger, D., Krueger, O., Feser, F., Weisse, R., Tinz, B., and von Storch, H.: German Bight storm activity, 1897–2018, Int. J. Climatol., 41, E2159–E2177, https://doi.org/10.1002/joc.6837, 2021. a
Leiding, T., Tinz, B., Gates, L., Rosenhagen, G., Herklotz, K., Senet, C., Outzen, O., Lindenthal, A., Neumann, T., Frühmann, R., Wilts, F., Bégué, F., Schwenk, P., Stein, D., Bastigkeit, I., Lange, B., Hagemann, S., Müller, S., and Schwabe, J.: ABSCHLUSSBERICHT, Förderprogramm des Bundesministeriums für Wirtschaft und Energie, Forschungsvorhaben FINO-Wind, Standardisierung und vergleichende Analyse der meteorologischen FINO-Messdaten (FINO123), https://www.dwd.de/DE/klimaumwelt/klimaforschung/klimaueberwachung/finowind/finodoku/abschlussbericht_pdf (last access: 4 November 2022), 2016. a, b, c, d
Lindskog, M., Gustafsson, N., Navascués, B., Mogensen, K., Huang, X.-Y., Yang, X., Andræ, U., Berre, L., Thorsteinsson, S., and Rantakokko, J.: Three-dimensional variational data assimilation for a limited area model, Tellus A, 53, 447–468, https://doi.org/10.3402/tellusa.v53i4.14578, 2001. a
Maas, O. and Raasch, S.: Wake properties and power output of very large wind farms for different meteorological conditions and turbine spacings: a large-eddy simulation case study for the German Bight, Wind Energ. Sci., 7, 715–739, https://doi.org/10.5194/wes-7-715-2022, 2022. a
NEWA Consortium: New European Wind Atlas, https://www.neweuropeanwindatlas.eu/ (last access: 6 November 2023), 2019. a
Niermann, D., Borsche, M., Kaiser-Weiss, A. K., and Kaspar, F.: Evaluating renewable-energy-relevant parameters of COSMO-REA6 by comparison with satellite data, station observations and other reanalyses, Meteorol. Z., 28, 347–360, https://doi.org/10.1127/metz/2019/0945, 2019. a
Platis, A., Siedersleben, S. K., Bange, J., Lampert, A., Bärfuss, K., Hankers, R., Cañadillas, B., Foreman, R., Schulz-Stellenfleth, J., Djath, B., Neumann, T., and Emeis, S.: First in situ evidence of wakes in the far field behind offshore wind farms, Sci. Rep., 8, 2045–2322, https://doi.org/10.1038/s41598-018-20389-y, 2018. a
Podein, P., Tinz, B., Blender, R., and Detels, T.: Reconstruction of annual mean wind speed statistics at 100 m height of FINO1 and FINO2 masts with reanalyses and the geostrophic wind, Meteorol. Z., 31, 89–100, https://doi.org/10.1127/metz/2021/1090, 2022. a, b, c
Porté-Agel, F., Bastankhah, M., and Shamsoddin, S.: Wind-Turbine and Wind-Farm Flows: A Review, Bound.-Lay. Meteorol., 174, 1573–1472, https://doi.org/10.1007/s10546-019-00473-0, 2020. a
Rausch, T., Cañadillas, B., Hampel, O., Simsek, T., Tayfun, Y. B., Neumann, T., Siedersleben, S., and Lampert, A.: Wind Lidar and Radiosonde Measurements of Low-Level Jets in Coastal Areas of the German Bight, Atmosphere, 13, 839, https://doi.org/10.3390/atmos13050839, 2022. a
Rockel, B., Will, A., and Hense, A.: The Regional Climate Model COSMO-CLM (CCLM), Meteorol. Z., 17, 347–348, https://doi.org/10.1127/0941-2948/2008/0309, 2008. a
Schimanke, S., Ridal, M., Le Moigne, P., Berggren, L., Undén, P., Randriamampianina, R., Andrea, U., Bazile, E., Bertelsen, A., Brousseau, P., Dahlgren, P., Edvinsson, L., El Said, A., Glinton, M., Hopsch, S., Isaksson, L., Mladek, R., Olsson, E., Verrelle, A., and Wang, Z.: CERRA sub-daily regional reanalysis data for Europe on height levels from 1984 to present, CDS [data set], https://doi.org/10.24381/cds.38b394e6, 2021a. a, b, c
Schimanke, S., Ridal, M., Le Moigne, P., Berggren, L., Undén, P., Randriamampianina, R., Andrea, U., Bazile, E., Bertelsen, A., Brousseau, P., Dahlgren, P., Edvinsson, L., El Said, A., Glinton, M., Hopsch, S., Isaksson, L., Mladek, R., Olsson, E., Verrelle, A., and Wang, Z.: CERRA sub-daily regional reanalysis data for Europe on single levels from 1984 to present, CDS [data set], https://doi.org/10.24381/cds.622a565a, 2021b. a, b, c
Sedefian, L.: On the Vertical Extrapolation of Mean Wind Power Density, J. Appl. Meteorol. Clim., 19, 488–493, https://doi.org/10.1175/1520-0450(1980)019<0488:OTVEOM>2.0.CO;2, 1980. a
Seity, Y., Brousseau, P., Malardel, S., Hello, G., Bénard, P., Bouttier, F., Lac, C., and Masson, V.: The AROME-France Convective-Scale Operational Model, Mon. Weather Rev., 139, 976–991, https://doi.org/10.1175/2010MWR3425.1, 2011. a
Spangehl, T. and Tinz, B.: Bericht, Ensemble von Reanalysen für Ausschreibungsverfahren 2021 der BNetzA nach WindSeeG – hier: für die Flächen N-3.7, N-3.8 und O-1.3, https://pinta.bsh.de/ (last access: 3 February 2023), 2021. a
Stark, J. D., Ridley, J., Martin, M., and Hines, A.: Sea ice concentration and motion assimilation in a sea ice−ocean model, J. Geophys. Res., 113, C05S91, https://doi.org/10.1029/2007JC004224, 2008. a
Steger, C. and Bucchignani, E.: Regional Climate Modelling with COSMO-CLM: History and Perspectives, Atmosphere, 11, 1250, https://doi.org/10.3390/atmos11111250, 2020. a
Taillefer, F.: CANARI (Code for the Analysis Necessary for Arpege for its Rejects and its Initialization): Technical documentation, Technical documentation, Internal CNRM/GMAP Rep., XXX, 55 pp., Groupe de Mode ́l. pour l'Assimilationet la Prévision, Cent. Natl. de Rech. Météorol., Météo-France, Toulouse, France, http://www.cnrm.meteo.fr/gmapdoc/spip.php?article3 (last access: 6 November 2023), 2002. a
Uppala, S. M., KÅllberg, P. W., Simmons, A. J., Andrae, U., Bechtold, V. D. C., Fiorino, M., Gibson, J. K., Haseler, J., Hernandez, A., Kelly, G. A., Li, X., Onogi, K., Saarinen, S., Sokka, N., Allan, R. P., Andersson, E., Arpe, K., Balmaseda, M. A., Beljaars, A. C. M., Berg, L. V. D., Bidlot, J., Bormann, N., Caires, S., Chevallier, F., Dethof, A., Dragosavac, M., Fisher, M., Fuentes, M., Hagemann, S., Hólm, E., Hoskins, B. J., Isaksen, L., Janssen, P. A. E. M., Jenne, R., Mcnally, A. P., Mahfouf, J.-F., Morcrette, J.-J., Rayner, N. A., Saunders, R. W., Simon, P., Sterl, A., Trenberth, K. E., Untch, A., Vasiljevic, D., Viterbo, P., and Woollen, J.: The ERA-40 re-analysis, Q. J. Roy. Meteorol. Soc., 131, 2961–3012, https://doi.org/10.1256/qj.04.176, 2005. a
Vautard, R., Kadygrov, N., Iles, C., Boberg, F., Buonomo, E., Bülow, K., Coppola, E., Corre, L., van Meijgaard, E., Nogherotto, R., Sandstad, M., Schwingshackl, C., Somot, S., Aalbers, E., Christensen, O. B., Ciarlo, J. M., Demory, M.-E., Giorgi, F., Jacob, D., Jones, R. G., Keuler, K., Kjellström, E., Lenderink, G., Levavasseur, G., Nikulin, G., Sillmann, J., Solidoro, C., Sørland, S. L., Steger, C., Teichmann, C., Warrach-Sagi, K., and Wulfmeyer, V.: Evaluation of the Large EURO-CORDEX Regional Climate Model Ensemble, J. Geophys. Res.-Atmos., 126, e2019JD032344, https://doi.org/10.1029/2019JD032344, 2021. a
von Storch, H., Feser, F., Geyer, B., Klehmet, K., Li, D., Rockel, B., Schubert-Frisius, M., Tim, N., and Zorita, E.: Regional reanalysis without local data: Exploiting the downscaling paradigm, J. Geophys. Res.-Atmos., 122, 8631–8649, https://doi.org/10.1002/2016JD026332, 2017. a
Wahl, S., Bollmeyer, C., Crewell, S., Figura, C., Friederichs, P., Hense, A., Keller, J. D., and Ohlwein, C.: A novel convective-scale regional reanalysis COSMO-REA2: Improving the representation of precipitation, Meteorol. Z., 26, 345–361, https://doi.org/10.1127/metz/2017/0824, 2017. a
Wang, Z. Q. and Randriamampianina, R.: The Impact of Assimilating Satellite Radiance Observations in the Copernicus European Regional Reanalysis (CERRA), Remote Sens., 13, 426, https://doi.org/10.3390/rs13030426, 2021. a
WindSeeG: Gesetz zur Entwicklung und Förderung der Windenergie auf See, http://www.gesetze-iminternet.de/windseeg/ (last access: 6 November 2023), 2023. a
Winterfeldt, J., Geyer, B., and Weisse, R.: Using QuikSCAT in the added value assessment of dynamically downscaled wind speed, Int. J. Climatol., 31, 1028–1039, https://doi.org/10.1002/joc.2105, 2011. a, b