 | 17 May 2023
Return values of temperature and snow loadings for 50, 100 and 120-year return periods to support building design standards in Ireland
Barry Coonan
This research produced gridded datasets and maps for use in building design standards to enhance resilience in support of climate change adaptation in Ireland.
The new isothermal maps of return values of maximum and minimum air temperatures at mean sea level for 50, 100 and 120-year return periods based on the generalised extreme value distribution will be crucial to inform the design of buildings and bridges. The warming of the maximum and minimum air temperatures due to climate change has increased the intensity of the highest maximum air temperature while decreasing the intensity of the lowest extreme minimum air temperature of the new isothermal maps compared to previously published maps for a 50-year return period. Specifically, the new extreme isotherms are 32 ∘C for the maximum air temperature and −14 ∘C for the minimum air temperature, whereas the processor maps presented 30 and −16 ∘C, respectively. The geographical distribution of the isotherms for the 120-year return period range from 28 to 34 ∘C for the maximum air temperature and from −6 to −18 ∘C for the minimum air temperature.
For the first time, isothermal maps of return values of the lowest 10 cm soil temperature for 50, 100 and 120-year return periods based on the generalised extreme value distribution have been produced for Ireland. The results presented here will be paramount to supporting the design of building structures. The values of the 120-year return period range from 0 to −2 ∘C. The produced maps represent the worst-case scenario in the current context of climate warming.
The new maps of return values of snow loading at 100 m above mean sea level for 50, 100 and 120-year return periods based on the generalised Pareto distribution will be indispensable to support the design of buildings and civil engineering works such as roof patterns or bridges. The values of the 50-year return period map present four classes spread North-East to South-West: < 0.3, 0.3–0.4, 0.4–0.5 and 0.5–0.6 kN m−2, which is more accurate than the previously published map.
It is expected that the comprehensive explanation of the methods and the rationale for the new maps presented here as being more accurate than the preceding maps will assist regulators in adopting these new maps in their own jurisdictions. Furthermore, these new maps will be of interest to a diversity of sectors, planners and policymakers to make long, lasting and climate-based sensitive decisions.
- Article
(13253 KB) - Full-text XML
- BibTeX
- EndNote


Research on air temperature trends and ETCCDI (Expert Team on Climate Change Detection and Indices) daily extreme air temperature indices (Mateus and Potito, 2022) and climate projections (Nolan and Flanagan, 2020) indicate that the climate of Ireland is changing. Met Éireann received funding as part of the Department of Housing, Local Government and Heritage to update and produce new gridded datasets and maps in support of Action 203 of Ireland's Climate Action Plan 2021 – Develop specific climate maps and data for use in building design to enhance resilience in support of climate change adaptation and to support the National Adaptation Framework (Mateus and Coonan, 2022a, b, c, 2023; Griffin et al., 2023).
Isothermal maps of return values of extreme high maximum and extreme low minimum air temperatures in degree Celsius for 50, 100 and 120-year return periods are critical to assist the design of buildings and bridges (e.g. Hopkins and Whyte, 1975; CEN, 2003; British Standards Institution, 2007; Rees et al., 2011). The isothermal maps of maximum and minimum air temperatures with a probability of being exceeded of 0.02 (1 in a 50-year return period) have formerly been produced for Ireland and the UK (British Standards Institution, 1978, 2007; National Standards Authority of Ireland, 2008). The methods used for the annual probability of exceedances other than 0.02 were furnished in the National Annex to BS EN 1991-1-5:2003 (British Standards Institution, 2007), EN 1991-1-5: 2003 (CEN, 2003) and National Annex to I.S. EN 1991-1-5-:2003 (National Standards Authority of Ireland, 2008). In this research, isothermal maps of the return values of the highest maximum and lowest minimum air temperatures for 50, 100 and 120-year return periods based on the generalised extreme value distribution (Coles, 2001; Gilleland and Katz, 2016) and adjusted to mean sea level (Hopkins and Whyte, 1975; CEN, 2003) for a dense network of 64 stations for the period from 1961 to 2020 are presented.
The design of building structures requires information on low soil temperatures. For the first time, isothermal maps of return values of the lowest 10 cm soil temperature in degree Celsius for 50, 100 and 120-year return periods based on the generalised extreme value distribution (Coles, 2001; Gilleland and Katz, 2016) have been produced for Ireland.
The maps of return values of snow loading in kilogram-force per square metre (kN m−2) for 50, 100 and 120-year return periods are important to inform the structural design of buildings and civil engineering works (National Standards Authority of Ireland, 2015a, b). Examples include the design of different roof patterns (International Organization for Standardization, 2013; National Standards Authority of Ireland, 2015a, b) and bridges (e.g. British Standards Institution, 2007). The previous map of return values of snow loading at 100 m above mean sea level for a 50-year return period for Ireland had assessed the greatest snow depth per year based on daily observations from a small network of 10 stations and without stations from Northern Ireland (Keegan, 2010; Government of Ireland, 2012; National Standards Authority of Ireland, 2015b). Discrepancies were identified in this map produced for Ireland (Keegan, 2010; Government of Ireland, 2012; National Standards Authority of Ireland, 2015b) with the map produced by British Standards Institution (2007) for the United Kingdom and Ireland. Specifically, the discrepancies in the map for Ireland refer to an area of 0.7 kN m−2 in the Dublin/Wicklow area, higher snow loadings of 0.6 kN m−2 in the Monaghan region and the Southern region represented as 0.4 kN m−2 (Keegan, 2010; Government of Ireland, 2012; National Standards Authority of Ireland, 2015b). As Keegan (2010) noted, the results should not be deemed overly accurate due to the small number of stations, the daily resolution of the snow depth observations and the relatively few years with significant snow. The new work presented here does not sustain these issues as a larger network of stations with extra locations in Northern Ireland is employed, including more hourly series, the length of the series is longer and the adjustment added to the daily snow depths to adjust for the discrepancy between daily and hourly values is more precise. Other snow loading map at sea level was produced for the UK and Ireland (National Standards Authority of Ireland, 2015a). In this research, return values of snow loadings at 100 m above mean sea level for 50, 100 and 120-year return periods based on the Generalised Pareto Distribution (Coles, 2001) are presented for Ireland.
The manuscript is structured as follows. Section 2 comprises the methodology, where the data, calculation of return values and the gridding methods are explained. Section 3 details the results and the discussion. The conclusion is provided in Sect. 4.
2.1 Return values of maximum and minimum air temperatures at mean sea level for 50, 100 and 120-year return periods
2.1.1 Data
A total of 64 stations with quality-controlled and homogenised daily maximum and minimum air temperature observations covering the period from 1961 to 2020 for the island of Ireland were employed in the data analysis (Fig. 1, Table 1). The observations for the 52 stations from Ireland were obtained from the National Climate Archive at Met Éireann and the observations for 12 stations from Northern Ireland were acquired from the Centre for Environmental Data Analysis (CEDA) Archive (Met Office, 2021a). Observations from Northern Ireland are employed in this research to improve the outputs in the border as Met Éireann publishes data for Ireland only.
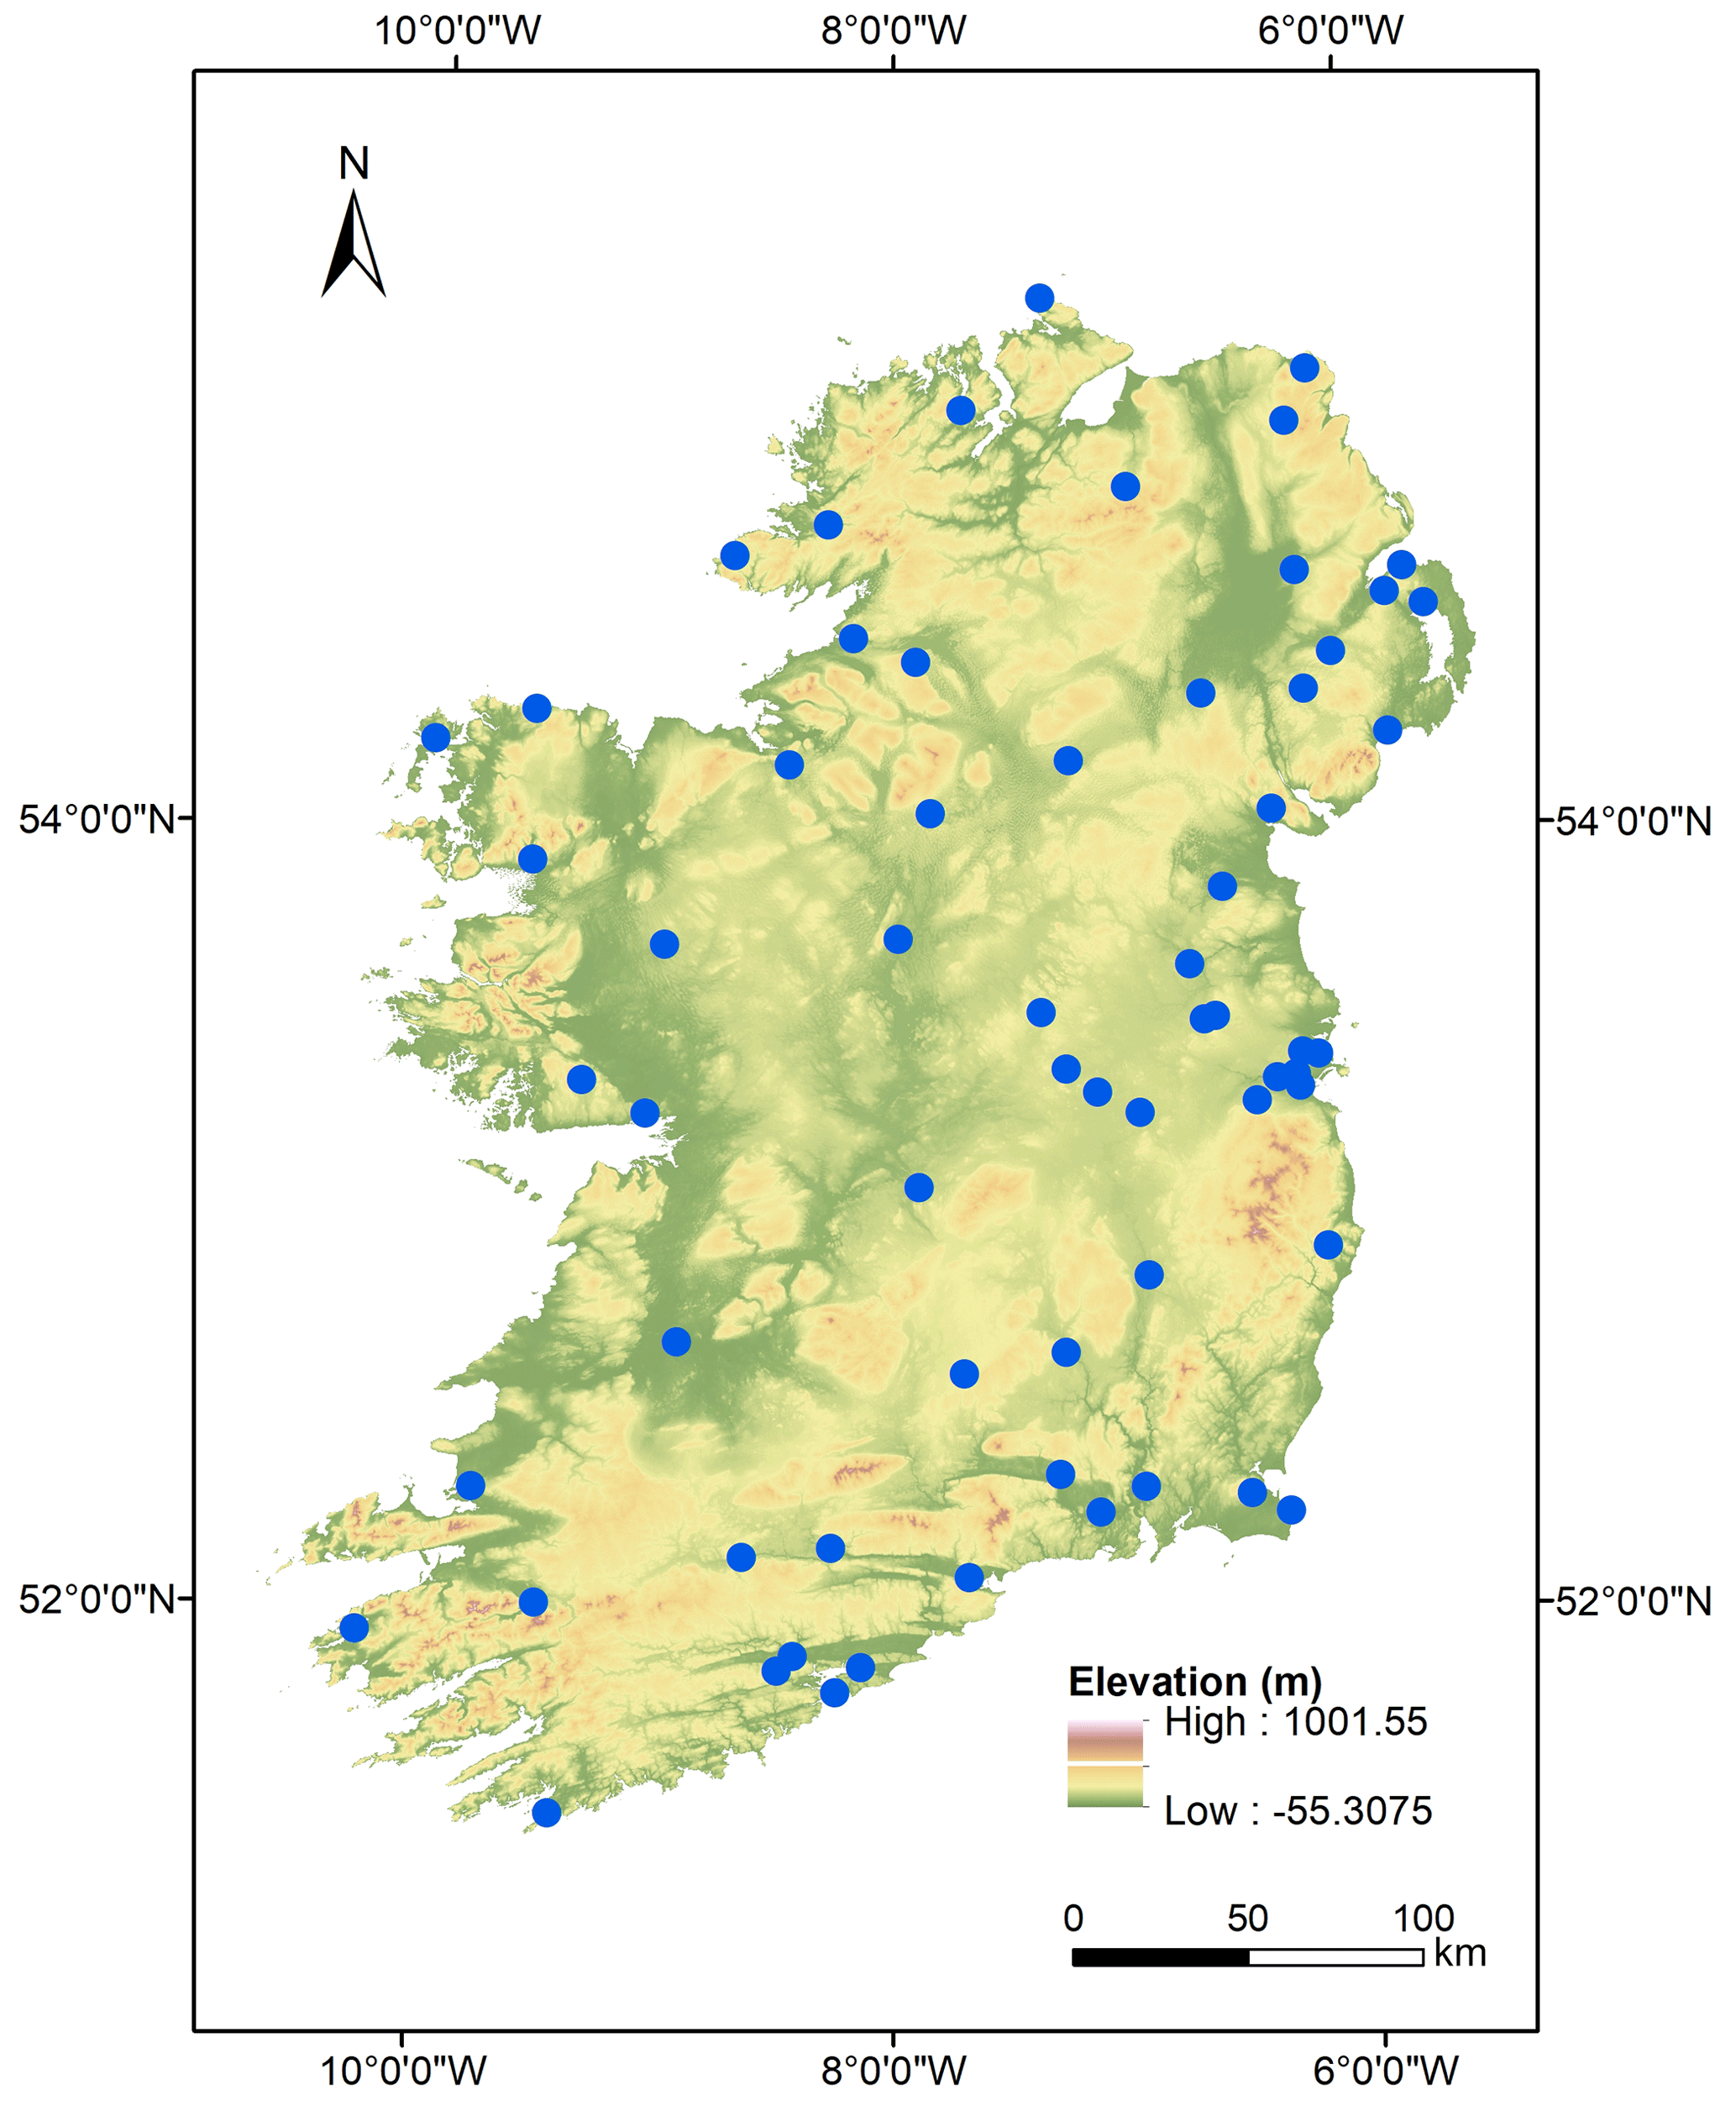
Figure 1Location of the stations with daily maximum and minimum air temperature observations on the island of Ireland.
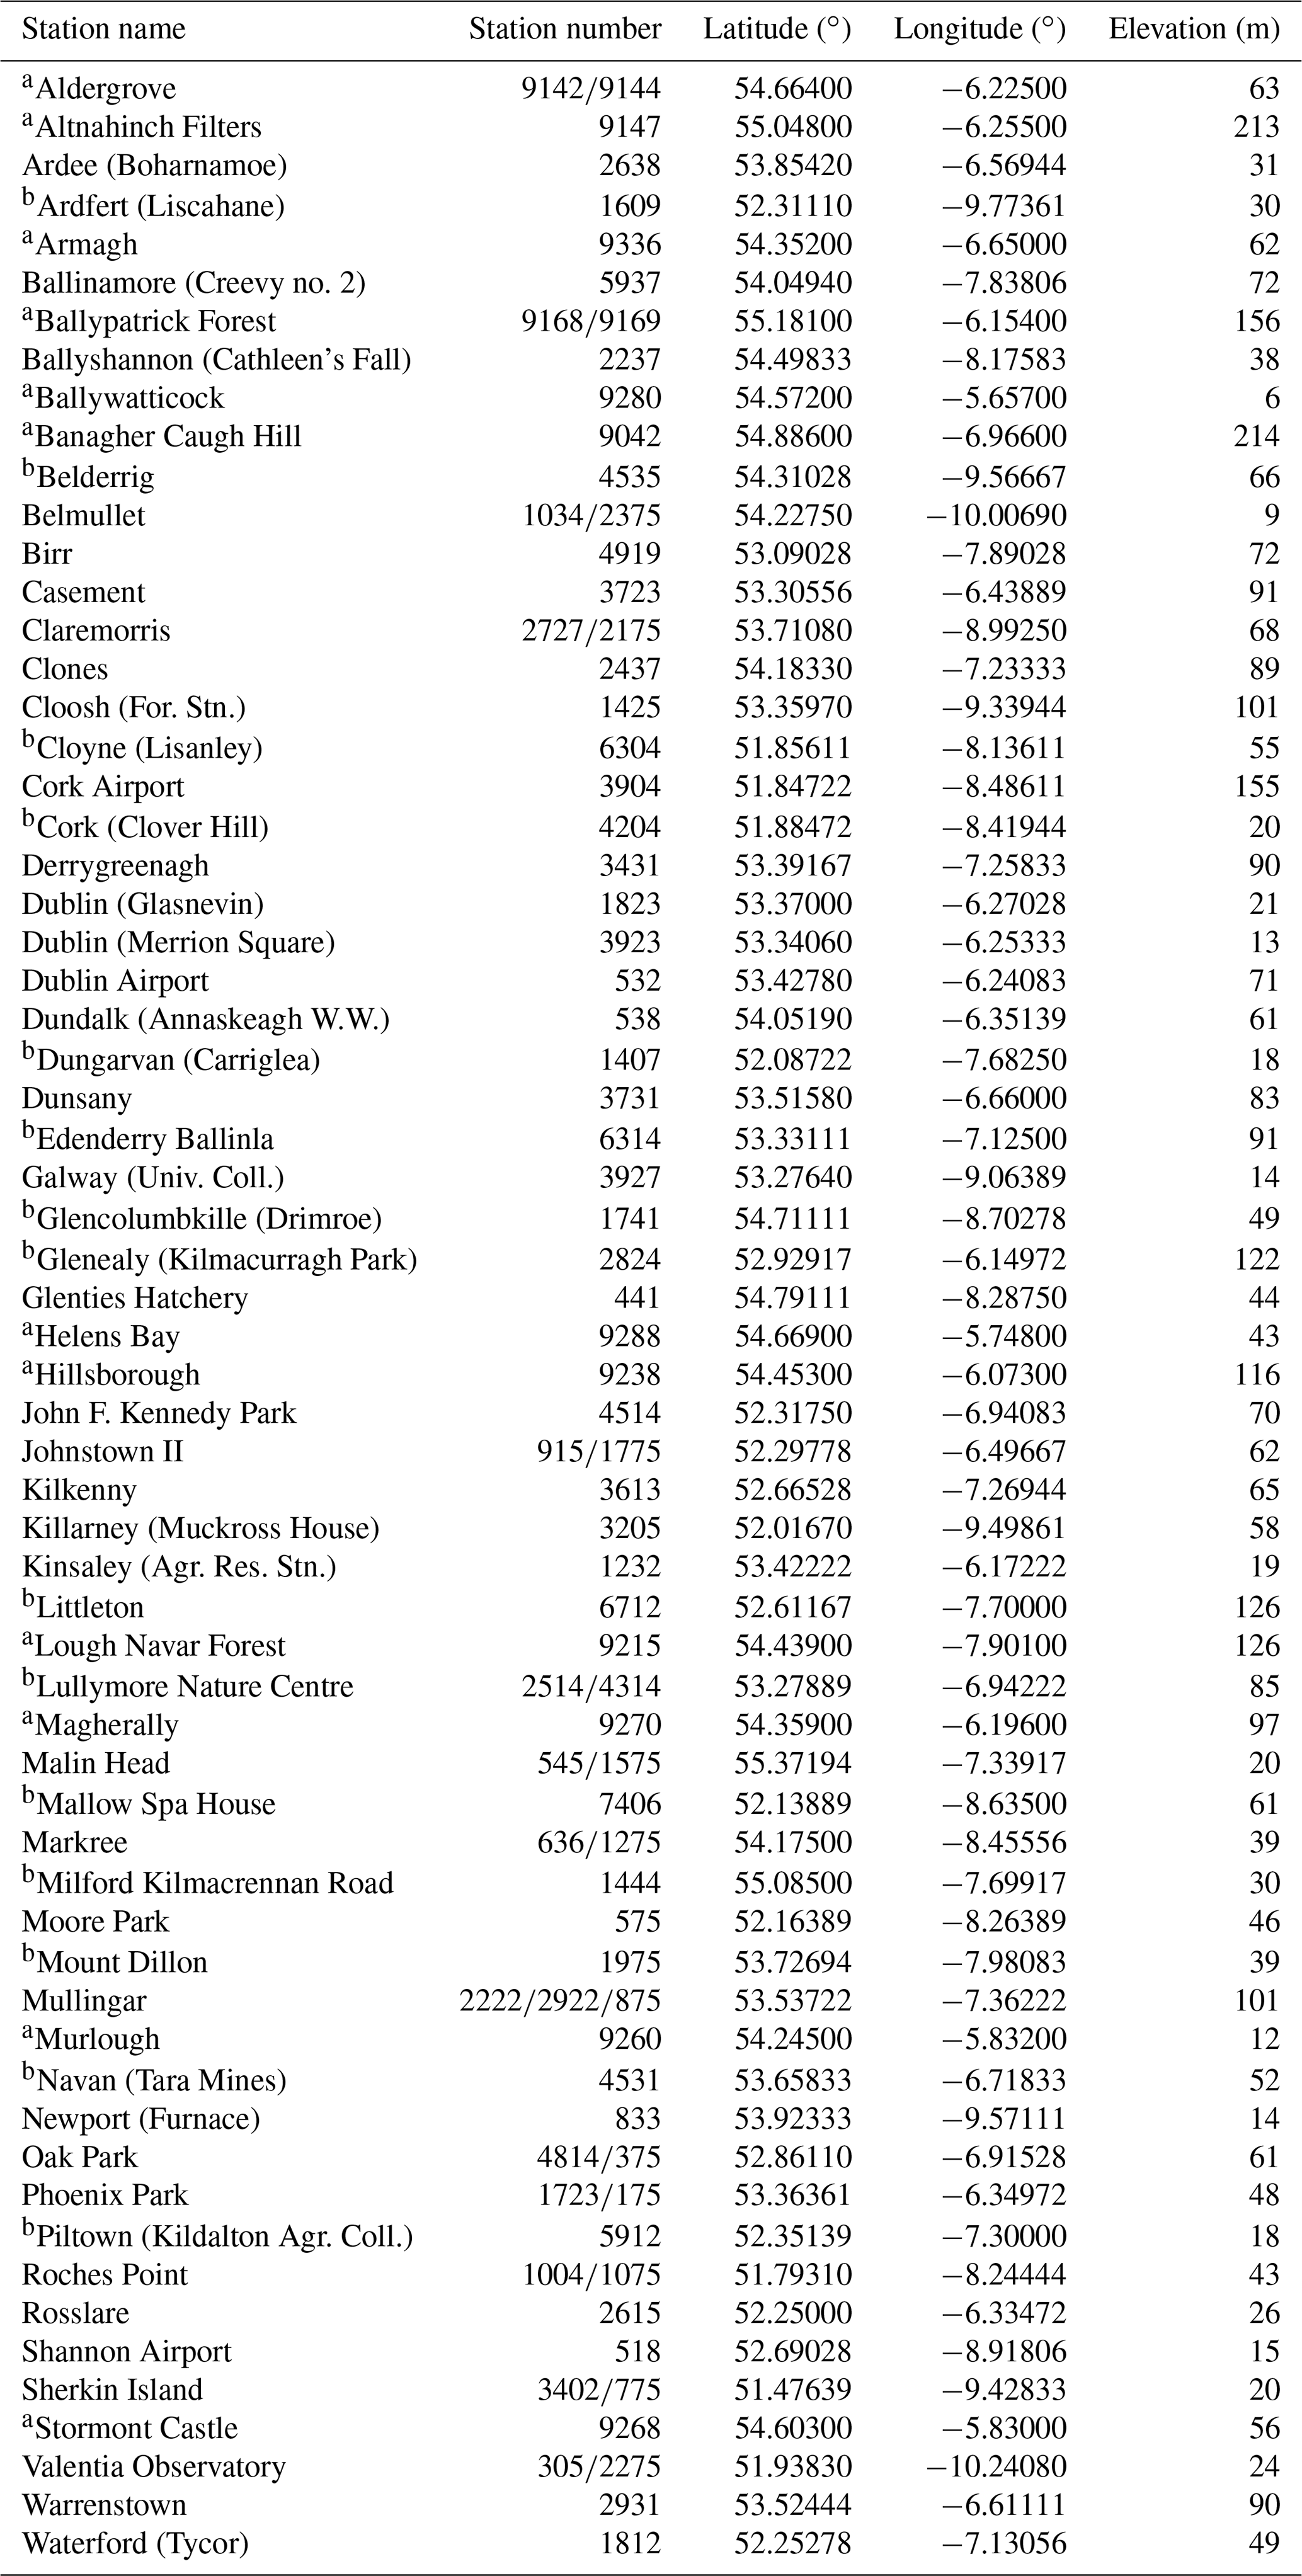
Table 1Meteorological stations and respective geographical coordinates, elevation and period covered by the daily maximum and minimum air temperature observations in the period from 1961 to 2020. Stations located in Northern Ireland are marked with an a. In case of replacement from manual to automatic station or re-location of the station, the geographical coordinates correspond to the most recent location. Some stations were joined and MASH infilled observations in case of gaps; such cases are marked with a b.
The daily maximum air temperature corresponds to the maximum value recorded during the 24 h observation period from 09:00 to 09:00 UTC. Similarly, the daily minimum air temperature represents the minimum value recorded during the 24 h observation period from 09:00 to 09:00 UTC.
The daily maximum and minimum air temperature observations have been quality-controlled according to climate consistency, internal consistency, persistency, day-to-day step change and spatial tests (e.g. Hubbard et al., 2005; Walsh, 2017).
Inhomogeneities in air temperature observations can result from changes in the station's location, thermometers, observation time, station surroundings, observer or the replacement of the manual with automatic stations (e.g. Trewin, 2010). Climate data homogeneity is necessary to minimise artificial effects and ensure that variability, change, and trends arise from weather and climate variations (Conrad and Pollack, 1950). The homogenisation procedures were applied by Met Éireann employing the software MASH (Szentimrey, 2017).
The meteorological instruments, methods of observation, and the quality-control and homogenisation procedures of the maximum and minimum air temperature observations follow the international standards stipulated by the World Meteorological Organization (2018, 2021).
2.1.2 Adjustment of maximum and minimum air temperature for height above sea level
The annual maxima of the maximum air temperature and the annual minima of the minimum air temperature series were adjusted for height above sea level following the methodology described by Hopkins and Whyte (1975) and adopted by CEN (2003) and the National Standards Authority of Ireland (2008). Specifically, the Irish Standard I.S. EN 1991-1-5:2003 + NA Eurocode 1: Actions on structures – Part 1-5: General actions – Thermal actions (National Standards Authority of Ireland, 2008) specifies the recommended method to adjust maximum and minimum air temperatures for height above mean sea level, which must be adopted. Based on the National Standards Authority of Ireland (2008), the minimum air temperature observations were adjusted by subtracting 0.5 ∘C per 100 m height whereas the maximum air temperatures were adjusted by subtracting 1.0 ∘C per 100 m height.
2.1.3 Calculation of return values
Extreme values are scarce, and the estimation of return levels for 50, 100 and 120-year return periods entails an extrapolation from instrumental observations to unobserved levels, and extreme value theory enables a class of models to allow such extrapolation (Coles, 2001).
The daily maximum air temperature observations were assessed to calculate the highest value per year from 1961 to 2020 per station and following a block maxima approach (Coles, 2001; Gilleland and Katz, 2016). In parallel, the lowest value of the minimum air temperature was calculated per year from 1961 to 2020 and per station. The generalised extreme value distribution was fitted to the series of the highest maximum air temperature observations reduced to mean sea level to generate the return levels for 50, 100 and 120-year return periods for each station. Similarly, this procedure was applied to the series of the lowest minimum air temperature reduced to mean sea level, except that the values were multiplied by −1 before the extreme value distribution function was fitted (Coles, 2001; Gilleland and Katz, 2016). The generalised extreme value distribution and the block maxima approach algorithms were applied by employing the extreme value analysis R package extRemes 2.0, which has a focal point on climate applications (Gilleland and Katz, 2016).
2.2 Return values of the lowest 10 cm soil temperature for 50, 100 and 120-year return periods
2.2.1 Data
A total of 39 stations with quality-controlled daily 10 cm soil temperature observations registered in the period from 1953 to 2021 and with lengths ranging from 30 to 69 years were used in the data analysis (Fig. 2, Table 2). The observations from the 30 stations in Ireland were acquired from the National Climate Archive at Met Éireann. For the 9 stations from Northern Ireland, the observations were obtained from the CEDA Archive (Met Office, 2021b).
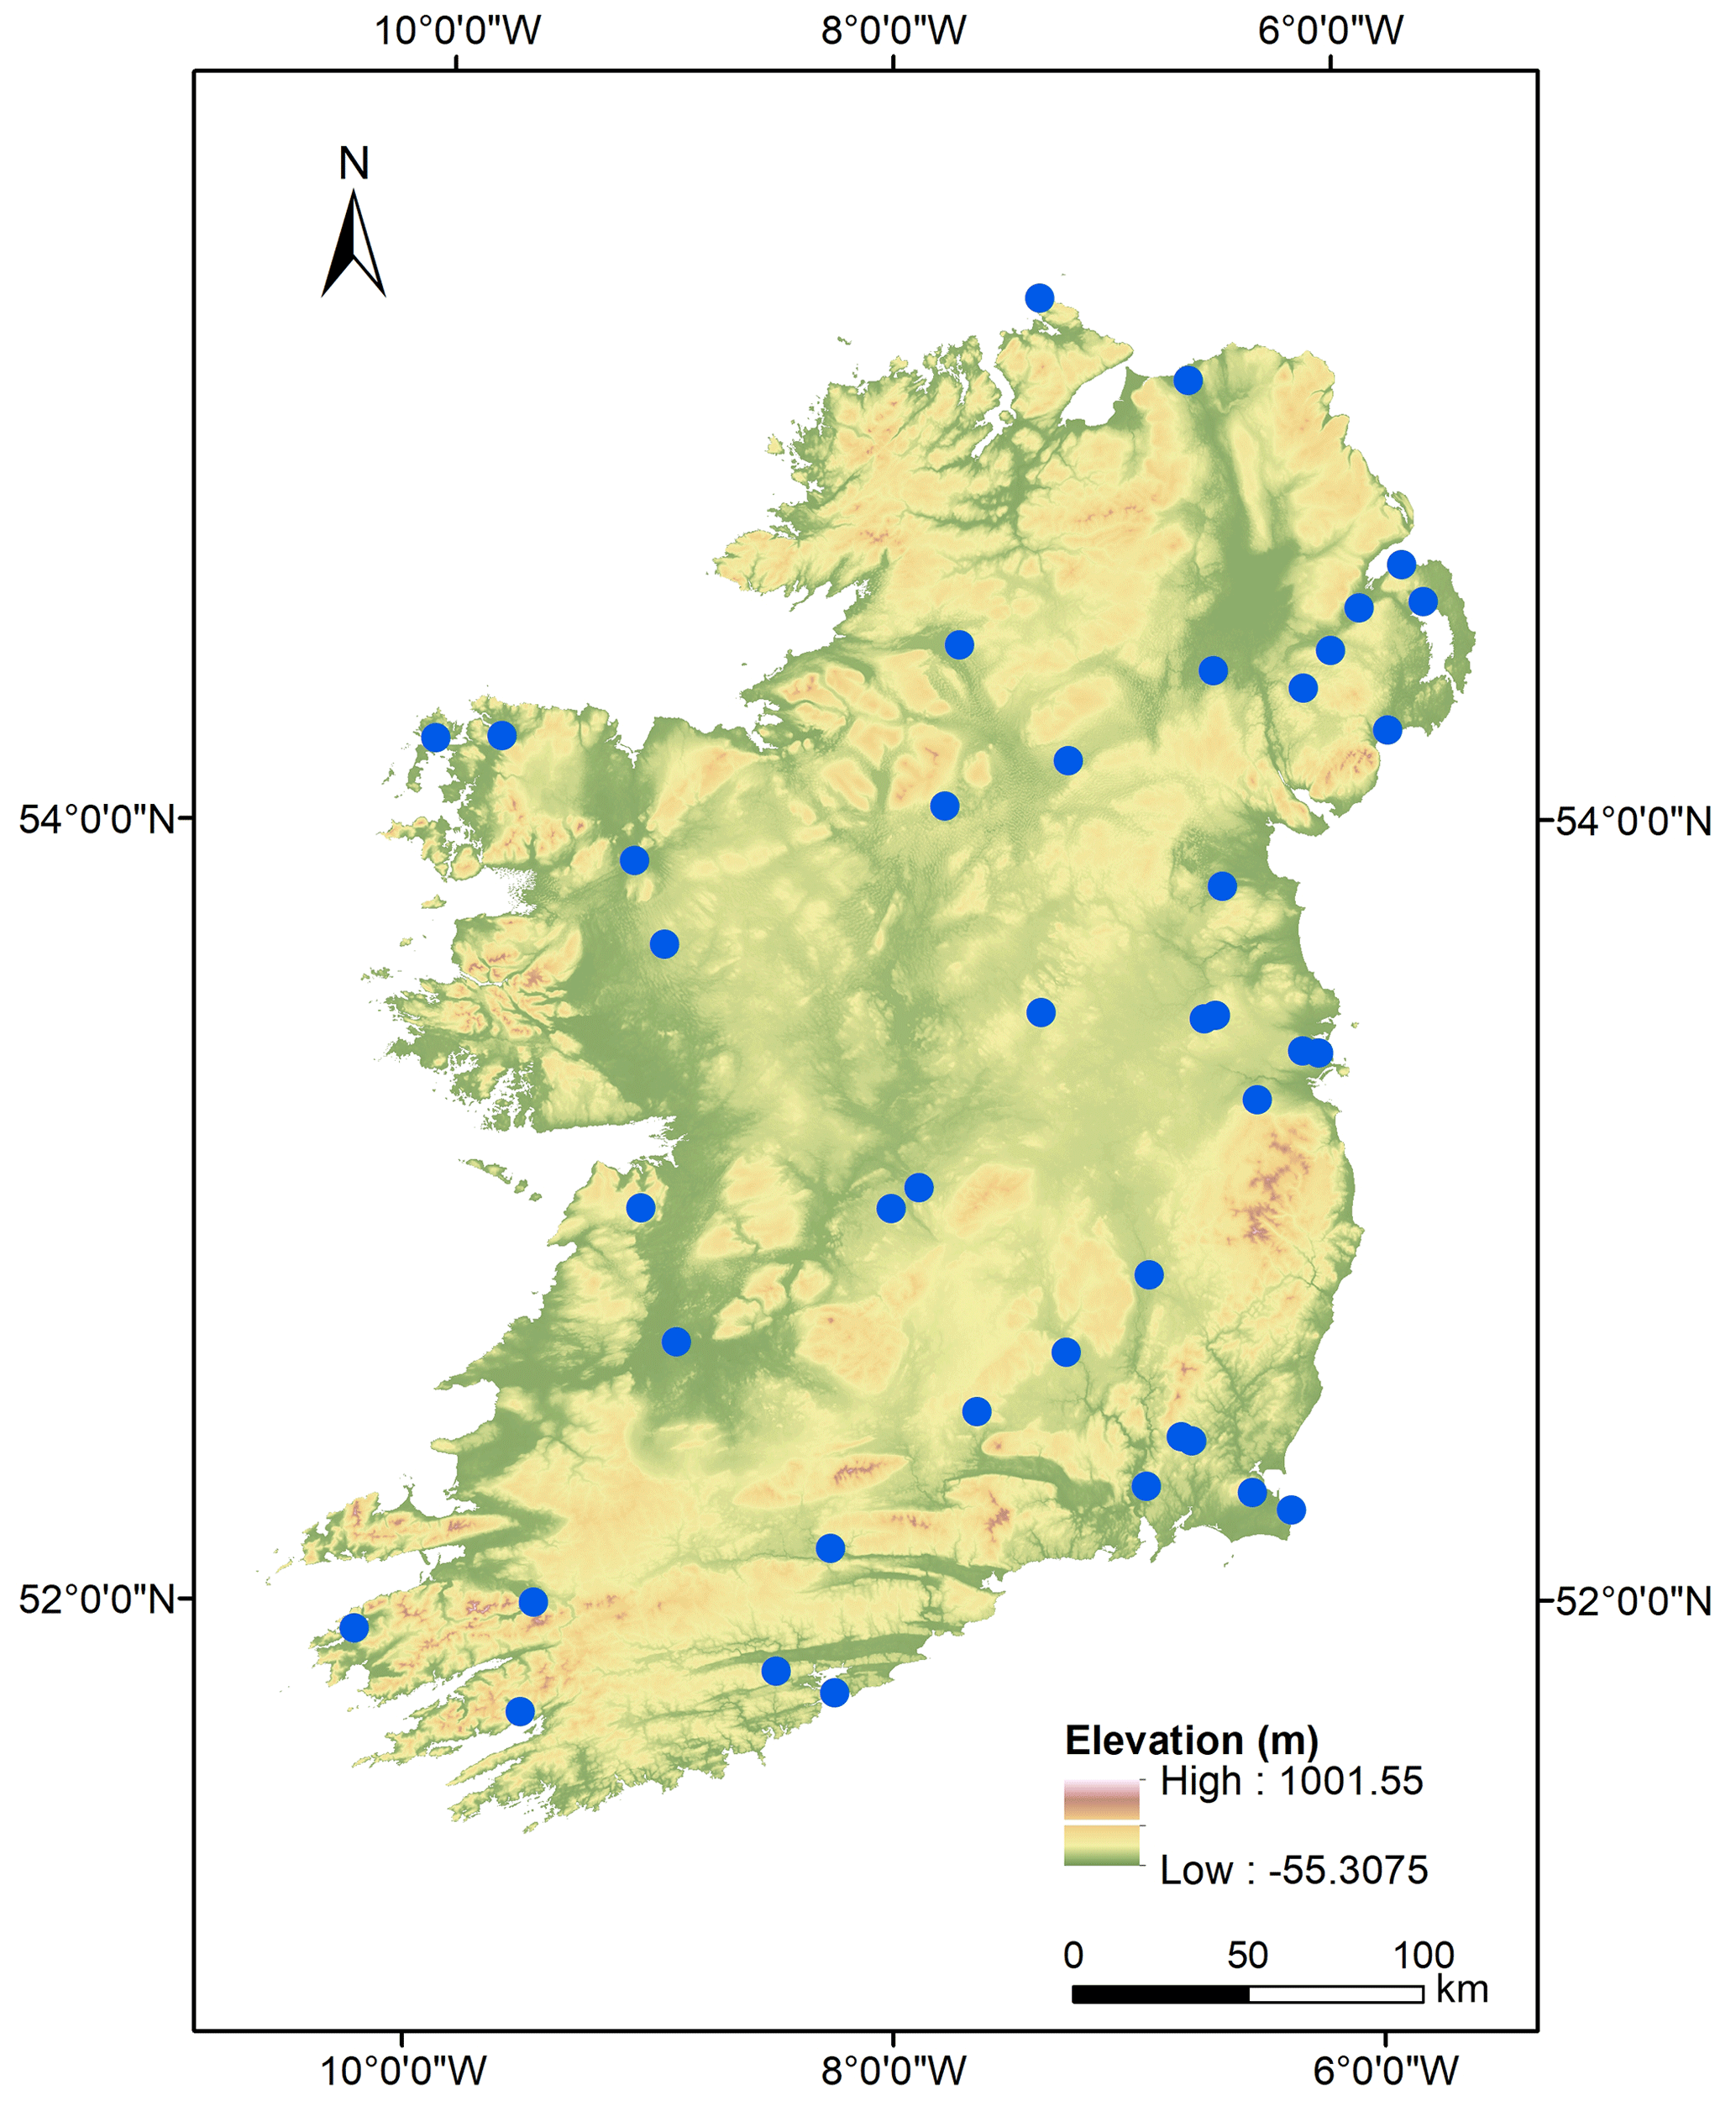
Figure 2Location of the stations with 10 cm soil temperature observations on the island of Ireland.
Table 2Meteorological stations and respective elevation, geographical coordinates, period and observation time covered by the 10 cm soil temperature observations. Stations in Northern Ireland are marked with an asterisk (*). In case of replacement from manual to automatic station or re-location of the station, the geographical coordinates correspond to the most recent location.
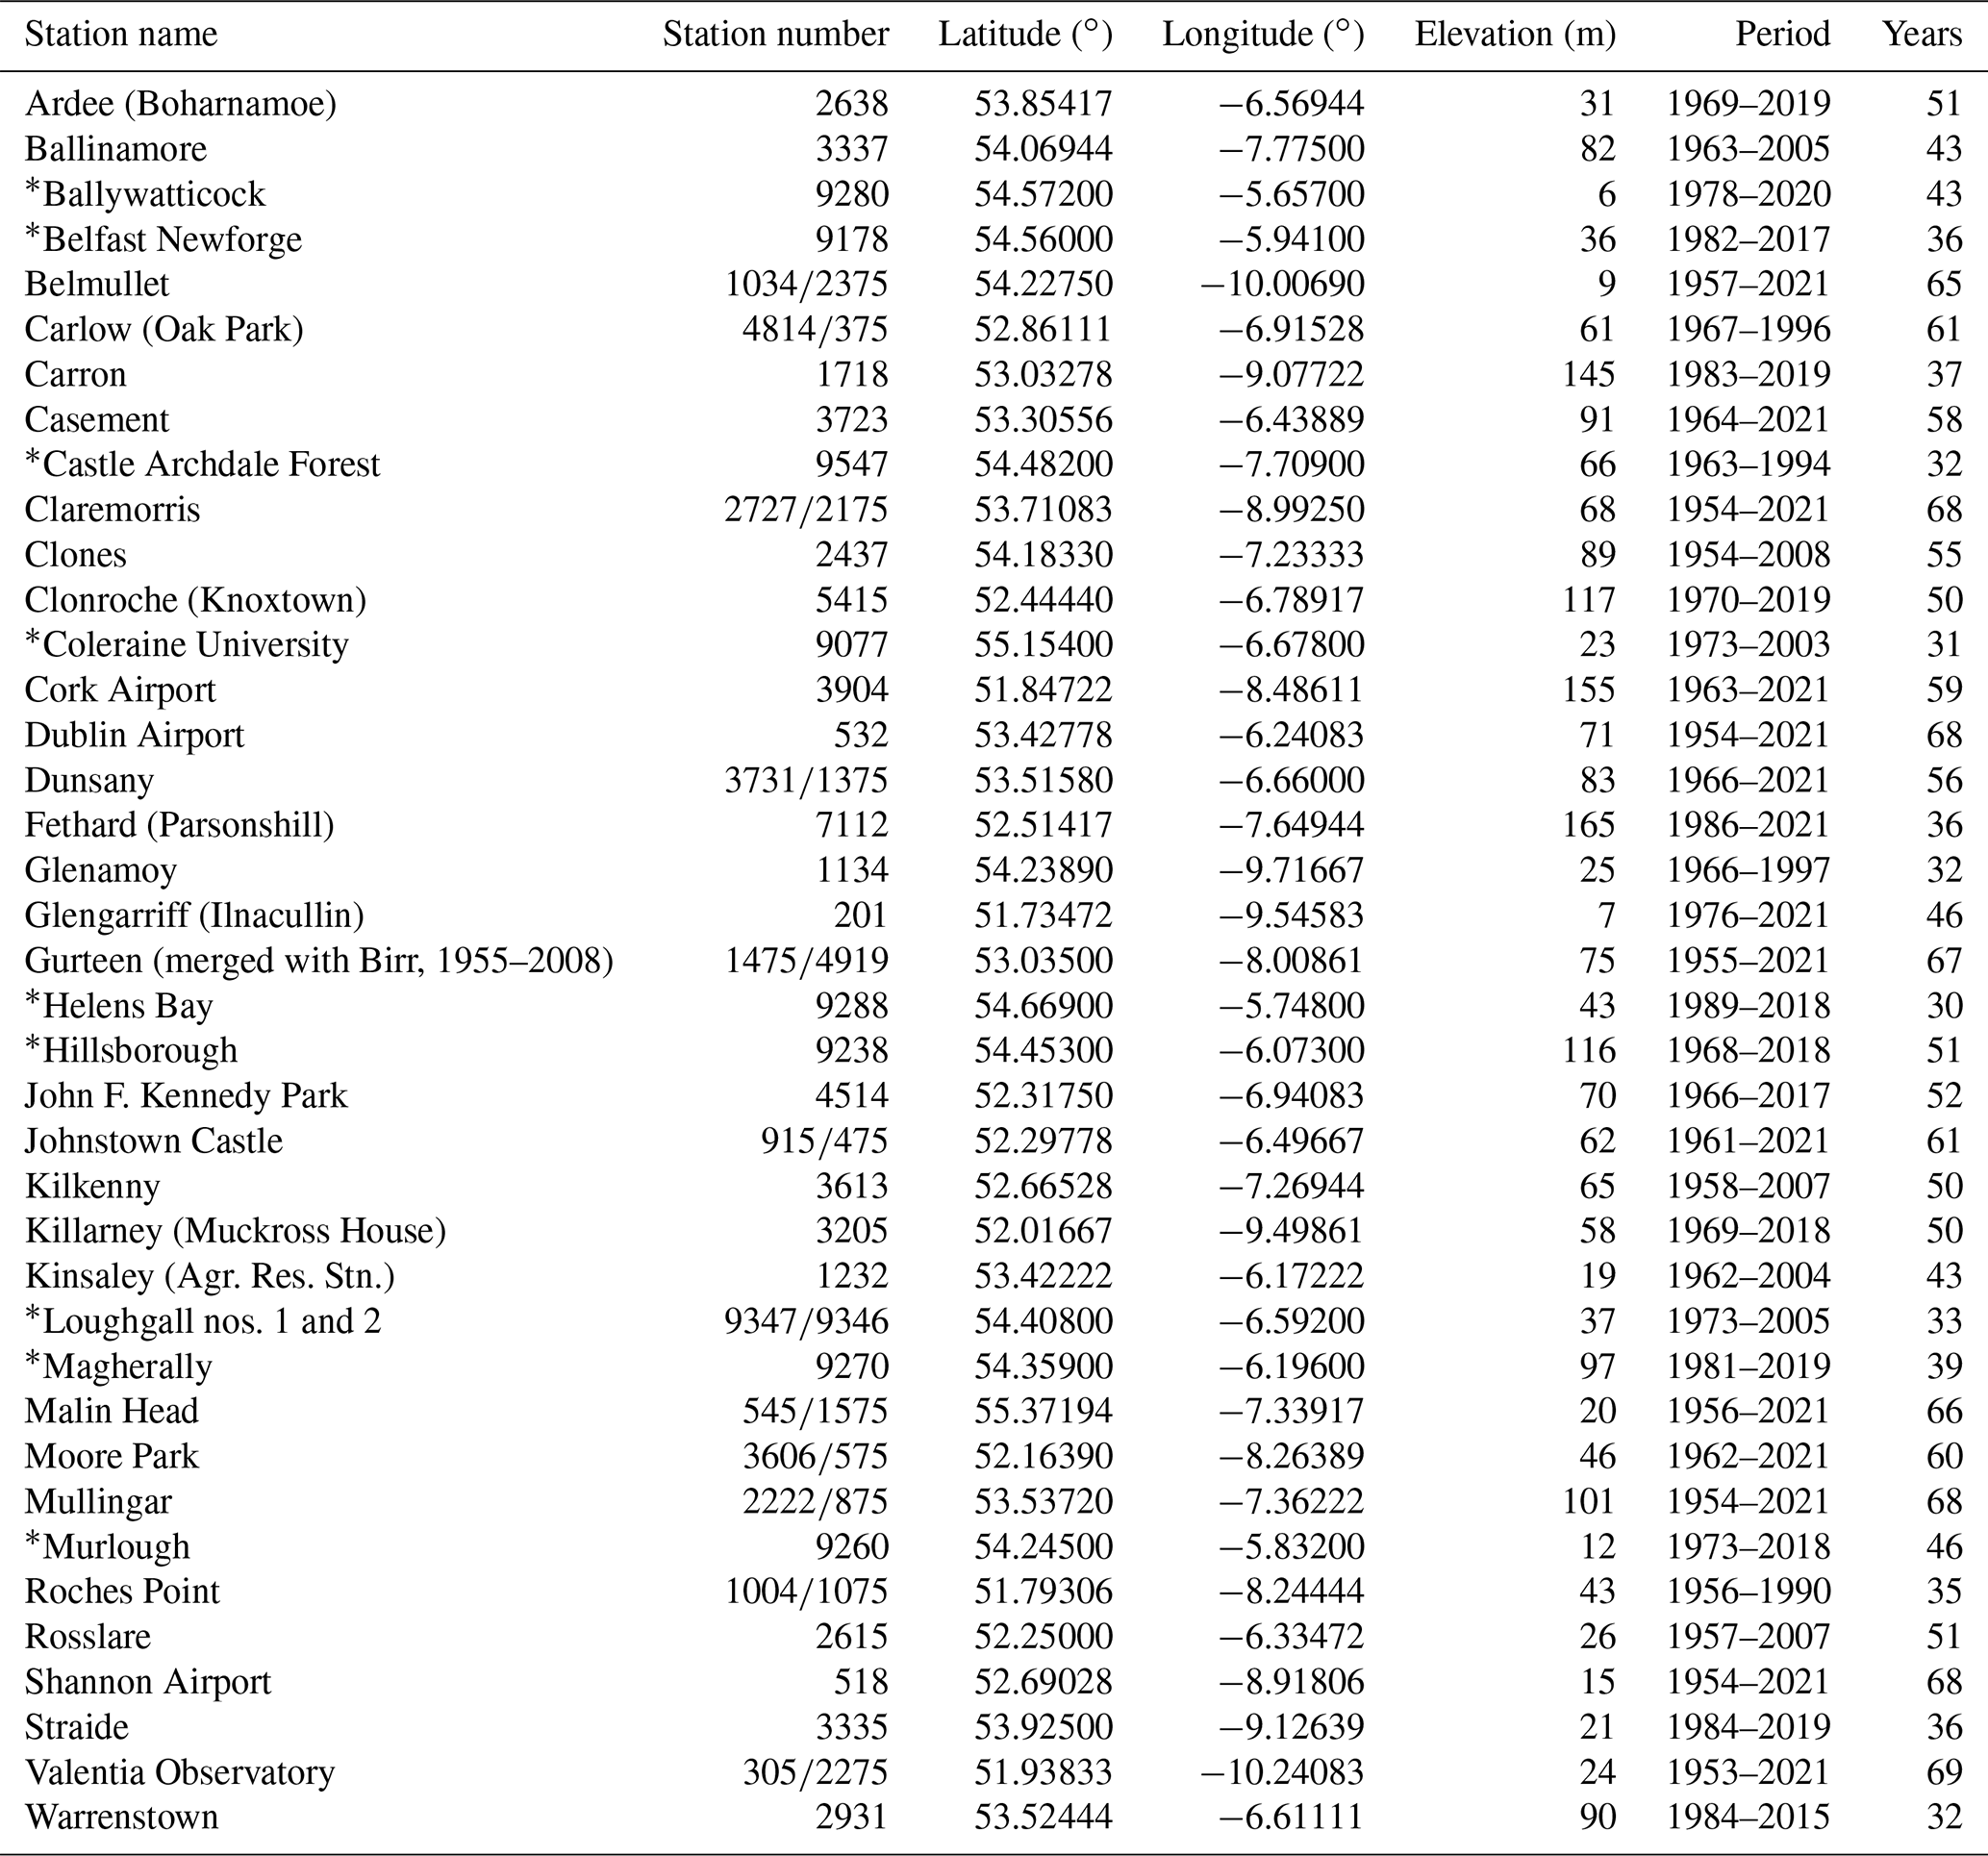
The 10 cm soil temperature observations from stations in Ireland are instantaneous records registered once daily at 09:00 UTC at the climatological stations and at 03:00, 09:00, 15:00 and 21:00 UTC daily at synoptic stations. In the case of the 10 cm soil temperature observations from stations in Northern Ireland, the records are instantaneous and were registered daily at 09:00 UTC. Additionally, hourly observations were registered at Ballywatticock, Co. Down from 15 November 2010, Helens Bay, Co. Down from the 1 November 2002 and Murlough, Co. Down from 15 December 2009.
The meteorological instruments, methods of observation, and the quality-control procedures of the 10 cm soil temperature observations follow the international standards recommended by the World Meteorological Organization (2018, 2021).
2.2.2 Calculation of return values
The 10 cm soil temperature observations were analysed to calculate the lowest observation per year and station according to a block maxima approach (Coles, 2001; Gilleland and Katz, 2016). The generalised extreme value distribution was fitted to the lowest 10 cm soil temperature series to produce the return levels for 50, 100 and 120-year return periods for each station. The negative 10 cm soil temperature values were multiplied by −1 before the extreme value distribution function was fitted using the extreme value analysis R package extRemes 2.0 (Gilleland and Katz, 2016).
2.3 Return period of snow loadings at 100 m above mean sea level
2.3.1 Data
A total of 33 stations with quality-controlled daily snow depth observations were employed in the data analysis (Fig. 3, Table 3). The daily snow depth observations from 19 stations in Ireland cover the period from 1940 to 2022 and have lengths between 33 and 80 years of data, which was obtained from the National Climate Archive at Met Éireann. A total of 14 stations from Northern Ireland have daily snow depth observations covering the period from 1959 to 2022 and with lengths between 16 to 64 years of data, which were accessed from the CEDA Archive (Met Office, 2021c). Hourly snow depth observations for 13 stations with a record length generally from 1990, which have an overlapping with daily data, were also employed in the data analysis. The hourly observations were obtained from the National Climate Archive at Met Éireann and from the CEDA Archive (Met Office, 2021d).
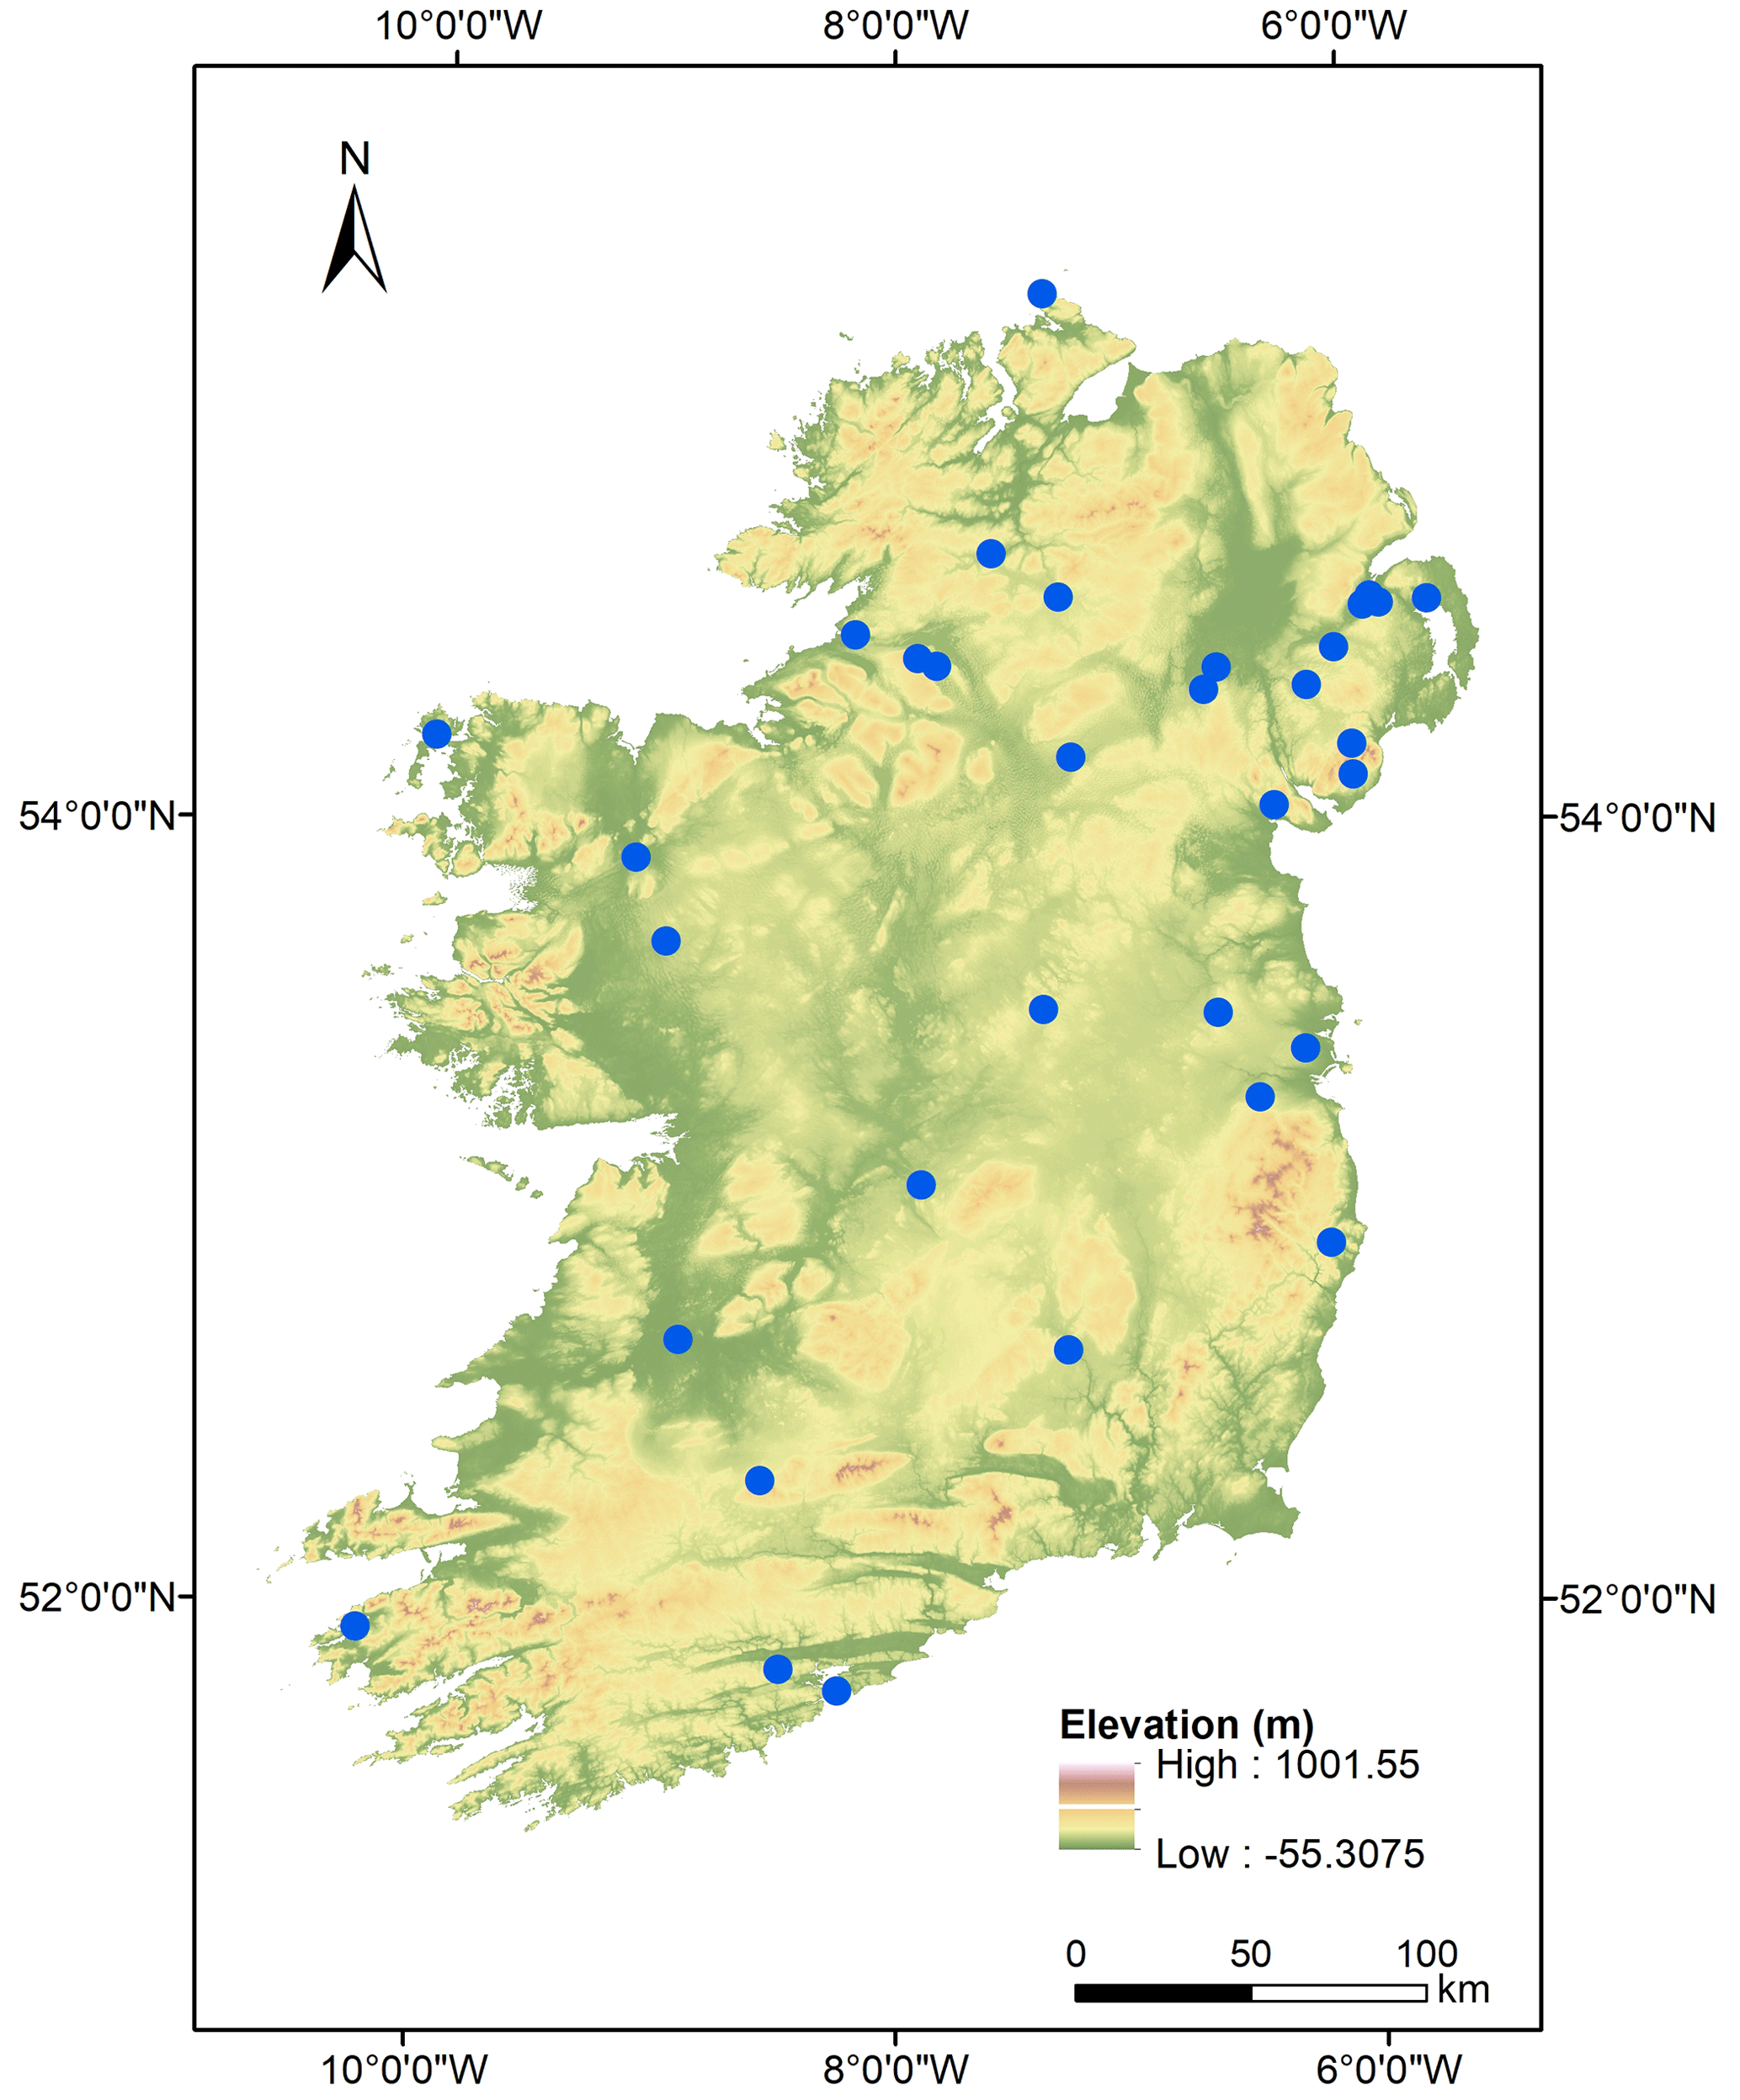
Figure 3Location of the stations with snow depth observations on the island of Ireland.
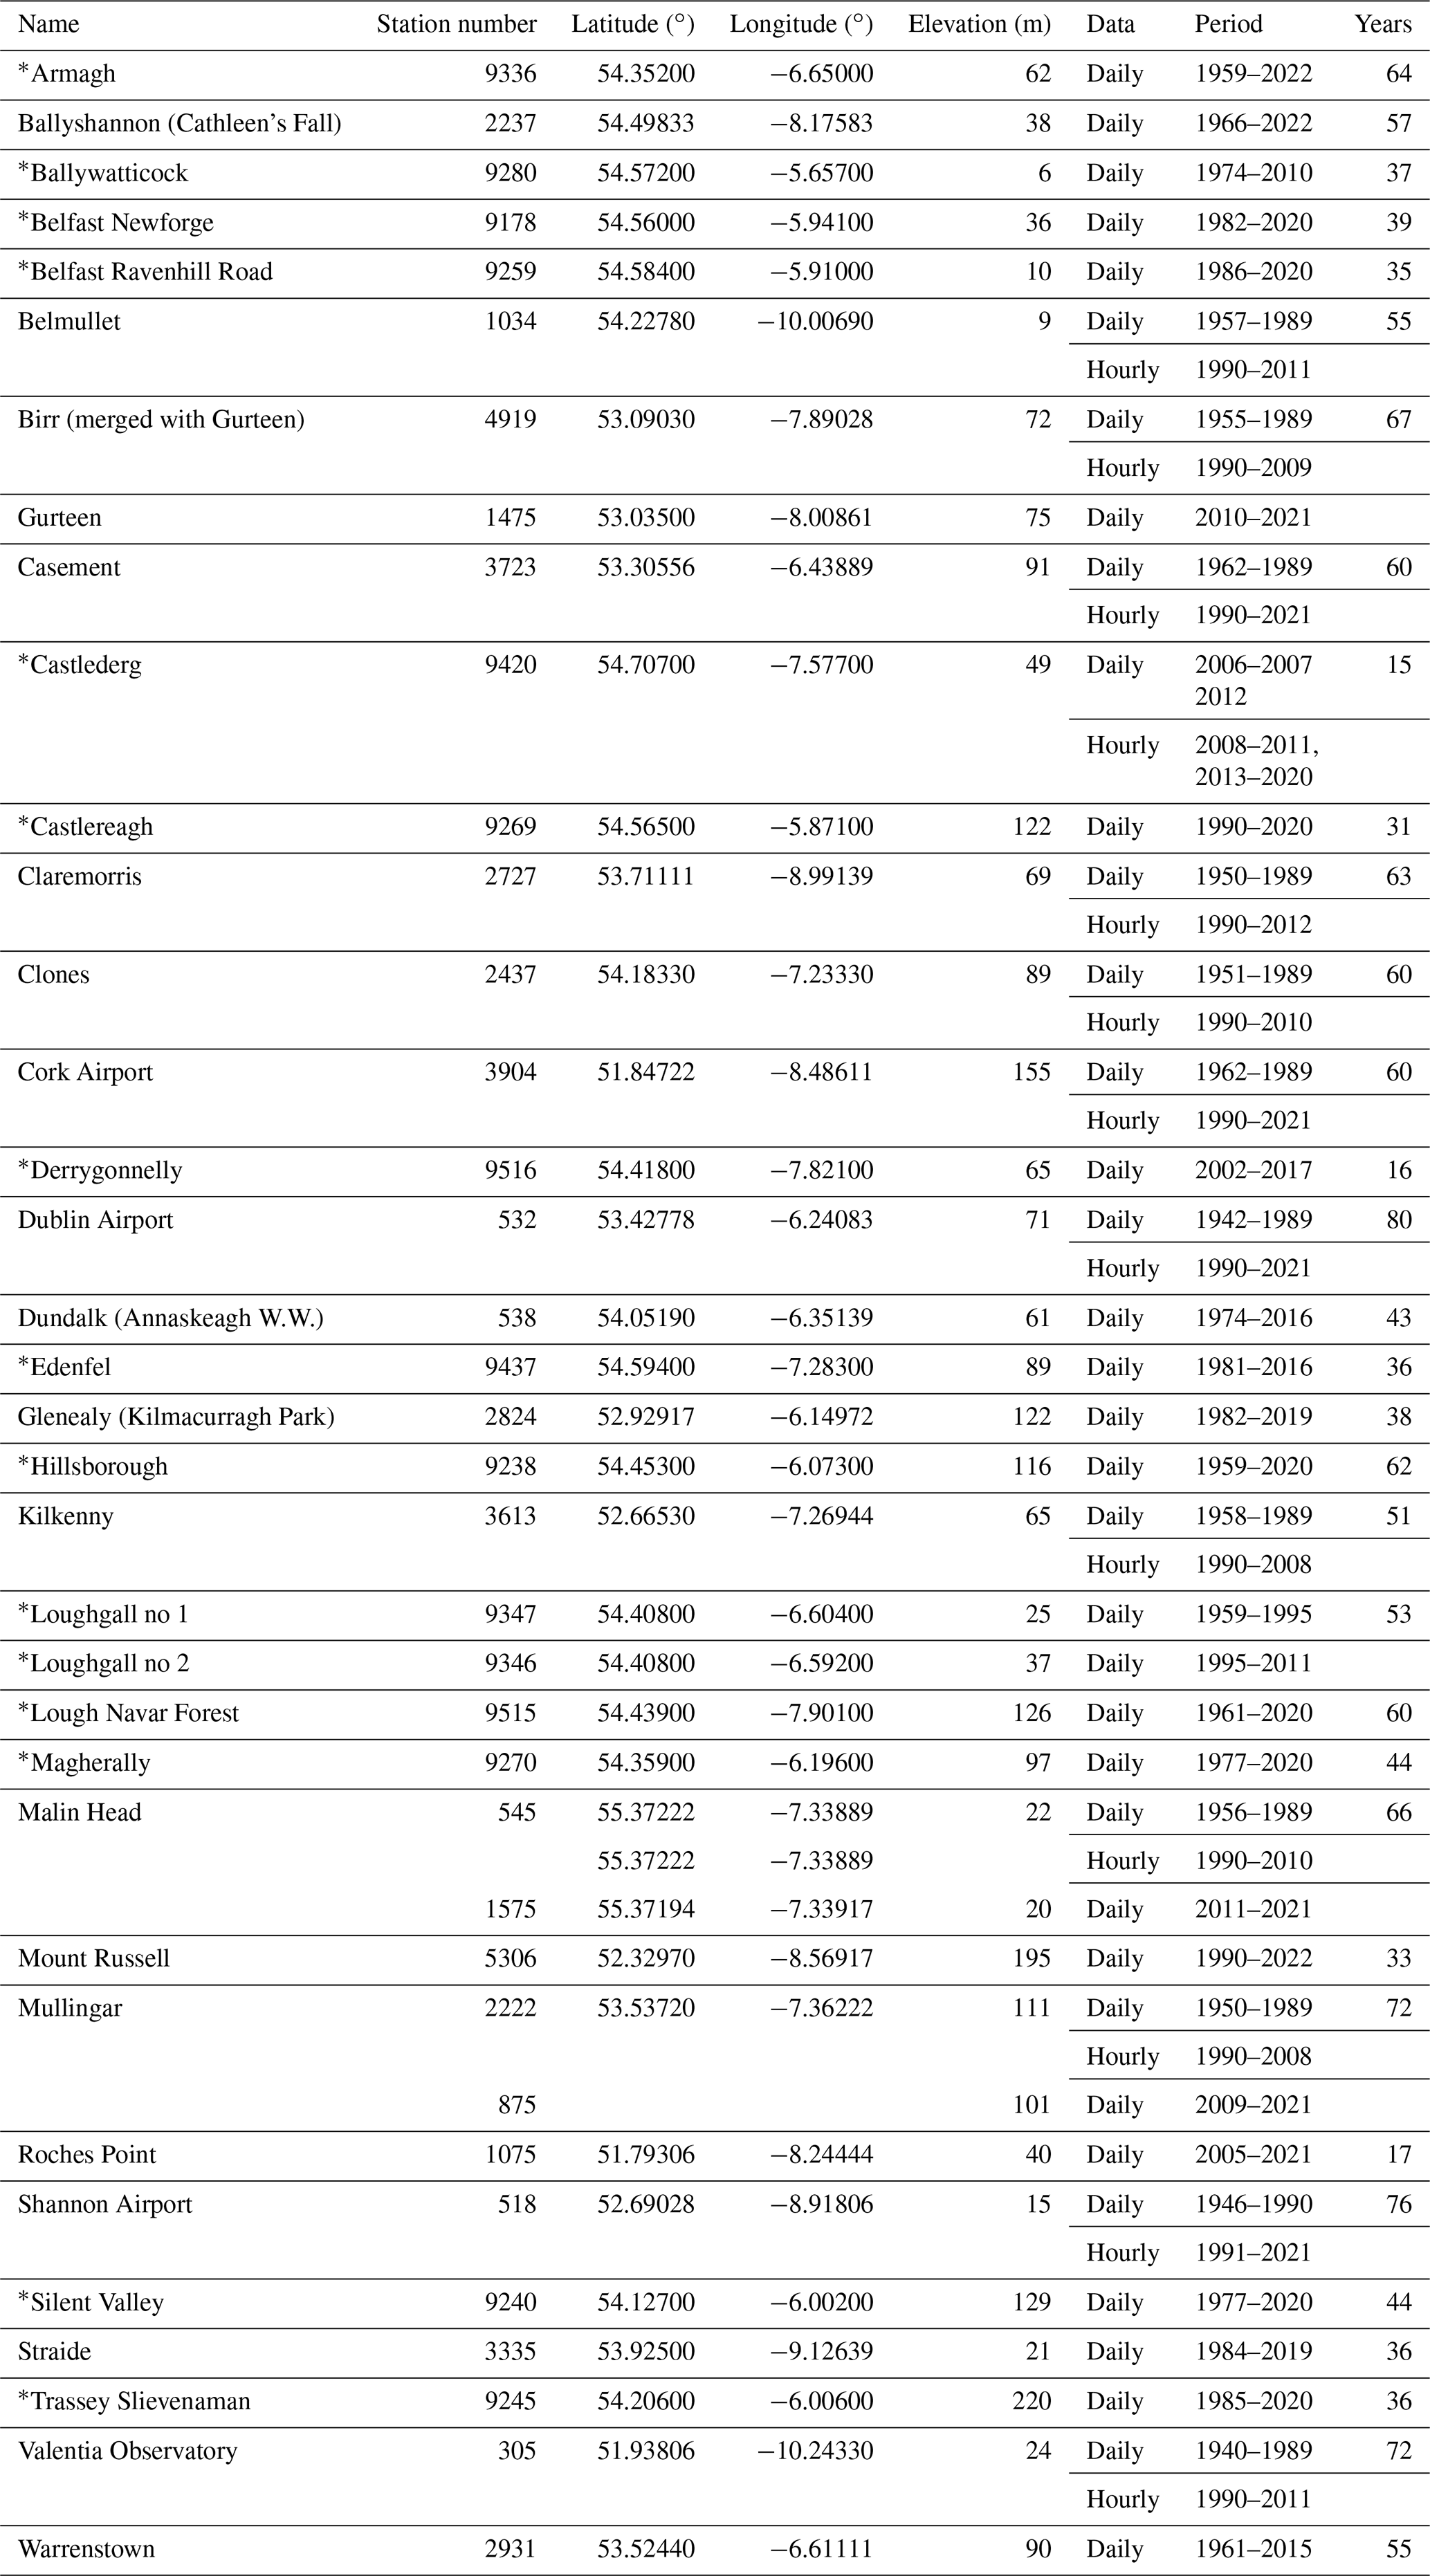
Table 3Meteorological stations and respective elevation, geographical coordinates, data resolution and period covered by the snow depth observations. Stations located in Northern Ireland are marked with an asterisk (*). In case of replacement from manual to automatic station or re-location of the station, the geographical coordinates correspond to the most recent location.
The daily snow depth data for locations in Ireland correspond to observations in centimetres taken at synoptic and climate stations. In the case of the synoptic stations, the snow depths were recorded at the main hours of 06:00 and 09:00 UTC and also reported on hourly synoptic observations if snow depths were present, whereas the snow depths were only taken at 09:00 UTC in the climate stations. For Northern Ireland stations, the snow depth observations in centimetres were registered once-daily at 09:00 UTC. The hourly snow depths at stations from Ireland and Northern Ireland were registered in centimetres observed in the 24 h from 00:00 to 23:00 UTC hours.
The meteorological instruments, methods of observation, and quality-control procedures of the snow depth observations follow the international standards published by the World Meteorological Organization (2018, 2021).
2.3.2 Calculation of return values
The daily snow depth observations were examined to ascertain the highest snow depth per year with a zero-value returned when there was no snow recorded at the station in that year. Furthermore, when both daily and hourly observations were obtainable for the same period, the hourly observations were examined to determine the highest snow depth per year. A Generalised Pareto distribution was fitted to the series of the greatest snow depths per year to calculate the return levels for 50, 100 and 120-year return periods for each station by implementing the R package extRemes 2.0 (Gilleland and Katz, 2016). The Generalised Pareto distribution, also known as the Peaks-Over-Threshold method, has been employed to calculate the return period of snow loads (e.g. O'Donnell et al., 2020).
A Generalised Pareto distribution is used as it can accommodate extreme value datasets where there are zero values (years without snowfall events). Precisely, major snowfall events across Ireland are rare, with numerous annual maximum snow depth observations from lower-lying and southerly located stations, in specific, exhibiting a high proportion of no snow years. As an example, over the 72-year (1940–2011) snow record of Valentia Observatory, only 20 years had snow depth observations, with most of the values being light snow depths.
The Generalised Pareto distribution characterises an instrumental observation as extreme if it exceeds a specific threshold (Coles, 2001). Accordingly, the threshold selection entails an equilibrium between bias and variance: a threshold too low is likely to violate the asymptotic basis of the model, emanating in bias, whereas a threshold too high will generate few excesses with which the model can be estimated, resulting in high variance (Coles, 2001). Consequently, the typical practice is to select a low threshold as feasible and subject to the limit model proving a reasonable approximation (Coles, 2001). Therefore, mean residual life plots were interpreted, and the Generalised Pareto distribution was fitted to a range of thresholds to evaluate the stability of parameter estimates (Coles, 2001). This process was cross-referenced with the three greatest snow depth observations registered on the instrumental record for each station. In this respect, the Generalised Pareto distribution sets a threshold below which data are ignored, removing years when no snow or very little snow is recorded and fitting to the remaining dataset. This threshold can be set to optimise the fit between the instrumental data and the model and thus improve the confidence in the estimated return values.
2.3.3 Adjustment for the once-daily versus hourly observations
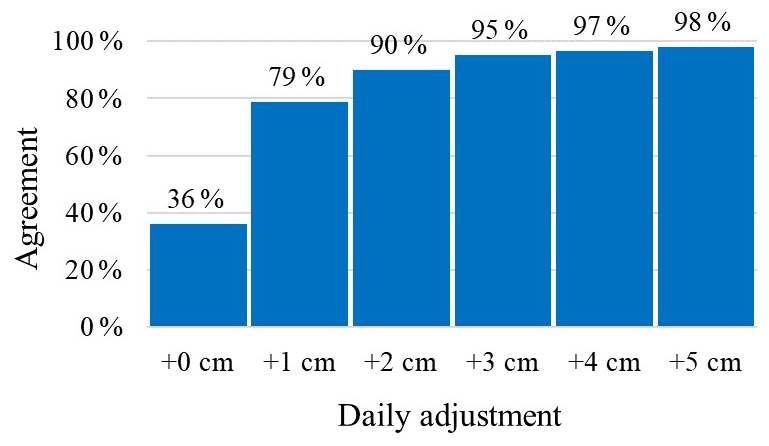
A once-daily snow depth observation will likely occasionally omit the highest snow depth due to melting compared to hourly observations taken over the equivalent 24 h period. This discrepancy was quantified after analysing the available overlapping once-daily and hourly snow depths observations for the 13 stations where both observations were available. In just 36 % of cases where the snow depth was greater than zero (Fig. 4), the daily and hourly highest snow depth observations were the same. However, if an adjustment of +3 cm was made to the daily values, then in 95 % of cases, the daily value matched or exceeded the hourly value. Therefore, a +3 cm adjustment was made to the daily snow depths to adjust for the discrepancy between daily and hourly values, where no hourly data was available. Effectively, this adjustment minimises the chance that daily snow observations underestimate the highest snowfall depth in each 24 h period.
2.3.4 Adjustment of return values of snow depths to 100 m elevation above mean sea level
Snow depths generally increase with altitude. Rather than including topography in the snow load maps, an adjustment was applied to the return levels of snow depths to generate equivalent values at a standardised elevation of 100 m above mean sea level, making the generated maps easier to read. The adjustment of return values of snow depths to 100 m elevation above mean sea level is required by the National Annex plus Amendment NA+A2:2020 to I.S. EN 1991-1-3:2003&A1:2015 (National Standards Authority of Ireland, 2015b).
This adjustment was established on the distribution of station altitudes and the return values of snow depths for each return period by employing a linear regression fit of the snow depth versus elevation. The correction applied to the return values of snow depths was 9.4 cm per 100 m for the 50-year return period, 11 cm per 100 m for the 100-year return period and 11.4 cm per 100 m for the 120-year return period. For instance, the return value of a snow depth for a 100-year return period for a station at 50 m elevation will be adjusted up by 5.5 cm, whereas a station at an elevation of 200 m will have its return value for a 100-year return period reduced by 11 cm. For context, British Standards Institution (2007) suggests a variation of 0.2 kN m−2 in snow load for every 100 m of height for use in the UK and Ireland, which is equivalent to a 10 cm snow depth adjustment.
Clearly, elevation does not fully describe the return period snow depths as snowfall events can be localised, depending on the direction of the incoming snow front and location north to south and east to west in the country. The RMSE error in snow depth of the 100 m adjustment was found to be 7.9, 9.4 and 9.9 cm at return periods of 50, 100 and 120 years, respectively (Fig. 5).
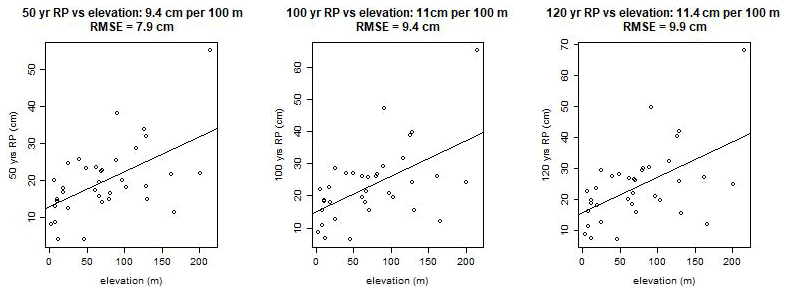
Figure 5The root mean square error (RMSE) of the 100 m elevation adjustment of the snow depth values for the 50, 100 and 120-year return periods.
2.3.5 Adjustment for snow loadings at 100 m above mean sea level
The density of snow must be known to convert the return values of snow depths for 50, 100 and 120-year return periods to a snow loading. The 2.0 kN m−3 value is applicable for snow which is settled after several hours or days after its fall (Keegan, 2010). Therefore, 1 cm of snow depth corresponds to 0.02 kN m−2 of snow loading. The adjustment of snow loads to 100 m elevation above mean sea level is required by the Irish Standard I.S. EN 1991-1-3:2003&AC:2009&A1:2015 Eurocode 1 – Actions on structures – Part 1-3: General actions – Snow loads (National Standards Authority of Ireland, 2015a) and the National Annex plus Amendment NA+A2:2020 to I.S. EN 1991-1-3:2003&A1:2015. Irish National Annex (Informative) to Eurocode 1 – Actions on structures – Part 1-3: General actions – Snow loads (National Standards Authority of Ireland, 2015b).
2.4 Gridding
In order to produce a map based on a limited number of point sources of observation (weather stations), the return values for each 50, 100 and 120-year return period of the highest maximum air temperature, lowest minimum air temperature, lowest 10 cm soil temperature and snow depths needed to be interpolated across the entirety of the grid to be mapped, a technique which is described as gridding. A 1 km2 grid covering the island of Ireland, which is based on the Irish National Grid (TM75, https://epsg.io/29903-1956, last access: 21 September 2022), was employed in the mapping.
The interpolation of return values across all grid points is executed in two steps. First, a linear regression of the return values to be interpolated (e.g. the return values of the 50-year return period of the highest maximum air temperature) versus geographical variables of the weather stations is performed. These geographical variables include the stations' position (easting, northing), 25 km exposure to the sea (the proportion of land within a 25 km radius of a grid point which is the sea), distance from the sea, and elevation for soil temperature where it has not previously been accounted for (Walsh, 2017). The radius from the sea is employed to model coastal effects and the 25 km is the best fitting value to model the station's observations.
In the case of the highest maximum air temperature, lowest minimum air temperature and lowest 10 cm soil temperature, only easting, northing and the 25 km exposure to the sea were found to be useful predictive variables. The 25 km exposure to the sea had a Pearson R2 correlation > 0.3 for the highest maximum air temperature and the lowest minimum air temperature and of ≥ 0.25 for the lowest 10 cm soil temperature, which is greater than that found for other geographical variables. The linear regression for the highest maximum air temperature, lowest minimum air temperature and lowest 10 cm soil temperature is presented in Eq. (1):
where TRPp is the predicted return value for temperature, TRPmean is the mean of the return value for temperature across all stations, easting and northing are the coordinates of the grid point, 25kexp is the 25 km exposure to the sea at the grid point and are the values multiplying the geographical variables in order to get the best fit to the observation parameter – the return value of the highest maximum air temperature and the lowest minimum air temperature for the 50, 100 and 120-year return period. The regression is unlikely to be a perfect fit, and the residuals quantify the amount of the observation being predicted, which is not captured by the linear regression.
For the snow loading, only easting and northing were found to have useful predictive power, Pearson R2 correlation > 0.2, so they were the only geographical variables used to fit the snow loads data. The linear regression is represented in Eq. (2):
where SLRPp is the predicted return value for snow loading, SLRPmean is the mean of the return value for snow loading across all stations, easting and northing are the coordinates of the grid point and a1,2 are the values multiplying the geographical variables in order to get the best fit for the observation parameter – the return value of the snow loading for the 50, 100 and 120-year return period.
The second step interpolated the linear regression residuals across grid points using a weighted average of the nearest stations to a particular grid point, a technique known as inverse distance weighting (IDW) (e.g. Hengl, 2007). The R package gstat was applied to interpolate the residual values across the grid points.
The final grid point interpolation/prediction for the highest maximum air temperature, lowest minimum air temperature and the lowest 10 cm soil temperature is based on Eq. (3):
For the snow loadings, the final grid point interpolation/prediction is presented in Eq. (4):
The easting and northing aim to capture spatial trends and the 25 km exposure to the sea has the purpose to model coastal effects (Walsh, 2017).
The outlined gridding methodology has been broadly implemented by Met Éireann, such as in producing official climate normals (e.g. Walsh, 2017).
3.1 Return values of maximum and minimum air temperatures at mean sea level for 50, 100 and 120-year return periods
The new isothermal maps of return values of the highest maximum air temperature at mean sea level for 50, 100 and 120-year return periods are presented in Figs. 6–8. The isotherms of the return values of the 50-year return period range from 28 ∘C near coastal areas to 32 ∘C (Fig. 6). The geographical distribution of the return values of the 100-year return period exhibits values from 28 and 30 ∘C near coastal areas and the isothermal range from 32 to 34 ∘C includes various counties in the northern, midlands and southern areas. The highest isotherm value of 34 ∘C is shown in a small area in Co. Kilkenny (Fig. 7). The isotherms of the return values of the 120-year return period range from 28 to 30 ∘C near coastal areas and the range from 32 to 34 ∘C covers several counties. The highest isotherm value of 34 ∘C includes parts of the midlands (Fig. 8).
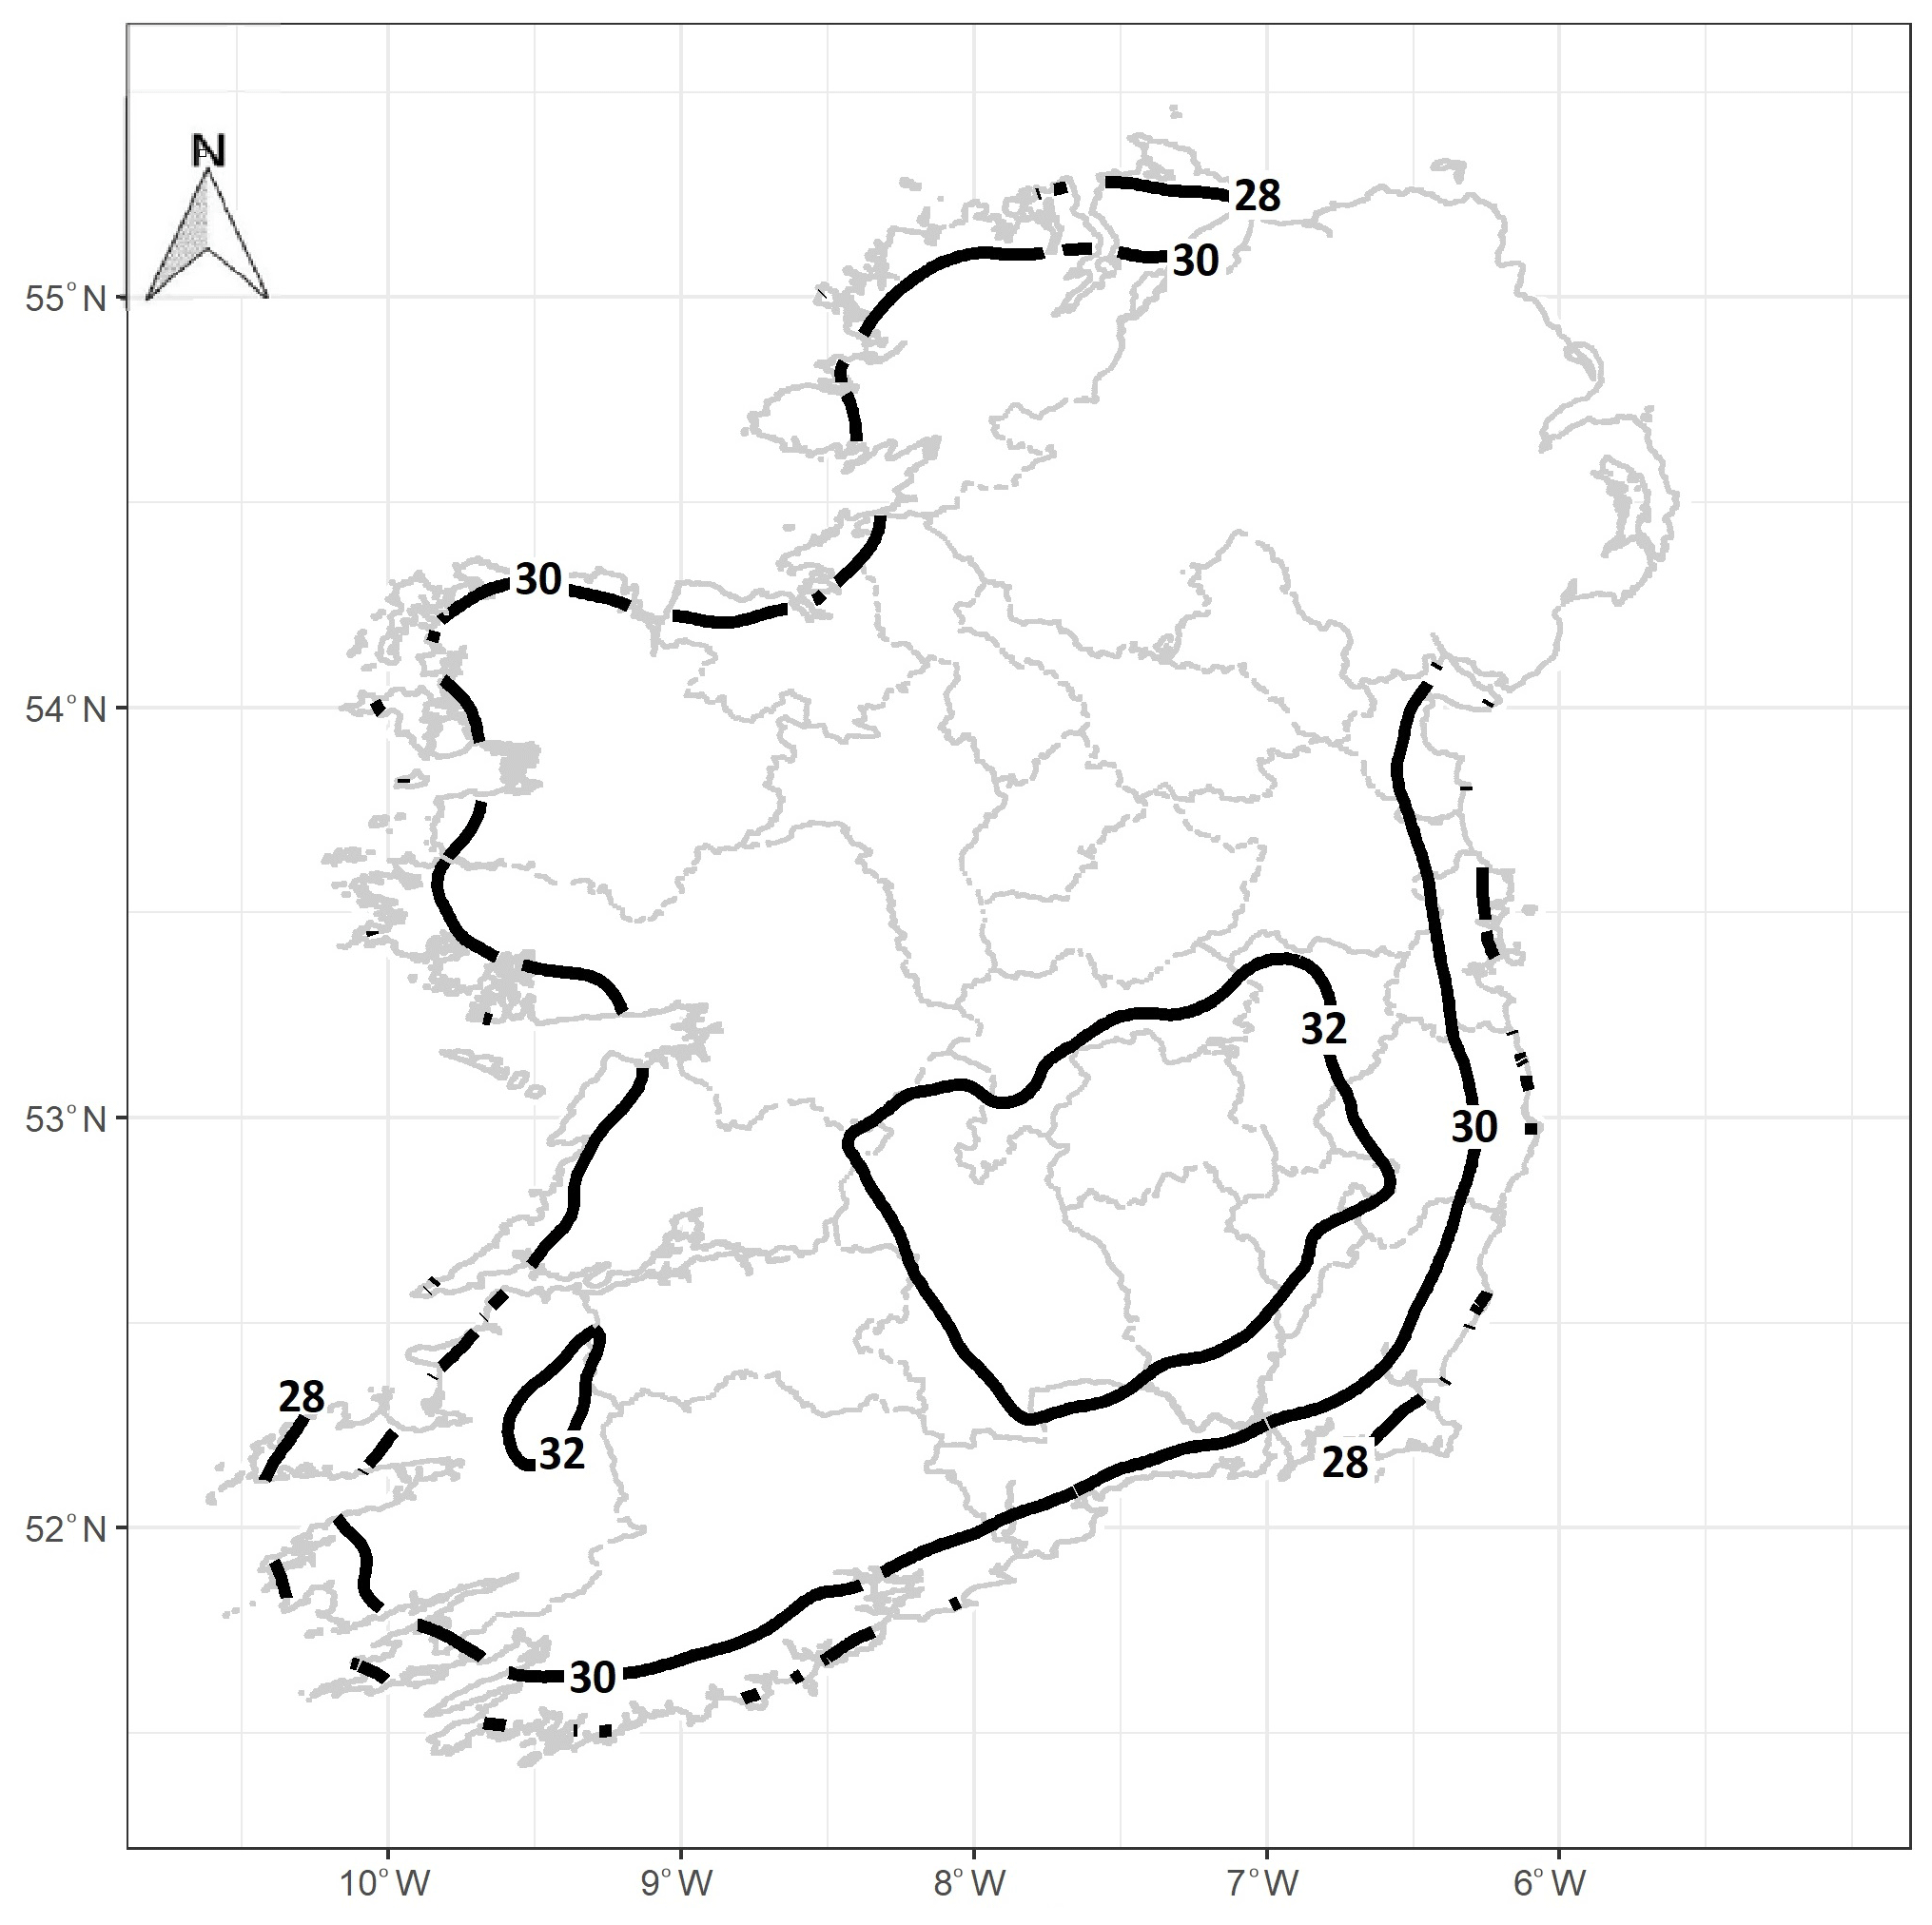
Figure 6Isotherms of highest maximum air temperature (∘C) at mean sea level in Ireland for a 50-year return period.
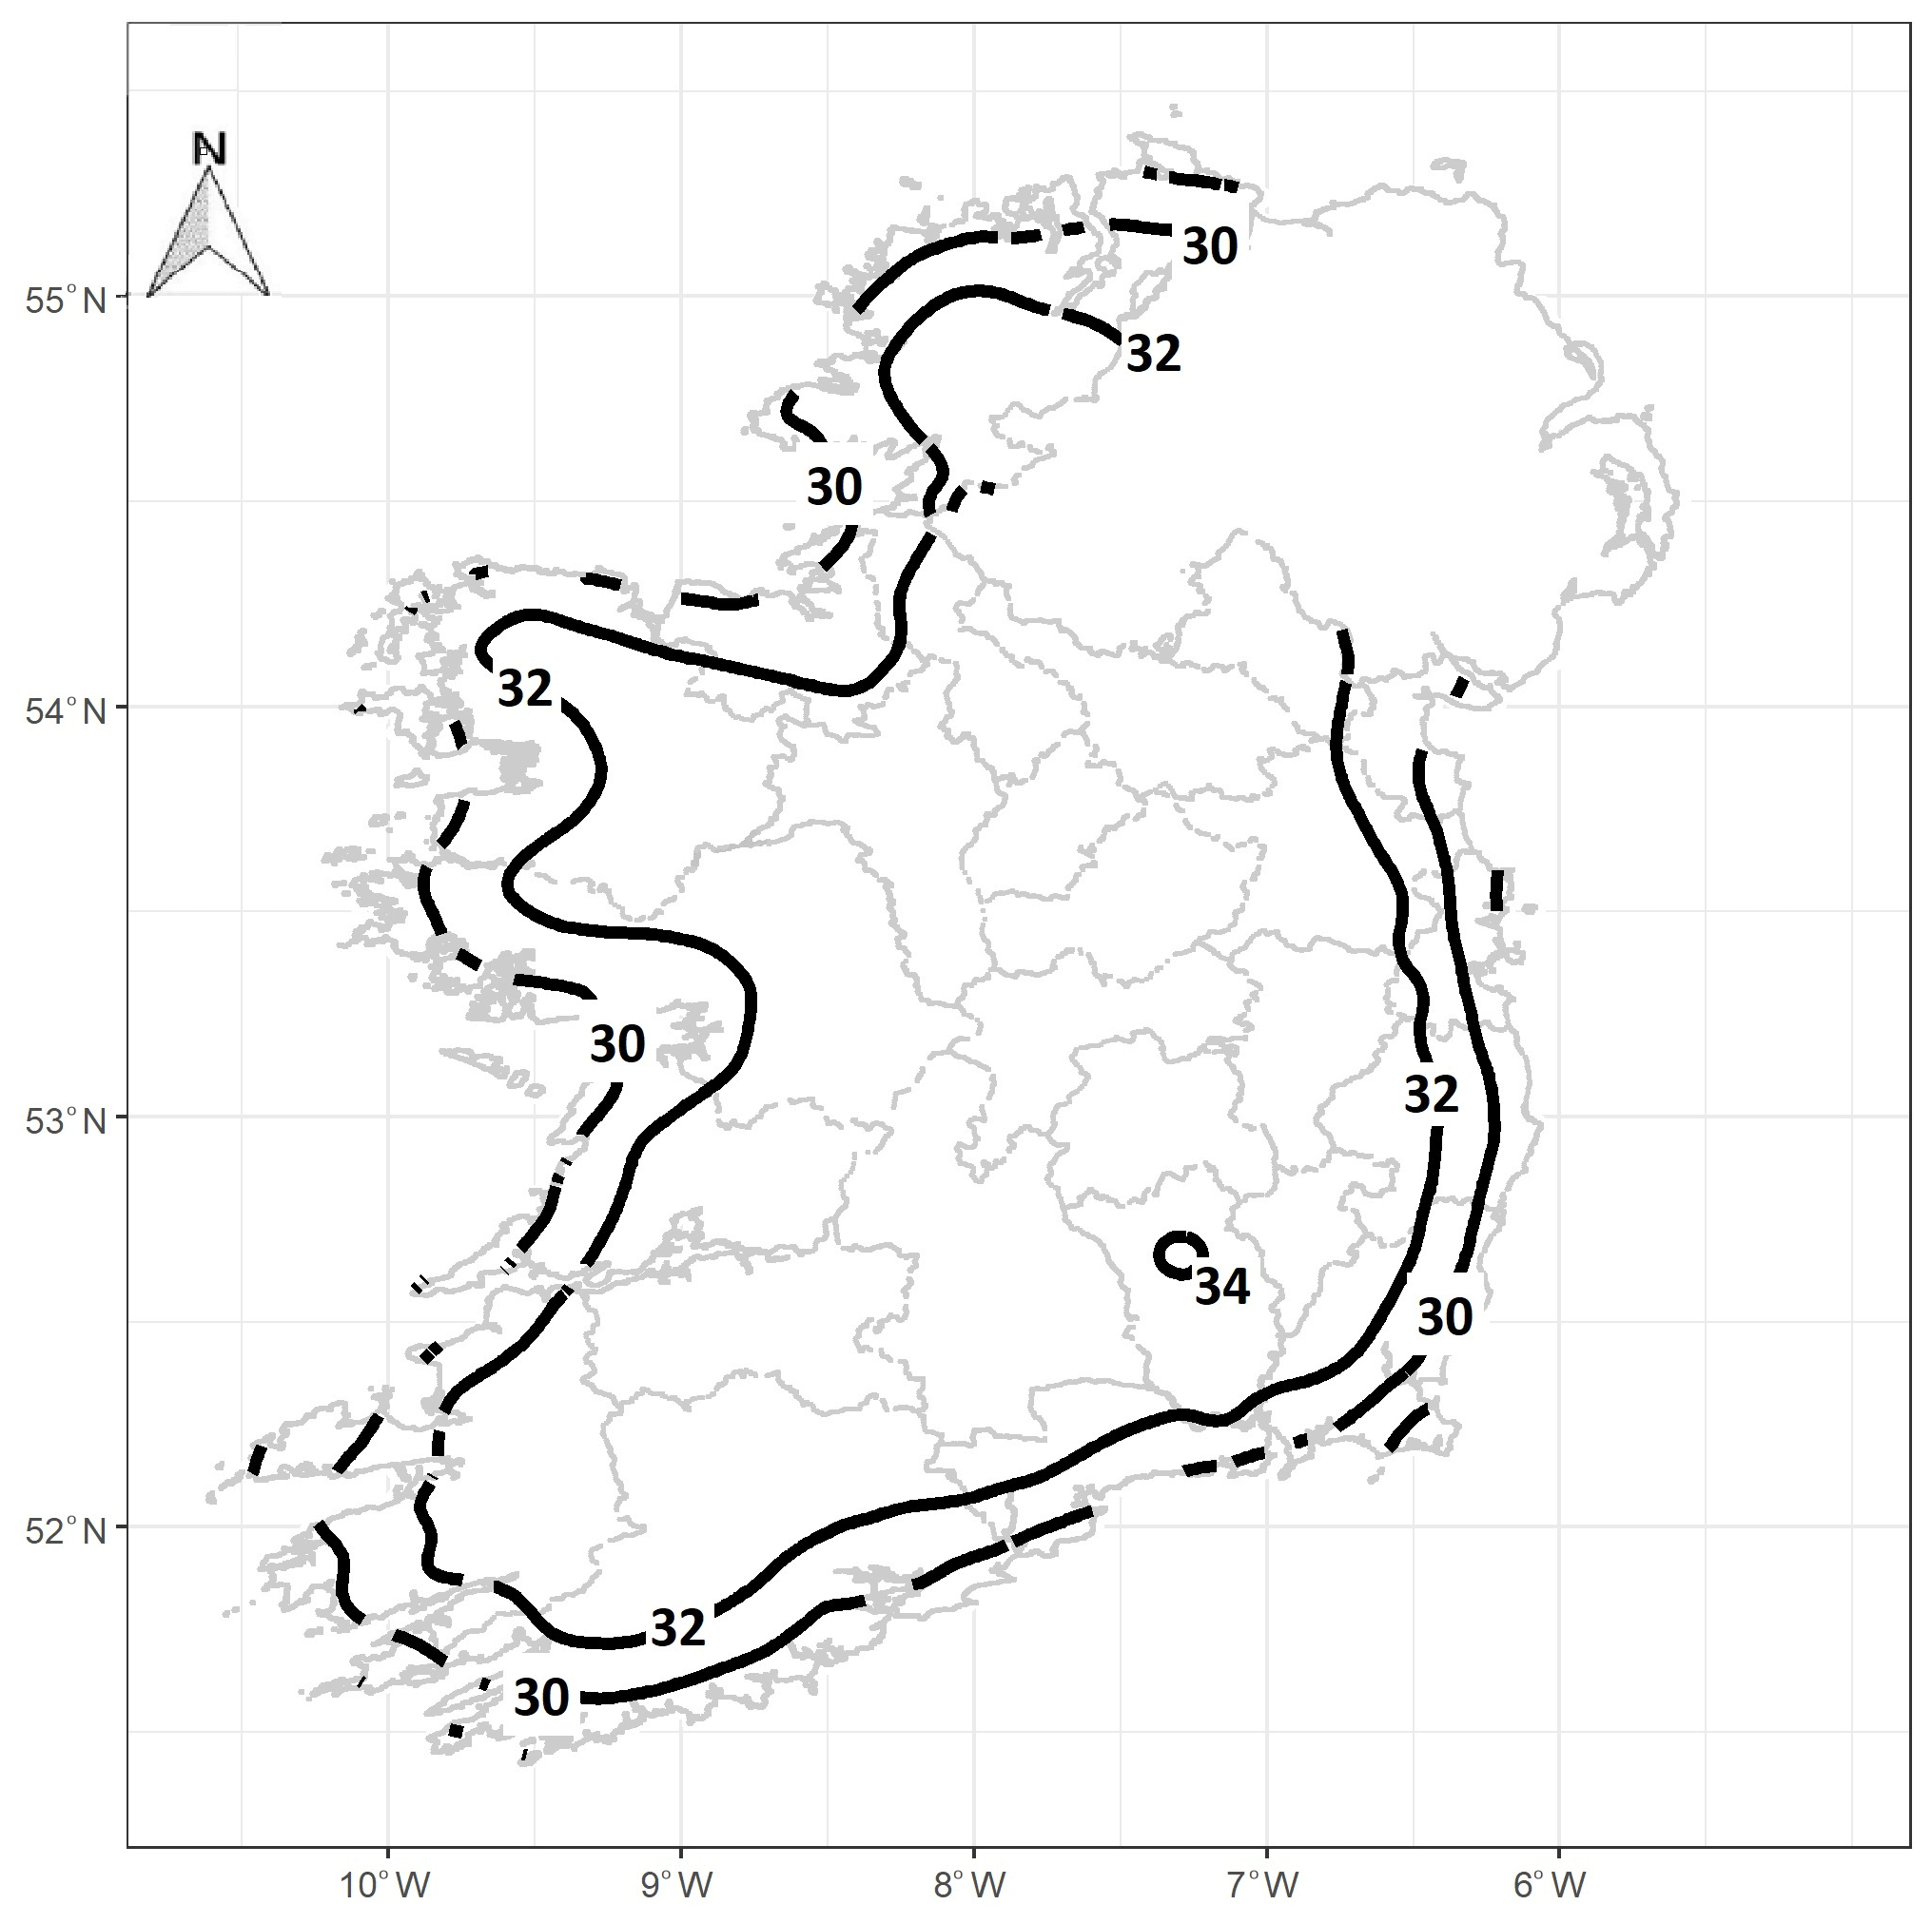
Figure 7Isotherms of highest maximum air temperature (∘C) at mean sea level in Ireland for a 100-year return period.

Figure 8Isotherms of highest maximum air temperature (∘C) at mean sea level in Ireland for a 120-year return period.
The new isothermal maps of return values of the lowest minimum air temperature at mean sea level for 50, 100 and 120-year return periods are shown in Figs. 9–11. The geographical distribution of the isotherms of the return values of the 50-year return period ranges from −6 ∘C in the extreme of the southern coastal areas to −14 ∘C. The isotherms of −10 and −12 ∘C are spread among a range of northern, western, southern, midlands and eastern counties (Fig. 9). The isotherms of the return values of the 100-year return period range from the highest value of −6 ∘C displayed in the extreme southwest and southeast coastal areas to the extreme lowest isotherm of −16 ∘C is distributed across various counties (Fig. 10). The distribution of the isotherms of the return values of the 120-year return period ranges range from −6 ∘C in the extreme coastal areas of the southern counties to −18 ∘C, which covers parts of the midlands (Fig. 11).
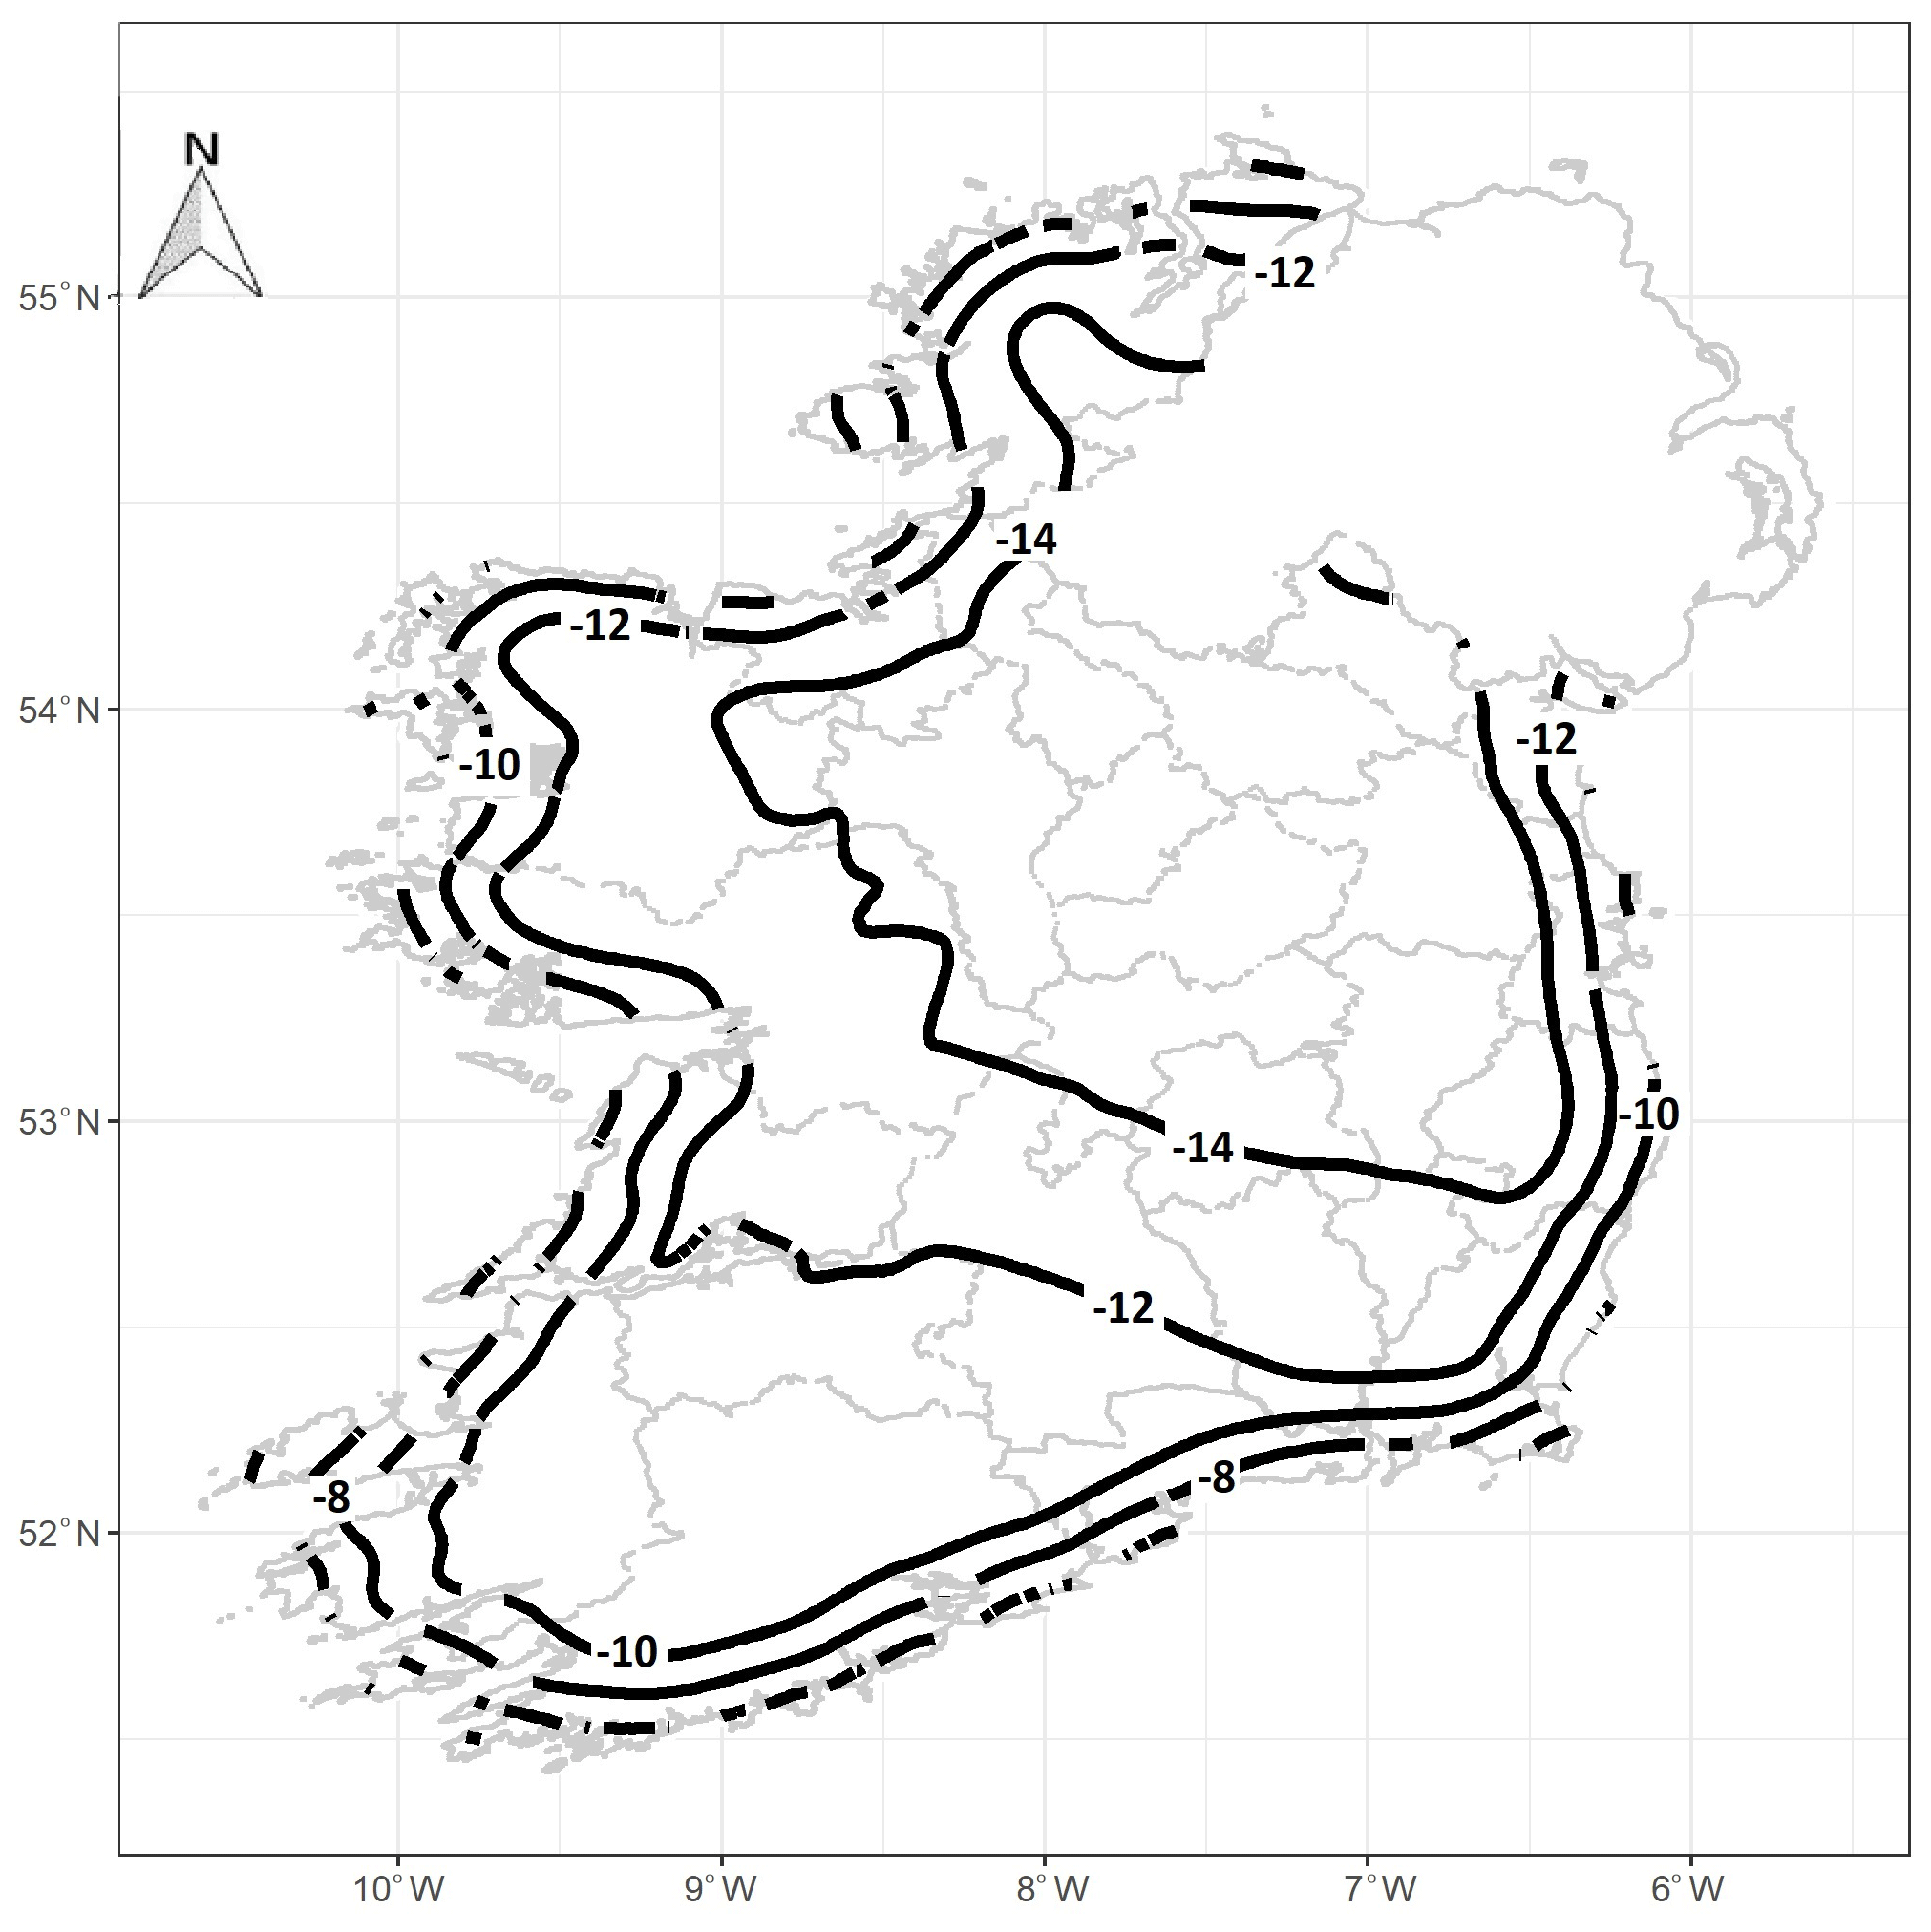
Figure 9Isotherms of lowest minimum air temperature (∘C) at mean sea level in Ireland for a 50-year return period.

Figure 10Isotherms of lowest minimum air temperature (∘C) at mean sea level in Ireland for a 100-year return period.

Figure 11Isotherms of lowest minimum air temperature (∘C) at mean sea level in Ireland for a 120-year return period.
The warming of the maximum and minimum air temperatures due to climate change has increased the intensity of the highest maximum air temperature while decreasing the intensity of the lowest extreme minimum air temperature of the new isothermal maps compared to previously published maps (British Standards Institution, 1978, 2007; National Standards Authority of Ireland, 2008). Specifically, the new extreme isotherms are 32 ∘C for the maximum air temperature and −14 ∘C for the minimum air temperature, whereas the processor maps presented 30 ∘C and −16 ∘C, respectively (National Standards Authority of Ireland, 2008). These results agree with the IPCC (2021) and the climate projections for Ireland (Nolan and Flanagan, 2020). The sixth assessment report of the Intergovernmental Panel on Climate Change projects an increase in intensity and frequency of hot temperature extremes, which are defined as daily maximum air temperatures over land that were exceeded on average as 10 or 50-year events during the 1850–1900 reference period (IPCC, 2021). In Ireland, the warmest 5 % of the daily maximum air temperatures are projected to increase for the period from 2041 to 2060, ranging from 1.0 to 1.6 ∘C in the RCP4.5 scenario and from 1.4 to 2.2 ∘C in the RCP8.5 scenario (Nolan and Flanagan, 2020).
The coldest 5 % of daily minimum air temperatures are projected to increase in the period from 2041 to 2060 in Ireland, ranging from 0.9 to 1.8 ∘C in the RCP4.5 scenario and from 1.2 to 2.4 ∘C in the RCP8.5 scenario (Nolan and Flanagan, 2020). Therefore, in the current context of climate warming, it is expected to see extreme high temperatures occurring more frequently and extreme low temperatures occurring less frequently. Hence, the isothermal maps of return values of the lowest minimum air temperature for 50, 100 and 120-year return periods produced here for Ireland represent the likely worst-case scenario, conservative and safe estimates of future Irish minimum temperatures. Yet higher maximum air temperatures may occur.
3.2 Return values of the lowest 10 cm soil temperature for 50, 100 and 120-year return periods
The isothermal maps of return values of the lowest 10 cm soil temperature for 50, 100 and 120-year return periods are provided in Figs. 12–14. The distribution of the return values of the 50-year return period exhibits values from 0 ∘C in areas in Cork, Kerry and Wexford to −2 ∘C in Mayo and Monaghan (Fig. 12). The isothermal map of the return values of the 100-year return period presents a range from 0 ∘C in the southwest and southeast to −2 ∘C, which comprises various counties (Fig. 13). The geographical distribution of the return values of the 120-year return period also displays values ranging from 0 to -2 ∘C, although the −2 ∘C isotherm covers a wider area (Fig. 14). In the current context of climate warming (Nolan and Flanagan, 2020; IPCC, 2021), the produced maps represent the worst-case scenario. There are no previous maps for Ireland available to compare results.
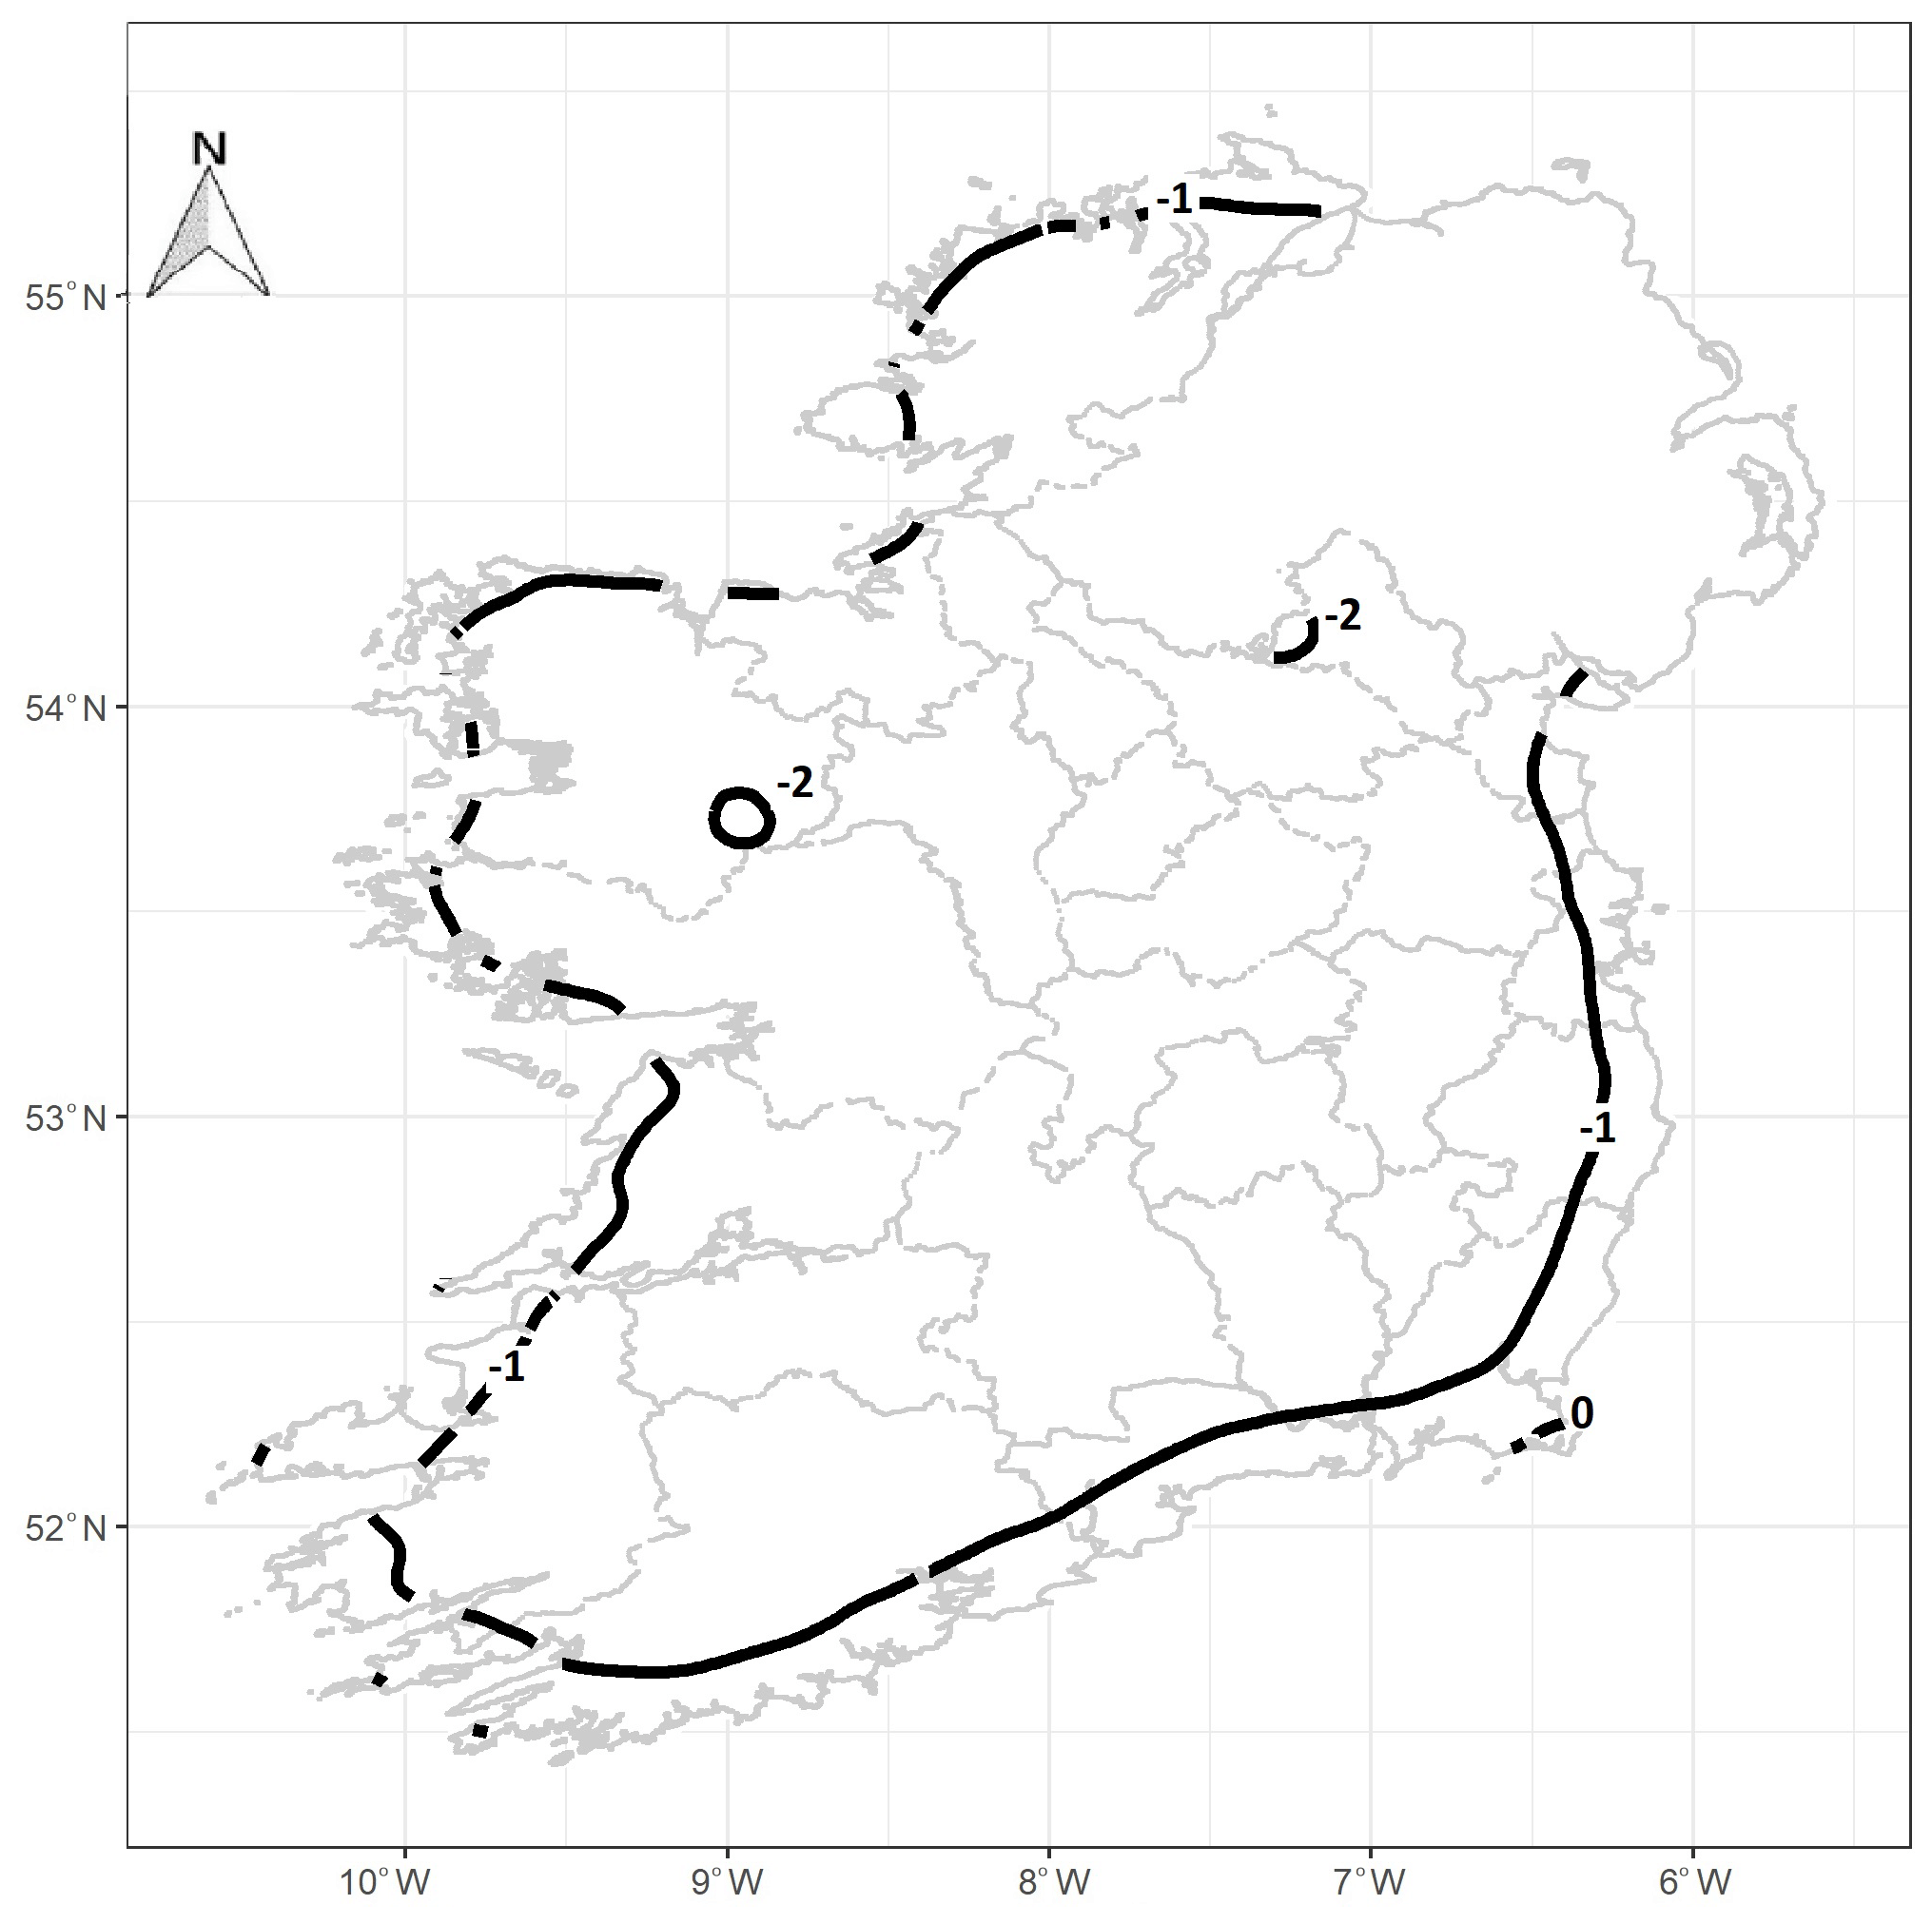
Figure 12Isotherms of the lowest 10 cm soil temperature (∘C) for a 50-year return period in Ireland.
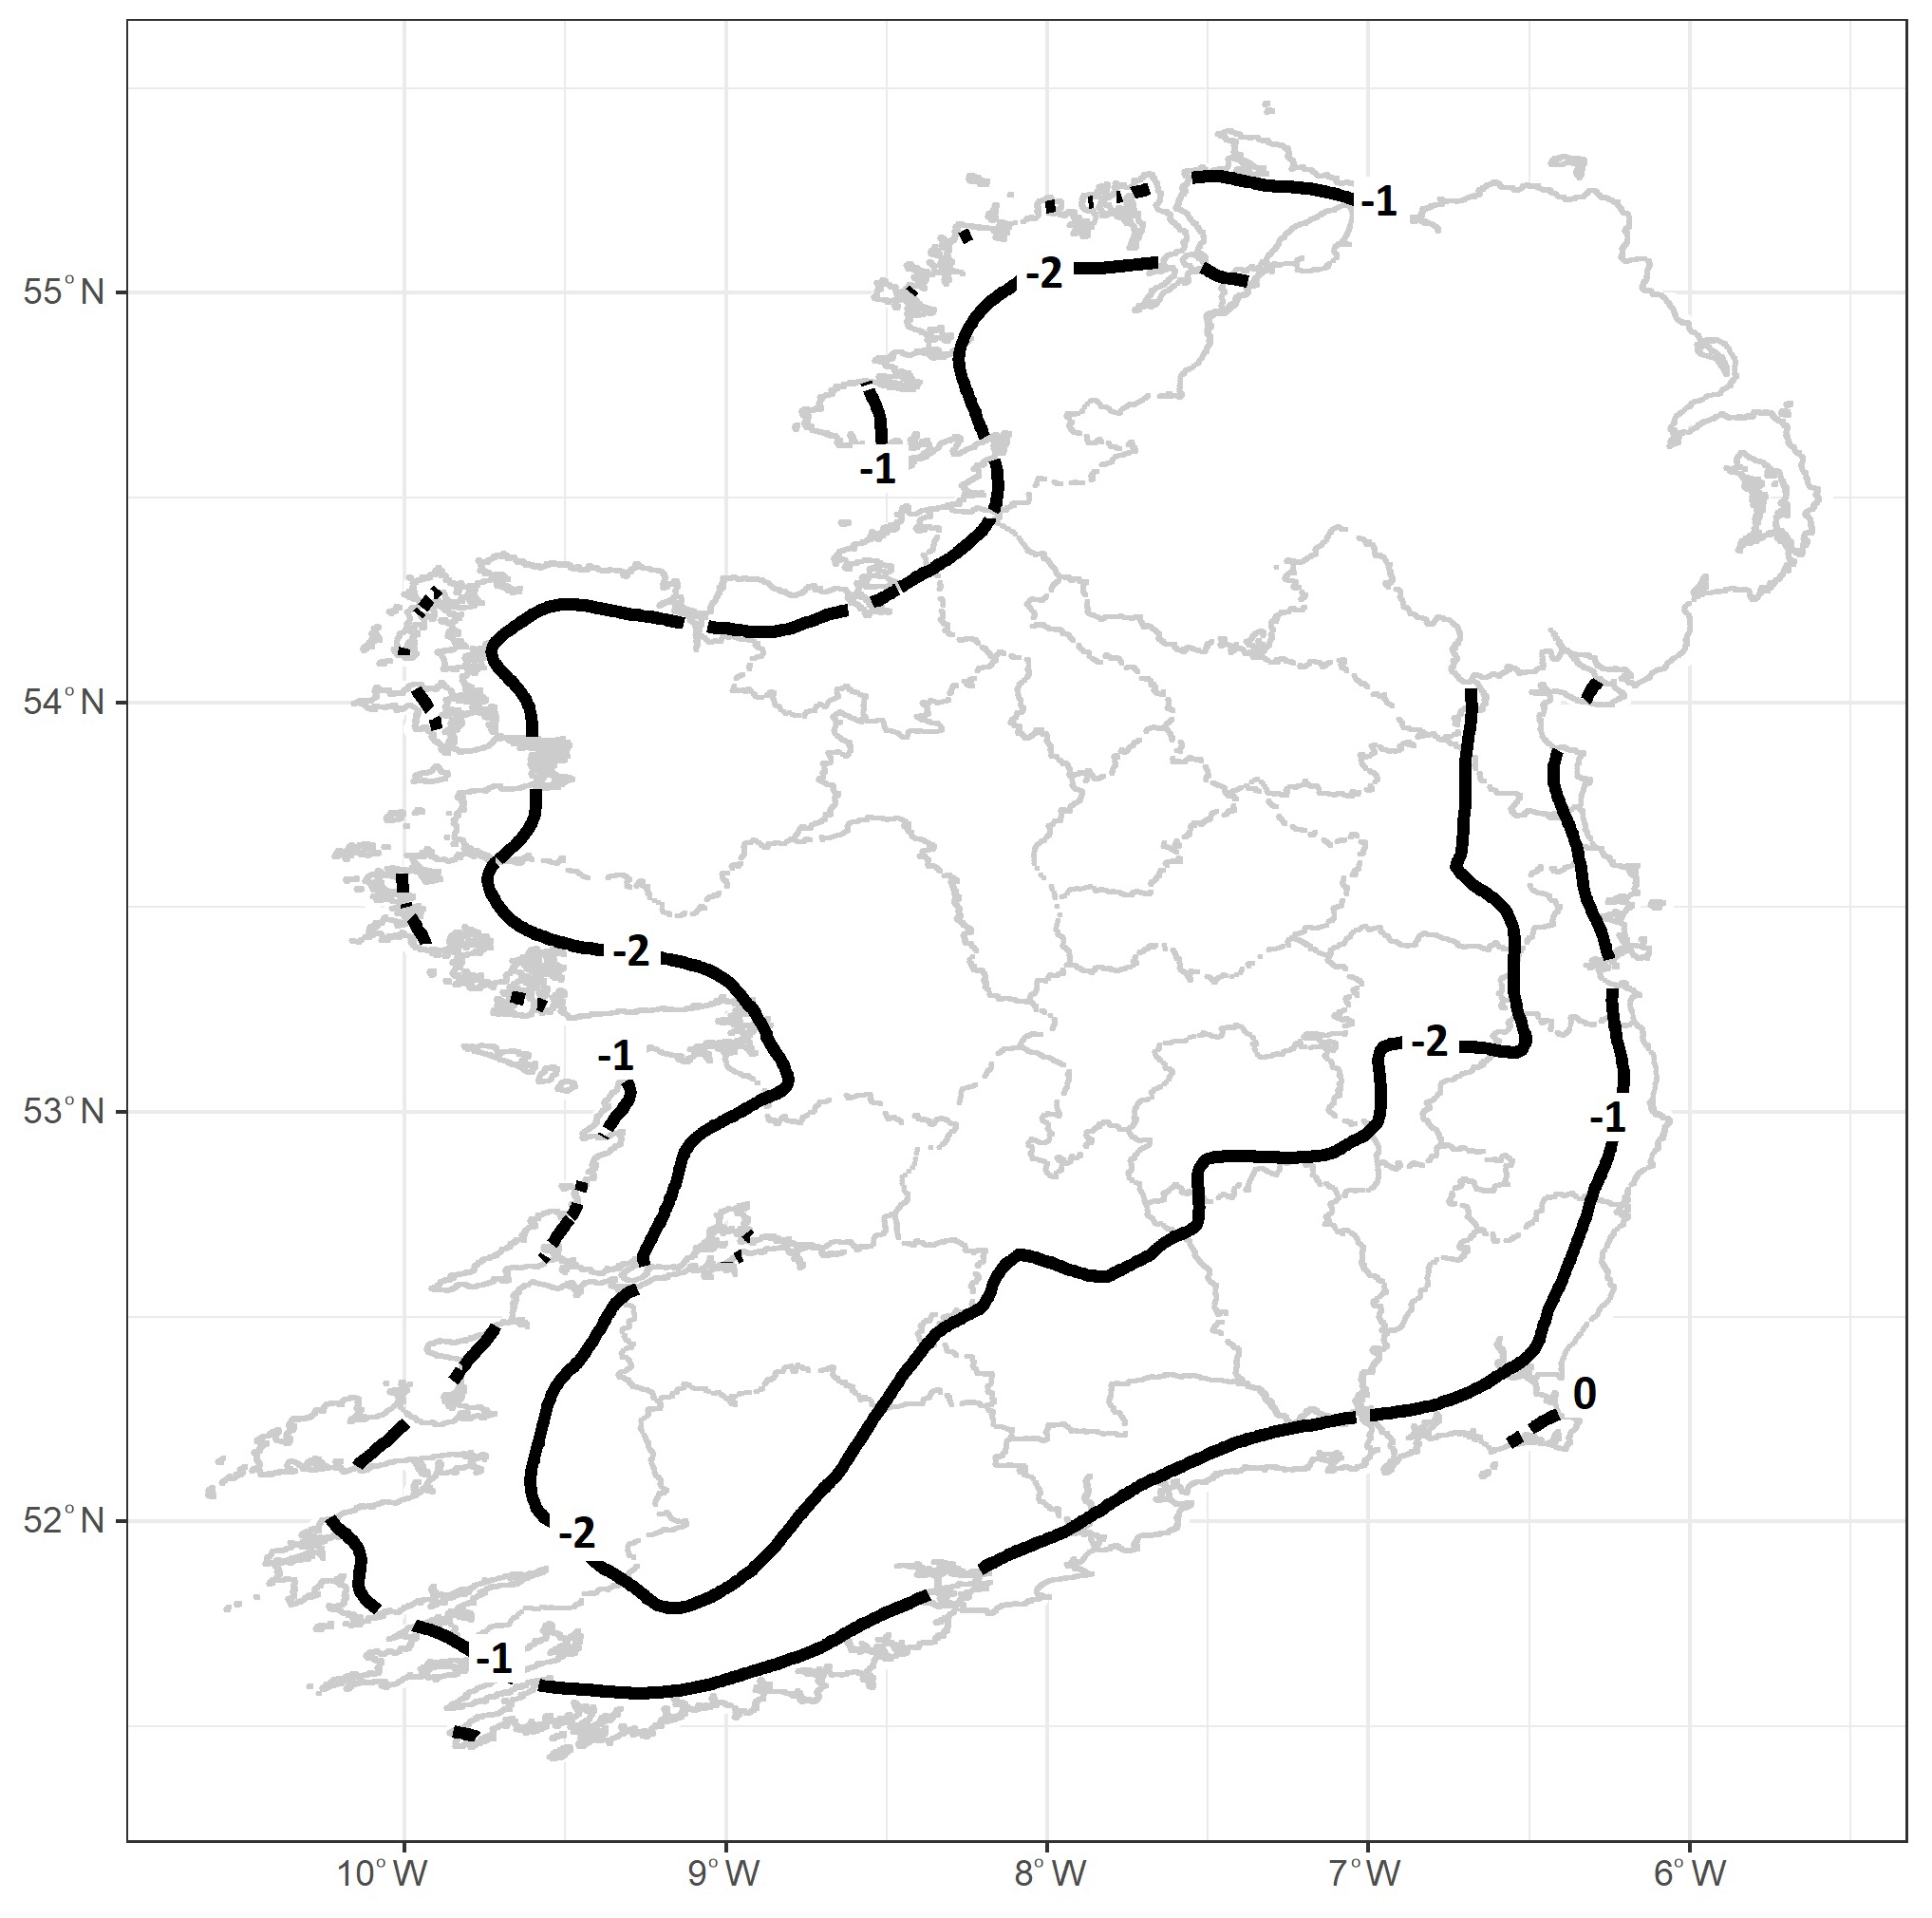
Figure 13Isotherms of the lowest 10 cm soil temperature (∘C) for a 100-year return period in Ireland.
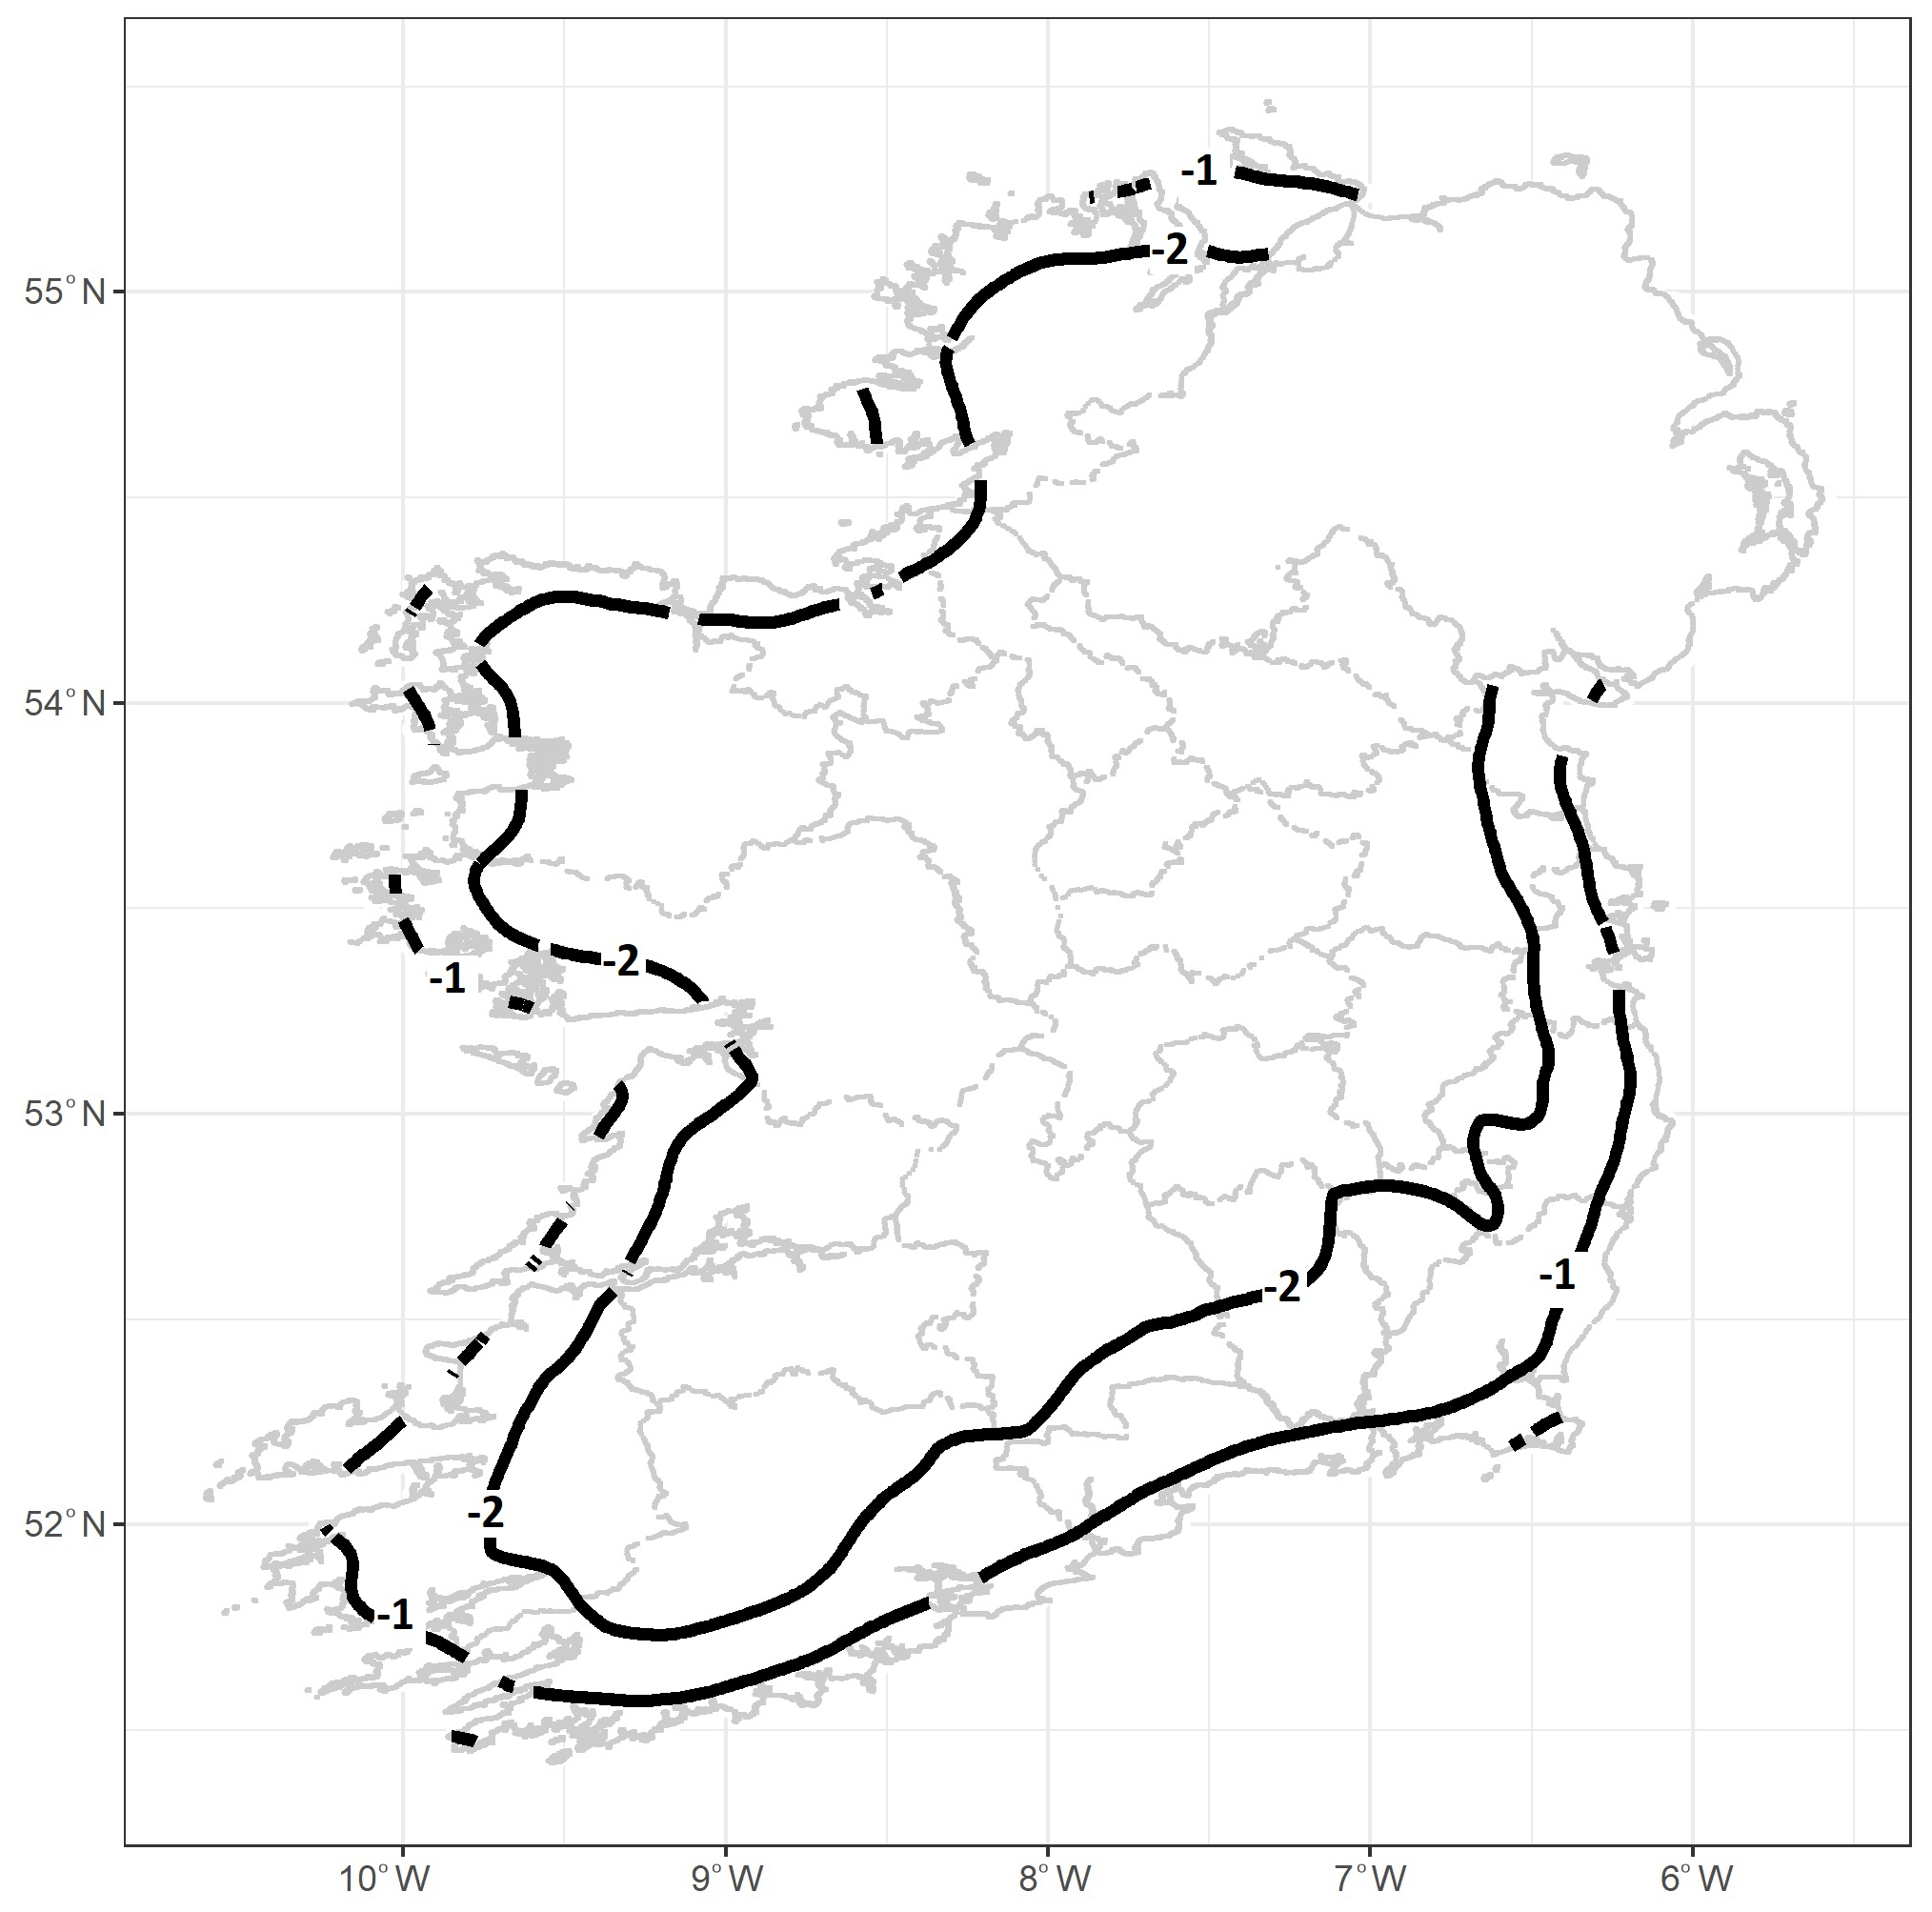
Figure 14Isotherms of the lowest 10 cm soil temperature (∘C) for a 120-year return period in Ireland.
3.3 Return values of snow loadings at 100 m above mean sea level for 50, 100 and 120-year return periods
The maps of return values of snow depth loadings at 100 m above mean sea level for 50, 100 and 120-year return periods are presented in Figs. 15–17. The geographical distribution of the return values of the 50-year return period presents four classes spread North-East to South-West: < 0.3, 0.3–0.4, 0.4–0.5 and 0.5–0.6 kN m−2 (Fig. 15). The lowest class, < 0.3 kN m−2, is displayed in a small area in the southwest. The highest class of 0.5–0.6 kN m−2 is distributed in parts of Cavan, Donegal, Dublin, Louth, Meath and Monaghan. The return values of the 100-year return period are spread across four classes ranging from the lowest at 0.3–0.4 kN m−2 to the highest at 0.6–0.7 kN m−2 (Fig. 16). The 0.3–0.4 kN m−2 class covers parts of the southwest. The highest class of 0.6–0.7 kN m−2 is distributed in parts of Donegal in the northwest and in the east in Louth and parts of Cavan, Meath and Monaghan in the midlands and Dublin. The geographical distribution of the return values of the 120-year return period has five classes ranging from the lowest at 0.3–0.4 kN m−2 to the highest at 0.7–0.8 kN m−2 (Fig. 17). The 0.3–0.4 kN m−2 class covers parts in the southwest, whereas the highest class of 0.7–0.8 kN m−2 only spans parts of Donegal in the northwest and Louth in the east.
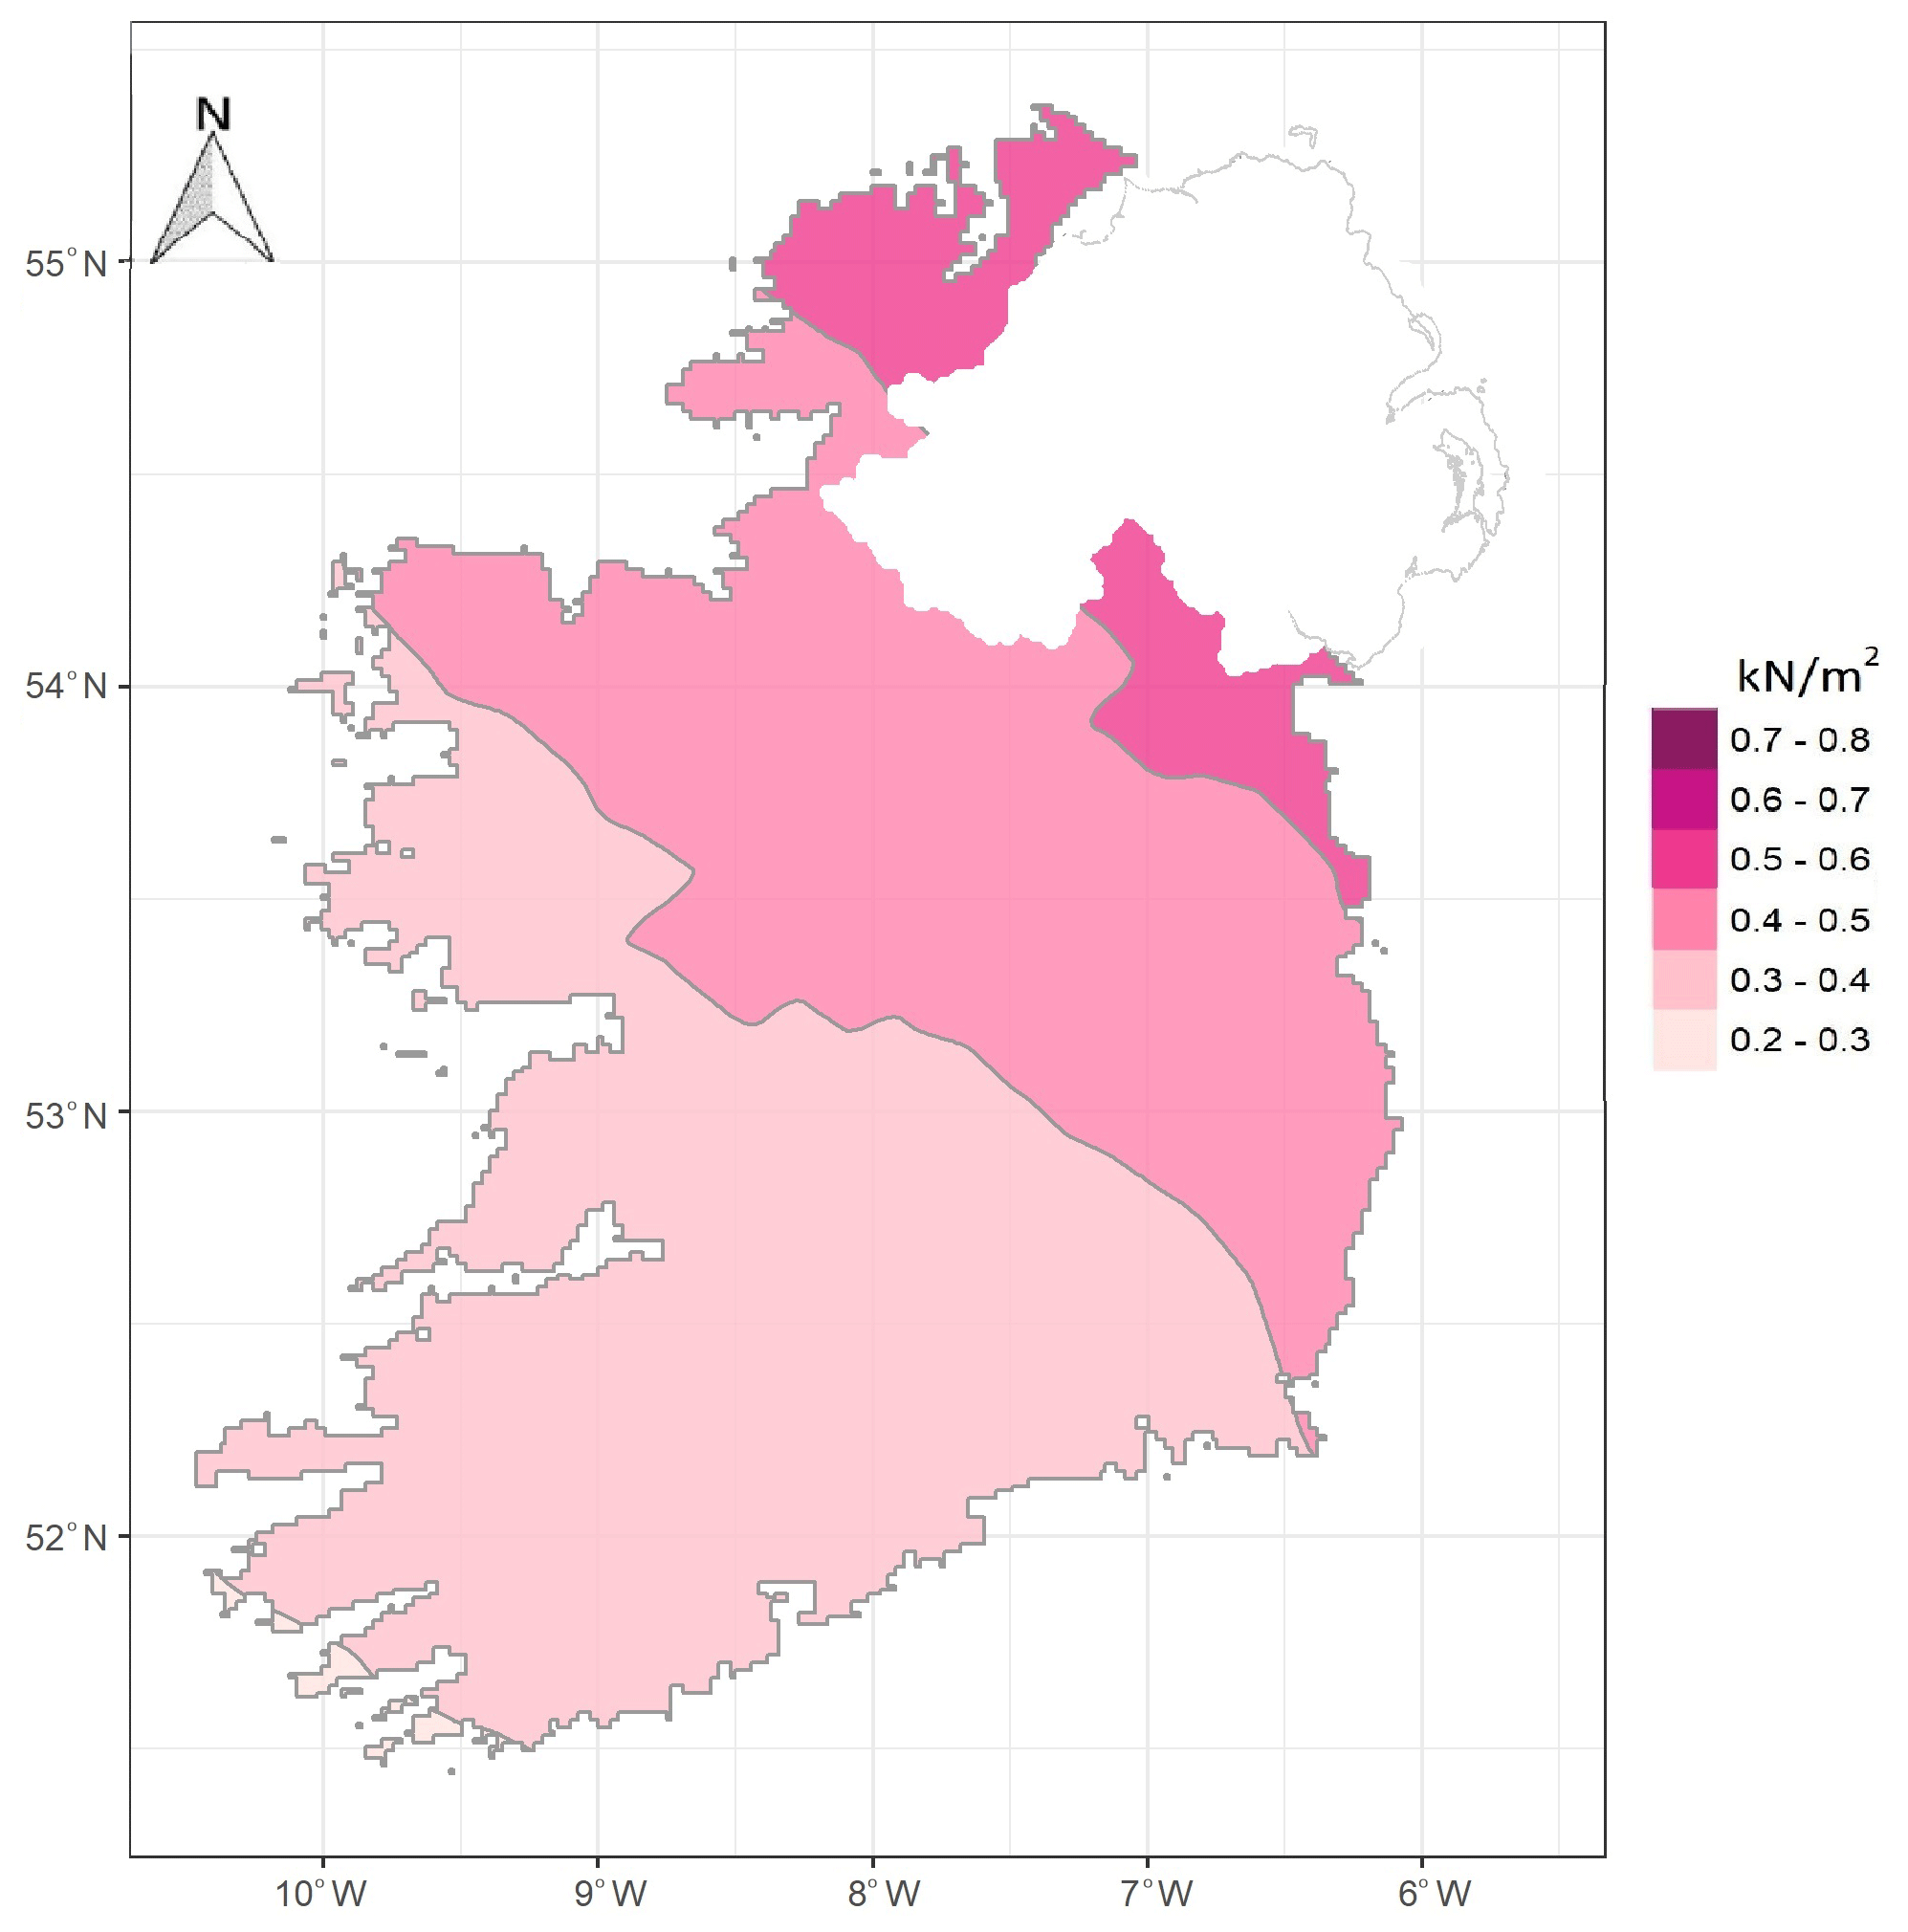
Figure 15Return values of snow loadings at 100 m above mean sea level in Ireland for a 50-year return period.
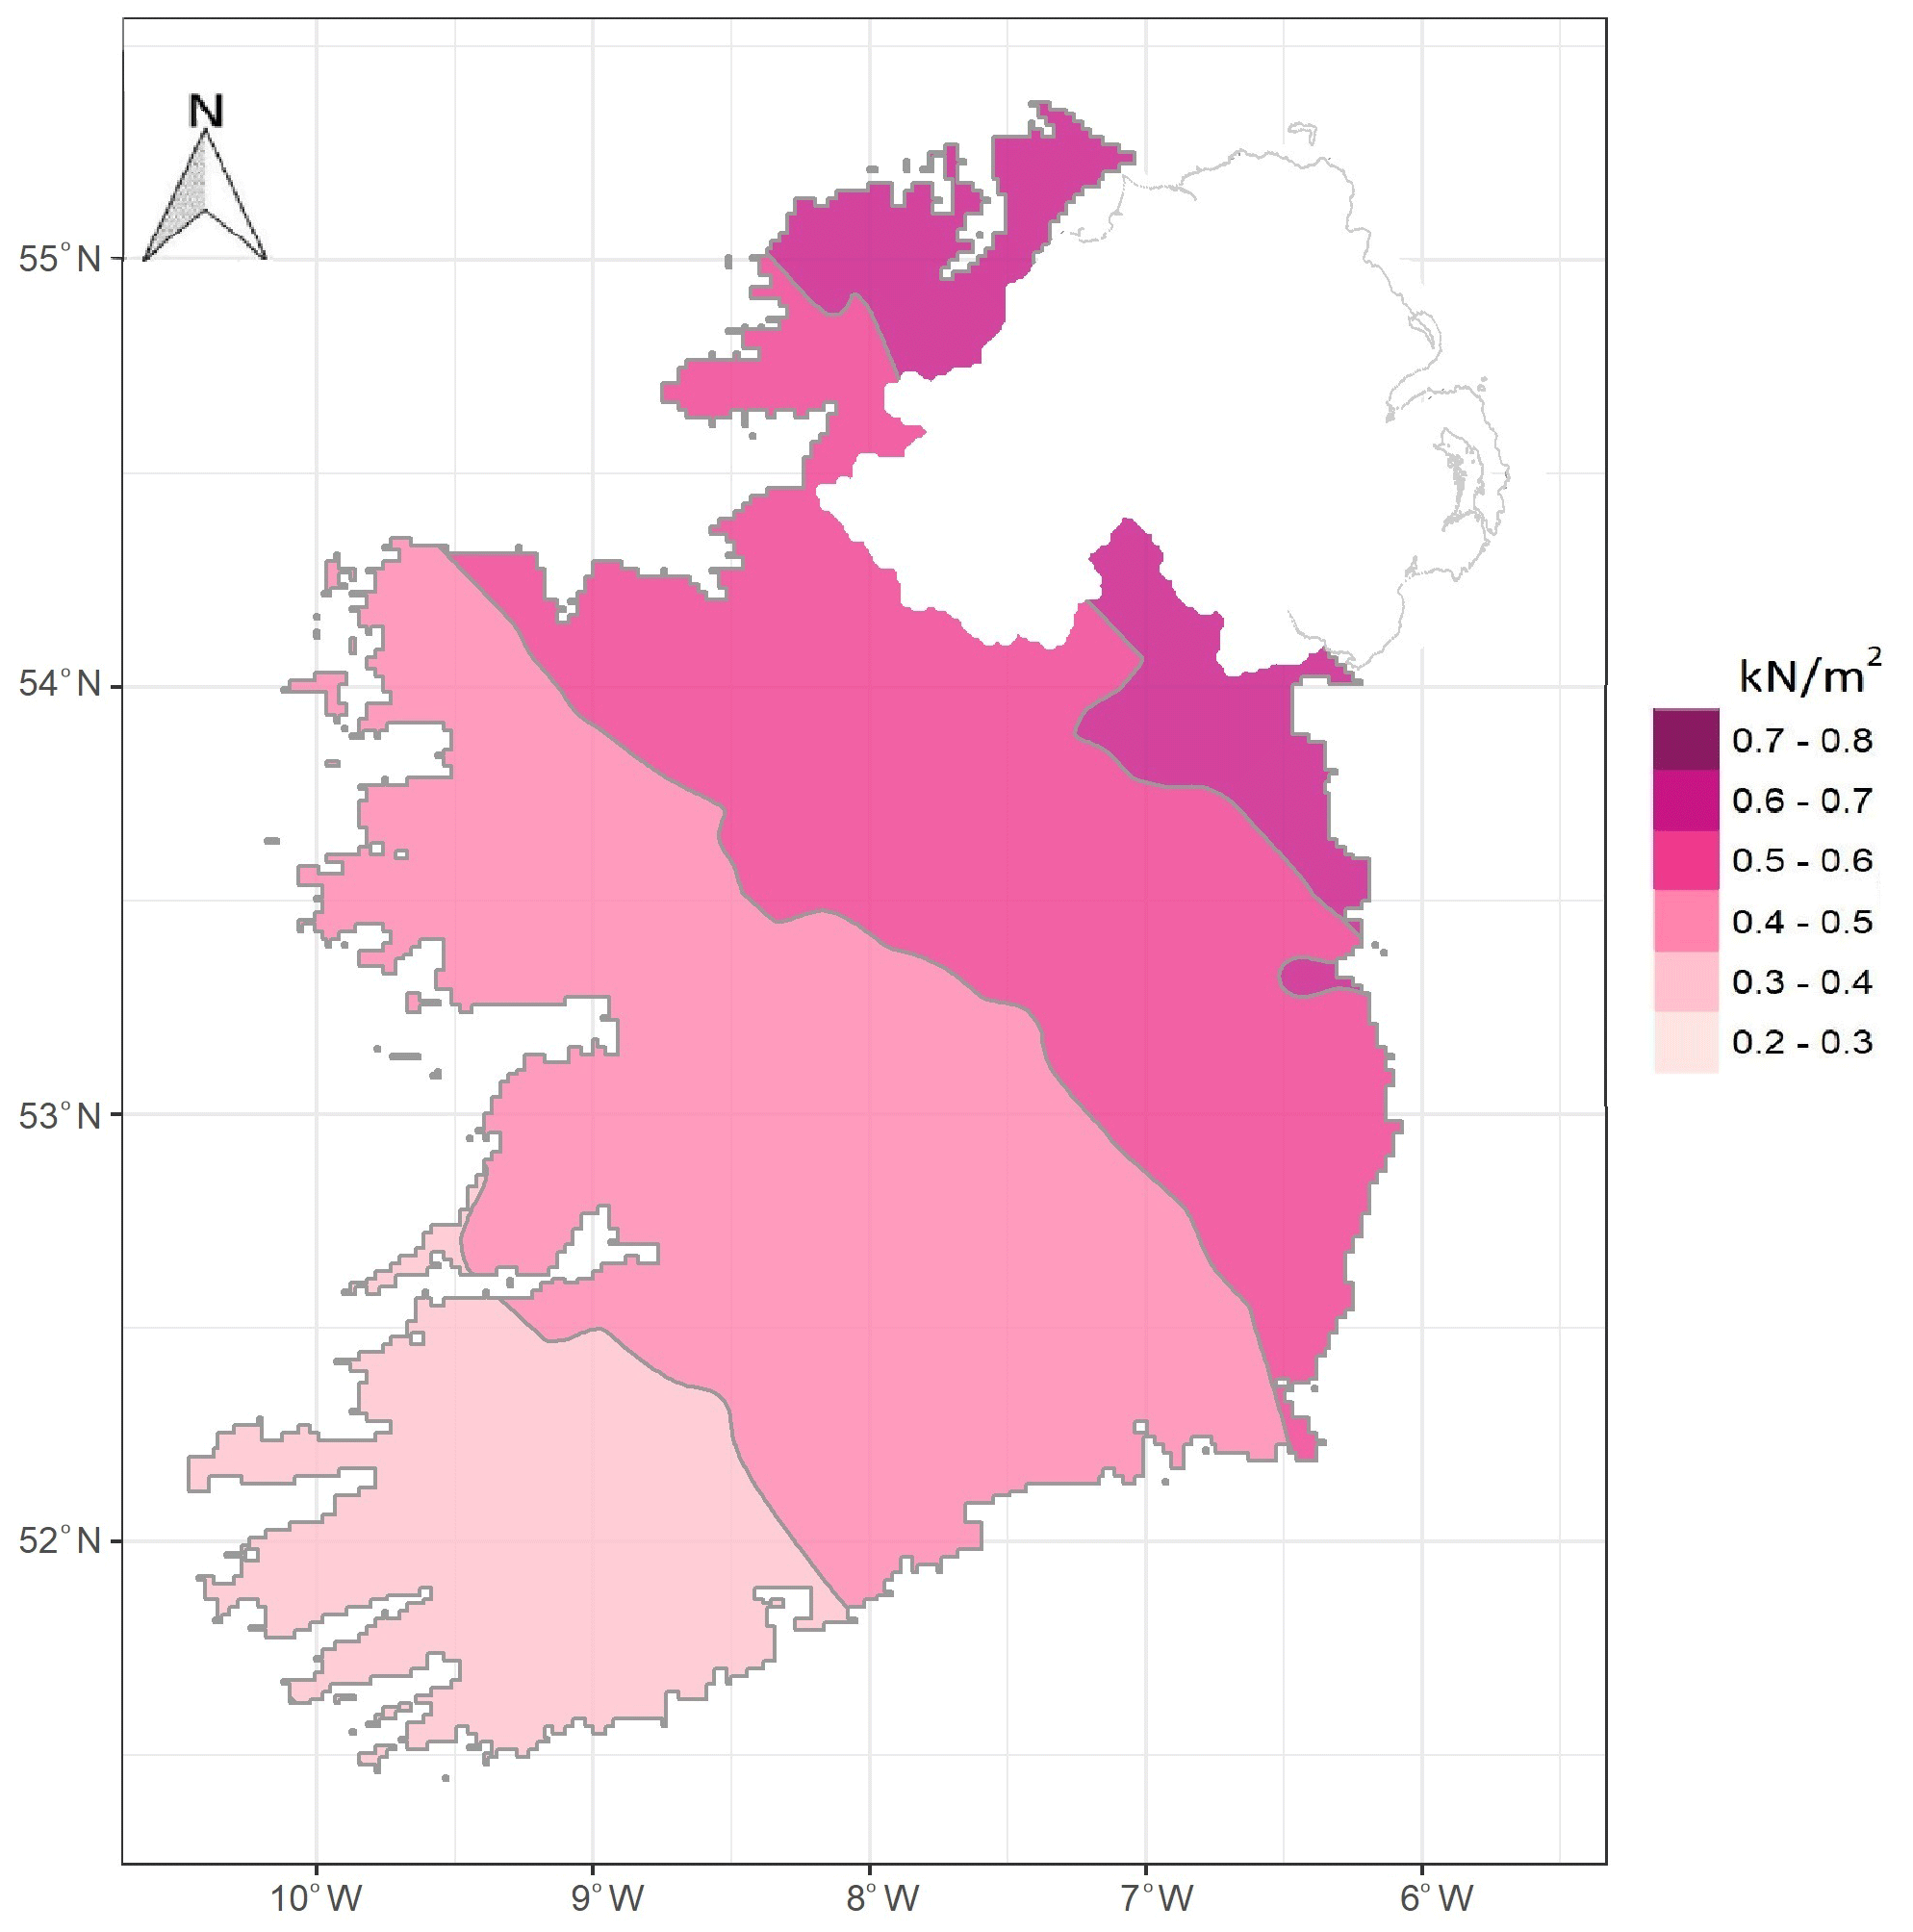
Figure 16Return values of snow loadings at 100 m above mean sea level in Ireland for a 100-year return period.
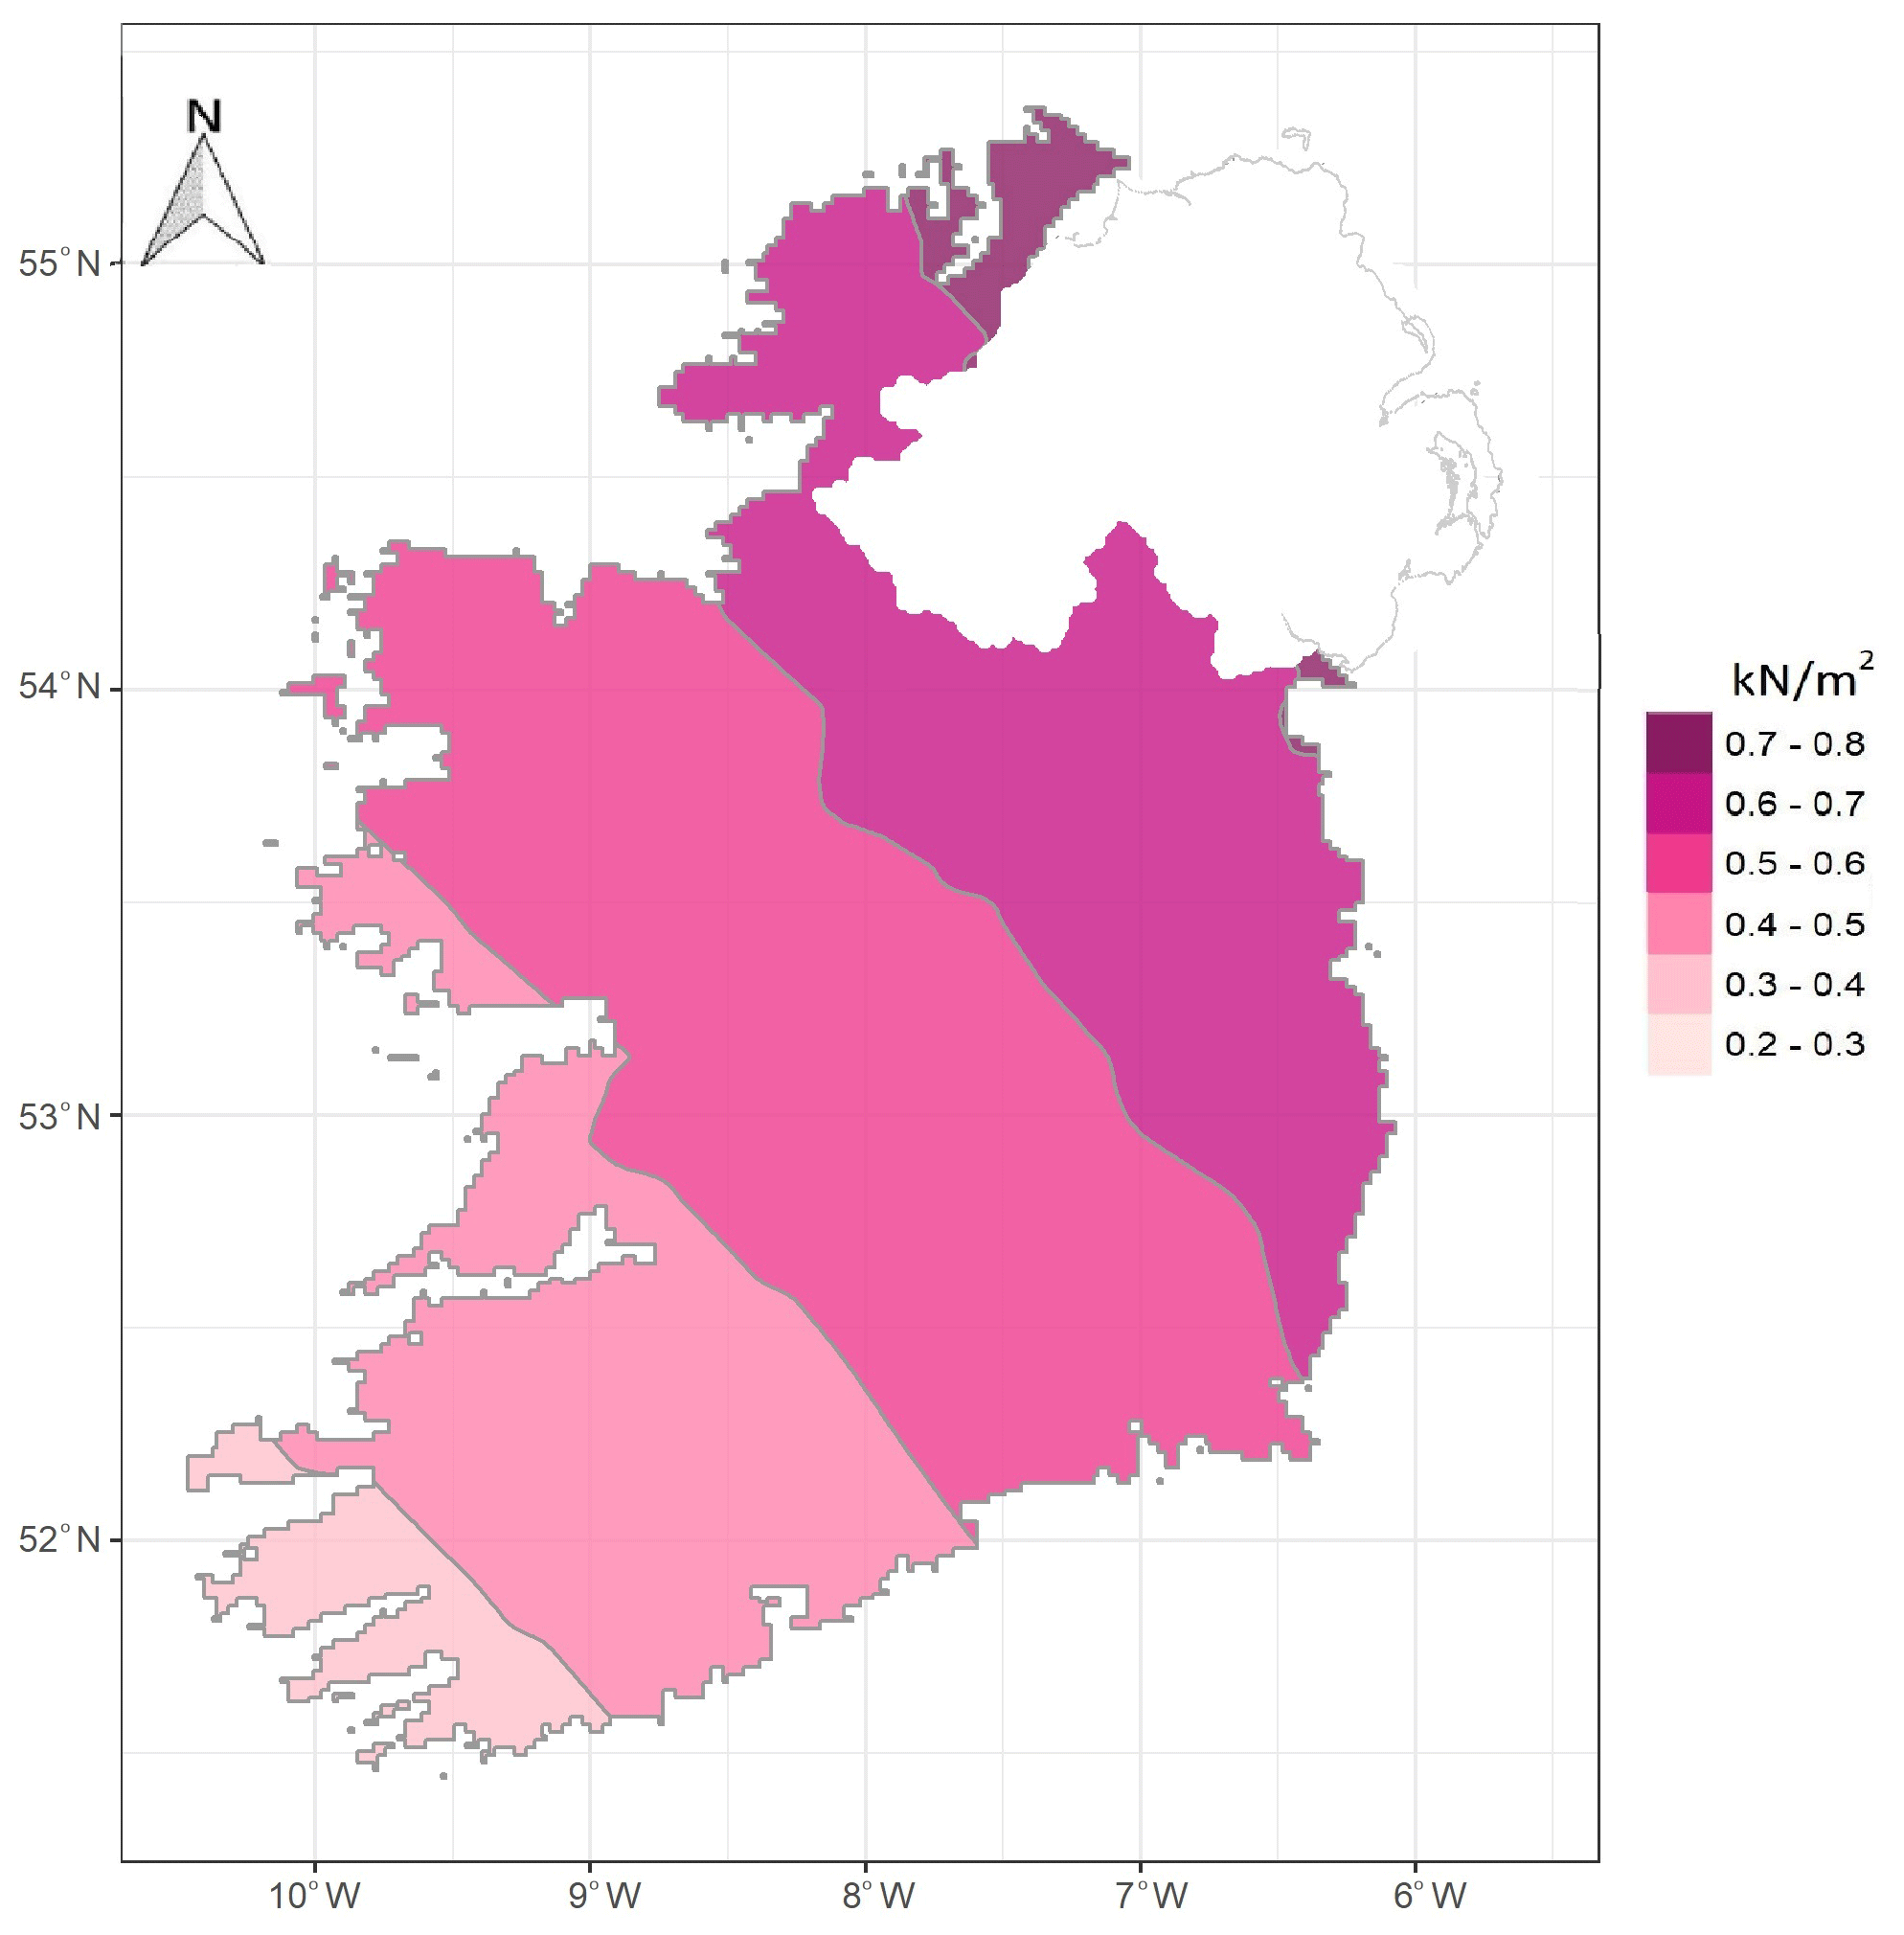
Figure 17Return values of snow loadings at 100 m above mean sea level in Ireland for a 120-years return period.
The classes of return values of snow loadings for the 50, 100 and 120-year return periods have a decreasing geographical distribution from the North-East to South-West. Specifically, the occurrence of snow tends to increase with distance from the west and south coasts, and snow lying is more often recorded in the midlands, eastern and northern areas than in the western part of the country due to an easterly polar continental airflow, where the jet stream has been pushed south.
Discrepancies were identified in the previous 50-year return period map produced for Ireland (Keegan, 2010; Government of Ireland, 2012; National Standards Authority of Ireland, 2015b) with the map produced by the British Standards Institution (2007) for the United Kingdom and Ireland. Discrepancies in the map for Ireland refer to an area of 0.7 kN m−2 in the Dublin/Wicklow area, higher snow loadings of 0.6 kN m−2 in the Monaghan region and the Southern region represented as 0.4 kN m−2 (Keegan, 2010; Government of Ireland, 2012; National Standards Authority of Ireland, 2015b). The values of the 50-year return period map present four classes spread North-East to South-West: < 0.3, 0.3–0.4, 0.4–0.5 and 0.5–0.6 kN m−2, whereas the previous map had four classes distributed as follows: 0.4, 0.5, 0.6 and 0.7 kN m−2 (Keegan, 2010; Government of Ireland, 2012; National Standards Authority of Ireland, 2015b). The map of return values of the 50-year return period produced in this research has a more representative geographical distribution of snow loads than the preceding map (Keegan, 2010; Government of Ireland, 2012; National Standards Authority of Ireland, 2015b) and presents more agreement with the previous map published for the UK and Ireland (British Standards Institution, 2007). The rationale for the new map presented here being more accurate than the preceding map (Keegan, 2010; Government of Ireland, 2012; National Standards Authority of Ireland, 2015b) is outlined as follows:
-
Employment of a denser network of stations, including locations in Northern Ireland, to avoid discrepancies of outputs in the border, with longer lengths and comprising a few stations with hourly data in addition to the daily snow depths.
-
The application of a more accurate correction of +3 cm to account for a possible discrepancy between the once-daily recorded snow depth and the actual maximum snow depth over that particular day which can occur at any time over 24 h.
-
The gridding methodology employed in R software to produce the maps is more robust than the spline interpolation employed in ArcGIS software to generate the previous map of snow loads.
There is a discussion in the scientific literature about contrasting responses between mean and extreme snowfall to climate change (Räisänen, 2008; O'Gorman, 2014; Fontrodona Bach et al., 2018). The new maps of return values of snow loadings for 50, 100 and 120-year return periods presented here represent the worst-case scenario in the current context of climate warming. The IPCC (2021) projects a decrease in snowfall events, which would be larger at 2.0 ∘C warming or above in comparison to a warming of 1.5 ∘C in the global mean air temperature. In addition, the annual snowfall in Ireland is projected to decrease by the middle of the 21st century when considering the RCP4.5 (mean value 52 %) and RCP8.5 (mean value 63 %) scenarios, with the largest decrease in the low-lying regions (Nolan and Flanagan, 2020). Averaged over Ireland, the decreases in snowfall are 51 % (RCP4.5) and 60 % (RCP8.5) (Nolan and Flanagan, 2020).
Isothermal maps of return values of the highest maximum and lowest minimum air temperatures for return periods of 50, 100 and 120-year, based on the generalised extreme value distribution (Coles, 2001; Gilleland and Katz, 2016) and adjusted for height above mean sea level (Hopkins and Whyte, 1975; CEN, 2003) have been produced for Ireland. These maps supersede the previous maps published for a 50-year return period (British Standards Institution, 2007; National Standards Authority of Ireland, 2008) and regulators should adopt them.
For the first time, isothermal maps of return values of the lowest 10 cm soil temperature for 50, 100 and 120-year return periods based on the generalised extreme value distribution (Coles, 2001; Gilleland and Katz, 2016) have been produced for Ireland.
Maps of return values of snow loadings at 100 m above mean sea level for 50, 100, and 120-year return periods based on the Generalised Pareto distribution (e.g. Coles, 2001) and National Standards Authority of Ireland (2015a) have been published for Ireland. These new maps are more representative and supersede the previous map of return values of snow loadings at 100 m above mean sea level for a 50-year return period (Keegan, 2010; Government of Ireland, 2012; National Standards Authority of Ireland, 2015b).
It is expected that the comprehensive explanation of the methodology and the rationale for the new maps being more accurate than the preceding maps will assist regulators in adopting these new maps in their own jurisdictions. The new maps will support the structural design of buildings and civil engineering works to enhance resilience in support of climate change adaptation and will also be of interest to a diversity of sectors and planners in Ireland.
The methodology employed here can be applied by other countries in Europe that must employ the same Eurocodes (CEN, 2003; British Standards Institution, 2007; International Organization for Standardization, 2013).
The motivation of this research was to renew existing return value estimates. Future work shall employ climate projections in the assessment of the effects of climate change on the estimates.
The csv files with information on gridded data for 1 km and the shapefiles of all maps will be available open-access via the National Framework for Climate Services and the Met Éireann website (https://www.met.ie/, Met Éireann, 2023). Further enquiries to data access can be made to Met Éireann's Climate Enquiries at enquiries@met.ie.
CM calculated the return values for maximum, minimum and soil temperatures and BC for snow loadings. CM produced the location station maps. BC wrote the code and produced the gridded maps. CM wrote the manuscript, which was revised by BC.
The contact author has declared that neither of the authors has any competing interests.
Publisher’s note: Copernicus Publications remains neutral with regard to jurisdictional claims in published maps and institutional affiliations.
This article is part of the special issue “EMS Annual Meeting: European Conference for Applied Meteorology and Climatology 2022”. It is a result of the EMS Annual Meeting: European Conference for Applied Meteorology and Climatology 2022, Bonn, Germany, 4–9 September 2022. The corresponding presentation was part of session OSA2.4: Weather impacts for built infrastructure.
The authors would like to express their special thanks to the steering committee members of the project “Climate maps and data to support building design standards in Ireland” and from the National Standards Authority of Ireland, ARUP, Kavanagh Mansfield & Partners and Department of Housing, Local Government and Heritage for the regular meetings and their insightful discussions.
Thanks to colleagues in the Climate Services division for providing homogenised daily maximum and minimum air temperature data.
Many thanks to the Met Éireann voluntary observers who took the meteorological observations across the country.
Thank you to two anonymous reviewers for their comments and suggestions.
This research has been supported by the Department of Housing, Local Government and Heritage.
This paper was edited by Carlo Buontempo and reviewed by two anonymous referees.
British Standards Institution: BS 5400-8:1978 Steel, concrete and composite bridges. Part 8: Recommendations for materials and workmanship, concrete, reinforcement and prestressing tendons, London, https://www.thenbs.com/PublicationIndex/documents/details?Pub=BSI&DocID=249300 (last access: 9 May 2023), 1978.
British Standards Institution: NA to BS EN 1991-1-5:2003 UK National Annex to Eurocode 1: Actions on structures – Part 1-5: General actions – Thermal actions, London, ISBN 978 0 580 50575 1, 2007.
CEN: EN 1991-1-5: 2003, Eurocode 1: Actions on structures – Part 1–5: General actions – Thermalactions, Brussels, CEN, https://www.phd.eng.br/wp-content/uploads/2015/12/en.1991.1.5.2003.pdf (last access: 9 May 2023), 2003.
Coles, S.: An introduction to statistical modelling of extreme values. Springer, London, https://doi.org/10.1007/978-1-4471-3675-0, 2001.
Conrad, V. and Pollack, L. W.: Methods in Climatology, Harvard University Press, Cambridge, MA, USA, ISBN 1406736945, 9781406736946, 1950.
Fontrodona Bach, A., Van der Schrier, G., Melsen, L. A., Klein Tank, A. M. G., and Teuling, A. J.: Widespread and accelerated decrease of observed mean and extreme snow depth over Europe, Geophys. Res. Lett., 45, 12–312, https://doi.org/10.1029/2018GL079799, 2018.
Gilleland, E. and Katz, R. W.: extRemes 2.0: an extreme value analysis package in R, J. Stat. Softw., 72, 1–39, https://doi.org/10.18637/jss.v072.i08, 2016.
Government of Ireland: Building Regulations 2012, Technical Guidance Document A, Structure, Dublin, Stationery Office, https://www.gov.ie/en/publication/3d58c-technical-guidance-document-a-structure/ (last access: 9 May 2023), 2012.
Griffin, S., Mateus, C., and Lambkin, K.: Climate data for use in building design – past and future weather files for overheating risk assessment. Climatological Note No. 21, Dublin, Met Éireann, http://hdl.handle.net/2262/102418 (last access: 9 May 2023), 2023.
Hengl, T.: A practical guide to geostatistical mapping of environmental variables, EUR 22904 EN Scientific and Technical Research Series, Office for Official Publications of the European Communities, Luxembourg, 143 pp., https://publications.jrc.ec.europa.eu/repository/handle/JRC38153 (last access: 9 May 2023), 2007.
Hopkins, J. S. and Whyte, K. W.: Extreme temperatures over the United Kingdom for design purposes, Meteorol. Mag., 104, 94–102, 1975.
Hubbard, K. G., Goddard, S., Sorensen, W. D., Wells, N., and Osugi, T. T.: Performance of quality assurance procedures for an applied climate information system, J. Atmos. Ocean. Tech., 22, 105–112, https://doi.org/10.1175/JTECH-1657.1, 2005.
IPCC: Summary for Policymakers, in: Climate Change 2021: The Physical Science Basis. Contribution of Working Group I to the Sixth Assessment Report of the Intergovernmental Panel on Climate Change, edited by: Masson-Delmotte, V., Zhai, P., Pirani, A., Connors, S. L., Péan, C., Berger, S., Caud, N., Chen, Y., Goldfarb, L., Gomis, M. I., Huang, M., Leitzell, K., Lonnoy, E., Matthews, J. B. R., Maycock, T. K., Waterfield, T., Yelekçi, O., Yu, R., and Zhou, B., Cambridge University Press, Cambridge, United Kingdom and New York, NY, USA, 3–32, https://www.ipcc.ch/report/sixth-assessment-report-working-group-i/ (last access: 9 May 2023), 2021.
International Organization for Standardization: ISO 4355:2013 bases for design of structures – determination of snow loads on roofs, https://www.iso.org/standard/56059.html#:~:text=ISO 4355:2013 specifies methods,maps, tables, or formulae (last access: 9 May 2023), 2013.
Keegan, L.: Snow loading calculations for Ireland, Dublin, Met Éireann, 2010.
Mateus, C. and Coonan, B.: Isothermal maps of maximum and minimum shade air temperatures in Ireland. Climatological Note no. 18, Dublin, Met Éireann, http://hdl.handle.net/2262/101585 (last access: 9 May 2023), 2022a.
Mateus, C. and Coonan, B.: Isothermal maps of the lowest 10 cm soil temperature in Ireland, Climatological Note no. 19, Dublin, Met Éireann, http://hdl.handle.net/2262/101584 (last access: 9 May 2023), 2022b.
Mateus, C. and Coonan, B.: Snow loadings at 100 m above mean sea level in Ireland Climatological Note no. 20, Dublin, Met Éireann, http://hdl.handle.net/2262/101583 (last access: 9 May 2023), 2022c.
Mateus, C. and Coonan, B.: Estimation of point rainfall frequencies in Ireland. Technical Note No. 68, Met Éireann, http://hdl.handle.net/2262/102417 (last access: 9 May 2023), 2023.
Mateus, C. and Potito, A.: Long-term trends in daily extreme air temperature indices in Ireland from 1885 to 2018, Weather and Climate Extremes, 36, 100464., https://doi.org/10.1016/j.wace.2022.100464, 2022.
Met Éireann: https://www.met.ie/ (last access: 9 May 2023), 2023.
Met Office: MIDAS Open: UK daily temperature data, v202107. NERC EDS Centre for Environmental Data Analysis, CEDA archive [data set], https://doi.org/10.5285/92e823b277cc4f439803a87f5246db5f, 2021a.
Met Office: MIDAS Open: UK soil temperature data, v202107, NERC EDS Centre for Environmental Data Analysis, CEDA archive [data set], https://doi.org/10.5285/cabc37d867fa4f2a84302350df908693, 2021b.
Met Office: MIDAS Open: UK daily weather observation data, v202107, NERC EDS Centre for Environmental Data Analysis, CEDA archive [data set], https://doi.org/10.5285/d399794d81fa41779a925b6d4758a5cd, 2021c.
Met Office: MIDAS Open: UK hourly weather observation data, v202107, NERC EDS Centre for Environmental Data Analysis, CEDA archive [data set], https://doi.org/10.5285/3bd7221d4844435dad2fa030f26ab5fd, 2021d.
National Standards Authority of Ireland: Irish Standard I.S. EN 1991-1-5:2003 + NA Eurocode 1: Actions on structures – Part 1-5: General actions – Thermal actions (Including Irish National Annex), Dublin, National Standards Authority of Ireland, https://shop.standards.ie/en-ie/standards/i-s-en-1991-1-5-2003-857851_saig_nsai_nsai_2040737/ (last access: 9 May 2023), 2008.
National Standards Authority of Ireland: I.S. EN 1991-1-3:2003&AC:2009&A1: 2015 Eurocode 1 – Actions on structures – Part 1-3: General actions – snow loads, Dublin, National Standards Authority of Ireland, https://shop.standards.ie/en-ie/standards/i-s-en-1991-1-3-2003-ac-2009-a1-2015-857845_saig_nsai_nsai_3069281/ (last access: 9 May 2023), 2015a.
National Standards Authority of Ireland: National Annex plus Amendment NA+A2:2020 to I.S. EN 1991-1-3:2003&A1:2015. Irish National Annex (Informative) to Eurocode 1 – Actions on structures – Part 1-3: General actions – Snow loads, Dublin, National Standards Authority of Ireland, https://shop.standards.ie/en-ie/standards/na-a2-2020-to-i-s-en-1991-1-3-2003-a1-2015-883849_saig_nsai_nsai_2905467/ (last access: 9 May 2023), 2015b.
Nolan, P. and Flanagan, J.: High-resolution climate projections for Ireland – a multi-model ensemble approach, Report No. 339, Wexford, Environmental Protection Agency, https://www.epa.ie/publications/research/climate-change/research-339-high-resolution-climate-projections-for-ireland-.php (last access: 9 May 2023), 2020.
O'Donnell, F. C., Tingerthal, J. S., and White, S.: Estimation of ground snow loads for low-latitude, high-elevation regions, J. Cold Reg. Eng., 34, 04020008, https://doi.org/10.1061/(ASCE)CR.1943-5495.0000209, 2020.
O'Gorman, P. A.: Contrasting responses of mean and extreme snowfall to climate change, Nature, 512, 416–418, https://doi.org/10.1038/nature13625, 2014.
Räisänen, J.: Warmer climate: less or more snow?, Clim. Dynam., 30, 307–319, https://doi.org/10.1007/s00382-007-0289-y, 2008.
Rees, J., Harris, T., Smith, B., Denton, S., and Ko, R.: The UK National Annex to BS EN 1991-1-4, BS EN 1991-1-5, and PD 6688-1-4, in: Bridge Design to Eurocodes: UK Implementation, 123–147, ICE Publishing, ISBN 9780727741509, 2011.
Szentimrey, T.: Multiple Analysis of Series for Homogenization (MASHv3.03), Budapest, Hungarian Meteorological Service, https://www.met.hu/en/omsz/rendezvenyek/homogenization_and_interpolation/software/ (last access: 9 May 2023), 2017.
Walsh, S.: Long-term temperature averages for Ireland 1981-2010. Climatological Note no. 16, Dublin, Met Éireann, http://hdl.handle.net/2262/79901 (last access: 9 May 2023), 2017.
World Meteorological Organization: Guide to meteorological instruments and methods of observation, Volume 5, quality assurance and management of observing systems, Geneva, World Meteorological Organization, https://library.wmo.int/index.php?id=12407&lvl=notice_display#.ZFDPn3Yo-Uk (last access: 9 May 2023), 2018.
World Meteorological Organization: Guide to meteorological instruments and methods of observation, Volume 1, measurement of meteorological variables, Geneva, World Meteorological Organization, https://library.wmo.int/index.php?id=12407&lvl=notice_display#.ZFDPn3Yo-Uk (last access: 9 May 2023), 2021.
Trewin, B.: Exposure, instrumentation, and observing practice effects on land temperature measurements, Wires Clim. Change, 1, 490–506, https://doi.org/10.1002/wcc.46, 2010.