 | 15 Jul 2024
Mesoscale weather influenced by auroral gravity waves contributing to conditional symmetric instability release?
We consider possible influence on severe weather occurrence in the context of solar wind coupling to the magnetosphere–ionosphere–atmosphere system, mediated by aurorally excited atmospheric gravity waves. Solar wind high-speed streams from coronal holes cause intensifications of ionospheric currents at high latitudes launching gravity waves propagating in the upper and lower atmosphere. While these gravity waves reach the troposphere with much attenuated amplitudes, they can contribute to conditional symmetric instability release and intensification of storms. Severe weather events, including winter storms and heavy rainfall causing floods and flash floods, show a tendency to follow arrivals of solar wind high-speed streams from coronal holes. The ERA5 re-analysis is used to evaluate slantwise convective available potential energy and vertically integrated extent of realizable symmetric instability to assess the likelihood of slantwise convection in frontal zones of extratropical cyclones during severe snowstorms and flash floods. The observed low-level southerly winds and high wind shears in these regions are favorable conditions for over-reflection of down-going aurorally excited gravity waves potentially contributing to conditional symmetric instability release leading to slantwise convection and high-rate precipitation.
- Article
(16201 KB) - Full-text XML
-
Supplement
(2201 KB) - BibTeX
- EndNote


Forecasting weather has significantly improved but continues to present challenges, such as prediction of flash floods (Ferraris et al., 2002; Gourley et al., 2012; Terti et al., 2019), tornado outbreaks (Schultz et al., 2019; Gensini et al., 2019; Mercer and Bates, 2019; Chernokulsky et al., 2020; Miller et al., 2020), explosive extratropical cyclones (Sanders 1987; Gyakum et al., 1996; Kuwano-Yoshida and Enomoto, 2013; Schultz et al., 2019), and rapid intensification of tropical cyclones (Rozoff and Kossin, 2011; DeMaria et al., 2021; Lu et al., 2023).
It has been shown (Prikryl et al., 2009a, 2016, 2018, 2019, 2021a, b; Prikryl and Rušin, 2023) that severe weather events tend to occur following the arrivals of co-rotating interaction regions (CIRs) (Smith and Wolfe, 1976) at the leading edge of solar wind high-speed streams (HSSs) from coronal holes (Krieger et al., 1973; Tsurutani et al., 1995), or impacts of interplanetary coronal mass ejections (ICMEs) (Burlaga et al., 1981; Gopalswamy, 2016). It is the southward component of the interplanetary magnetic field, often due to solar wind Alfvén waves (Tsurutani et al., 2018), that cause magnetic reconnection (Dungey, 1961, 1995) and solar wind energy input into the magnetosphere and ionosphere. The solar wind coupling extends to the neutral atmosphere because it is a major source of large-amplitude aurorally excited atmospheric gravity waves (Hines, 1960) propagating globally in the atmosphere that can reach the troposphere (Mayr et al., 1984a, b).
It has been proposed that aurorally excited atmospheric gravity waves (AGWs) may play a role in influencing storm development (Prikryl et al., 2009b) by contributing to the release of conditional symmetric instability (CSI) (Schultz and Schumacher, 1999; Chen et al., 2018). Particularly when down-going AGWs over-reflect in regions of opposing winds and wind shears in the warm frontal zone of extratropical cyclones, where CSI is often present, and can be released by even a very small displacement of a moist air parcel provided by the AGWs. While these AGWs reach the troposphere with much attenuated amplitudes, they are subject to amplification (Jones, 1968; Cowling et al., 1971; McKenzie, 1972; Eltayeb and McKenzie, 1975).
Prikryl et al. (2018; their Sect. 4.6) showed that striated delta clouds that were first identified by Feren (1995) tend to occur following arrivals of HSSs or ICMEs. Striated cloud heads associated with extreme cases of rapid cyclogenesis have defied satisfactory explanations (Dixon et al., 2000). Dixon et al. (2002) considered the role of moist symmetric instability in the development of cloud heads. Prikryl and Rušin (2023) investigated heavy precipitation events that showed a tendency to follow arrivals of solar wind HSSs. They suggested that aurorally excited AGWs contributed to the intensification of explosive extratropical cyclones, which showed striated delta clouds and a series of convection cells in cold fronts, resulting in “back building” mesoscale convective lines (Bluestein and Jain, 1985).
A theoretical analysis of downward AGW propagation in the lower atmosphere by Hagiwara and Tanaka (2020) using an expansion of three-dimensional normal mode functions showed that “the wave propagations and reflections at the surface create an anti-node of geopotential at the bottom of the atmosphere corresponding to the vertical width of the initial state of the impact”. On the other hand, “standing waves in temperature create a node at the ground surface”. These authors suggested that standing waves generated in the lower troposphere, through the passage of AGWs, could affect atmospheric stability, and in turn, affect the development of cyclones.
In this paper, to provide further support for the proposed physical mechanism, after brief reviews of previously published results, we assess the presence of CSI and slantwise convection, along with low-level winds and wind shears, in cases of winter storms and flash floods that show a tendency to occur following arrivals of HSSs when large-amplitude AGWs are generated by solar wind coupling to the magnetosphere-ionosphere-atmosphere (MIA) system.
For the analysis of conditional instability in the troposphere, the latest hourly climate reanalysis produced by ECMWF, ERA5, at 0.25°×0.25° is utilized (Hersbach et al., 2020). Following Chen et al. (2018; their Sect. 2), indices including convective available potential energy (CAPE), slantwise CAPE (SCAPE), and vertically integrated extent of realizable symmetric instability (VRS; a measure to quantify the “releasable” CSI) are diagnosed, to assess the likelihood of slantwise convection during severe snowstorms storms and flash floods.
The Integrated Multi-satellitE Retrievals for GPM (IMERG) Final Precipitation L3 at daily resolution, at spatial scale of 0.1°×0.1° V06 (GPM_3IMERGDF) dataset (Huffman et al., 2019) is provided by the Goddard Earth Sciences Data and Information Services Center (https://disc.gsfc.nasa.gov/datasets/GPM_3IMERGDF_06/summary?keywords=IMERG, last access: 10 July 2024).
A browser archive of global satellite images of clouds at 3-hourly intervals is provided by the International Satellite Cloud Climatology Project Global ISCCP B1 Browse System (GIBBS) (Knapp, 2008).
The Northeast Snowfall Impact Scale (NESIS) was developed by the National Weather Service (Kocin and Uccellini, 2004a; https://www.ncdc.noaa.gov/snow-and-ice/rsi/nesis, last access: 10 July 2024) to consider the societal impacts of these snowstorms, in particular the impact on transportation and economy. NESIS characterizes and ranks high impact of the snowstorms in the north-eastern US into five categories: Extreme, Crippling, Major, Significant, and Notable. The index uses population information in addition to meteorological measurements. Similar, but not identical with the NESIS, is the Regional Snowfall Index (RSI) (https://www.ncdc.noaa.gov/snow-and-ice/rsi/, last access: 10 July 2024) for significant snowstorms that impact the eastern two thirds of the US. The RSI is an evolution of NESIS index that ranks snowstorm impacts on a scale from 1 to 5 by including population information to estimate the societal impacts. For details on how RSI is calculated, see Squires et al. (2014).
The solar wind data are provided by the National Space Science Data Center (NSSDC) OMNIWeb (King and Papitashvili, 2005; http://omniweb.gsfc.nasa.gov, last access: 10 July 2024). The hourly averages of solar wind velocity (V), the interplanetary magnetic field (IMF) magnitude (), the standard deviation of IMF Bz (), and the proton density (np) are used to identify co-rotating interaction regions (CIRs), which are the interfaces between the fast and slow solar wind at the leading edge of HSSs from coronal holes (Tsurutani et al., 1995, 2006). The highly fluctuating IMF Bz component in CIRs and high-density plasma adjacent to the heliospheric current sheet and CIR (Tsurutani et al., 1995, 2006, 2016) cause recurring geomagnetic storms (Tsurutani et al., 2006). The IMF sector boundaries, where the IMF reverses its polarity, have been identified as heliospheric current sheets (HCSs) (Smith et al., 1978; Hoeksema et al., 1983) that usually closely precede, or coincide (Huang et al., 2016a, b), with stream interfaces. In the absence of the IMF data, magnetic sector boundary crossings (SBCs), which are now generally referred to as HCS crossings, can be estimated from ground-based magnetograms (Svalgaard, 1975). In the present paper we use an updated list of SBCs/HCSs (Prikryl et al., 2009a).
Measurements of the intensity of the green coronal emission line (Fe XIV, 530.3 nm) by ground-based coronagraphs from 1939 to 2008 are available in a homogeneous coronal dataset (Rybanský, 1975; Rybanský et al., 2001, 2005; Dorotovič et al., 2014; https://www.kozmos-online.sk/, last access: 10 July 2024). The coronal intensities are expressed in absolute coronal units (ACU) representing the intensity of the continuous spectrum from the center of the solar disk with a width of 1 Å at the same wavelength as the observational spectral line (1 ACU = 3.89 W m−2 sr−1 at 530.3 nm). The intensity depletions, called coronal holes, are sources of HSSs. The green corona intensity for the solar central meridian is computed by averaging the intensities measured at the east and west limbs 14 d apart (Prikryl et al., 2009a).
Prikryl et al. (2009b) observed travelling ionospheric disturbances (TIDs) caused by AGWs from auroral sources that also propagated in the lower atmosphere and reached the troposphere (Prikryl et al., 2005; and references therein). They suggested that down-going aurorally-excited AGWs that over-reflect in the warm frontal zone of extratratropical cyclones contribute to CSI release, resulting in slantwise convection and series of cloud/rain bands. The cloud/rain bands were correlated with AGWs that were observed in the upper atmosphere even if ray tracing of the AGWs from auroral sources showed that they can also propagate in the lower atmosphere and reach the troposphere (Prikryl et al., 2009b; 2018). This mechanism offers a plausible explanation for the statistical findings mentioned in Introduction, which establish a connection between severe weather events and the coupling of solar wind to the magnetosphere–ionosphere–atmosphere (MIA), thereby triggering the generation of aurorally excited atmospheric gravity waves.
In this section, the presence of CSI and slantwise convection in frontal zones of extratropical cyclones is assessed using the method by Chen et al. (2018), who investigated the evolution of slantwise convective available potential energy (SCAPE) in explosive and nonexplosive cyclones. They found that SCAPE exceeded values of CAPE prior to the onset of the rapid intensification of explosive cyclones pointing to the importance of CSI in the development of storms. Using this method in combination with the ERA5 reanalysis data we want to further confirm the hypothesis of Prikryl et al. (2009b) and assess the presence of CSI and slantwise convection for the case study of the extratropical cyclone on 2 November 1999 investigated previously.
3.1 Extratropical cyclone on 2 November 1999
3.1.1 Brief review of the event
Following the arrival of a moderate HSSs on 31 October 1999 the coupling of solar wind Alfvén waves modulated the dayside ionospheric currents launching AGWs that were observed as TIDs on 2 November from 15:00 UTC (Prikryl et al., 2009b; their Fig. 2). With a delay of 4.6 h determined by a cross-correlation of time series of TIDs and cloud/rain bands (Prikryl et al., 2009b; their Fig. 6), a series of mesoscale cloud/rain bands in the extratropical cyclone that were observed by a radiometer showed a striking similarity with the TIDs and their sources – quasiperiodic ionospheric currents observed at high latitudes. The GOES-8 satellite infrared images of this mid-latitude cyclone (Prikryl et al., 2009b; their Fig. 7) showed cloud bands in the warm frontal zone where CSI is known to be often present. The moist air parcels may rise naturally over the colder air masses ahead of the warm front but an additional lift could be provided by aurorally forced AGWs (Prikryl et al., 2009b; their Fig. 9).
3.1.2 The cyclone track and assessment of CSI
We now provide further evidence for the presence of CSI and slantwise convection in this case using the ERA5 reanalysis. Chen et al. (2022a) identified cyclone tracks with a storm tracking algorithm performed in a region covering North America and part of the Pacific and Atlantic Oceans (20–80° N, 180–0° W) using ERA5 reanalysis data. We used the North America Extratropical Cyclone (NAEC) Catalogue (1979–2020) (Chen et al., 2022b) to compute the deepening rate of the NAEC cyclone #12143 from 6 h time series of MSLP values. Using the criterion introduced by Sanders and Gyakum (1980), the maximum normalized 24 h deepening rate (Lim and Simmonds, 2002; their Eq. 1) is found to be NDRc=0.67 Bergerons at 12:00 UTC on 2 November. The central pressure of this cyclone deepened to a minimum of 980 hPa on 3 November at 03:00 UTC.
To evaluate the likelihood of slantwise convection several indices are calculated using the ERA5 reanalysis. These indices include SCAPE, fractional SCAPE residual (, and vertically integrated extent of realizable symmetric instability (Glinton et al., 2017; Chen et al., 2018). A high SCAPE, indicating high convective available potential energy for a slantwise ascending air parcel from low levels, is found in the warm sector of the cyclone (Fig. 1a). A closer-to-one fs indicates the relative dominance of slantwise over upright convection (Fig. 1b). VRS shows the thickness of the air layer (measured in pressure), where CSI, high relative humidity, and vertical motion coexist (Chen et al., 2018). Figure 1c shows that cloud/rain bands in the warm front produced high-rate precipitation co-located with high VRS values of above 100 hPa, a strong indication that CSI was released actively there (Fig. 1b) that persisted for several hours. Figure 1d shows low-level southerly winds and the wind shear evaluated between 900 and 1000 hPa levels, which further supports the proposition that AGWs could have contributed to CSI release and formation of the observed rain bands (Prikryl et al., 2009b).

Figure 1(a) SCAPE (shaded) and SCAPE–CAPE (red contours; 100, 300, and 500 J kg−1), (b) 1 h accumulated precipitation (shaded) and fs (red contours; thin for 0.5 and thick for 0.8), and (c) VRS (shaded) and precipitation (orange contours; 0.5 and 2.5 mm), (d) low-level wind shear (orange contour; 9, 15 m s−1 km−1) with the track of the NAEC storm #12143 overlaid. (a–d) All overlapped with 950 hPa wind (vectors; m s−1) and 950 hPa geopotential height (black contours; m; at intervals of 50 m).
3.2 Winter storms in the eastern US
The Northeast Snowfall Impact Scale (NESIS) developed by the National Weather Service (Kocin and Uccellini, 2004a; https://www.ncdc.noaa.gov/snow-and-ice/rsi/nesis, last access: 10 July 2024) consider the societal impacts of snowstorms, in particular the impact on transportation and economy. It characterizes and ranks the impact of snowstorms in the north-eastern US into five categories: Extreme, Crippling, Major, Significant, and Notable. The index uses population information in addition to meteorological measurements. Prikryl et al. (2018) performed the superposed epoch (SPE) analysis of solar wind variables keyed to start dates of the NESIS storms of category 2 or higher (Significant to Extreme) to show a tendency of severe snowstorms to occur following arrivals of HSS/CIRs.
It is noted that the start dates of the NESIS snowstorms do not necessarily relate to a particular phase in the development of extratropical cyclones which resulted in snowstorms in the north-eastern US. Furthermore, there are other causes of heavy snowfall, including the lake effect over the Great Lakes. Because we are aiming at snowstorm-causing cyclones to be potentially impacted by aurorally excited AGWs, it is more appropriate to use the days of the intensification of these cyclones, ideally the maximum deepening rate of the low-pressure systems, as key times in the SPE analysis.
As discussed previously (Prikryl et al., 2018; their supplementary material), in some cases the start days of NESIS storms were adjusted by estimating the relevant cyclone intensifications. Kocin and Uccellini (2004b) provided meteorological maps and satellite images of the NESIS snowstorms up to 2003. To determine approximate times of the cyclone deepening we have examined sequences of the published surface weather maps, or maps available online (http://www.wpc.ncep.noaa.gov/archives, last access: 10 July 2024), as well as sequences of images from a browser archive of global satellite IR images of clouds at 3-hourly intervals that is provided by the International Satellite Cloud Climatology Project Global ISCCP B1 Browse System (GIBBS) (Knapp, 2008). As a guiding criterion, a deepening to central pressure level of 1000 hPa, or less, estimated from available surface maps, and/or a visual appearance of cyclone intensification/cyclogenesis in IR images, was used to determine approximate start time of cyclonic development that likely led to, or was associated with, a snowstorm.
For example, the snowstorm on 25–28 January 2015 (Case 1 discussed further below) included a Colorado Low that was already weakening as it was passing by Great Lakes prior the rapid cyclogenesis that occurred over the east coast and resulted in the heaviest snowfall there on 26 January, which we used as the key date in the SPE analysis. Most of the NESIS start dates are used unadjusted as key dates, including those when no intensifying cyclone was identified. Only a few adjustments of the key dates by 1–2 d relative to the start dates of the NESIS snowstorms were made. An exception was the case of a significant snowstorm in 30 December 2013–3 January 2014 that was mostly caused by an intense lake effect before a cyclogenesis occurred over the south-east on 3 January, leading to a snowstorms in the north-eastern US, which contributed to heavy snowfall in the north-east, and this date is used as the key date in the SPE analysis.
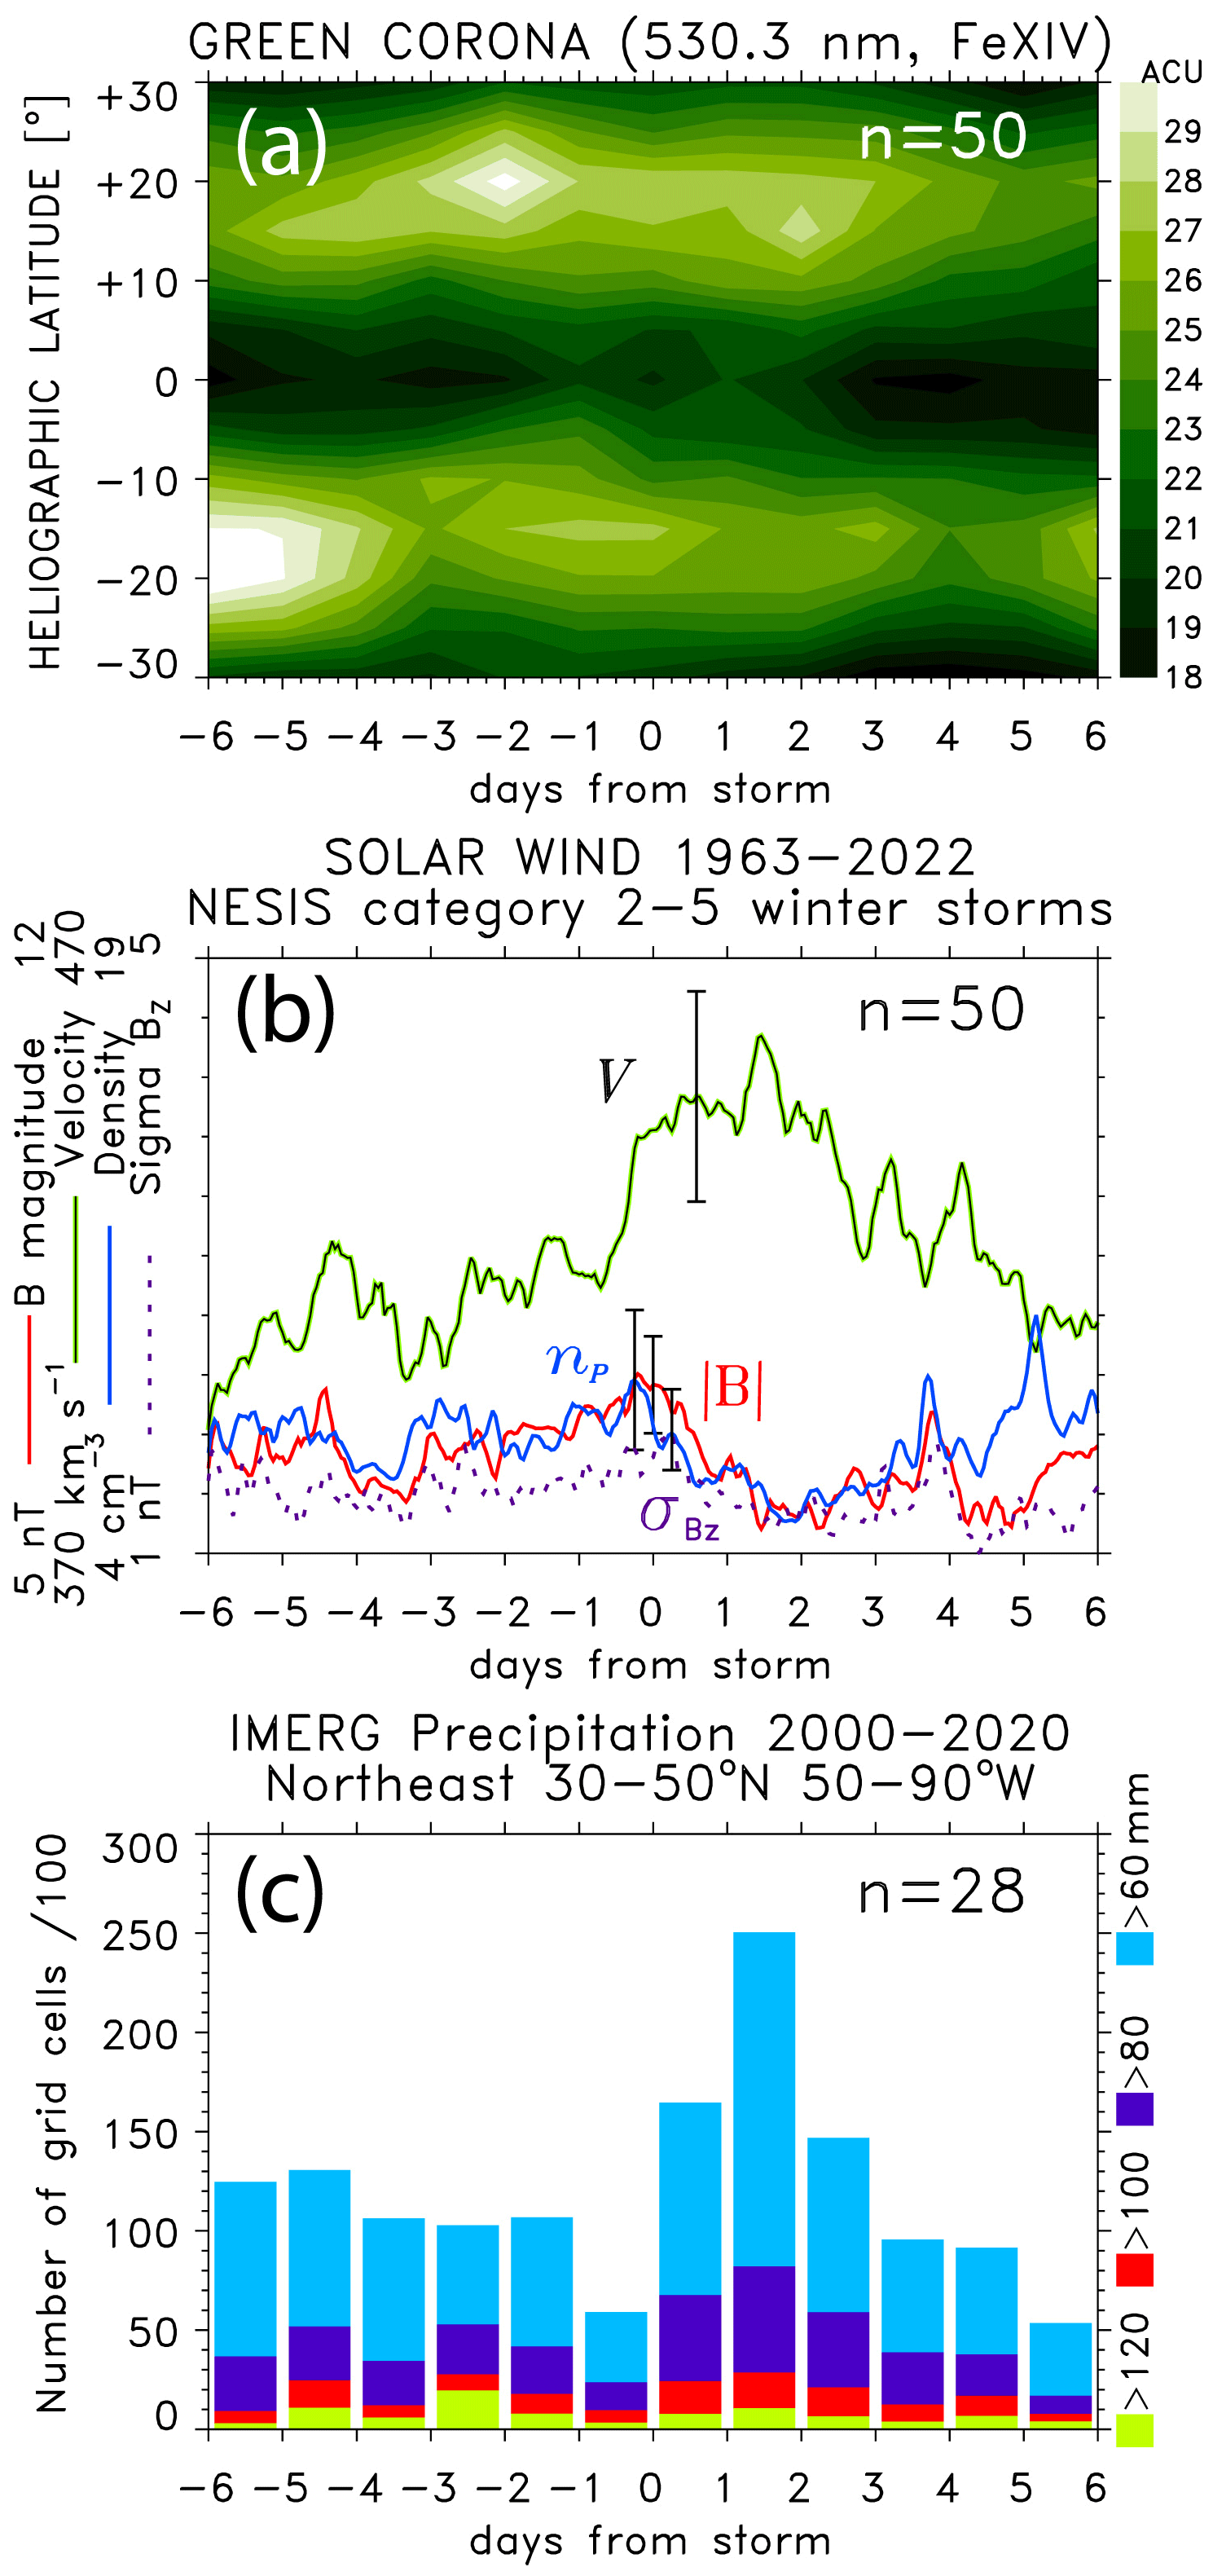
Figure 2SPE analysis of the time series of (a) green corona intensity and (b) solar wind plasma variables keyed to a start dates of NESIS snowstorms. The representative standard error bars for the mean values are shown. (c) The cumulative numbers of grid cells with above-threshold daily precipitation rates over the northeast region (30–50° N; 50–90° W).
We now extend the analysis by Prikryl et al. (2018; their Fig. 1) of NESIS storms of categories 2 to 5 and include the IMERG precipitation data for support. Figure 2a and b shows the results of the SPE analysis of green corona intensity and solar wind variables keyed to start days of 50 NESIS storms. The mean solar wind velocity V increases to an overall maximum after the key time. The mean solar wind density np, magnetic field , and the standard deviation peak around the key time. The broad enhancements of the mean parameters are due to superposition of misaligned CIRs. This pattern is similar to those obtained previously for several groups of storms (Prikryl et al., 2009a, 2018). The pattern indicates that severe snowstorms do not occur randomly relative to HSS/CIRs but tend to occur following the arrival of HSS/CIRs. The observed pattern is the result of the superposition of solar wind HSSs from coronal holes. The minimum of the green corona intensity around the epoch day −3 (Fig. 2a) is due to the superposition of coronal holes that are sources of HSSs. Figure 2c shows, for each epoch day, the cumulative number of the IMERG grid cells over the northeast region with daily precipitation rates exceeding thresholds of 60, 80, 100, and 120 mm. The IMERG data, while covering only years 2000–2020, show a peak in the occurrence of high precipitation rates following the key time.
To further support the SPE analysis results for the NESIS storms several cases of winter storms, some of which are not included among the NESIS storm, are discussed in the next sections. Greybush et al. (2017, 2023) assessed the ensemble predictability of the East Coast winter storms on 25–28 January 2015, 22–24 January 2016, 7 February 2020, and 16 January 2022. We decided to investigate these winter storms, as well as another winter storm on 30 January–3 February 2021, and one oceanic explosive extratropical cyclone on 6–7 February 2023, in the context of solar wind – MIA coupling following arrivals of HSSs from coronal holes. Figure 3 shows the solar wind plasma parameters for 12 d periods with the days of the above listed winter storms highlighted in yellow colour. The CIR interfaces between the fast and slow solar wind at the leading edge of the HSSs, and HCSs, are shown by vertical solid and dashed lines, respectively. In the next sections, the CSI and slantwise convection is assessed for four events on 25–28 January 2015, 22–24 January 2016, 7 February 2020, and 6–7 February 2023. The other two storms shown in Fig. 3d and e can be viewed in the Supplement.

Figure 3Solar wind plasma parameters showing HSS/CIRs and HCS (vertical solid and dashed lines) in (a) January 2015, (b) January 2016, (c) February 2020, (d) January to February 2021, (e) January 2022, and (f) February 2023. The yellow shaded rectangles indicate days of the east-coast winter storms.
3.2.1 Case 1: 25–28 January 2015
The snowstorm on 25–28 January is ranked as category 2 on the NESIS scale and as category 3 on the RSI scale. It developed during the arrival of HSS/CIR on 26 January (Fig. 3a). The NAEC cyclone track of storm #21149 (overlaid in Fig. 5d) showed a rapid intensification with the maximum rate of 0.75 Bergeron at 00:00 UTC on 27 January, reaching a minimum central pressure of 970 hPa. During the intensification a striated delta cloud (Feren, 1995) and convective bands developed in the frontal zones of the cyclone (Fig. 4a; GOES-13 IR image on the right). High values of SCAPE are found in the warm sector and the cold front area (Fig. 5a) with a closer-to-one fs indicating the relative dominance of slantwise over upright convection. The VRS (Fig. 5c) shows highest values in the warm sector, an indication that CSI was released resulting in high-rate precipitation derived from ERA5 (Fig. 5b). The striated delta cloud and warm frontal zone were co-located with low-level southerly winds and wind shears (Fig. 5d), the conditions that are favorable for over-reflection of AGWs.
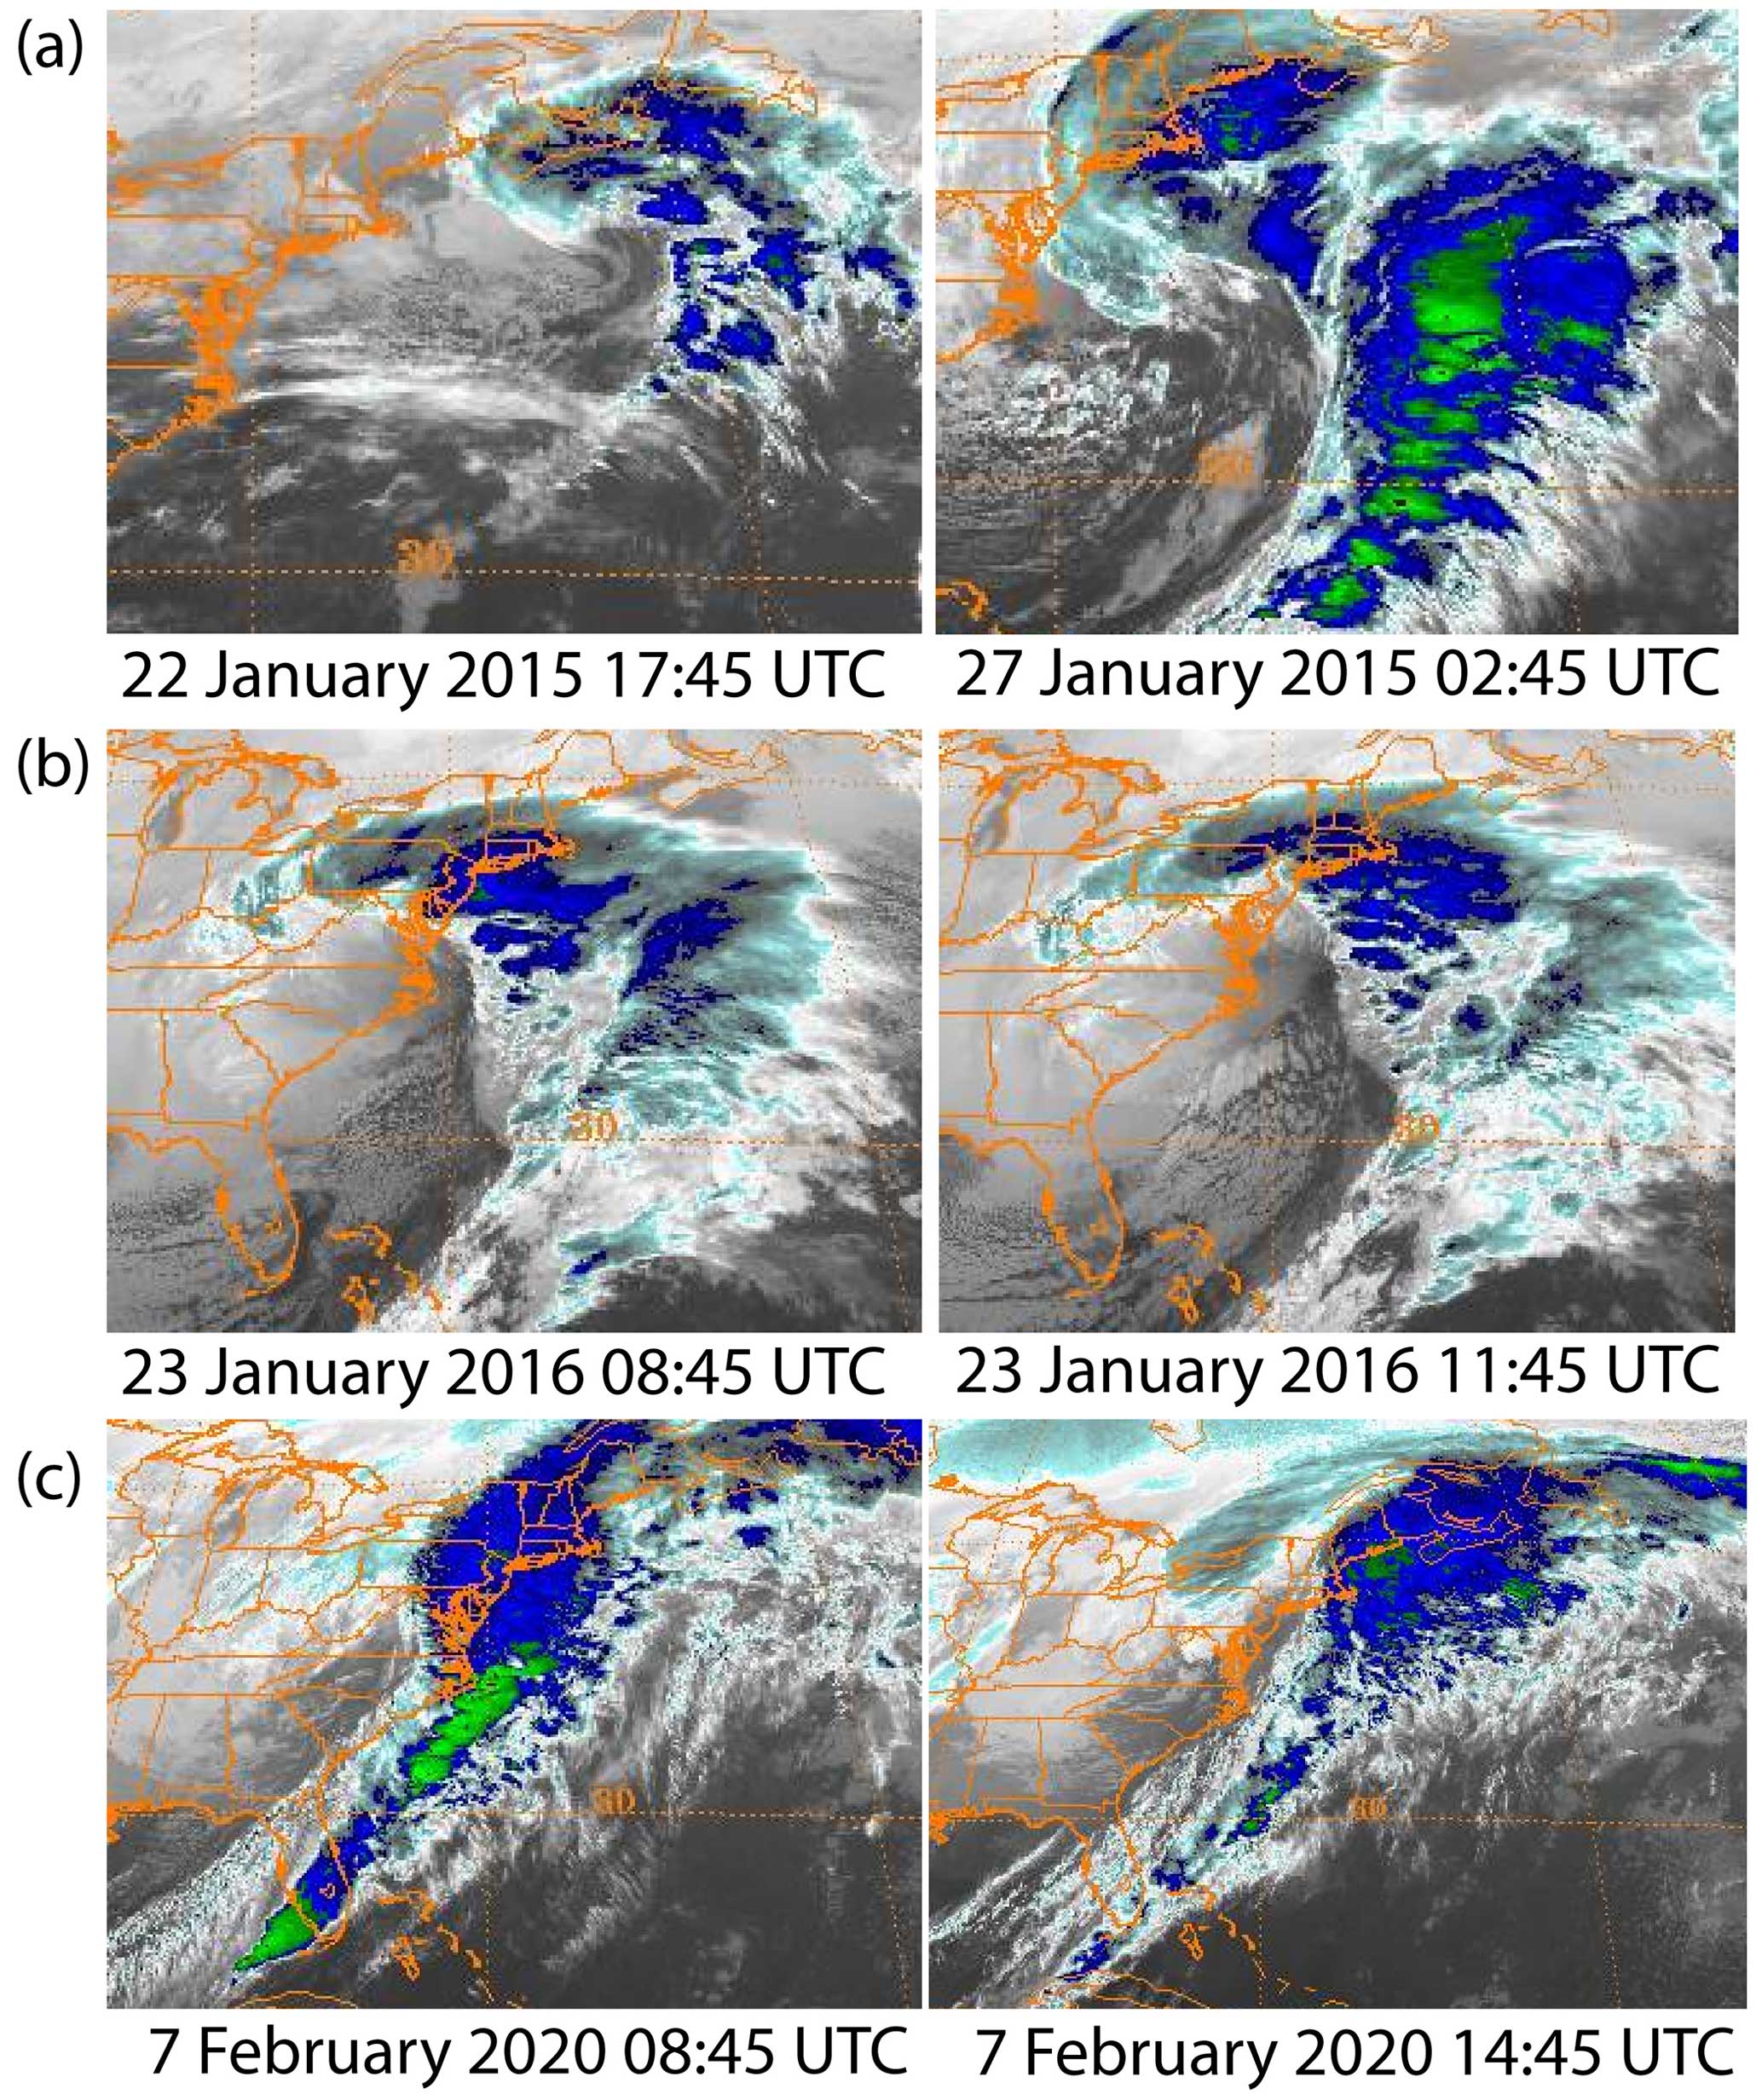
Figure 4The GOES-13 infrared images during winter storms in (a) January 2015, (b) January 2016, and (c) February 2020 (https://www.ncdc.noaa.gov/gibbs/, last access: 10 July 2024).

Figure 5The same as Fig. 1, but for the winter storm on 27 January 2015 with the track of the NAEC storm #21149 overlaid.
It is noted that following the arrival of a strong HSS/CIR on 21 January (Fig. 3a) another extratropical cyclone (NAEC storm #21143) intensified off the east coast starting on 22 January with the central pressure deepening to 970 hPa at a rate of 0.78 Bergeron. As in the case of the snowstorm a week later, this storm displayed similar banded clouds (Fig. 4a; GOES-13 IR image on the left) that were co-located with high values of SCAPE, low-level southerly winds, and wind shears, in the warm frontal zone. A major snowstorm affected Atlantic Canada with heavy snow and high winds (https://www.ctvnews.ca/canada/high-winds-heavy-snow-hammer-atlantic-canada-1.1650354/comments-7.476981, last access: 10 July 2024).
3.2.2 Case 2: 22–24 January 2016
The snowstorm on 22–24 January is ranked as category 4 (Crippling) in the NESIS scale. As already shown in the previous study (Prikryl et al., 2018; their Fig. 2a), the present Fig. 3b shows that this winter storm developed following the arrival of a strong HSS/CIR from a recurrent coronal hole (recurring with solar rotation period of 27 d). Separated by about 27 d, two other winter storms on 15–16 February and 15–16 March 2016 were closely associated with the same recurrent HSS/CIR (Prikryl et al., 2018; their Figs. 2–4) that caused recurrent geomagnetic storms.
The snowstorm in January was caused by a cyclone intensifying over the east coast. The track of the NAEC storm #21733 (Chen et al., 2022b) shows the cyclone's central pressure reaching the minimum of 985 hPa following the 24 h deepening rate of 0.42 Bergeron at 18:00 UTC on 22 January. During the deepening phase the extratropical cyclone developed a striated delta cloud that can be seen in Fig. 4b. Prikryl et al. (2018; their supplementary material) examined a series of the GOES-13 IR images and suggested that AGWs launched by ionospheric currents at auroral latitudes could have played a role in the formation of the striated delta cloud that caused high-rate precipitation derived from ERA5 (Fig. 6b). The striated delta cloud was co-located with low-level southerly winds and wind shears evaluated between 900 and 1000 hPa levels (Fig. 6d), the conditions favorable for over-reflection of equatorward propagating down-going AGWs.
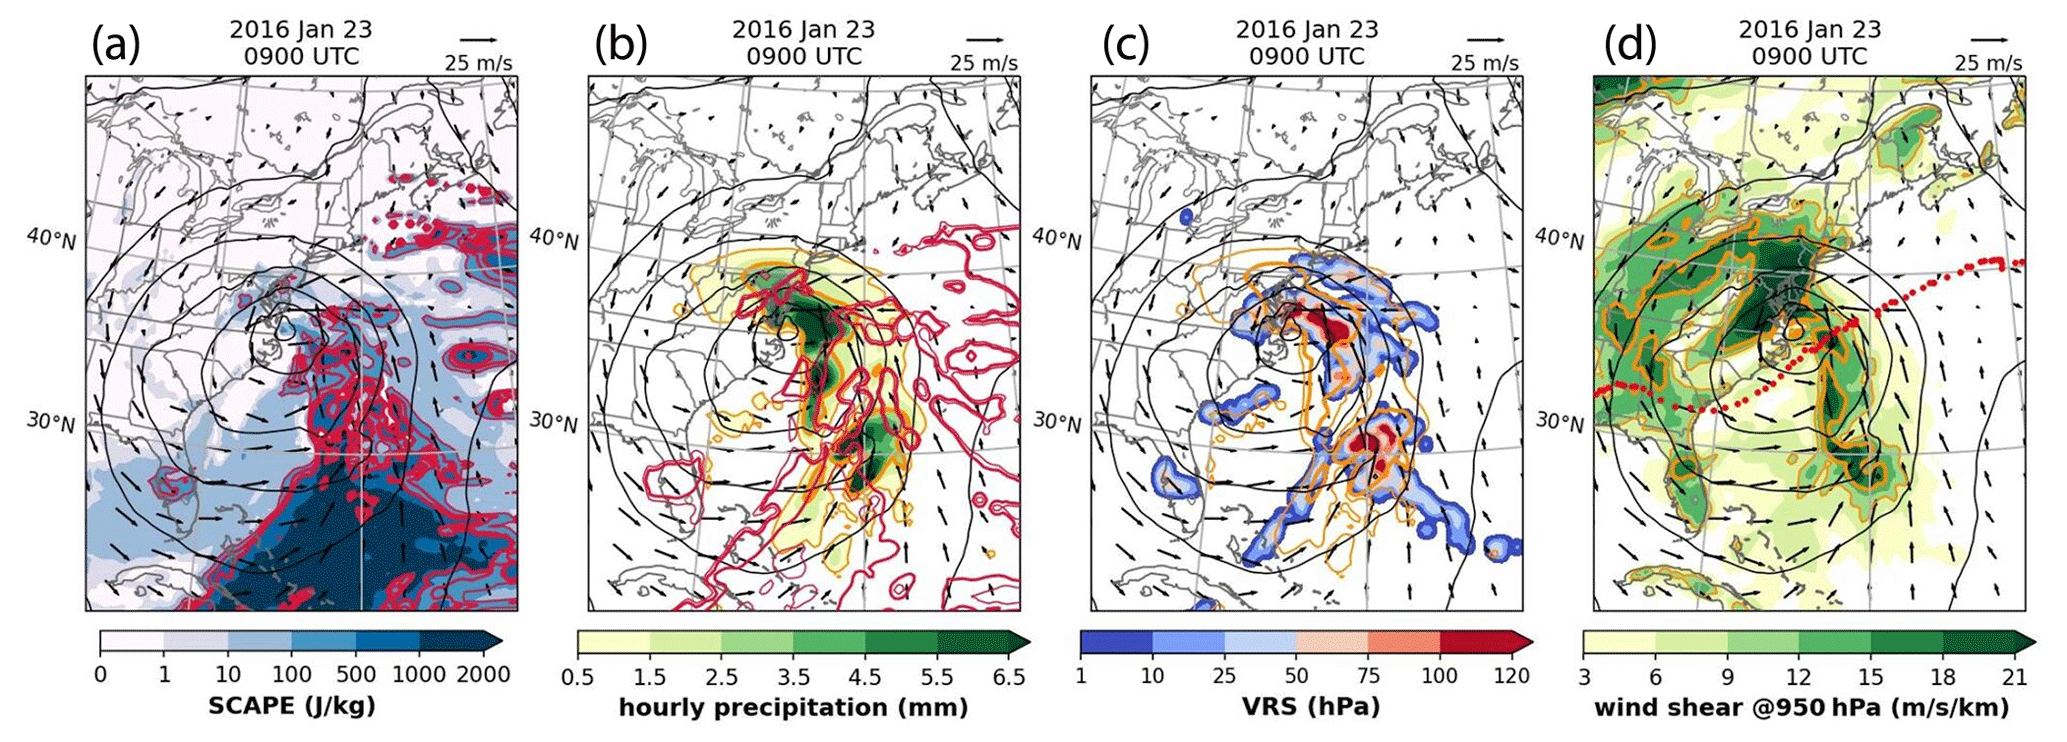
Figure 6The same as Fig. 1, but for the winter storm on 23 January 2016, with the track of the NAEC storm #21733 overlaid.
Similarly to the case discussed in Sect. 3.1 the high values of SCAPE were present in the warm sector of the cyclone (Fig. 6a). A closer-to-one fs indicates the relative dominance of slantwise over upright convection. The VRS (Fig. 6c) shows the thickness of the air layer (measured in pressure), where CSI, high relative humidity, and vertical motion coexist (Chen et al., 2018). It shows the highest values co-located with the striated delta (Fig. 6c), a strong indication that CSI was being released actively there, with high VRS values matching the high-rate precipitation (Fig. 6b) that persisted for several hours.
3.2.3 Case 3: 7 February 2020
This snowstorm that is not included among the NESIS snowstorms was discussed by Greybush et al. (2017, 2023). The storm developed following the arrival of HSS/CIR on 6 February (Fig. 3c). Heavy precipitation started already on 5 February during a period of strong northwest flow of a decaying atmospheric river bringing significant moisture (https://www.weather.gov/gjt/WinterStormSummary_Feb04-07_2020, last access: 10 July 2024). On 7 February, the central pressure of the cyclone (NAEC storm #24075) deepened at a rate 0.65 Bergeron to 968 hPa. The rapid cyclogenesis over the east coast further intensified the snowstorm that affected the US and Canada with heavy snowfall and widespread wind damage (https://www.weather.gov/phi/EventReview20200207, last access: 10 July 2024). The cyclone developed a cloud head (Fig. 4c) exhibiting mesoscale snow bands (Varcie et al., 2023; Colle et al., 2023). The frontal zones show high values of SCAPE (Fig. 7a) indicating the relative dominance of slantwise convection, where the VRS (Fig. 7c) shows the highest values, an indication that CSI was released resulting in high-rate precipitation derived from ERA5 (Fig. 7b). As in the other cases, the frontal zones were co-located with high low-level southerly winds and wind shears (Fig. 7d).
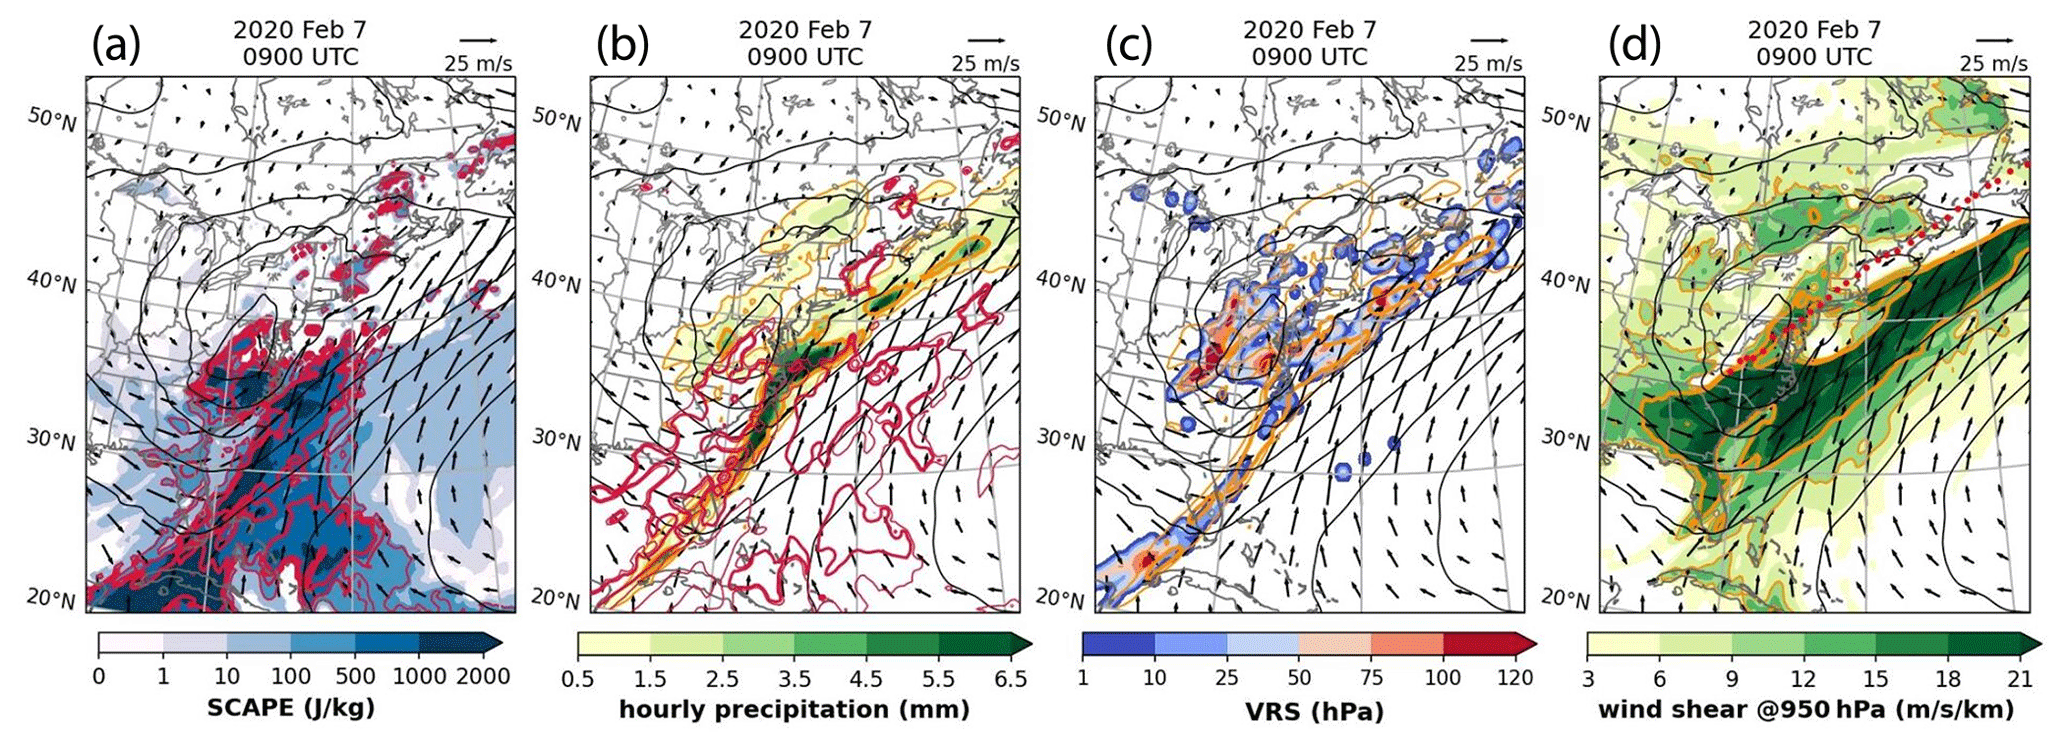
Figure 7The same as Fig. 1, but for the winter storm on 7 February 2020 with the track of the NAEC storm #24075 overlaid.
3.2.4 Case 4: 6–7 February 2023
While this oceanic explosive extratropical cyclone developed off the US east coast and only marginally affected the east coast of Canada with strong winds, this occurred following the arrival of HSS/CIR (Fig. 3f). The cyclone would have likely caused a severe winter storm if it developed over the US coast. It explosively intensified on 6 February from a low of 1015 hPa just east of Florida deepening to 978 hPa in 24 h, with the IR images displaying banded structures in the cloud head and the warm frontal sector (Fig. 8). In these regions, high values of SCAPE, VRS, precipitation rates, as well as low-level southerly winds and wind shears are found (Fig. 9). As was the case for the event discussed in Sect. 3.1, the solar wind coupling to the MIA system modulated the dayside ionospheric currents generating AGWs that could have contributed to CSI release leading to intensification of cyclones and high precipitation.
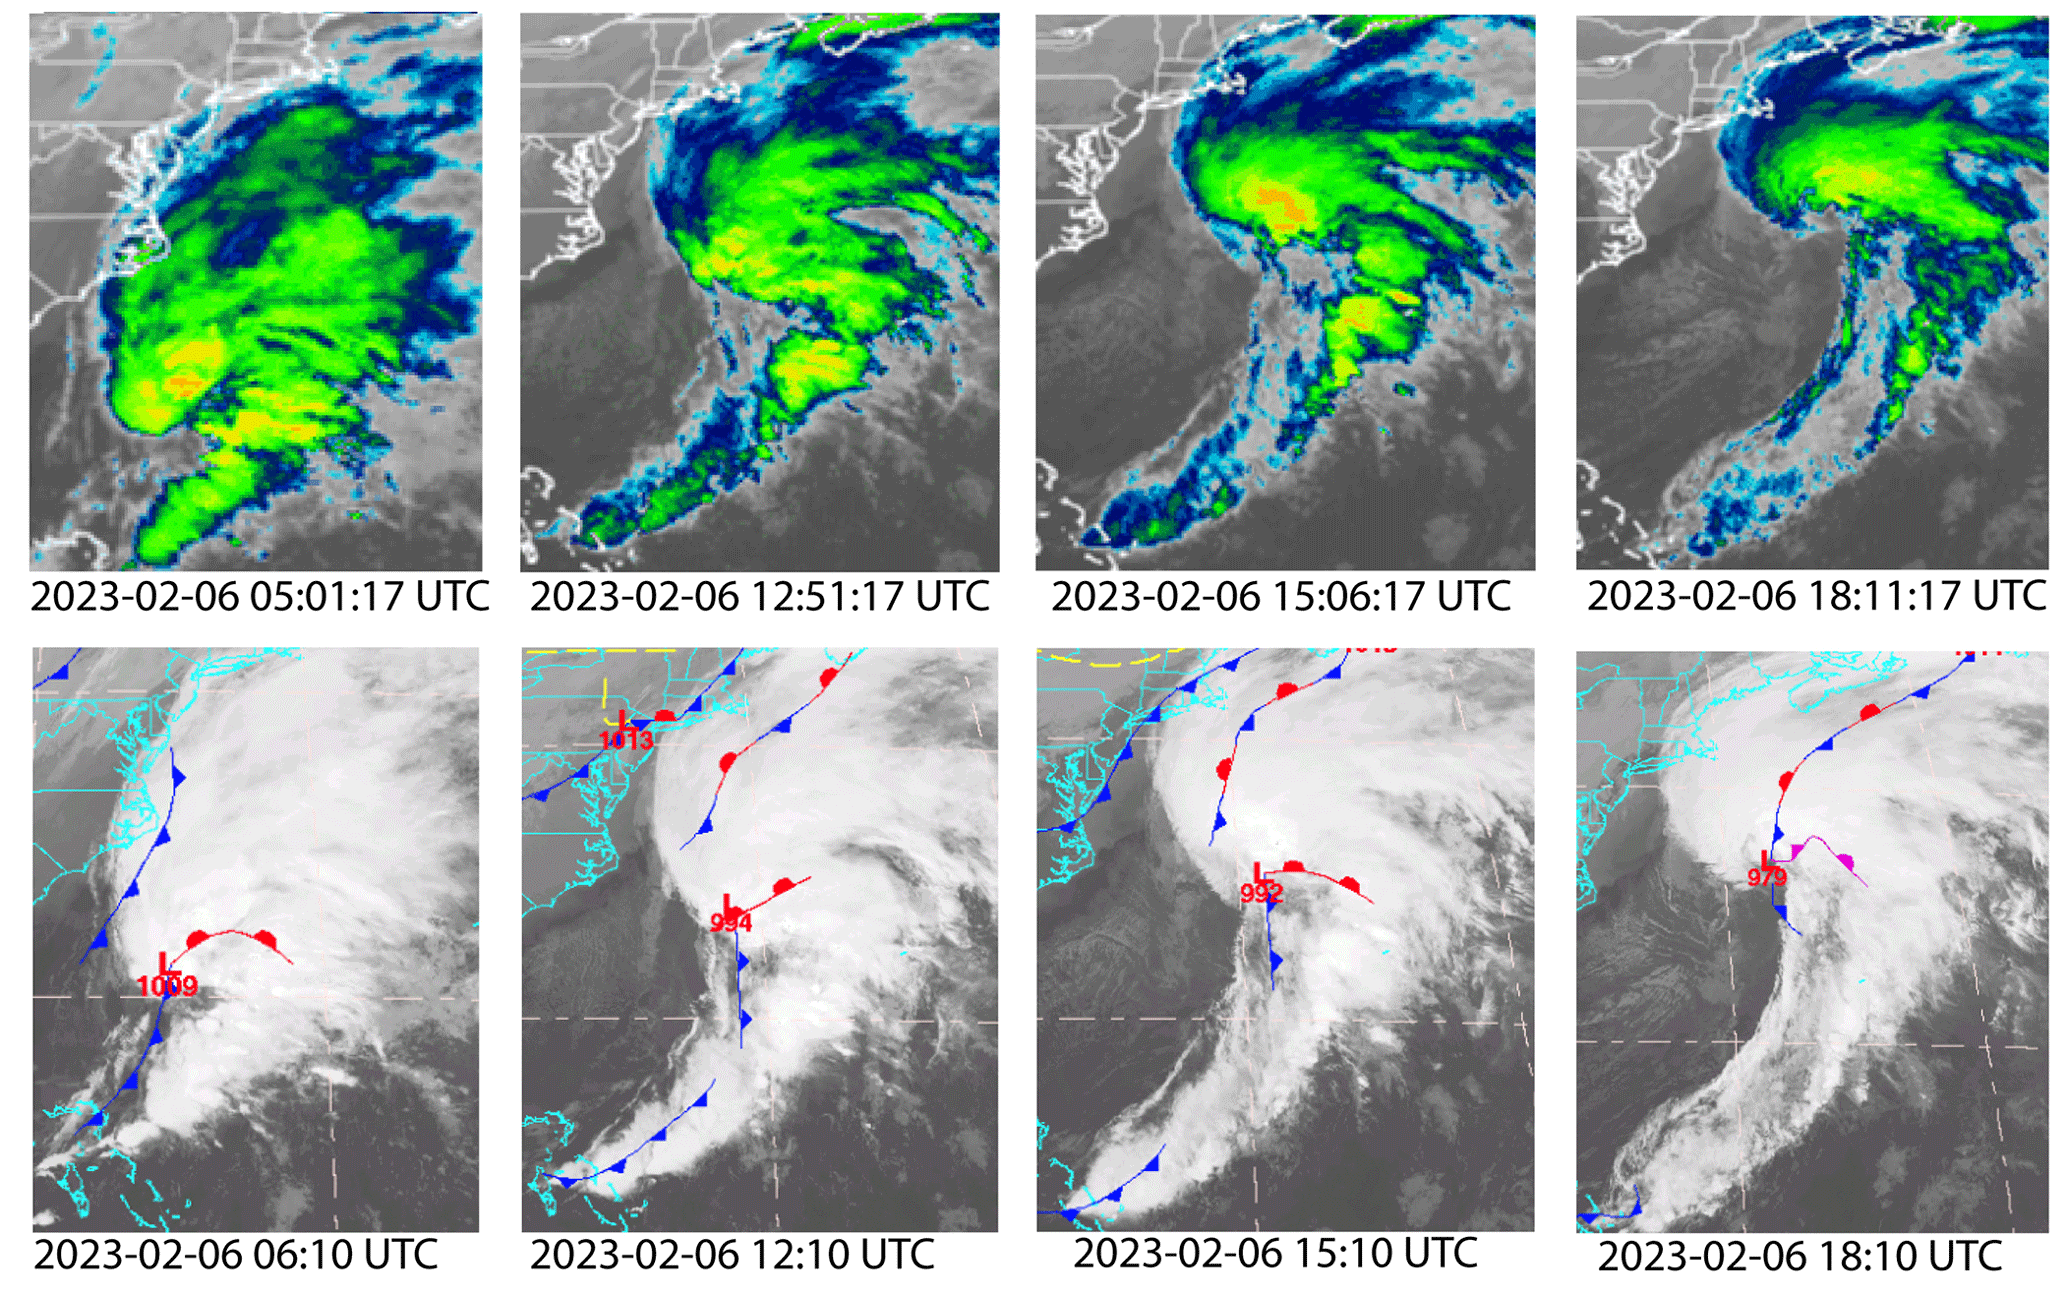
Figure 8The GOES-16 IR images (Band 13: 10.4 µm) extracted from SLIDER by RAMMB/CIRA @ CSU animations and infrared images with NCEP-analyzed fronts superposed (https://a.atmos.washington.edu/cgi-bin/list.cgi?fronts-ire, last access: 10 July 2024).
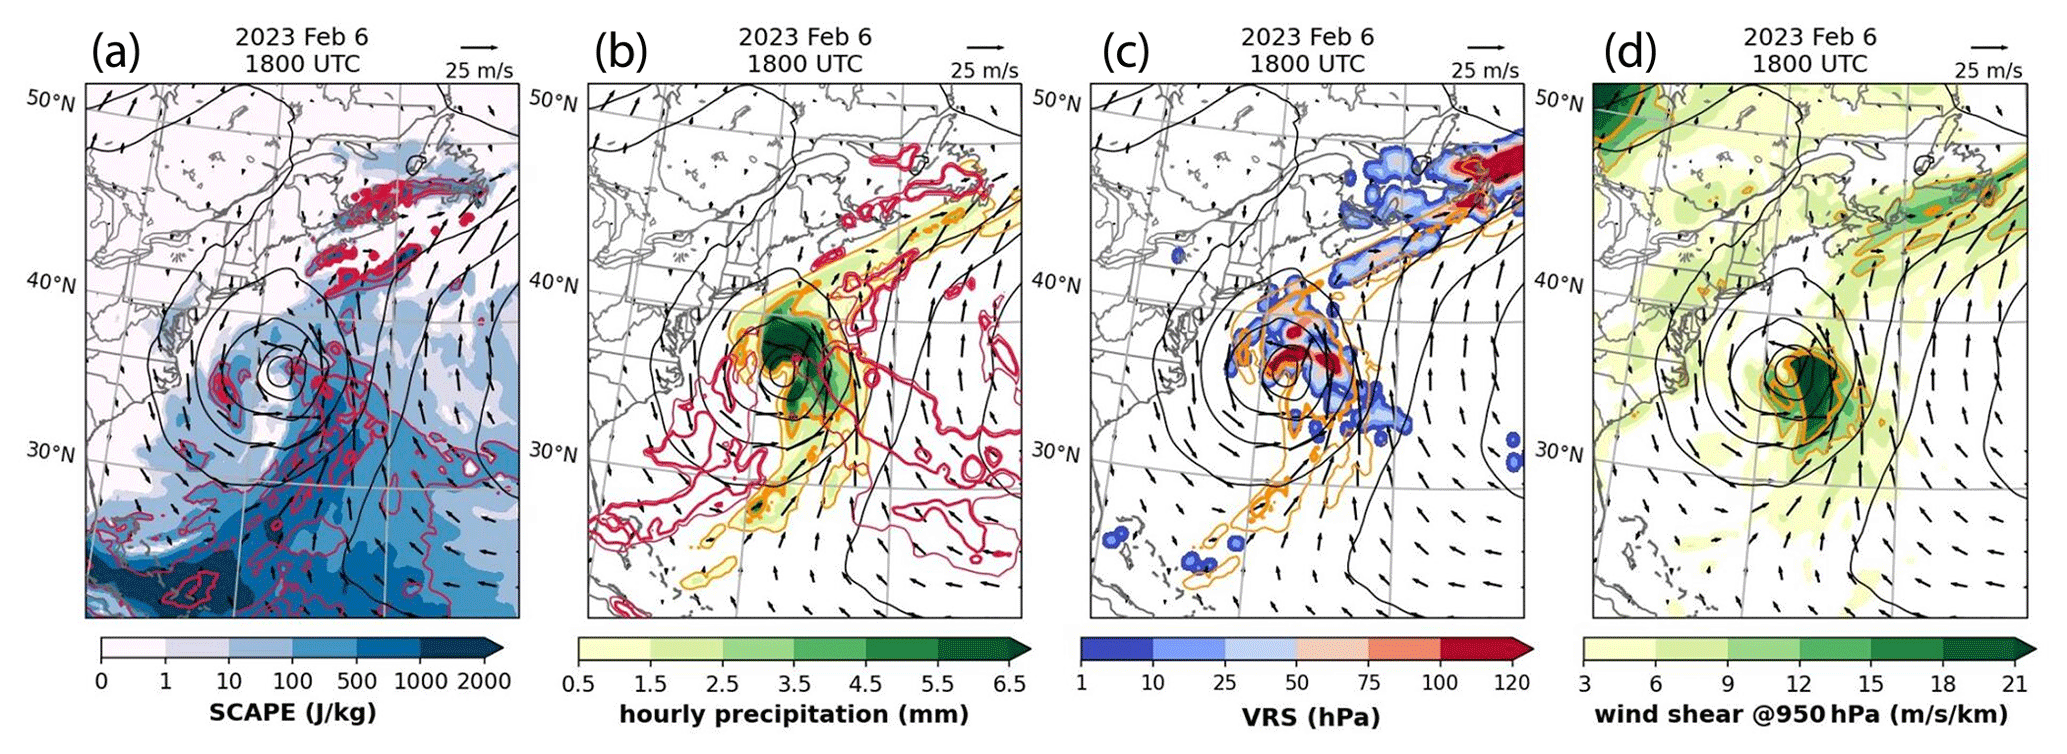
Figure 9The same as Fig. 1, but for the winter storm on 6 February 2023 at 18:00 UTC.
3.3 High-rate precipitation flash floods
High intensity storms producing flash floods are common to the continental United States (CONUS), particularly to the Mississippi River Basin (MRB), where there is also the highest average rainfall accumulation (Dougherty, 2020; Dougherty and Rasmussen, 2019, 2020). The previously published results of the SPE analysis of solar wind variables keyed to start days of heavy precipitation events leading to floods and flash floods have shown that such events tend to occur following arrivals of solar wind HSSs (Prikryl et al., 2018, 2021a, b; Prikryl and Rušin, 2023). This was also demonstrated, using the SPE analysis, in the case of flash flood events in MRB for a period of 1998–2019 obtained from the NOAA/NWS storm database records of flash flood reports using the SPE analysis (Prikryl et al., 2021b; their Fig. 3g–i).
In the present analysis that is extended to ±12 epoch days from the key time and uses the IMERG precipitation database, Fig. 10a (n=516; 1998–2019 NOAA/NWS storm database; Prikryl et al., 2021b), Fig. 10b (n=484; 2002–2013 MRB dataset; Dougherty, 2020), and Fig. 10c (n=584; CONUS dataset; Dougherty and Rasmussen, 2020) show the SPE analysis for different flash flood datasets. Similar to winter storms (Fig. 2) but for much larger number of events, the mean solar wind variables for all three cases in Fig. 10 show familiar patterns indicating that flash floods do not occur randomly relative to HSS/CIRs but tend to occur with the arrival of HSS/CIRs. As examples, we briefly discuss cases of flash floods on 19–22 May 2017, 1–2 May 2011, and 11–12 November 2020.
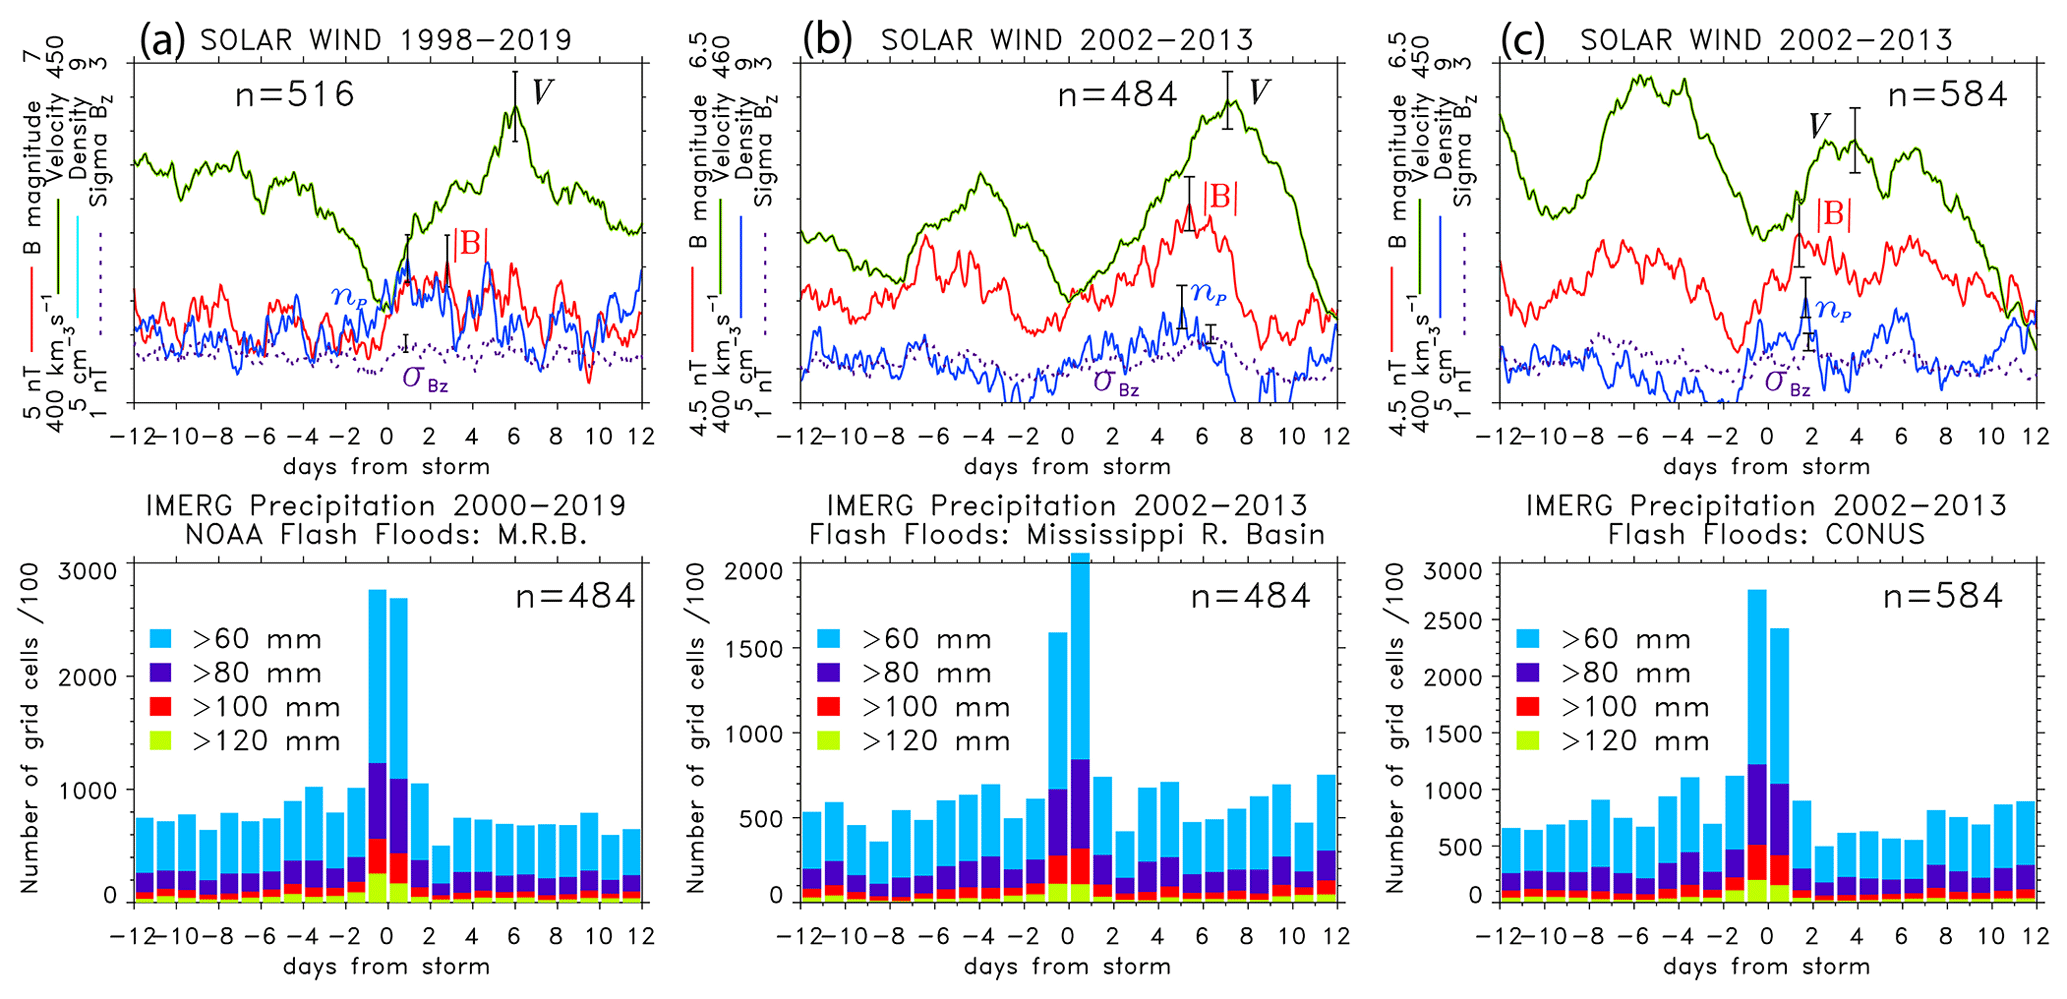
Figure 10SPE analysis of the time series of solar wind plasma variables keyed to start dates of flash flood events in the Mississippi River Basin (a) 1998–2019 (NOAA/NWS storm database; Prikryl et al., 2021b) and (b) 2002–2013 (Dougherty, 2020), and (c) over the continental United States (Dougherty and Rasmussen, 2020). The bottom panels show the cumulative number of IMERG grid cells with above-threshold daily precipitation rates.
Following the arrival of a strong HSS/CIR on 19 May 2017 (Fig. 11a) that triggered a minor geomagnetic storm (Fig. 11c) flash floods caused by extreme rainfall occurred in Indiana, Kentucky, and Tennessee (https://floodlist.com/america/usa/indiana-kentucky-tennessee-may-2017, last access: 10 July 2024). The maximum daily precipitation rate reached 500 mm (red dotted line in Fig. 11b). One week later, after exiting from the HSS, the Earth's magnetosphere was impacted by a strong ICME (Fig. 11a) causing a major geomagnetic storm. This was associated with high-rate precipitation that affected central and southern states on 28 and 29 May 2017. Top panels in Fig. 12 show high values of SCAPE in the frontal zones of the cyclone, a closer-to-one fs indicating the relative dominance of slantwise over upright convection, and high VRS values that are a strong indication that CSI was being released actively. High VRS match the high-rate precipitation that persisted for several hours. The high wind shears and low-level southerly winds opposing the equatorward propagating down-going AGWs are favorable conditions for over-reflection of AGWs.
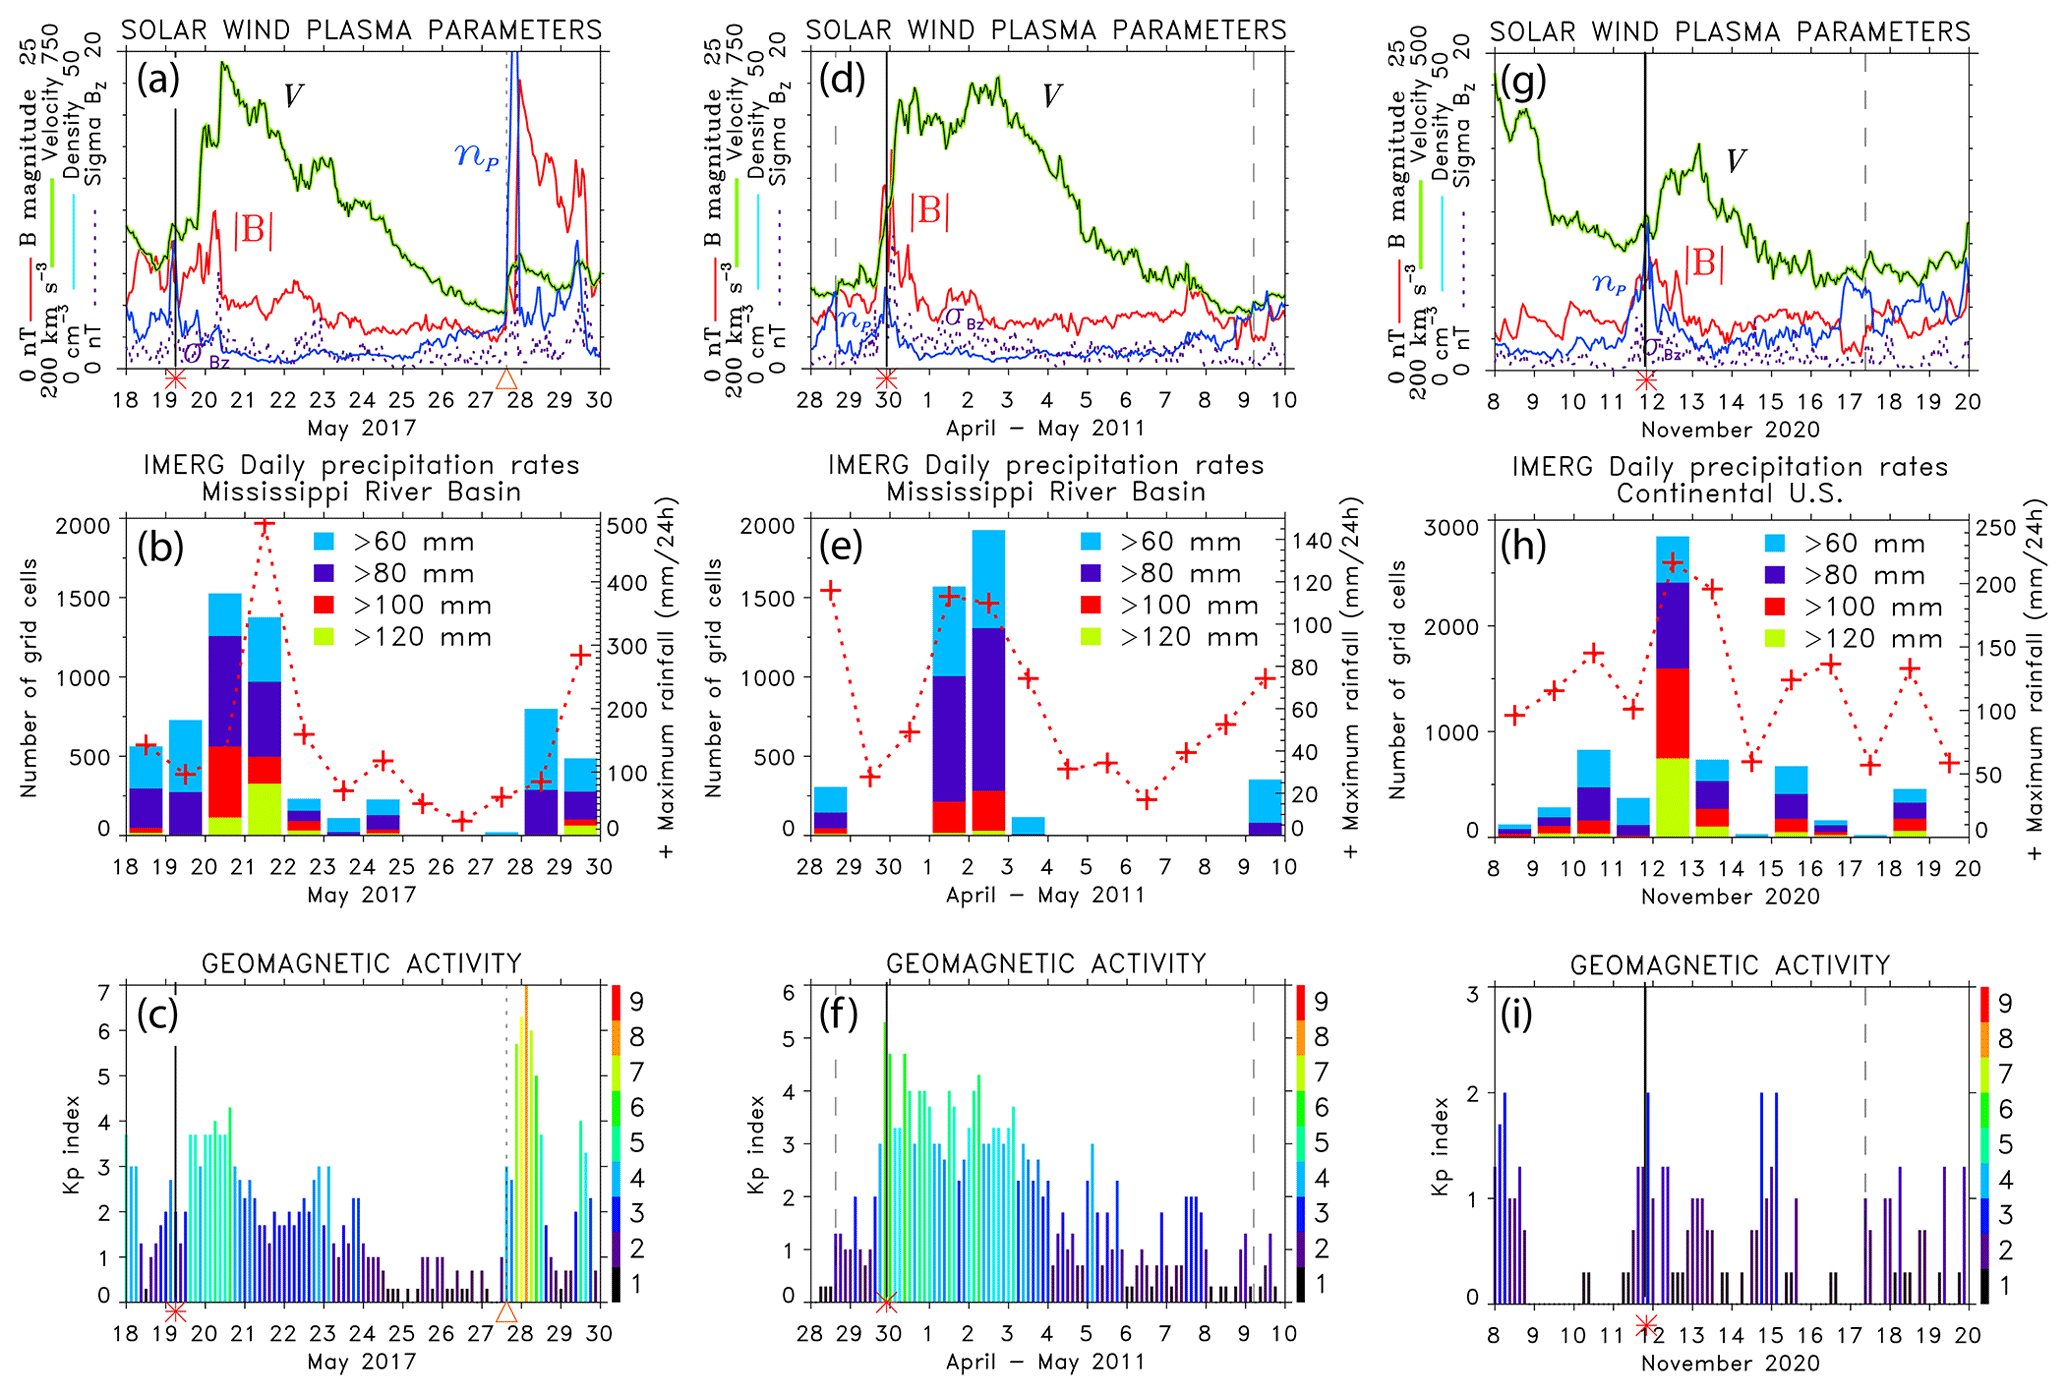
Figure 11(a, d, g) Solar wind plasma parameters, (b, e, i) the number of IMERG grid cells with daily rainfall exceeding given thresholds and the maximum daily precipitation (red crosses), and (c, f, i) geomagnetic activity Kp-index. Vertical lines mark CIR (solid), HCS (dashed) and ICME (dotted). HSS/CIRs and ICMEs are also marked by red asterisks and orange triangles, respectively.
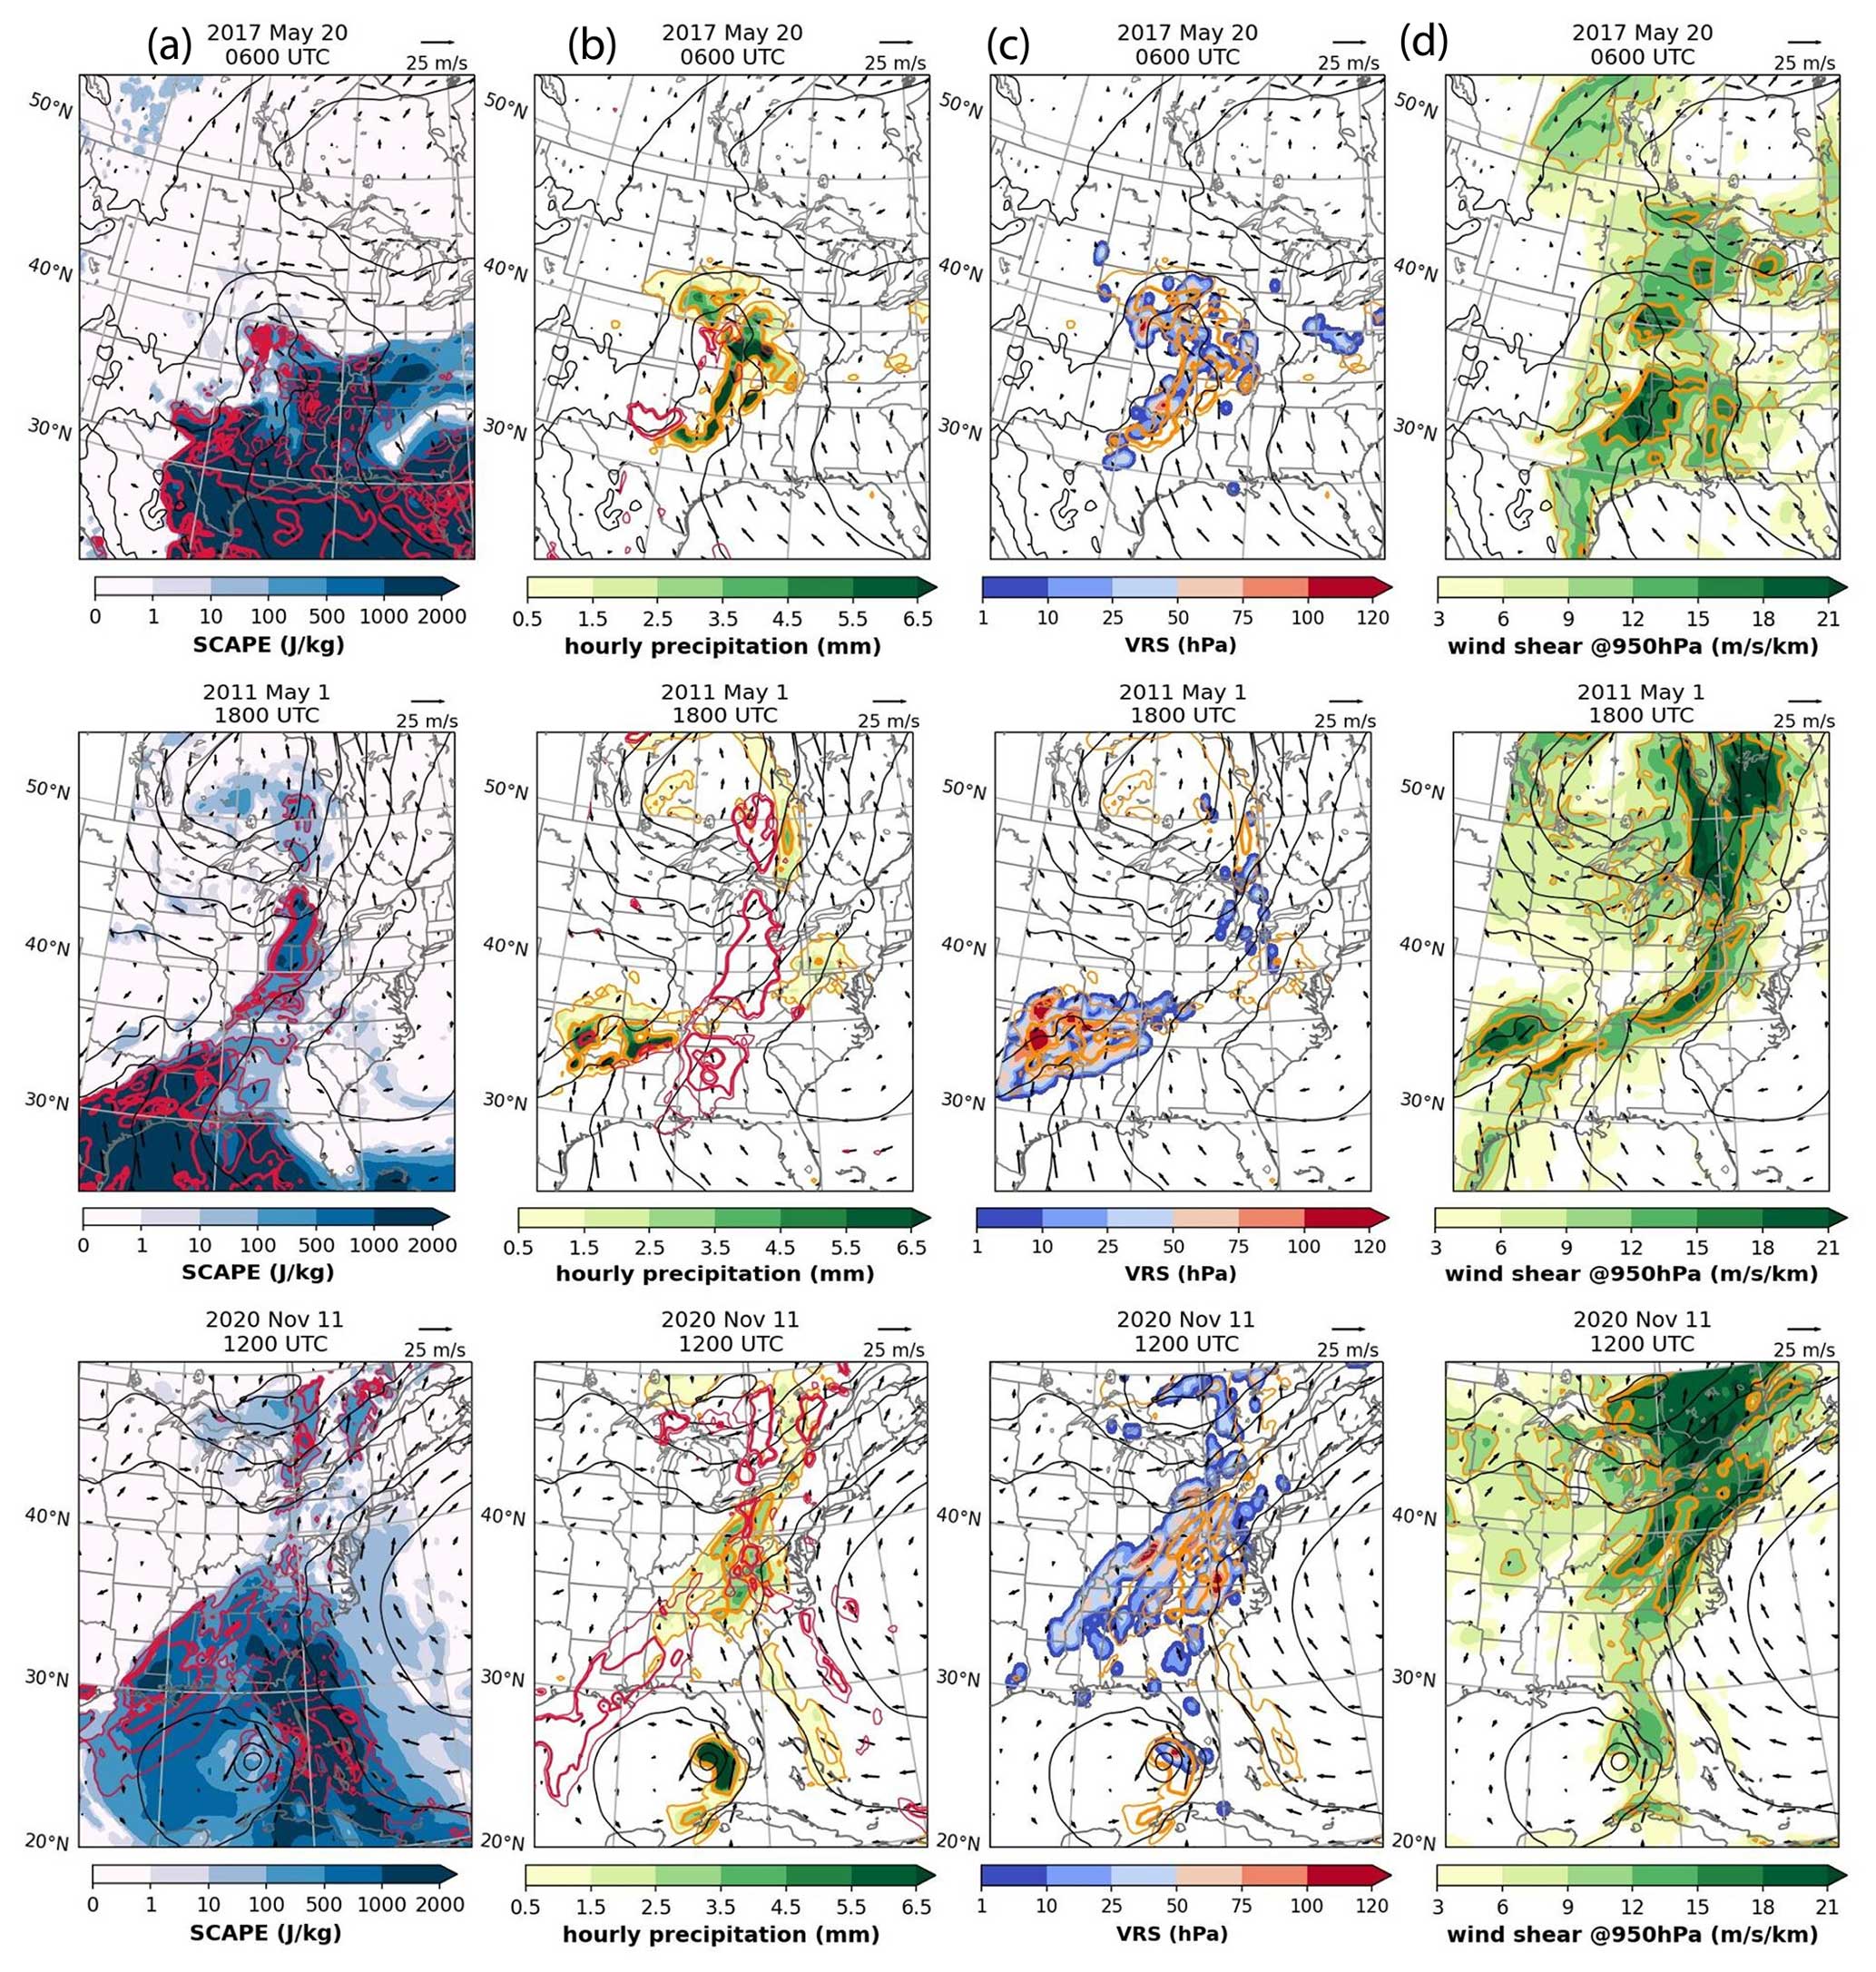
Figure 12The same as Fig. 1, but for flash floods on 20 May 2017 (top panels), 1 May 2011 (middle panels), and 11 November 2020 (bottom panels).
The GOES-13 infrared image (Fig. 13a) shows an intense convection in the frontal zones of a cyclone that formed on 19 May 2017. The cyclone maintained relatively constant central pressure just above 1000 hPa with only a mild deepening rate of 0.11 Bergeron (NAEC storm track #22481). However, the cyclone rapidly grew large with the central pressure moving north over Canada, while the intense convective activity in the South and over the Gulf continued for several days.

Figure 13The GOES-13 infrared images for flash floods on (a) 20 May 2017, (b) 1 May 2011, and (c) 11 November 2020 (https://www.ncdc.noaa.gov/gibbs/, last access: 10 July 2024).
Dougherty and Rasmussen (2020) examined a flash flood in the south-central United States that occurred from 1 May 07:00 UTC to 21:00 UTC on 2 May 2011. The intense convection causing the heavy precipitation developed in the tail of a cold front of a large cyclone with its central pressure over the Midwest and central Canada. In the context of solar wind, the flash flood occurred after the arrival of a strong HSS/CIR that caused a minor geomagnetic storm (Fig. 11e and f). The assessment of conditional symmetric instability and slantwise convection (Fig. 12; middle panels) indicates conditions that are favorable for over-reflection of down-going AGWs to contribute to CSI release.
Catastrophic flash floods across North Carolina that occurred on 11–12 November 2020 (https://floodlist.com/america/usa/north-carolina-floods-november-2020, last access: 10 July 2024) were closely associated with a HSS/CIR (Fig. 11g). Figure 13c shows the GOES-13 IR image of a mesoscale system displaying a string of convective cells extending over the western edge of North Carolina. Figure 11h shows the number of IMERG grid cells over the CONUS area with precipitation rates exceeding given thresholds and the maximum daily precipitation with a peak on 12 November. The assessment of CSI and slantwise convection (Fig. 12; bottom panels) show high values of SCAPE, VRS and precipitation rate derived from ERA5. In the same region low-level southerly winds and high wind shears are present.
It is noted that during this flash flood event there was also a tropical cyclone Eta that briefly re-intensified into a hurricane before landing in Florida. Figure 13b shows that the hurricane Eta produced heavy precipitation associated with high SCAPE, VRS, and low-level southerly winds and wind shears, which potentially can make a case for the AGWs contribution to CSI release. Prikryl et al. (2019) observed that rapid intensification of tropical cyclones often occurs following arrivals of HSS/CIR or ICMEs. They found that this is most likely for tropical cyclones displaying convective bursts (Prikryl et al., 2019; their Fig. 19).
In support of previously published results (Prikryl et al., 2018, 2021a, b; Prikryl and Rušin, 2023), the SPE analysis of solar wind variables keyed to start dates of severe snowstorms (Sect. 3.2) and flash floods (Sect. 3.3), shows a tendency of these weather events to occur following arrivals of HSS/CIRs. In a supplementary analysis for cases of winter storms and flash floods, high values of SCAPE are found in the warm and cold frontal zones with a closer-to-one fs indicating the relative dominance of slantwise over upright convection, which is an indication that CSI is being released resulting in slantwise convection and high-rate precipitation. In these regions, high wind shears and low-level southerly winds opposing the incoming AGWs are found. In the context of the solar wind–MIA coupling generating equatorward propagating AGWs, these are the conditions favorable for over-reflection of down-going AGWs potentially contributing to CSI release.
The cases of winter storms and flash floods investigated in this paper are associated with arrival of HSS/CIRs when large-amplitude solar wind Alfvén waves generate high-intensity auroral electrojet activity (Tsurutani and Gonzalez, 1987; Tsurutani et al., 1990, 1995). Auroral electrojets are known as sources of atmospheric AGWs (Chimonas and Hines, 1970) propagating globally in the neutral atmosphere (Richmond, 1978; Hunsucker, 1982), both upward and downward (Mayr et al., 1984a, b, 2013). The solar wind–MIA coupling generates aurorally excited AGWs that are observed in the ionosphere as travelling ionospheric disturbances (TIDs) using various techniques (e.g., Prikryl et al., 2022; and references therein). But ray tracing of AGWs (Prikryl et al., 2018; Prikryl and Rušin, 2023) can show that down-going AGWs can reach the troposphere, where they can contribute to the CSI release leading to slantwise convection and heavy precipitation.
Studies that are referenced in Introduction found that striated delta clouds, striated cloud heads, and strings of “back building” convection cells in cold fronts, tend to occur following arrivals of HSSs or ICMEs. As discussed in Sect. 3.2, aurorally generated AGWs could have played a role in the formation of the striated delta clouds (Fig. 4a and b) in Case 1 and 2, and striated cloud heads (Fig. 8) in Case 4. In Sect. 3.3, a string of “back building” mesoscale convective cells (Fig. 13c), could have also been triggered by equatorward propagating AGWs as previously suggested for other cases (Prikryl et al., 202la; Prikryl and Rušin, 2023). High values of SCAPE, VRS, precipitation rates, as well as low-level southerly winds and wind shears are found associated with these phenomena (Figs. 5, 6, 9, and 12), which are favorable conditions for down-going AGWs to over-reflected contribute to CSI release. The occurrence of striated delta clouds identified by Feren (1995), and several cases of cloud heads that were discussed by Dixon et al. (2002) and Browning and Wang (2002), are shown in the context of solar wind in the Supplementary material. All these cases were associated with arrivals of HSS/HCS/CIRs or ICMEs, when solar wind–MIA coupling generates large-amplitude globally propagating AGWs.
It is observed that severe winter storms in the northeast United States, and flash floods in the continental US and the Mississippi River Basin, tend to occur following arrivals of solar wind high-speed streams from coronal holes. This link points to solar wind–magnetosphere–ionosphere–atmosphere coupling, mediated by aurorally excited globally propagating atmospheric gravity waves that can reach the troposphere and influence the weather development. Assessment of slantwise convective available potential energy and the vertically integrated extent of realizable symmetric instability using the ERA5 reanalysis dataset indicates the likelihood of slantwise convection in frontal zones of extratropical cyclones. The results also show the presence of low-level southerly winds and high wind shears. These are the conditions favorable for over-reflection of down-going aurorally excited gravity waves, which can potentially contribute to conditional symmetric instability release, slantwise convection, cloud bands and high-rate precipitation. Aurorally generated gravity waves can also play a role in cases of striated delta clouds and cloud heads.
The solar wind data can be obtained from the NSSDC OMNIWeb http://omniweb.gsfc.nasa.gov (NASA, 2024; King and Papitashvili, 2005). The Modified Homogeneous Data Set of Coronal Intensities can be obtained at https://www.kozmos-online.sk/slnko/modifikovany-homogenny-rad-modified-homogeneous-data-set/ (KOZMOS-online.sk, 2024; Dorotovič et al., 2014).
The ERA5 reanalysis dataset https://doi.org/10.24381/cds.143582cf (Hersbach et al., 2017). The Integrated Multi-satellitE Retrievals for GPM (IMERG) Final Precipitation L3 1 d 0.1°×0.1° V06 (GPM_3IMERGDF) dataset (Huffman et al., 2019) is provided by the Goddard Earth Sciences Data and Information Services Center (https://doi.org/10.5067/GPM/IMERGDL/DAY/06).
The supplement related to this article is available online at: https://doi.org/10.5194/asr-21-1-2024-supplement.
The author has declared that there are no competing interests.
Publisher's note: Copernicus Publications remains neutral with regard to jurisdictional claims made in the text, published maps, institutional affiliations, or any other geographical representation in this paper. While Copernicus Publications makes every effort to include appropriate place names, the final responsibility lies with the authors.
This article is part of the special issue “EMS Annual Meeting: European Conference for Applied Meteorology and Climatology 2023”. It is a result of the EMS Annual Meeting: European Conference for Applied Meteorology and Climatology 2023, Bratislava, Slovakia, 3–8 September 2023.
The author would like to thank Ting-Chen Chen at the Institute of Meteorology and Climate Research, Karlsruhe Institute of Technology, for sharing the computer code for the analysis of conditional symmetric instability, and to Erin Dougherty at Department of Atmospheric Science, Colorado State University, for providing lists of MRB and CONUS flash floods. The IMERG dataset is provided by the Goddard Earth Sciences Data and Information Services Center. The reanalysis dataset ERA5 is a product of the European Centre for Medium-Range Weather Forecasts (ECMWF). The contributions by ACE, Geotail, IMP-8, SOHO, and Wind spacecraft teams; the NSSDC OMNIWeb; and the SuperDARN project are acknowledged.
This paper was edited by Dario Giaiotti and reviewed by two anonymous referees.
Bluestein, H. B. and Jain, M. H.: Formation of mesoscale lines of precipitation: Severe squall lines in Oklahoma during the spring, J. Atmos. Sci., 42, 1711–1732, https://doi.org/10.1175/1520-0469(1985)042<1711:FOMLOP>2.0.CO;2, 1985.
Browning, K. A. and Wang, C.-G.: Cloud-top striations above ana-cold frontal circulations, Q. J. Roy. Meteorol. Soc., 128, 477–489, https://doi.org/10.1256/003590002321042063, 2002.
Burlaga, L., Sittler, E., Mariani, F., and Schwenn, R.: Magnetic loop behind an interplanetary shock: Voyager, Helios, and IMP 8 observations, J. Geophys. Res., 86, 6673–6684, https://doi.org/10.1029/JA086iA08p06673, 1981.
Chen, T.-C., Yau, M. K., and Kirshbaum, D. J.: Assessment of conditional symmetric instability from global reanalysis data, J. Atmos. Sci., 75, 2425–2443, https://doi.org/10.1175/JAS-D-17-0221.1, 2018.
Chen, T.-C., Di Luca, A., Winger, K., Laprise, R., and Thériault, J. M.: Seasonality of continental extratropical-cyclone wind speeds over northeastern North America, Geophys. Res. Lett., 49, e2022GL098776, https://doi.org/10.1029/2022GL098776, 2022a.
Chen, T.-C., Di Luca, A., and Winger, K.: North America Extratropical Cyclone (NAEC) Catalogue, V3, Borealis, https://doi.org/10.5683/SP3/LH8OBV, 2022b.
Chernokulsky, A., Shikhov, A., Bykov, A., and Azhigov, I.: Satellite-Based Study and Numerical Forecasting of Two Tornado Outbreaks in the Ural Region in June 2017, Atmosphere, 11, 1146, https://doi.org/10.3390/atmos11111146, 2020.
Chimonas, G. and Hines, C. O.: Atmospheric gravity waves launched by auroral currents, Planet. Space Sci., 18, 565–582, https://doi.org/10.1016/0032-0633(70)90132-7, 1970.
Colle, B. A., Yeh, P., Finlon, J. A., McMurdie, L., McDonald, V., and DeLaFrance, A.: An Investigation of a Northeast U.S. Cyclone Event without Well-Defined Snow Banding during IMPACTS, Mon. Weather Rev., 151, 2465–2484, https://doi.org/10.1175/MWR-D-22-0296.1, 2023.
Cowling, D. H., Webb, H. D., and Yeh, K. C.: Group rays of internal gravity waves in a wind-stratified atmosphere, J. Geophys. Res., 76, 213–220, https://doi.org/10.1029/ja076i001p00213, 1971.
DeMaria, M., Franklin, J. L., Onderlinde, M. J., and Kaplan, J.: Operational Forecasting of Tropical Cyclone Rapid Intensification at the National Hurricane Center, Atmosphere, 12, 683, https://doi.org/10.3390/atmos12060683, 2021.
Dixon, R. S., Browning, K. A., and Shutts, G. J.: The mystery of striated cloud heads in satellite imagery, Atmos. Sci. Lett., 1, 1–13, https://doi.org/10.1006/asle.2000.0001, 2000.
Dixon, R. S., Browning, K. A., and Shutts, G. J.: The relation of moist symmetric instability and upper-level potential-vorticity anomalies to the observed evolution of cloud heads, Q. J. Roy. Meteorol. Soc., 128, 839–859, https://doi.org/10.1256/0035900021643719, 2002.
Dorotovič, I., Minarovjech, M., Lorenc, M., and Rybanský, M.: Modified homogeneous data set of coronal intensities, Sol. Phys., 289, 2697–2703, https://doi.org/10.1007/s11207-014-0501-2, 2014.
Dougherty, E.: Characteristics of current and future flood-producing storms in the continental United States, PhD thesis, Colorado State University, https://doi.org/10.5555/AAI28025598, 2020.
Dougherty, E. and Rasmussen, K. L.: Climatology of Flood-Producing Storms and Their Associated Rainfall Characteristics in the United States, Mon. Weather Rev., 147, 3861–3877,, https://doi.org/10.1175/MWR-D-19-0020.1, 2019.
Dougherty, E. and Rasmussen, K. L.: Changes in Future Flash Flood–Producing Storms in the United States, J. Hydrometeorol., 21, 2221–2236,, https://doi.org/10.1175/JHM-D-20-0014.1, 2020.
Dungey, J. W.: Interplanetary Magnetic Field and the Auroral Zones, Phys. Rev. Lett. 6, 47–48, https://doi.org/10.1103/PhysRevLett.6.47, 1961.
Dungey, J. W.: Origin of the concept of reconnection and its application to the magnetopause: A historical view, Physics of the Magnetopause, in: Geophysical Monograph 90, edited by: Song, P., Sonnerup, B. U. O., and Thomsen, M. F., AGU, Washington, D.C., 17–19, https://doi.org/10.1029/GM090p0017, 1995.
Eltayeb, I. A. and McKenzie, J. F.: Critical-level behaviour and wave amplification of a gravity wave incident upon a shear layer, J. Fluid Mech., 72, 661–671, https://doi.org/10.1017/S0022112075003217, 1975.
Feren, G.: The “striated delta” cloud system – a satellite imagery precursor to major cyclogenesis in the eastern Australian – western Tasman Sea region, Weather Forecast., 10, 286–309, 1995.
Ferraris, L., Rudari, R., and Siccardi, F.: The Uncertainty in the Prediction of Flash Floods in the Northern Mediterranean Environment, J. Hydrometeorol., 3, 714–727, 2002.
Gensini, V. A., Gold, D., Allen, J. T., and Barrett, B. S.: Extended U.S. tornado outbreak during late May 2019: A forecast of opportunity, Geophys. Res. Lett., 46, 10150–10158, https://doi.org/10.1029/2019GL084470, 2019.
Glinton, M., Gray, S. L., Chagnon, J. M., and Morcrette, C. J.: Modulation of precipitation by conditional symmetric instability release, Atmos. Res., 185, 186–201, https://doi.org/10.1016/j.atmosres.2016.10.013, 2017.
Gopalswamy, N.: History and development of coronal mass ejections as a key player in solar terrestrial relationship, Geosci. Lett., 3, 8, https://doi.org/10.1186/s40562-016-0039-2, 2016.
Gourley, J. J., Erlingis, J. M., Hong, Y., and Wells, E. B.: Evaluation of Tools Used for Monitoring and Forecasting Flash Floods in the United States, Weather Forecast., 27, 158–173, https://doi.org/10.1175/WAF-D-10-05043.1, 2012.
Greybush, S., Seibert, J., Zhang, Y., and Kumjian, M.: Assessing Practical Predictability of Winter Storms using NWP and Ensemble Data Assimilation, in: EMS Annual Meeting 2023, 4–8 September 2023, Bratislava, Slovakia, EMS2023-565, https://doi.org/10.5194/ems2023-565, 2023.
Greybush, S. J., Saslo, S., and Grumm, R.: Assessing the Ensemble Predictability of Precipitation Forecasts for the January 2015 and 2016 East Coast Winter Storms, Weather Forecast., 32, 1057–1078,, https://doi.org/10.1175/WAF-D-16-0153.1, 2017.
Gyakum, J. R., Carrera, M., Zhang, D.-L., Miller, S., Caveen, J., Benoit, R., Black, T., Buzzi, A., Chouinard, C., Fantini, M., Folloni, C., Katzfey, J. J., Kuo, Y.-H., Lalaurette, F., Low-Nam, S., Mailhot, J., Malguzzi, P., McGregor, J. L., Nakamura, M., Tripoli, G., and Wilson, C.: A regional model intercomparison using a case of explosive oceanic cyclogenesis, Weather Forecast., 11, 521–543, 1996.
Hagiwara, M. and Tanaka, H. L.: A theoretical analysis of the atmospheric gravity wave that connects the thermosphere and the troposphere, Tsukuba Geoenviron. Sci., 16, 1–14, https://doi.org/10.15068/00162379, 2020.
Hersbach, H., Bell, B., Berrisford, P., Hirahara, S., Horányi, A., Muñoz‐Sabater, J., Nicolas, J., Peubey, C., Radu, R., Schepers, D., Simmons, A., Soci, C., Abdalla, S., Abellan, X., Balsamo, G., Bechtold, P., Biavati, G., Bidlot, J., Bonavita, M., De Chiara, G., Dahlgren, P., Dee, D., Diamantakis, M., Dragani, R., Flemming, J., Forbes, R., Fuentes, M., Geer, A., Haimberger, L., Healy, S., Hogan, R.J., Hólm, E., Janisková, M., Keeley, S., Laloyaux, P., Lopez, P., Lupu, C., Radnoti, G., de Rosnay, P., Rozum, I., Vamborg, F., Villaume, S., and Thépaut, J.-N.: Complete ERA5 from 1940: Fifth generation of ECMWF atmospheric reanalyses of the global climate, Copernicus Climate Change Service (C3S) Data Store (CDS) [data set], https://doi.org/10.24381/cds.143582cf, 2017.
Hersbach, H., Bell, B., Berrisford, P., Hirahara, S., Horányi, A., Muñoz-Sabater, J., Nicolas, J., Peubey, C., Radu, R., Schepers, D., Simmons, A., Soci, C., Abdalla, S., Abellan, X., Balsamo, G., Bechtold, P., Biavati, G., Bidlot, J., Bonavita, M., De Chiara, G., Dahlgren, P., Dee, D., Diamantakis, M., Dragani, R., Flemming, J., Forbes, R., Fuentes, M., Geer, A., Haimberger, L., Healy, S., Hogan, R. J., Hólm, E., Janisková, M., Keeley, S., Laloyaux, P., Lopez, P., Lupu, C., Radnoti, G., de Rosnay, P., Rozum, I., Vamborg, F., Villaume, S., and Thépaut, J.-N.: The ERA5 global reanalysis, Q. J. Roy. Meteorol. Soc., 146, 1999–2049, https://doi.org/10.1002/qj.3803, 2020.
Hines, C. O.: Internal atmospheric gravity waves at ionospheric heights, Can. J. Phys., 38, 1441–1481, https://doi.org/10.1139/p60-150, 1960.
Hoeksema, J. T., Wilcox, J. M., and Scherrer, P. H.: The structure of the heliospheric current sheet: 1978–1982, J. Geophys. Res., 88, 9910–9918, 1983.
Huang, J., Liu, Y. C.-M., Klecker, B., and Chen, Y.: Coincidence of heliospheric current sheet and stream interface: implications for the origin and evolution of the solar wind, J. Geophys. Res.-Space, 121, 19–29, https://doi.org/10.1002/2015JA021729, 2016a.
Huang, J., Y. Liu, C.-M., Qi, Z., Klecker, B., Marghitu, O., Galvin, A. B., Farrugia, C. J., and Li, X.: A multievent study of the coincidence of heliospheric current sheet and stream interface, J. Geophys. Res.-Space, 121, 10768–10782, https://doi.org/10.1002/2016JA022842, 2016b.
Huffman, G. J., Stocker, E. F., Bolvin, D. T., Nelkin, E. J., and Tan, J.: GPM IMERG final precipitation L3 1 day 0.1 degree × 0.1 degree V06, Goddard Earth Sciences Data and Information Services Center [data set], https://doi.org/10.5067/GPM/IMERGDL/DAY/06, 2019.
Hunsucker, R. D.: Atmospheric gravity waves generated in the high-latitude ionosphere: A review, Rev. Geophys., 20, 293–315, https://doi.org/10.1029/RG020i002p00293, 1982.
Jones, W. L.: Reflexion and stability of waves in stably stratified fluids with shear flow: A numerical study, J. Fluid Mech., 34, 609–624, https://doi.org/10.1017/S0022112068002119, 1968.
King, J. H. and Papitashvili, N.: Solar wind spatial scales in and comparisons of hourly Wind and ACE plasma and magnetic field data, J. Geophys. Res., 110, A02104, https://doi.org/10.1029/2004JA010649, 2005.
Knapp, K. R.: Scientific data stewardship of international satellite cloud climatology project B1 global geostationary observations, J. Appl. Remote Sens., 2, 023548, https://doi.org/10.1117/1.3043461, 2008.
Kocin, P. J. and Uccellini, L. W.: A snowfall impact scale derived from northeast storm snowfall distributions, B. Am. Meteorol. Soc., 85, 177–194, 2004a.
Kocin, P. J. and Uccellini, L. W.: Northeast Snowstorms, in: Volume II: The Cases, Meteor. Monogr. No. 54, American Meteorological Society, ISBN 9781878220646, 2004b.
KOZMOS-online.sk: Modified Homogeneous Data Set, https://www.kozmos-online.sk/slnko/modifikovany-homogenny-rad-modified-homogeneous-data-set/ (last access: 10 July 2024), 2024.
Krieger, A. S., Timothy, A. F., and Roelof, E. C.: A coronal hole and its identification as the source of a high velocity solar wind stream, Sol. Phys., 29, 505–525, https://doi.org/10.1007/BF00150828, 1973.
Kuwano-Yoshida, A. and Enomoto, T.: Predictability of Explosive Cyclogenesis over the Northwestern Pacific Region Using Ensemble Reanalysis, Mon. Weather Rev., 141, 3769–3785,, https://doi.org/10.1175/MWR-D-12-00161.1, 2013.
Lim, E.-P. and Simmonds, I.: Explosive cyclone development in the southern hemisphere and a comparison with northern hemisphere events, Mon. Weather Rev., 130, 2188–2209, https://doi.org/10.1175/1520-0493(2002)130<2188:ECDITS>2.0.CO;2, 2002.
Lu, D., Ding, R., Zhong, Q., Mao, J., Zou, Q., and Li, J.: A rapid intensification warning index for tropical cyclones based on the analog method, Geophys. Res. Lett., 50, e2022GL101951, https://doi.org/10.1029/2022GL101951, 2023.
Mayr, H. G., Harris, I., Varosi, F., and Herrero, F. A.: Global excitation of wave phenomena in a dissipative multiconstituent medium 1. Transfer function of the Earth's thermosphere, J. Geophys. Res., 89, 10929–10959, https://doi.org/10.1029/JA089iA12p10929, 1984a.
Mayr, H. G., Harris, I., Varosi, F., and Herrero, F. A.: Global excitation of wave phenomena in a dissipative multiconstituent medium 2. Impulsive perturbations in the Earth's thermosphere, J. Geophys. Res., 89, 10961–10986, https://doi.org/10.1029/JA089iA12p10961, 1984b.
Mayr, H. G., Talaat, E. R., and Wolven, B. C.: Global propagation of gravity waves generated with the whole atmosphere transfer function model, J. Atmos. Sol.-Terr. Phy., 104, 7–17, https://doi.org/10.1016/j.jastp.2013.08.001, 2013.
McKenzie, J. F.: Reflection and amplification of acoustic-gravity waves at a density and velocity discontinuity, J. Geophys. Res., 77, 2915–2926, https://doi.org/10.1029/ja077i016p02915, 1972.
Mercer, A. and Bates, A.: Meteorological Differences Characterizing Tornado Outbreak Forecasts of Varying Quality, Atmosphere, 10, 16, https://doi.org/10.3390/atmos10010016, 2019.
Miller, D. E., Wang, Z., Trapp, R. J., and Harnos, D. S.: Hybrid prediction of weekly tornado activity out to Week 3: Utilizing weather regimes, Geophys. Res. Lett., 47, e2020GL087253, https://doi.org/10.1029/2020GL087253, 2020.
NASA: OMNIWeb Plus, NASA [data set], http://omniweb.gsfc.nasa.gov (last access: 10 July 2024), 2024.
Prikryl P. and Rušin V.: Occurrence of heavy precipitation influenced by solar wind high-speed streams through vertical atmospheric coupling, Front. Astron. Space Sci., 10, https://doi.org/10.3389/fspas.2023.1196231, 2023.
Prikryl, P., Muldrew, D. B., Sofko, G. J., and Ruohoniemi, J. M.: Solar wind Alfvén waves: A source of pulsed ionospheric convection and atmospheric gravity waves, Ann. Geophys., 23, 401–417, https://doi.org/10.5194/angeo-23-401-2005, 2005.
Prikryl, P., Rušin, V., and Rybanský, M.: The influence of solar wind on extratropical cyclones – Part 1: Wilcox effect revisited, Ann. Geophys., 27, 1–30, https://doi.org/10.5194/angeo-27-1-2009, 2009a.
Prikryl, P., Muldrew, D. B., and Sofko, G. J.: The influence of solar wind on extratropical cyclones – Part 2: A link mediated by auroral atmospheric gravity waves?, Ann. Geophys., 27, 31–57, https://doi.org/10.5194/angeo-27-31-2009, 2009b.
Prikryl, P., Iwao, K., Muldrew, D. B., Rušin, V., Rybanský, M., and Bruntz, R.: A link between high-speed solar wind streams and explosive extratropical cyclones, J. Atmos. Sol.-Terr. Phy., 149, 219–231, https://doi.org/10.1016/j.jastp.2016.04.002, 2016.
Prikryl, P., Bruntz, R., Tsukijihara, T., Iwao, K., Muldrew, D. B., Rušin, V., Rybanský, M., Turňa, M., and Šťastný, P.: Tropospheric weather influenced by solar wind through atmospheric vertical coupling downward control, J. Atmos. Sol.-Terr. Phy., 171, 94–110, https://doi.org/10.1016/j.jastp.2017.07.023, 2018.
Prikryl, P., Nikitina, L., and Rušin, V.: Rapid intensification of tropical cyclones in the context of the solar wind-magnetosphere-ionosphere-atmosphere coupling, J. Atmos. Sol.-Terr. Phy., 183, 36–60, https://doi.org/10.1016/j.jastp.2018.12.009, 2019.
Prikryl, P., Rušin, V., Prikryl, E. A., Šťastný, P., Turňa, M., and Zeleňáková, M.: Heavy rainfall, floods, and flash floods influenced by high-speed solar wind coupling to the magnetosphere–ionosphere–atmosphere system, Ann. Geophys., 39, 769–793, https://doi.org/10.5194/angeo-39-769-2021, 2021a.
Prikryl, P., Rušin, V., and Prikryl, E. A.: High-Rate Precipitation Occurrence Modulated by Solar Wind High-Speed Stream, Atmosphere, 12, 1186, https://doi.org/10.3390/atmos12091186, 2021b.
Prikryl, P., Gillies, R. G., Themens, D. R., Weygand, J. M., Thomas, E. G., and Chakraborty, S.: Multi-instrument observations of polar cap patches and traveling ionospheric disturbances generated by solar wind Alfvén waves coupling to the dayside magnetosphere, Ann. Geophys., 40, 619—639, https://doi.org/10.5194/angeo-40-619-2022, 2022.
Richmond, A. D.: Gravity wave generation, propagation, and dissipation in the thermosphere, J. Geophys. Res., 83, 4131–4145, https://doi.org/10.1029/JA083iA09p04131, 1978.
Rozoff, C. M. and Kossin, J. P.: New Probabilistic Forecast Models for the Prediction of Tropical Cyclone Rapid Intensification, Weather Forecast., 26, 677–689, https://doi.org/10.1175/WAF-D-10-05059.1, 2011.
Rybanský, M.: Coronal index of solar activity, Bull. Astron. Inst. Czechoslov., 28, 367–370, 1975.
Rybanský, M., Rušin, V., and Minarovijech, M.: Coronal index of solar activity, Space Sci. Rev., 95, 227–234, 2001.
Rybanský, M., Rušin, V., Minarovjech, M., Klocok, L., and Cliver, E. W.: Reexamination of the coronal index of solar activity, J. Geophys. Res.-Space, 110, A08106, https://doi.org/10.1029/2005JA011146, 2005.
Sanders, F. and Gyakum, J. R.: Synoptic-dynamic Climatology of the “bomb”, Mon. Weather Rev., 108, 1589–1606, https://doi.org/10.1175/1520-0493(1980)108<1589:SDCOT>2.0.CO;2, 1980.
Sanders, F.: Skill of NMC operational dynamical models in prediction of explosive cyclogenesis, Weather Forecast., 2, 322–336, 1987.
Schultz, D. M. and Schumacher, P. N.: The use and misuse of conditional symmetric instability, Mon. Weather Rev., 127, 2709–2732, 1999.
Schultz, D. M., Bosart, L. F., Colle, B. A., Davies, H. C., Dearden, C., Keyser, D., Martius, O., Roebber, P. J., Steenburgh, W. J., Volkert, H., and Winters, A. C.: Extratropical Cyclones: A Century of Research on Meteorology's Centerpiece, Meteorol. Monogr., 59, 16.1–16.56,, https://doi.org/10.1175/AMSMONOGRAPHS-D-18-0015.1. 2019.
Smith, E. J. and Wolfe, J. H.: Observations of interaction regions and corotating shocks between one and five AU: Pioneers 10 and 11, Geophys. Res. Lett., 3, 137–140, https://doi.org/10.1029/GL003i003p00137, 1976.
Smith, E. J., Tsurutani, B. T., and Rosenberg, R. L.: Observations of the interplanetary sector structure up to heliographic latitudes of 16: Pioneer 11, J. Geophys. Res., 83, 717–724, 1978.
Squires, M. F., Lawrimore, J. H., Heim Jr., R. R., Robinson, D. A., Gerbush, M. R., and Estilow, T. W.: The regional snowfall index, B. Am. Meteorol. Soc., 95, 1835–1848, https://doi.org/10.1175/BAMS-D-13-00101.1, 2014.
Svalgaard, L.: On the use of Godhavn H component as an indicator of the interplanetary sector polarity, J. Geophys. Res., 80, 2717– 2722, https://doi.org/10.1029/JA080i019p02717, 1975.
Terti, G., Ruin, I., Gourley, J. J., Kirstetter, P., Flamig, Z., Blanchet, J., Arthur, A., and Anquetin, S.: Toward Probabilistic Prediction of Flash Flood Human Impacts, Risk Anal., 39, 140–161, https://doi.org/10.1111/risa.12921, 2019.
Tsurutani, B. T. and Gonzalez, W. D.: The cause of high-intensity long-duration continuous AE activity (HILDCAAs): Interplanetary Alfvén wave trains, Planet. Space Sci., 35, 405–412, https://doi.org/10.1016/0032-0633(87)90097-3, 1987.
Tsurutani, B. T., Gould, T., Goldstein, B. E., Gonzalez, W. D., and Sugiura, M.: Interplanetary Alfvén waves and auroral (substorm) activity: Imp 8, J. Geophys. Res., 95, 2241–2252, https://doi.org/10.1029/ja095ia03p02241, 1990.
Tsurutani, B. T., Gonzalez, W. D., Gonzalez, A. L. C., Tang, F., Arballo, J. K., and Okada, M.: Interplanetary origin of geomagnetic activity in the declining phase of the solar cycle, J. Geophys. Res.-Space, 100, 21717–21733, https://doi.org/10.1029/95ja01476, 1995.
Tsurutani, B. T., Gonzalez, W. D., Gonzalez, A. L. C., Guarnieri, F. L., Gopalswamy, N., Grande, M., Kamide, Y., Kasahara, Y., Lu, G., Mann, I., McPherron, R., Soraas, F., and Vasyliunas, V.:: Corotating solar wind streams and recurrent geomagnetic activity: A review, J. Geophys. Res., 111, A07S01, https://doi.org/10.1029/2005JA011273, 2006.
Tsurutani, B. T., Hajra, R., Tanimori, T., Takada, A., Remya, B., Mannucci, A. J., Lakhina, G. S., Kozyra, J. U., Shiokawa, K., Lee, L. C., Echer, E., Reddy, R. V., and Gonzalez, W. D.: Heliospheric plasma sheet (HPS) impingement onto the magnetosphere as a cause of relativistic electron dropouts (REDs) via coherent EMIC wave scattering with possible consequences for climate change mechanisms, J. Geophys. Res.-Space, 121, 10130–10156, https://doi.org/10.1002/2016JA022499, 2016.
Tsurutani, B. T., Lakhina, G. S., Sen, A., Hellinger, P., Glassmeier, K.-H., and Mannucci, A. J.: A review of Alfvénic turbulence in high-speed solar wind streams: Hints from cometary plasma turbulence, J. Geophys. Res.-Space, 123, 2458–2492, https://doi.org/10.1002/2017JA024203, 2018.
Varcie, M. M., Zaremba, T. J., Rauber, R. M, McFarquhar, G. M., Finlon, J. A., McMurdie, L. A., Ryzhkov, A., Schnaiter, M., Järvinen, E., Waitz, F., Delene, D. J., Poellot, M. R., McLinden, M. L. W., and Janiszeski, A.: Precipitation Growth Processes in the Comma-Head Region of the 7 February 2020 Northeast Snowstorm: Results from IMPACTS, J. Atmos. Sci., 80, 3–29, https://doi.org/10.1175/JAS-D-22-0118.1, 2023.
- Abstract
- Introduction
- Data and methods
- Assessment of conditional symmetric instability and slantwise convection in frontal zones of extratropical cyclones
- Discussion
- Conclusions
- Data availability
- Competing interests
- Disclaimer
- Special issue statement
- Acknowledgements
- Review statement
- References
- Supplement