Climate Change Scenarios for the Basque Country: wind, humidity and radiation
Maialen Martija-Díez
Roberto Hernández
José Daniel Gómez de Segura
Santiago Gaztelumendi
UrbanKlima2050 is up to the date the most ambitious initiative led by the Basque Country to ensure the resilience of the territory through a multi-level governance and climate action on the ground. Within the UrbanKlima2050 project, and in order to assess the evolution of climate-related variables, future projections for wind, relative humidity and solar radiation were performed for the Basque Country. Starting from the scenario projections (RCP4.5 and RCP8.5) developed by the EURO-CORDEX community, bias adjusted data are obtained. Results show a downward trend for the wind under the RCP8.5 scenario and in the late future (2071–2100) a decrease of about 4 % is projected with respect to the historical period (1980–2009). In the RCP4.5 scenario, in general, a smoother decrease appears but is still significant. The relative humidity shows a decrease overall, with the largest values in the south, but for the late future an increase is detected in the coast, especially for the RCP4.5 scenario. The solar radiation displays a generalized increase for future projections, with an increase close to 4 % for the RCP8.5 scenario, yet under the RCP4.5 scenario the tendency does not show a significant signal. These results are of interest to perform the full implementation of the Basque Climate Change Strategy 2050.
- Article
(1186 KB) - Full-text XML
- BibTeX
- EndNote
Climate change has already caused, and will continue to do so, several global effects; however, consequences differ between regions and thus, climate information at a regional scale is of great importance to properly assess climate change impacts and its risks (Doblas-Reyes et al., 2021). The Basque Country is a highly populated (more than two million citizens) small region in the northern part of the Iberian Peninsula, located to the west of the Pyrenees and limited by the sea to the north, with an area of more than 7000 km2 (Fig. 1). The territory presents a mountainous orography, with mountains higher than 1500 m no more than 30 km afar from the sea. In this context, the UrbanKlima2050 LIFE (L'instrument Financier pour l'Environnement) project (Urban Klima 2050) aims to contribute to develop a low-carbon and climate change resilient region by 2050, and therefore to fully implement the Basque Climate Change Strategy 2050. This large-scale Life Integrated Project was launched at the end of 2019 by a partnership of 20 organizations (Gaztelumendi et al., 2022).
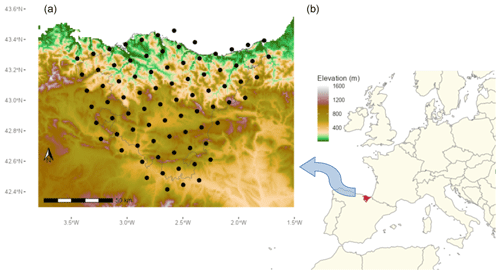
Figure 1Basque Country. (a) The EURO-CORDEX grid points used for the study. (b) Location of the Basque Country.
To assess climate change impacts and future climate conditions in a small region such as the Basque Country, regional climate projections are needed. In this framework, the European CORDEX (EURO-CORDEX) initiative (Jacob et al., 2014, 2020), by downscaling global climate models (GCMs) from the 5th Coupled Model Intercomparison Project (CMIP5, Taylor et al., 2012), offers a set of historical and scenario projections, RCP 4.5 and RCP 8.5, with a high resolution, at 0.11° grid spacing (∼ 12.5 km). Based on EURO-CORDEX outputs, and within a former project named as Klimatek 2016, regional projections of up to ∼ 1 km resolution were developed for the Basque Country (Climate scenarios in Euskadi and data series (https://www.ihobe.eus, last access: 4 December 2024)), kilometre-scale simulations have shown to be more accurate reproducing the precipitation and are useful at regional scales (Ban et al., 2021). Historical and projected scenarios at such a high resolution were performed for temperature and precipitation, and their associated climate indices. Hence, on a first approach, only these two basic climate variables were considered. In a following phase, within the framework of the Life UrbanKlima2050 project, which includes an extension of the climate risk analysis in the Basque Country focusing on an expansion and improvement of the high-resolution regional climate scenarios, solar radiation, near-surface wind speed and relative humidity have been included. In this manuscript the results for the EURO-CORDEX grid (0.11°) are shown and future works will show the results and techniques used to reproduce these results on a ∼ 1 km grid.
Understanding the variability of near-surface wind, the relative humidity and the solar radiation are key to several socio-economic sectors, for instance, near-surface wind and humidity are essential to crop growth (Cleugh et al., 1998; Zhang et al., 2017), as well as evaporation processes (McVicar et al., 2012). Relative humidity, alongside with extreme heat, is also a determinant factor on health risks (Mora et al., 2017; Brouillet and Joussaume, 2019). Furthermore, wind and solar radiation have a direct impact on renewable energy generation (Van Der Wiel et al., 2019) and in the past years there is growing evidence of climate change impact on both energy industries (Sailor et al., 2008; Pryor and Barthelmie, 2010; Tobin et al., 2018; Bartók et al., 2019; Pryor et al., 2020). Since 1980, most European regions have shown a decrease in wind speed (Rojas-Labanda et al., 2023). Likewise, future projections of wind energy potential display a reduction in wind energy resource for southern Europe (Hueging et al., 2013; Carvalho et al., 2017). With respect to the solar radiation, projections of surface solar radiation show significant differences between global and regional climate models, and regional models present some difficulties to reproduce past trends (Bartók et al., 2017); for the future, RCP8.5 scenarios reveal a significant decrease in photovoltaic energy production around the globe, while a positive trend is identified in large parts of Europe (Wild et al., 2015). On the contrary, other studies show a reduction on the projected solar photovoltaics generation in Europe, with very small changes for the southern European countries (Tobin et al., 2018). In contrast, relative humidity has remained approximately constant despite global warming (Willett et al., 2007), yet for future scenarios, the greater the projected warming by climate models, the larger the decrease in relative humidity (Fischer and Knutti, 2013).
This paper explores the future projections of near-surface wind, relative humidity, and solar radiation for the Basque Country. The paper is organized as follows, Sect. 2 summarize data and methods, Sect. 3 analyses the differences between models' historical projections and observations for the wind, relative humidity and solar radiation, Sect. 4 describes future projections results and validations, and Sects. 5 and 6 correspond to the conclusions and appendices, respectively.
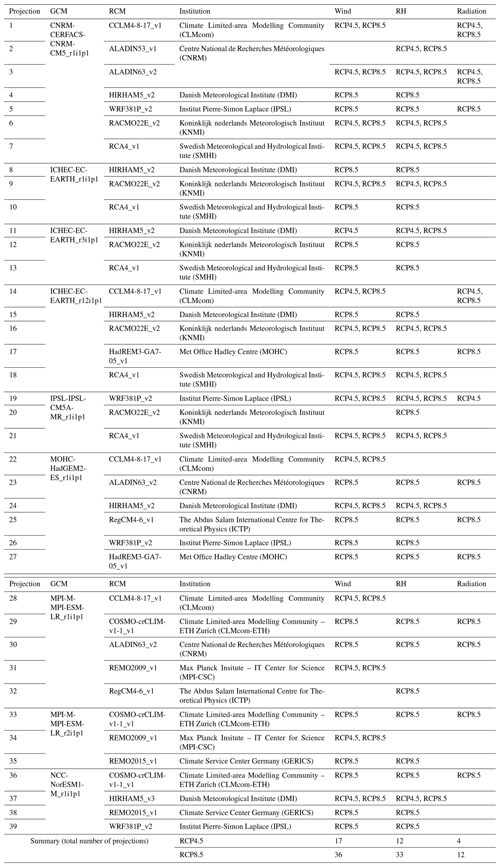
Observed daily high-resolution gridded data for mean wind speed, relative humidity and radiation comes from E-OBS version 26.0e dataset (Cornes et al., 2018; de Baar et al., 2023a, b), with 0.1° × 0.1° latitude-longitude resolution over the Basque Country (42–44° N, 3.5–1.5° W, Fig. 1). The mean wind series starts in 1980 and the relative humidity and radiation series in 1950. In the case of model simulations, CORDEX regional climate models (RCMs) for the European domain (EURO-CORDEX climate projections, Jacob et al., 2014, 2020) are used over the Basque Country, with 0.11° × 0.11° horizontal resolution. These simulations are driven by different global climate models (GCMs, Taylor et al., 2012) within climate model intercomparison project phase 5 (CMIP5). Model simulations cover the period up to 2100, including various IPCC-AR5 scenarios starting in 2006. In this study, RCP8.5 and RCP4.5 are used (Appendix Table A1).
First, a comparison is made between the historical periods of the models and the observational data in order to analyse whether biases are detected. The selected period is 1980–2009, because the mean wind data starts in 1980. The last 4 years (2006–2009) include anthropogenic forcing, but it is sufficiently small and similar in all the scenarios that it can be neglected. For each point of the EURO-CORDEX grid over the Basque Country, the mean of all model simulations is calculated. Then, the differences between this mean and the observational data for each day in the historical period are computed. Finally, these differences are shown for each grid point by calculating the temporal mean for the 30-year period, and for each year by calculating the spatial mean of all grid points, in order to obtain a temporal comparison through a representative value for the whole territory. Secondly, to correct the existing differences between the historical periods of the models with respect to the observations, a bias adjustment is applied. To carry out this process, the Quantile Delta Mapping method is applied (Panofsky et al., 1958; Ballarin et al., 2023). This technique consists of making comparisons and applying corrections to the series taking into account the differences in the corresponding percentiles. In this study 101 quantiles are used to categorize the series. It is applied to each of the projections (Costoya et al., 2020), and then the mean of all of them is calculated. In this way, the individual bias of each model is minimized (Jacob et al., 2014). We considered the observed period of 1980–2009 to correct the future projections: 2011–2040 near future, 2041–2070 middle future and 2071–2100 late future.
Through the whole study, to evaluate the statistical significance of differences between models' historical period and observational data, and between models' historical period and future projections, a Student's t test at 99 % confidence level is computed. To calculate the statistical significance trends in future projections we use a Fisher's F-test.
In this section the biases between historical periods of the models and the observations are presented for each of the analysed variables. It should be noted that these differences are calculated with the multi-model average in the historical period, as an intended consequence, relevant behaviours of each independent model as well as extreme or outliers could be hidden.
3.1 Mean wind
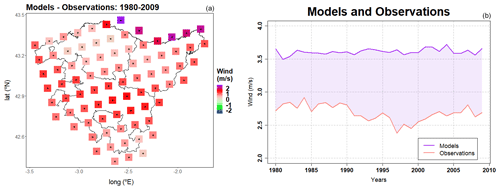
In order to make a better interpretation of the comparison between the observations and the mean of the climate projections, the differences for each grid point are computed (Fig. 2, left). This map shows how the model overestimates the observations throughout the Basque Country. The areas where the statistically significant differences are greater correspond to the north-coast and in the central region, where the values reach 2.6 m s−1. Likewise, the time series of the observations and the mean of the climate projections for the mean of all the grid points over the Basque Country are also represented (Fig. 2, right). Again, it can be seen how the model mean systematically overestimates the observations.
3.2 Relative humidity
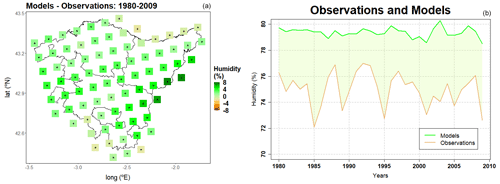
Parallel to the comparison for the mean wind speed, the differences between the climate projections and the observations are calculated for relative humidity. The values of the climate projections in most regions overestimate the observations (Fig. 3, left). The highest statistically significant differences appear in the easternmost part of the Basque Country, where they are close to 8 %. However, in certain regions of south and the north-coast, the model underestimates the value of the observations, although at some grid points they are not statistically significant. This could be due to the lower spatial resolution of the model grid with respect to observational data, which makes the model worse at representing the geographic features, such as the sea in the north and the Ebro river in the south. In the case of temporal evolution of the mean over the Basque Country (Fig. 3, right), the annual values are always higher in the model.
3.3 Radiation
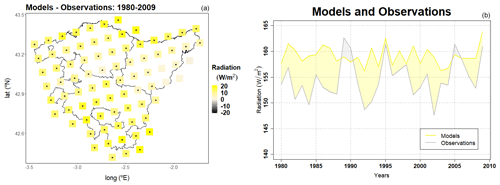
Figure 4 shows the differences between the observations and the model in the chosen historical period (1980–2009) for radiation. In the spatial analysis (Fig. 4, left), it is presented how the model overestimates the observational values at all grid points, reaching the maximum value of 20 W m−2 in the south and the north-coast. The smallest differences appear in the east, where they are practically null, it can therefore be concluded that the climate projections adequately reproduce the average radiation in those areas. However, in the analysis of the temporal evolution (Fig. 4, right), overall, the model mean overestimates the value of observational radiation.
As shown in the previous section, climate projections of wind, relative humidity and radiation overestimate the observations in the Basque Country in most of the cases. In order to correct these differences, a bias adjustment is applied, using the Quantile Delta Mapping method (Panofsky et al., 1958; Ballarin et al., 2023). Available data from the climate models and for the three variables analysed, are described in Table A1. This table includes the GCM, RCM and RCP information for each simulation. In total, 36(17) RCMs are used for mean wind analysis in RCP8.5(RCP4.5) scenario, 33(12) RCMs for relative humidity and 12(4) RCMs for radiation.
4.1 Mean wind
After applying the bias adjustment to each of the simulations (28 for RCP8.5 and 15 for RCP4.5), the average of all of them in each 30-year period of the future (2011–2040, 2041–2070 and 2071–2100) is calculated. Then, the differences of future projections in each grid point over the Basque country with respect to the historical period (1980–2009) are computed (Fig. 5).
For the RCP8.5 scenario (Fig. 5, top), the results show, in general, a decrease in mean wind intensity in the future, in agreement with previous studies (Hueging et al., 2013; Carvalho et al., 2017). This decrease presents a statistically significant maximum of 0.10 m s−1, which implies a reduction of 3 %–4 % with respect to the values of the historical period. It should be noted, the slight increase shown in the south-east of the Basque Country in the near future (2011–2040) and mainly in the middle future (2041–2070). In any case, the maximum value in the near future is less than 0.01 m s−1, and in the middle future, it is around 0.02 m s−1 (less than 0.5 % and 1 % respectively), and these differences are not statistically significant with respect to the historical period. Moreover, in this area, in the late future, the behaviour is the opposite (in general, also not significant), and the mean wind intensity decreases in the last decades of the 21st century. In the RCP4.5 scenarios (Fig. 5, bottom), the increase in the mean wind intensity in the south-easternmost region of the Basque Country is more intense and propagates into the late future (2071–2100). This increase reaches 0.01 m s−1 in the near and late future and is maximum in the middle future with 0.02 m s−1, being in any case less than 1 %, and not significant with respect to the historical period. The decrease in mean wind intensity shown for the north of the Basque Country is less than that calculated for RCP8.5 scenario and reaches 0.05 m s−1 in the late future (1.5 %–2.5 %) but is still significant.

Figure 5Mean wind. Differences between model projections and the historical period (1980–2009). (a–c) RCP8.5 for (a) near future, (b) middle future and (c) late future. The dotted grid points indicate statistically significant areas, according to a t test at the 99 % level of confidence. (d–f) The same as (a)–(c) but for RCP4.5.
To show an average result for the analysed area (Basque Country) the spatial mean is calculated for all the grid points considered over the region, and annual evolution is plotted (Fig. 6). In this case, a slight decrease appears in both scenarios. For RCP4.5, this decrease is smoother but significant and reaches 0.044 m s−1 at the 2100. The RCP8.5 scenario shows a significant decrease of 0.059 m s−1 by the end of the XXI century.
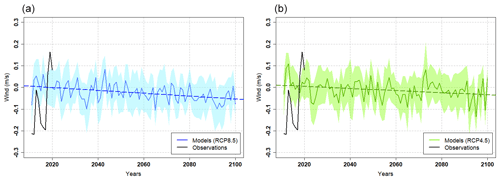
Figure 6Mean wind. (a) Differences between model projections and the historical period (1980–2009) in RCP8.5 (blue) scenario, and differences between observations (black) in the period (2011–2020) and the historical period, for spatial mean over the Basque Country. Shaded area indicates the standard deviation of the model projections. Dashed line for linear regression of the model, which shows a significant trend at the 99 % confidence level. (b) The same as (a) but for RCP4.5 (green) scenario.
4.2 Relative humidity
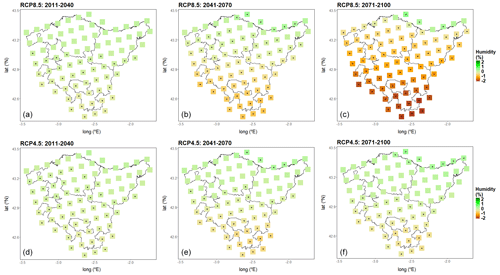
As aforementioned, for the relative humidity bias adjustment analysis we use 26 models for RCP8.5 scenario and 11 for the RCP4.5. The average is computed in the 3 30-year periods in the future (2011–2040, 2041–2070 and 2071–2100). For each grid point over the Basque Country and the differences with respect to historical period (1980–2009) are plotted (Fig. 7).
Relative humidity, in general, tends to decrease in future projections in most of the Basque Country (Fig. 7). The maximum decrease appears for the south in the last decades of the 21st century and slightly exceeds 2 % in the RCP8.5 scenario, being smaller (0.5 %) in the RCP4.5 scenario, but still statistically significant. Nevertheless, an exception appears in the north coast, where the relative humidity tends to increase. This increase is smoother and does not reach 1 % in the late future for RCP8.5 scenario, but it is significant with respect to the historical period. However, it should be noted that in RCP4.5 scenario, this significant increase extends to the whole points in the north-east coast in the last decades, while in the RCP8.5 scenario some areas are not significant.
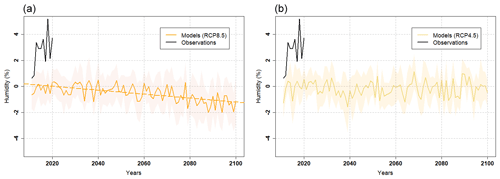
For the spatial average of all the grid points over the Basque Country, an annual significative decrease is found for RCP8.5 (Fig. 8). This decrease reaches 1.4 % by the end of the 21st century. Nevertheless, in the RCP4.5 scenario the humidity evolution does not present a significative signal, probably because the opposite behaviour detected in the north and south of the region offset the global signal. In any case, this result agrees with other studies that show that the simulations with a greater warming present larger decrease in the relative humidity in the future (Fischer and Knutti, 2013).
4.3 Radiation
In the case of radiation, the number of model simulations is smaller than for the mean wind and relative humidity. After eliminating the simulations with gaps and/or error, we use a total of 7 projections for RCP8.5 scenario and 4 for RCP4.5 scenario.
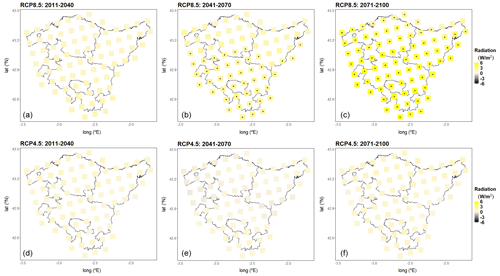
Following the same methodology as in the other variables, we compute the average for each grid point in the Basque Country, in the 30-year periods in the future (2011–2040, 2041–2070 and 2071–2100) and then we show the differences with respect to the historical period (1980–2009). The results of future projections (Fig. 9) show a general increase in radiation in the coming decades, intensifying especially in the late future. In the last 30 years of this century, the statistically significant increases are close to 6 W m−2 (3.5 %–4 %) for the RCP8.5 scenario, being more moderate (and not significant) for RCP4.5 scenario (less than 1 %). Nevertheless, it is worth mentioning that the different behaviour can be observed in the middle future (2041–2070, Fig. 9, bottom-middle). In this case, it is in the west and in the east where radiation tends to decrease. In any case, this reduction is quite slight, not significant and reaches a maximum of 0.27 W m−2 (less than 0.2 %).
Analysing the annual signal for the average of all the grid points in the Basque Country (Fig. 10) the evolution shows an upward and significant behaviour which reaches 5.4 W m−2 by the end of the 21st century in the RCP8.5 scenario, in agreement with previous studies for Europe (Wild et al., 2015). However, in the RCP4.5 scenario, the model simulations do not show a significant signal for radiation in the present century.
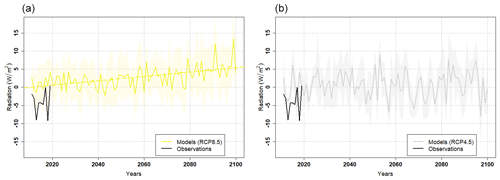
Figure 10Radiation. The same as Fig. 6. In the case of RCP4.5, the linear regression is absent because does not show a significant trend.
In Figs. 6, 8 and 10 the observational data for mean wind, relative humidity and radiation between 2011 and 2020 compared to the model mean projection and deviation are shown. It should be noted that the 2020 observational data for the radiation is absent. It is because in this year significant gaps appear between the months of May and September, which means that, being the months with the highest radiation, the annual mean has an unusually low value, which is unreliable. Over this 10-year period, the average of the mean wind appears to follow the model trend, with higher variability as expected. However, in the case of relative humidity, the model mean seems to underestimate the observational data, while in the case of radiation, the model mean seems to overestimate the observations. Nevertheless, this 10-year period is not very long and any variability could be related to natural climate variability and should not be interpreted as a real trend that is sustained over time (Deser et al., 2012).
This study analyses future projections for the less-explored variables of mean wind speed, relative humidity and radiation in the Basque Country, a region in the north of the Iberian Peninsula (Fig. 1). First, the EURO-CORDEX simulations for future scenarios and the historical period (1980–2011) are analysed and possible differences with respect to the observations are calculated. Second, a bias adjustment is applied, following the Quantile Delta Mapping methodology. Finally, the bias adjusted projections for the Basque Country are evaluated and several conclusions on the future trend of mean wind speed, relative humidity and radiation are obtained.
The mean wind speed presents a decrease in the coming decades in the RCP8.5 scenario, in which in the late future (2071–2100) the decrease reaches the 4 %. In the RCP4.5 scenario, in general, a smoother decrease appears but is still significant. This conclusion agrees with previous studies (Hueging et al., 2013; Carvalho et al., 2017). Analysing the evolution in different decades, in middle future (2041–2070) an increase appears in the south of the Basque Country in both analysed scenarios. This increase of the mean wind speed is also shown for the last decades of the century in the RCP4.5 scenario, but in any case it is not statistically significant with respect to the historical period.
For the relative humidity, the outcomes show a general decrease in the future projections for the large part of the Basque Country. This decrease is statistically significant in the RCP8.5 scenario, in agreement with previous studies for Iberian Peninsula and southern Europe (Ruosteenoja and Räisänen, 2013; Scoccimarro et al., 2017). The maximum increase appears in the south were exceeds the 2 % in the late future (2071–2100). Nevertheless, in the north coast of the studied area, the signal is the opposite and significant in the middle and late future (2041–2070 and 2071–2100). Especially in the RCP4.5 scenario, the region with a significant increase in relative humidity extends to the whole north-east coast. Therefore, in the north coast of the Basque Country the relative humidity could rise from mid-century onwards.
For the radiation analysis, the model projections show a general increase in the coming decades, intensifying especially in the late future (2071–2100). In the last 30 years of this century, the increase is around 3.5 %–4 % in the RCP8.5 scenario (Wild et al., 2015). However, in the RCP4.5 scenario the model simulations do not show a clear signal for radiation in the present century. Focusing on the spatial differences, it is worth noting the behaviour showed in the middle future (2041–2070) in the RCP4.5 scenario. In this period, the radiation presents a slight decrease in several areas in the east and in the west of the Basque Country, but this decrease is not statistically significant with respect to the historical period.
Finally, in the comparison between model mean projection and observational data in 2011–2020 (Figs. 6, 8 and 10), the average of the mean wind appears to follow the model trend, but in the case of relative humidity, the model mean seems to underestimate the observational data, and in the case of radiation, the model mean seems to overestimate the observations. Nevertheless, this 10-year period is not very long and any variability could be related to natural climate variability and should not be interpreted as a real trend that is sustained over time (Deser et al., 2012).
The importance of this study lies in mean wind speed, relative humidity and solar radiation impact into several socio-economic sectors. Apart from crop growth, evaporation processes and health risks, wind and solar radiation have a direct impact on renewable energy generation (Van Der Wiel et al., 2019). In the framework of the Life UrbanKlima2050 project, regional projections of up to ∼ 1 km resolution are been developed for mean wind speed, relative humidity and radiation, and will be included in the climate data explorer, where temperature and precipitation are already available (Climate scenarios in Euskadi and data series (https://www.ihobe.eus, last access: 4 December 2024)). Future analysis could focus on analysing whether higher-resolution projections reproduce more accurately these variables at regional scales, as previous studies have found for precipitation (Ban et al., 2021).
The code is not public available due to company policy.
The E-OBS data set for observed daily high-resolution gridded data is available at https://surfobs.climate.copernicus.eu/dataaccess/access_eobs.php (E-OBS, 2022). EURO-CORDEX climate projections and the results of this research are available at http://escenariosklima.ihobe.eus/ (ihobe, 2024).
MMD developed the methodology, conducted the study, and drafted most of the paper. RH contributed to the methodology and paper writing. JDGdS and SG promoted the study, provided additional information, and contributed to and reviewed the paper.
The contact author has declared that none of the authors has any competing interests.
Publisher’s note: Copernicus Publications remains neutral with regard to jurisdictional claims made in the text, published maps, institutional affiliations, or any other geographical representation in this paper. While Copernicus Publications makes every effort to include appropriate place names, the final responsibility lies with the authors.
This article is part of the special issue “EMS Annual Meeting: European Conference for Applied Meteorology and Climatology 2023”. It is a result of the EMS Annual Meeting: European Conference for Applied Meteorology and Climatology 2023, Bratislava, Slovakia, 3–8 September 2023.
Our gratitude to the Basque Government for maintaining and supporting research and operational services in the hydro-ocean-meteo-climatic field, essential for the Basque community, and particularly to the Department of Security and the Directorate of Emergencies and Meteorology (DAEM) for their support to Euskalmet. Similarly, we extend our appreciation to our colleagues from DAEM, IHOBE (Basque environmental agency), and the Basque Research and Technology Alliance (BRTA) for their efforts in promoting valuable research and services for the Basque Society. We acknowledge the E-OBS dataset from the EU-FP6 project UERRA (http://www.uerra.eu, last access: 1 October 2022) and the Copernicus Climate Change Service, and the data providers in the ECA&D project (https://www.ecad.eu, last access: 1 October 2022). We acknowledge the World Climate Research Programme's Working Group on Regional Climate, and the Working Group on Coupled Modelling, former coordinating body of CORDEX and responsible panel for CMIP5. We also thank the climate modelling groups (listed in Table A1 of this paper) for producing and making available their model output. We also acknowledge the Earth System Grid Federation infrastructure an international effort led by the U.S. Department of Energy's Program for Climate Model Diagnosis and Intercomparison, the European Network for Earth System Modelling and other partners in the Global Organisation for Earth System Science Portals (GO-ESSP).
This study has received partial financial support from DAEM and IHOBE within the framework of the Urban Klima 2050 project. The UK2050 project has received funding from the LIFE program of the European Union (grant no. LIFE 18 IPC 000001).
This paper was edited by Andreas Fischer and reviewed by two anonymous referees.
Ballarin, A. S., Sone, J. S., Gesualdo, G. C., Schwamback, D., Reis, A., Almagro, A., and Wendland, E. C.: CLIMBra-Climate Change Dataset for Brazil, Scientific Data, 10, 47, https://doi.org/10.1038/s41597-023-01956-z, 2023.
Ban, N., Caillaud, C., Coppola, E., Pichelli, E., Sobolowski, S., Adinolfi, M., Ahrens, B., Alias, A., Anders, I., Bastin, S., Belušić, D., Berthou, S., Brisson, E., Cardoso, R. M., Chan, S. C., Christensen, O. B., Fernández, J., Fita, L., Frisius, T., Gašparac, G., Giorgi, F., Goergen, K., Haugen, J.E., Hodnebrog, Ø., Kartsios, S., Katragkou, E., Kendon, E. J., Keuler, K., Lavin-Gullon, A., Lenderink, G., Leutwyler, D., Lorenz, T., Maraun, D., Mercogliano, P., Milovac, J., Panitz, H. J., Raffa, M., Remedio, A. R., Schär, C., Soares, P. M. M., Srnec, L., Steensen, B. M., Stocchi, P., Tölle, M. H., Truhetz, H., Vergara-Temprado, J., de Vries, H., Warrach-Sagi, K., Wulfmeyer, V., and Zander, M. J.: The first multi-model ensemble of regional climate simulations at kilometer-scale resolution, part I: evaluation of precipitation, Clim. Dynam., 57, 275–302, https://doi.org/10.1007/s00382-021-05708-w, 2021.
Bartók, B., Wild, M., Folini, D., Lüthi, D., Kotlarski, S., Schär, C., Vautard, R., Jerez, S., and Imecs, Z.: Projected changes in surface solar radiation in CMIP5 global climate models and in EURO-CORDEX regional climate models for Europe, Clim. Dynam., 49, 2665–2683, https://doi.org/10.1007/s00382-016-3471-2, 2017.
Bartók, B., Tobin, I., Vautard, R., Vrac, M., Jin, X., Levavasseur, G., Denvil, S., Dubus, L., Parey, S., Michelangeli, P. A., Troccoli, A., and Saint-Drenan, Y. M.: A climate projection dataset tailored for the European energy sector, Clim. Serv., 16, 100138, https://doi.org/10.1016/j.cliser.2019.100138, 2019.
Brouillet, A. and Joussaume, S.: Investigating the Role of the Relative Humidity in the Co-Occurrence of Temperature and Heat Stress Extremes in CMIP5 Projections, Geophys. Res. Lett., 46, 11435–11443, https://doi.org/10.1029/2019GL084156, 2019.
Carvalho, D., Rocha, A., Gómez-Gesteira, M., and Silva Santos, C.: Potential impacts of climate change on European wind energy resource under the CMIP5 future climate projections, Renew. Energ., 101, 29–40, https://doi.org/10.1016/j.renene.2016.08.036, 2017.
Cleugh, H. A., Miller, J. M., and Böhm, M.: Direct mechanical effects of wind on crops, Agroforest. Syst., 41, 85–112, 1998.
Cornes, R. C., van der Schrier, G., van den Besselaar, E. J. M., and Jones, P. D.: An Ensemble Version of the E-OBS Temperature and Precipitation Data Sets, J. Geophys. Res.-Atmos., 123, 9391–9409, https://doi.org/10.1029/2017JD028200, 2018.
Costoya, X., Rocha, A., and Carvalho, D.: Using bias-correction to improve future projections of offshore wind energy resource: A case study on the Iberian Peninsula, Appl. Energ., 262, 114562, https://doi.org/10.1016/j.apenergy.2020.114562, 2020.
de Baar, J. H., van der Schrier, G., van den Besselaar, E. J., Garcia-Marti, I., and de Valk, C.: A new E-OBS gridded dataset for daily mean wind speed over Europe, Int. J. Climatol., 43, 6083–6100, https://doi.org/10.1002/joc.8191, 2023a.
de Baar, J. H. S., Nhat Luu, L., van der Schrier, G., van den Besselaar, E. J. M., and Garcia-Marti, I.: Recent improvements in the E-OBS gridded data set for daily mean wind speed over Europe in the period 1980–2021, Adv. Sci. Res., 20, 91–95, https://doi.org/10.5194/asr-20-91-2023, 2023b.
Deser, C., Knutti, R., Solomon, S., and Phillips, A. S.: Communication of the role of natural variability in future North American climate, Nat. Clim. Change, 2, 775–779, https://doi.org/10.1038/nclimate1562, 2012.
Doblas-Reyes, F. J., Sörensson, A. A., Almazroui, M., Dosio, A., Gutowski, W., Haarsma, R., Hamdi, B., Hewitson, W.-T., Kwon, B. L., Lamptey, D., Maraun, T. S., Stephenson, I., Takayabu, L., Terray, A., Turner, A., and Zuo, Z.: Linking Global to Regional Climate Change, in: Climate Change 2021: The Physical Science Basis. Contribution of Working Group I to the Sixth Assessment Report of the Intergovernmental Panel on Climate Change, Cambridge University Press, Cambridge, United Kingdom and New York, NY, USA, 1363–1512, https://doi.org/10.1017/9781009157896.012, 2021.
E-OBS: E-OBS dataset, E-OBS [data set], https://surfobs.climate.copernicus.eu/dataaccess/access_eobs.php (last access: 1 October 2022), 2022.
Fischer, E. M. and Knutti, R.: Robust projections of combined humidity and temperature extremes, Nat. Clim. Change, 3, 126–130, https://doi.org/10.1038/nclimate1682, 2013.
Gaztelumendi, S., Gomez de Segura, J. D., Hernandez, R., Martija-DIez, M., and Aranda, J. A.: Climate change monitoring and atmospheric indices in Basque Country: experiences from URBANKLIMA2050 LIFE project., EMS Annual Meeting 2022, Bonn, Germany, 5–9 Sep 2022, EMS2022-596, https://doi.org/10.5194/ems2022-596, 2022.
Hueging, H., Haas, R., Born, K., Jacob, D., and Pinto, J. G.: Regional changes in wind energy potential over Europe using regional climate model ensemble projections, J. Appl. Meteorol. Clim., 52, 903–917, https://doi.org/10.1175/JAMC-D-12-086.1, 2013.
ihobe: Escenarios climáticos en Euskadi y series de datos, http://escenariosklima.ihobe.eus (last access: 12 December 2024), 2024.
Jacob, D., Petersen, J., Eggert, B., Alias, A., Christensen, O. B., Bouwer, L. M., Braun, A., Colette, A., Déqué, M., Georgievski, G., Georgopoulou, E., Gobiet, A., Menut, L., Nikulin, G., Haensler, A., Hempelmann, N., Jones, C., Keuler, K., Kovats, S., Kröner, N., Kotlarski, S., Kriegsmann, A., Martin, E., van Meijgaard, E., Moseley, C., Pfeifer, S., Preuschmann, S., Radermacher, C., Radtke, K., Rechid, D., Rounsevell, M., Samuelsson, P., Somot, S., Soussana, J. F., Teichmann, C., Valentini, R., Vautard, R., Weber, B., and Yiou, P.: EURO-CORDEX: New high-resolution climate change projections for European impact research, Reg. Environ. Change, 14, 563–578, https://doi.org/10.1007/s10113-013-0499-2, 2014.
Jacob, D., Teichmann, C., Sobolowski, S., Katragkou, E., Anders, I., Belda. M., Benestad, R., Boberg, F., Buonomo, E., Cardoso, R. M., Casanueva, A., Christensen, O. B., Christensen, J. H., Coppola, E., De Cruz, L., Davin, E. L., Dobler, A., Domínguez, M., Fealy, R., Fernandez, J., Gaertner, M. A., García-Díez, M., Giorgi, F., Gobiet, A., Goergen, K., Gómez-Navarro, J. J., González-Alemán, J. J., Gutiérrez, C., Gutiérrez, J. M., Güttler, I., Haensler, A., Halenka, T., Jerez, S., Jiménez-Guerrero, P., Jones, R. G., Keuler, K., Kjellström, E., Knist, S., Kotlarski, S., Maraun, D., van Meijgaard, E., Mercogliano, P., Montávez, J. P., Navarra, A., Nikulin, G., de Noblet-Ducoudré, N., Panitz, H. J., Pfeifer, S., Piazza, M., Pichelli, E., Pietikäinen, J. P., Prein, A. F., Preuschmann, S., Rechid, D., Rockel, B., Romera, R., Sánchez, E., Sieck, K., Soares, P. M. M., Somot, S., Srnec, L., Sørland, S. L., Termonia, P., Truhetz, H., Vautard, R., Warrach-Sagi, K., and Wulfmeyer, V.: Regional climate downscaling over Europe: perspectives from the EURO-CORDEX community, Reg. Environ. Change, 20, 50, https://doi.org/10.1007/s10113-020-01606-9, 2020.
McVicar, T. R., Roderick, M. L., Donohue, R. J., Li, L. T., Van Niel, T. G., Thomas, A., Grieser, J., Jhajharia, D., Himri, Y., Mahowald, N. M., Mescherskaya, A. V., Kruger, A. C., Rehman, S., and Dinpashoh, Y.: Global review and synthesis of trends in observed terrestrial near-surface wind speeds: Implications for evaporation, J. Hydrol., 416, 182–205, https://doi.org/10.1016/j.jhydrol.2011.10.024, 2012.
Mora, C., Dousset, B., Caldwell, I. R., Powell, F. E., Geronimo, R. C., Bielecki, C. R., Counsell, C. W. W., Dietrich, B. S., Johnston, E. T., Louis, L. V., Lucas, M. P., Mckenzie, M. M., Shea, A. G., Tseng, H., Giambelluca, T. W., Leon, L. R., Hawkins, E., and Trauernicht, C.: Global risk of deadly heat, Nat. Clim. Change, 7, 501–506, https://doi.org/10.1038/nclimate3322, 2017.
Panofsky, H. A.,. Brier, G. W., and Best, W. H.: Some application of statistics to meteorology, Earth Miner. Sci. Contin. Educ. Coll. Earth Miner. Sci. Pennsylvania State Univ., https://books.google.es/books?id=1WARAQAAIAAJ (last access: 12 December 2024), 1958.
Pryor, S. C. and Barthelmie, R. J.: Climate change impacts on wind energy: A review, Renewable and sustainable energy reviews, 14, 430–437, https://doi.org/10.1016/j.rser.2009.07.028, 2010.
Pryor, S. C., Barthelmie, R. J., Bukovsky, M. S., Leung, L. R., and Sakaguchi, K.: Climate change impacts on wind power generation, Nature Reviews Earth and Environment, 1, 627–643, https://doi.org/10.1038/s43017-020-0101-7, 2020.
Rojas-Labanda, C., González-Rouco, F., García-Bustamante, E., Navarro, J., Lucio-Eceiza, E. E., Van der Schrier, G., and Kaspar, F.: Surface wind over Europe: Data and variability, Int. J. Climatol., 43, 134–156, https://doi.org/10.1002/joc.7739, 2023.
Ruosteenoja, K. and Räisänen, P.: Seasonal Changes in Solar Radiation and Relative Humidity in Europe in Response to Global Warming, J. Climate, 26, 2467–2481, https://doi.org/10.1175/JCLI-D-12-00007.1, 2013.
Sailor, D. J., Smith, M., and Hart, M.: Climate change implications for wind power resources in the Northwest United States, Renew. Energ., 33, 2393–2406, https://doi.org/10.1016/j.renene.2008.01.007, 2008.
Scoccimarro, E., Fogli, P. G., and Gualdi, S.: The role of humidity in determining scenarios of perceived temperature extremes in Europe, Environ. Res. Lett., 12, 114029, https://doi.org/10.1088/1748-9326/aa8cdd, 2017.
Taylor, K. E., Stouffer, R. J., and Meehl, G. A.: An overview of CMIP5 and the experiment design, B. Am. Meteorol. Soc., 93, 485–498, 2012.
Tobin, I., Greuell, W., Jerez, S., Ludwig, F., Vautard, R., Van Vliet, M. T. H., and Breón, F. M.: Vulnerabilities and resilience of European power generation to 1.5 °C, 2 °C and 3 °C warming, Environ. Res. Lett., 13, 044024, https://doi.org/10.1088/1748-9326/aab211, 2018.
Van Der Wiel, K., Bloomfield, H. C., Lee, R. W., Stoop, L. P., Blackport, R., Screen, J. A., and Selten, F. M.: The influence of weather regimes on European renewable energy production and demand, Environ. Res. Lett., 14, 094010, https://doi.org/10.1088/1748-9326/ab38d3, 2019.
Wild, M., Folini, D., Henschel, F., Fischer, N., and Müller, B.: Projections of long-term changes in solar radiation based on CMIP5 climate models and their influence on energy yields of photovoltaic systems, Sol. Energy, 116, 12–24, https://doi.org/10.1016/j.solener.2015.03.039, 2015.
Willett, K. M., Gillett, N. P., Jones, P. D., and Thorne, P. W.: Attribution of observed surface humidity changes to human influence, Nature, 449, 710–712, https://doi.org/10.1038/nature06207, 2007.
Zhang, P., Zhang, J., and Chen, M.: Economic impacts of climate change on agriculture: The importance of additional climatic variables other than temperature and precipitation, J. Environ. Econ. Manag., 83, 8–31, https://doi.org/10.1016/j.jeem.2016.12.001, 2017.


