 | 12 Jun 2025
On the use of disdrometer data for characterization of precipitation episodes in the Basque Country
Santiago Gaztelumendi
Joseba Egaña
José Antonio Aranda
Measurements are essential to provide information on the actual state of the atmosphere in order to improve our understanding of atmospheric processes and their role in water cycle and the climate system. In this paper we focus on measurements from optical disdrometers which seek to improve our understanding of complexity of precipitations processes at surface. In this work, we present a study focused on analyzing the key characteristics of precipitation episodes in the Basque Country. For this purpose 1 min data from disdrometers are aggregated into precipitation episodes. This analysis involves incorporating information derived from various aggregated statistics applied to various episodes variables, including duration, number of particles, rain intensity and total rainfall segmented by precipitation type, total rain amount, season and others. Finally, some comparison in between disdrometer precipitation episodes and tipping-bucket rain-gauge episodes has been done.
- Article
(1419 KB) - Full-text XML
- BibTeX
- EndNote


The reliability of precipitation measurements is a fundamental requirement, as these data serve as essential input variables for many scientific applications, including hydrologic models, weather forecasting data assimilation, climate change studies, and weather radar calibration, among others. Both the scientific community and National Meteorological Services worldwide are addressing the challenge of enhancing the accuracy of precipitation measurements at high temporal resolution to better characterize and precisely quantify the highly variable, time-dependent nature of precipitation events (e.g. Gaztelumendi et al., 2009; Tokay et al., 2014; Park et al., 2017; Xie et al., 2020; WMO, 2023; Cha and Yum, 2021; Ro et al., 2024). In the case of the Basque Country, there are two primary methods for obtaining in-situ precipitation measurements: (1) the pluviometer network (see Fig. 1), which has been developed over more than thirty years (e.g., Gaztelumendi et al., 2018, 2024), and (2) the newly implemented disdrometer network (e.g., Gaztelumendi et al., 2022, 2024; Gaztelumendi and Aranda, 2024), which has been introduced in recent years.
Currently, the more than 120 Automatic Weather Stations distributed throughout the Basque Autonomous Community (BAC), can be classified into three different typologies: meteorological, gauging and quality (e.g. EUSKALMET, 2024; Gaztelumendi et al., 2018, 2022). At each site, variables of the atmosphere and inland waters are measured by a set of instruments and sensors, recorded by Campbell Scientific CR1000 and CR6 dataloggers. The measurements are packaged and transmitted in observations every 10 min, including precipitation data from tipping-bucket rain gauges.
The Basque disdrometer network was deployed by the Basque Government to improve the characterization of precipitation at high temporal resolution. This network (Fig. 1) comprises several Parsivel OTT-2 disdrometers (OTTHydromet, 2016, 2024) installed at ten locations across the Basque Country. Optical disdrometers operate by measuring the degree of light obstruction caused by particles passing through a laser beam. When raindrops intercept the beam, a sensor detects a reduction in light intensity, which is then converted into an electrical signal by a photodiode. This reduction in intensity corresponds to the size of the raindrops blocking the beam. Additionally, by analyzing the duration of the reduced intensity, the falling velocity of the particles can be estimated. This instrumentation provides both raw data, such as raindrop size and velocity distribution, and derived data, including rain intensity, hydrometeor classification, reflectivity, and visibility, recorded every minute.
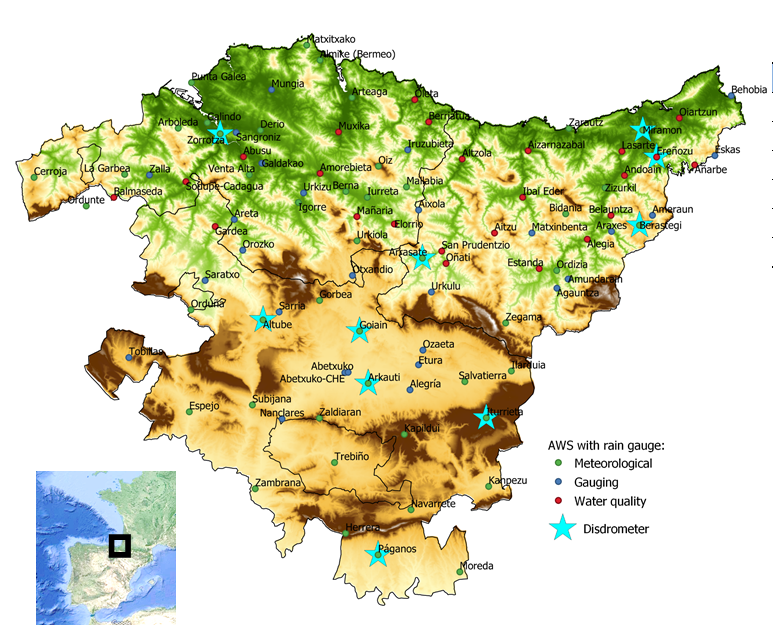
Figure 1Tipping bucket rain gauges and disdrometers present in the Basque network.
The main objective of this work is to characterize and analyze precipitation episodes in the Basque Country, specifically to identify patterns and common characteristics using 1 min event data from various disdrometers (DIS). To achieve this, we aggregate precipitation data into episodes, providing a more intuitive understanding of how they are structured and how they impact specific locations.
In the following section, we outline the methodology and data used. In the third section, we present the results and discuss key aspects, including precipitation type classification, total precipitation, duration, maximum intensity, and precipitation amount. We also analyze seasonal characteristics and the average features of precipitation episodes from disdrometer (DIS) and tipping-bucket gauge (TBG) perspective. Finally, we conclude with a section summarizing our findings and suggesting directions for future research.
To carry out the analysis, we prepared a comprehensive dataset spanning three years (2021–2023) of precipitation episodes derived from minute-by-minute raw data recorded by the disdrometer network. The raw event data undergoes proper filtering and processing before being aggregated into precipitation episodes. These episodes are then grouped based on shared characteristics or factors that facilitate analysis, such as predominant precipitation type, total precipitation amount, maximum intensity, or season, among other categories. The ultimate goal is to identify patterns and common characteristics.
We selected six locations (Fig. 2) with complete observations (from disdrometers and pluviometers) during the three-year study period. A dataset was created from raw 1 min disdrometer telegrams containing various key variables, primarily Rain Intensity (RI), Number of Particles (NP), and Precipitation type (HC – Hydrometeor Classification). The HC was established according to available SYNOP Tab 4680 codes (OTTHydromet 2016).
We filtered out 1 min events with NP less than 10 or RI less than 0.01 mm h−1, resulting in 2023 events (0.2 %) with a total precipitation amount of 12 mm (0.06 %). Additionally, we prepared a 10 min precipitation dataset from heated tipping-bucket rain gauges for comparison purposes.
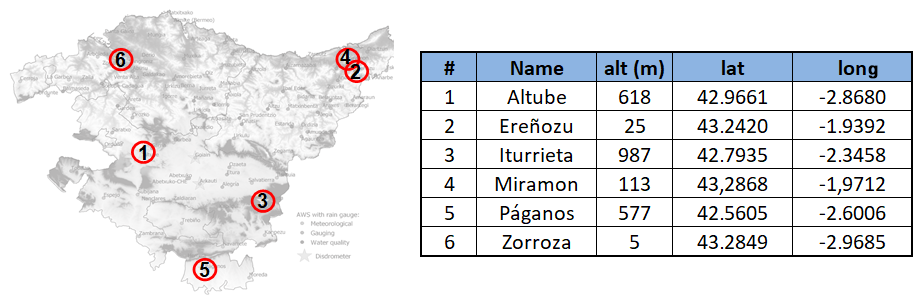
Figure 2Selected locations used in this study.
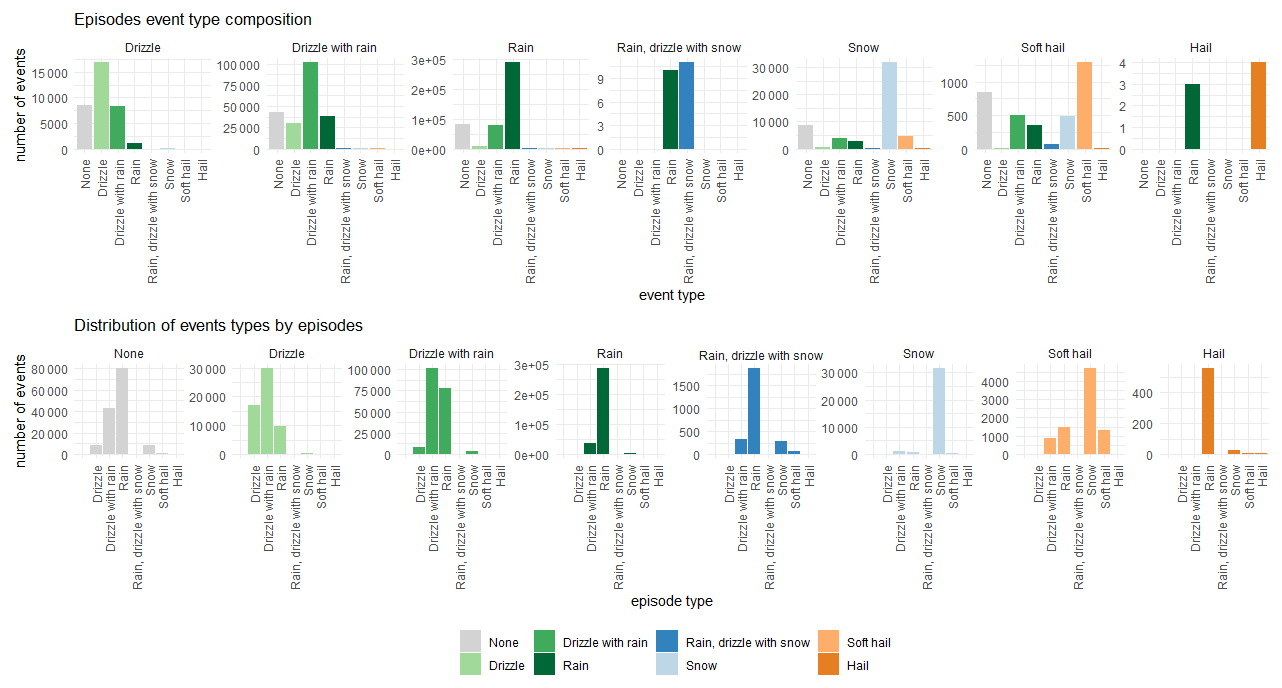
Figure 3Composition of types within episodes and the distribution of events types into episodes.
We considered 1 min event variables, both numerical (rain intensity, rain amount, number of particles) and nominal (precipitation type). The event data (1 min intervals) was aggregated into precipitation episodes based on selected criteria for temporal aggregation. Specifically, an ad-hoc function was implemented in R, based on the USGS-Rainmaker methodology (USGS 2021), and modified for 1 min intervals and multiple stations. Episodes were generated considering two criteria: (1) Minimum Inter-Episode Time (MIT), which defines the minimum time difference between episodes, and (2) Minimum Episode Rain Threshold (MRT), the minimum accumulated precipitation required to define an episode. A higher MIT results in fewer episodes, longer durations, and higher mean precipitation (although this is not always the case for high-intensity episodes). A lower MRT results in more episodes, as it includes more minor events. After sensitivity tests, MIT =30 min and MRT =1 mm were selected. 8 % of the total event precipitation remained outside the episodes, distributed as follows: 34 % Drizzle, 9 % Drizzle with rain or soft hail, 7 % Rain, 4 % Snow, and smaller percentages in other categories.
Once the events were grouped into episodes, new episode variables were generated by applying various mathematical operations (depending on whether the variable was numerical or nominal), such as count, sum, maximum, minimum, mean, median, mode, standard deviation, and percentiles. Episode characteristics were analyzed based on segmentation by factors such as duration, predominant precipitation type, total precipitation amount, maximum intensity, and season/month.
Various Exploratory data analysis (EDA) and visual data analytics (VDA) techniques (e.g. Tukey, 1977; Tufte, 2007; Wiley, 2021; Wickham and Grolemund, 2017) were applied to characterize and identify patterns and common characteristics (Gaztelumendi et al., 2024). Some ad-hoc R scripts (R Core Team, 2022) were developed to manage the data, simplify complexity, and extract conclusions. We used libraries such as tidyr (Wickham et al., 2023a) for data manipulation and transformation, dplyr (Wickham et al., 2023b) for data analysis and transformation, and ggplot2 (Wickham, 2016) for data visualization with facets to generate multiple plot panels based on factors, grouping, and summarization.
3.1 Episodes and event types
Figure 3 shows the composition of types within episodes and the distribution of events types into episodes. Note that for “type” (nominal data), the mode is used to calculate the most representative “type” during an episode, and that we include “None” as an episode can have no-rain events inside. Different hydrometeor types can coexist within an episode, for instance, an episode classified as “rain” will predominantly consist of minute-resolution events labeled as rain, but it may also include intervals classified as drizzle or even periods with no recorded precipitation. Note that most hail events or soft hail events are included in “rain” episodes.
3.2 Total precipitation
In Fig. 4 we can see total precipitation in episodes segmented by type and precipitation amount bins. There is a decrease in the number of episodes for higher precipitation classes and an increase in accumulated precipitation for higher precipitation classes (first column).The relative proportion of episode types per precipitation class shows a higher proportion of snow in higher classes and drizzle in lower classes for both the number of episodes and accumulated precipitation (second column). Regarding the details of event-type composition within episodes (third column), we appreciate how drizzle events are present in all classes, and soft hail events appear in higher classes. Non precipitation events are less relevant as total precipitation increase. Pure drizzle events contribute insignificantly to total precipitation. Hail events contribute to total episode precipitation across all classes. Snow events contribute more for higher classes.
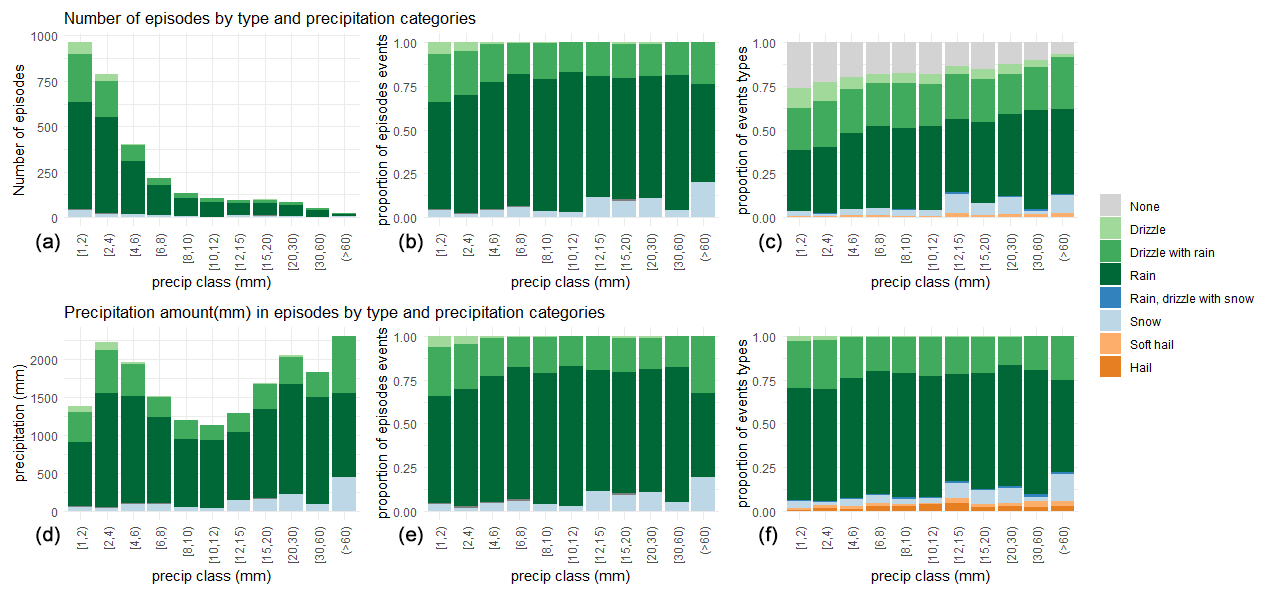
Figure 4Number of episodes (a, b, c) and precipitation amount (d, e, f) segmented by type and precipitation class (binned precipitation).
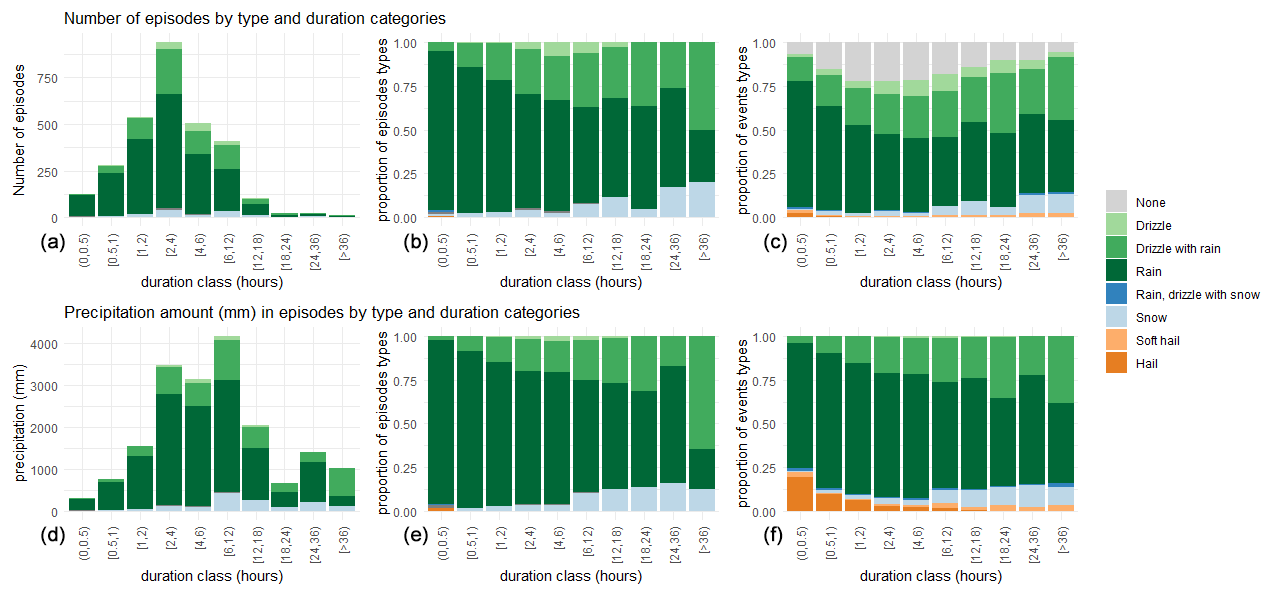
Figure 5Number of episodes (a, b, c) and precipitation amount (d, e, f) segmented by duration bins.
3.3 Duration
In Fig. 5 we present some results on episodes' duration segmentation. The majority of episodes are distributed around the 2–4 h class. The contribution to total precipitation from episodes over 18 h is significant, despite their low number (first column). Examining the proportions per episode type, we see an increasing contribution of drizzle with rain and snow episodes as the duration class increases, while hail and soft hail episodes last for less than half an hour (second column). Regarding details from events type composition of episodes (third column), we see that drizzle events and associated precipitation become more significant as duration increases. Hail events are mostly present in low-duration classes and are relevant in terms of precipitation amount. Snow events become more relevant as the duration increases.
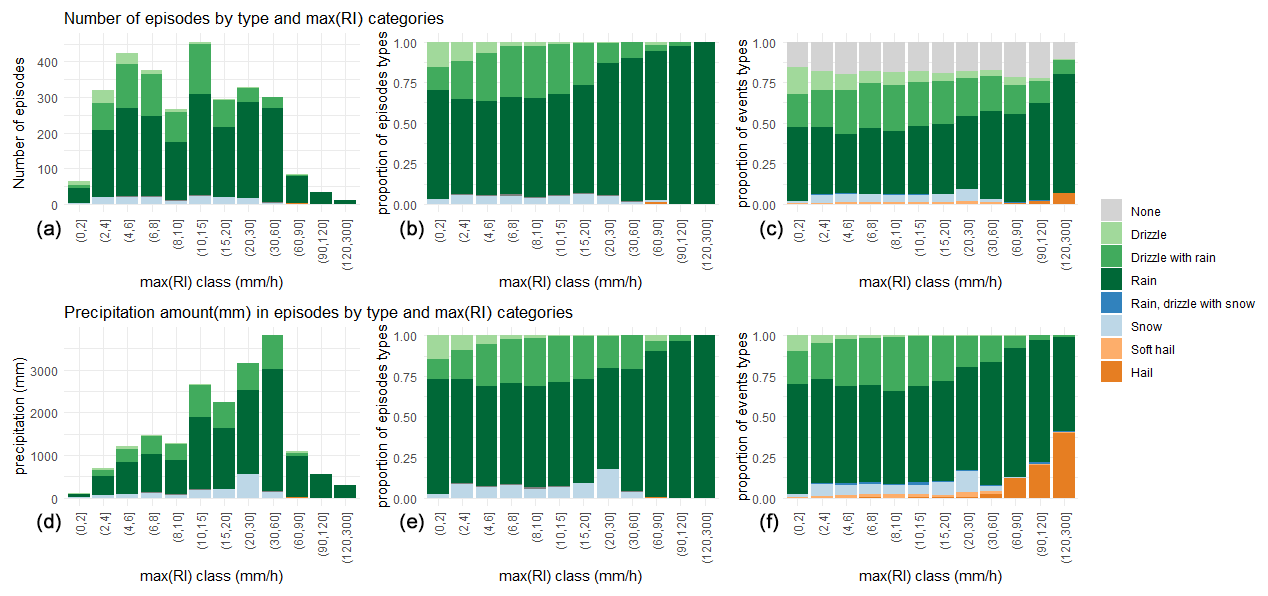
Figure 6Number of episodes (a, b, c) and precipitation amount (d, e, f) segmented by maximum precipitation intensity bins.
3.4 Maximum precipitation intensity
Regarding episodes' maximum rain intensity segmentation in Fig. 6 we proceed as in precedent figures but in this case using precipitation intensity bins. The number of episodes is quite similar between 2 and 60 mm h−1. The contribution to total precipitation mainly comes from episodes between 10 and 60 mm h−1 (first column). Pure snow events are limited to 1–30 mm h−1. No snow events are observed over 60 mm h−1. Over 30 mm h−1, episodes are mainly classified as rain. Drizzle episodes have a maximum RI of less than 10 mm h−1 (second column). In terms of details from event type composition of episodes (third column) we can appreciate that soft hail and snow does not occur with RI over 60 mm h−1. Hail events are limited to episodes with a maximum RI over 60 mm h−1.
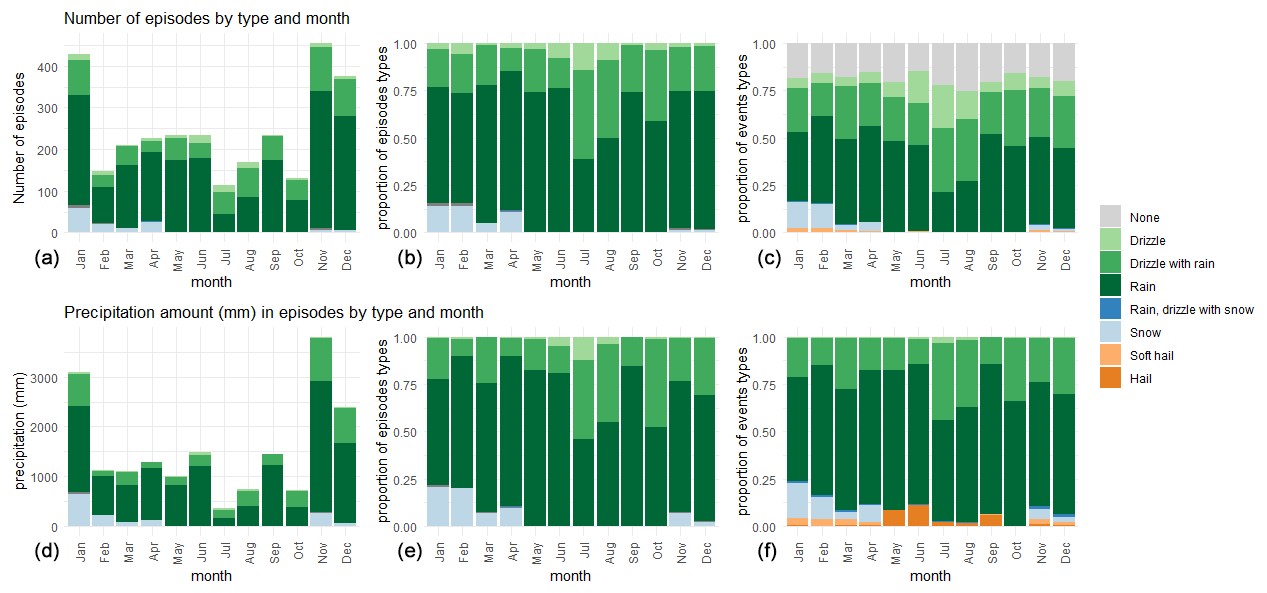
3.5 Seasonal segmentation
In Fig. 7 we focus on episodes' monthly segmentation. We can see how the number of episodes is greater during November, December, and January. More accumulated precipitation occurs in November, December, and January (first column). Snow episodes occur from November to April. Drizzle and Drizzle with rain are predominant in July and August (second column). In terms of event type composition of episodes (third column); residual hail occurs throughout the year. Significant hail presence is observed from May to September. Soft hail occurs from November to April.
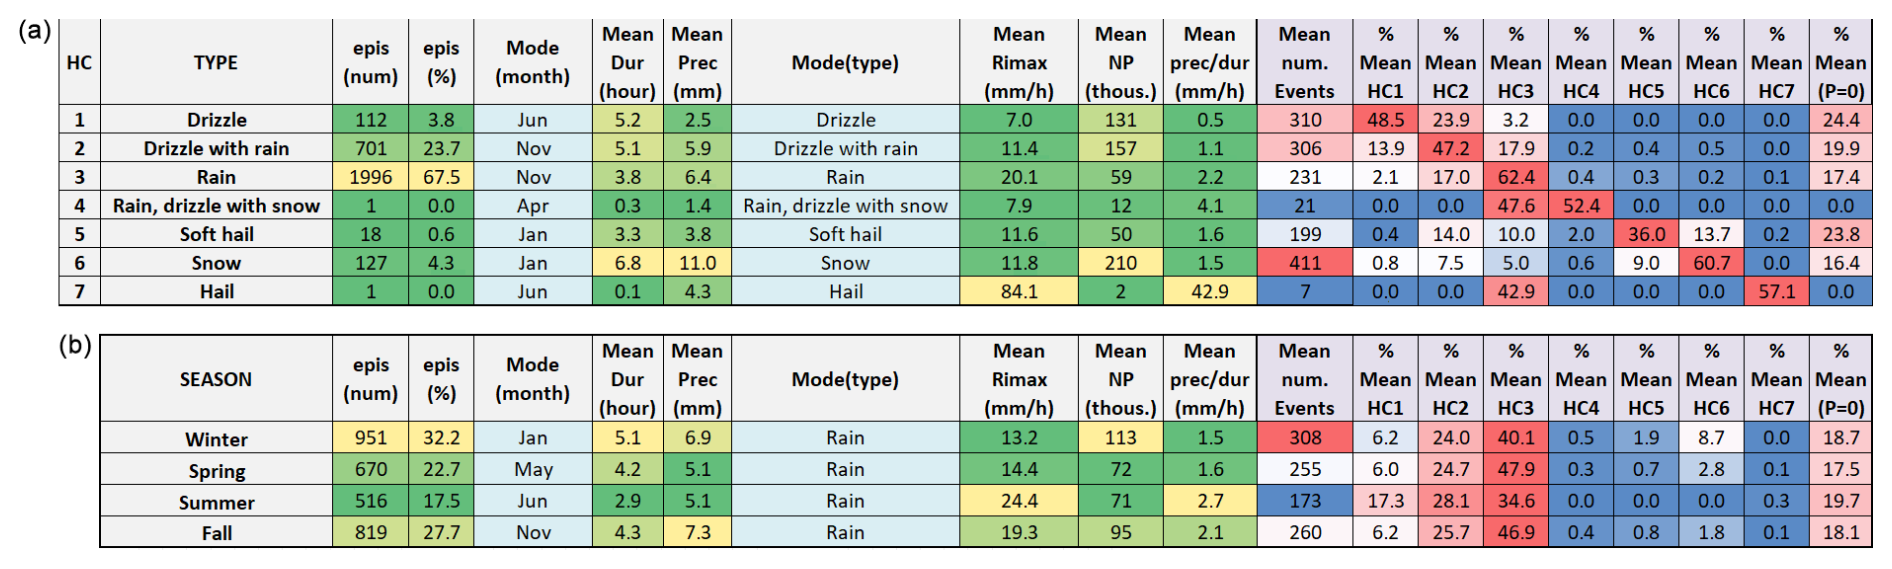
Figure 8Characteristics of a typical precipitation episode by predominant precipitation type (a) and by season (b); colors are used to highlight differences between numerical values for easier interpretation.
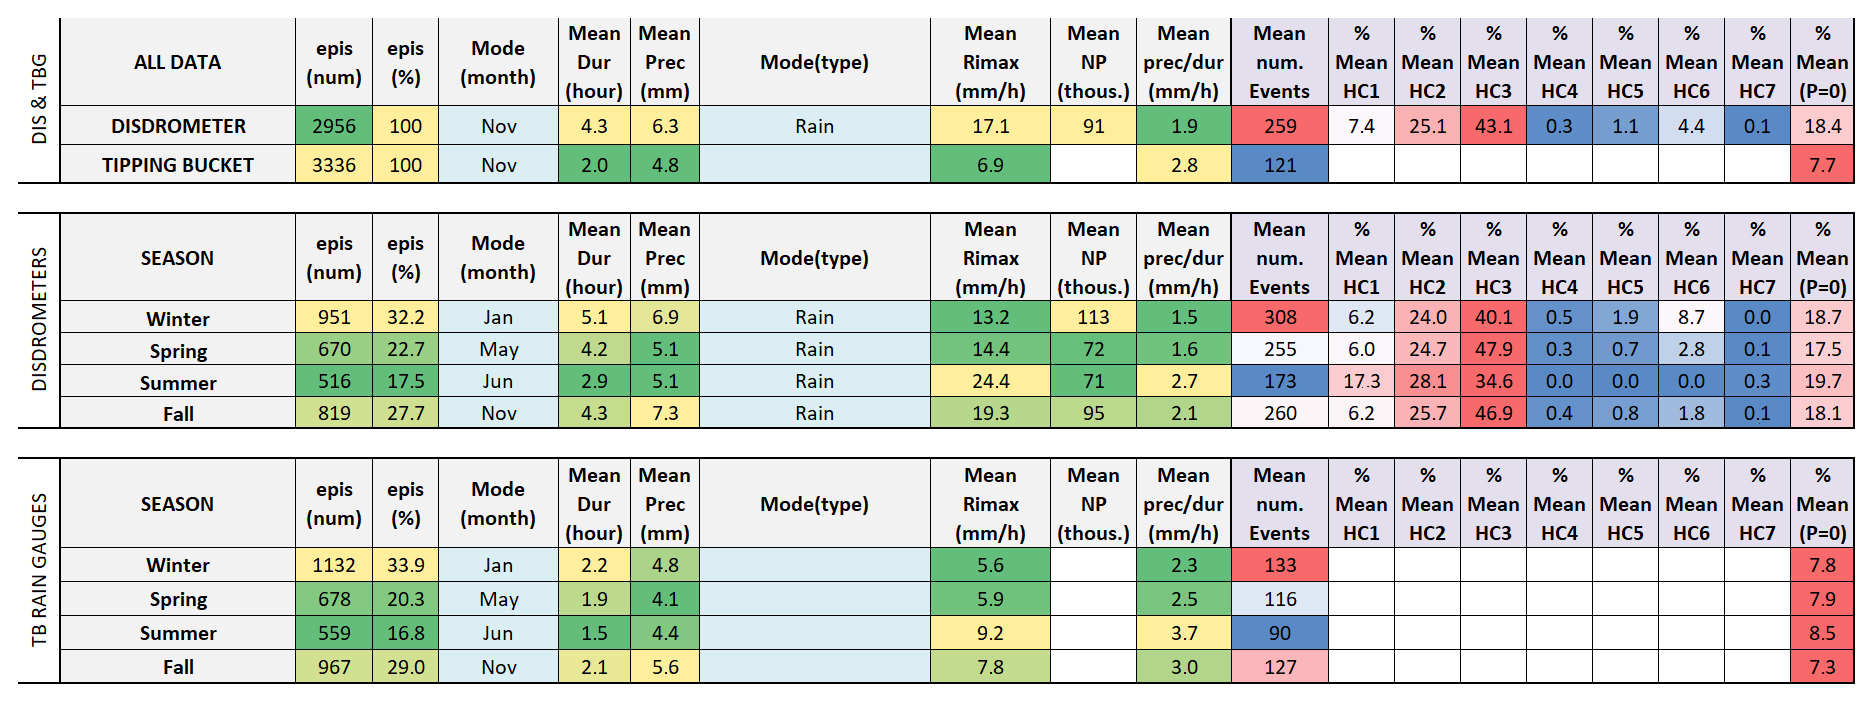
Figure 9Characteristics of episodes as seen from disdrometer and typing bucket data sets; colors are used to highlight differences between numerical values for easier interpretation.
3.6 Main episodes characterization
In Fig. 8 we summarized main episodes characteristics by precipitation type (HC1 to HC7) and season.
Regarding precipitation type, we can see how rain episodes account for 67.5 % of total episodes, typically occurring in November, with a duration of 3.8 h, a total rain of 6.4 mm, a mean of maximum rain intensity (RI) of 20.1 mm h−1, 59 000 particles, a mean precipitation-duration ratio of 2.2 mm h−1, and mainly consisting of rain and around 17.4 % of no-precipitation events. Snow episodes account for 4 % of all episodes, typically occurring in January, with an average duration of 6.8 h, a total precipitation of 11 mm, and a mean maximum rain intensity of 11.8 mm h−1. These episodes feature approximately 210 000 particles, with a mean precipitation-duration ratio of 1.5 mm h−1. They are primarily composed of snow, soft hail and rain, with 16.4 % of events showing no precipitation. Later on, we observe that episodes of soft hail, rain and drizzle with snow, and hail are not very representative, with only 18, 1, and 1 episodes, respectively.
Regarding season main episodes characterization, we can see how Winter episodes account for 32 % of the total episodes. These are typically rain episodes occurring in January (or December), lasting for 5.1 h with an average accumulated precipitation of 6.9 mm, an average precipitation rate of 1.5 mm h−1, and a maximum minute rain intensity of 13.2 mm h−1. There are approximately 113 000 particles in 308 events, with 71 % being liquid phase precipitation, 10 % snow, mixed or soft hail, and 19 % with no precipitation. Spring episodes make up 23 % of the total episodes, typically characterized by rain lasting for 4 h with an average accumulated precipitation of 5 mm, an average precipitation rate of 1.6 mm h−1, and a maximum minute rain intensity of 14.4 mm h−1. These episodes involve around 72 000 particles in 255 events, with 95 % being rain and drizzle, 5 % snow, mixed or soft hail, and 17 % without precipitation. Summer episodes represent 17 % of the total episodes, usually as rain episodes lasting for 3 h with an average accumulated precipitation of 5 mm, an average precipitation rate of 2.7 mm h−1, and a maximum minute rain intensity of 24.4 mm h−1. These episodes include approximately 71 000 particles in 173 events, with 80 % being rain and drizzle and 20 % having no precipitation. Fall episodes comprise 28 % of the total episodes, typically rain episodes lasting for 4 h with an average accumulated precipitation of 7 mm, an average precipitation rate of 2.1 mm h−1, and a maximum minute rain intensity of 19.3 mm h−1. These episodes feature about 95 000 particles in 260 events, with 80 % being rain and drizzle, 3 % snow, mixed or soft hail, and 18 % with no precipitation.
3.7 TBG versus DIS
In Fig. 9 we can see comparison of results between episodes constructed from TBG and DIS data using the same methodology. It shows that the duration of the episodes is almost double in DIS compared to TBG or the Mean RI is much greater in DIS that in TBG. These differences are due to the combination of a higher number of minor events and the aggregation methodology used, which accounts for a higher presence of smaller events. A more detailed and comprehensive discussion on the comparison between TBG and DIS data is provided in Gaztelumendi and Aranda (2024).
An analysis of precipitation episodes derived from disdrometer data provides a comprehensive understanding of precipitation patterns, both from an event and episode perspective.
The Basque Disdrometer Network effectively captures detailed precipitation characteristics, enabling more nuanced analyses of precipitation types and their behaviors across various durations, intensities, and seasonal distributions.
Disdrometer and pluviometer data discrepancies must be acknowledged, considering both instrumental and methodological differences.
Further research is needed to refine episodes aggregation to improve HC and to exploit full spectral available data.
This study focuses on the use of the Basque disdrometer network, a novel and evolving network with operational purposes that seeks to improve our understanding of the complexity of precipitation distribution and characteristics at the surface.
The results are conditioned by only three years of data, the locations, and the characteristics of the six sites used, as well as the initial decision on how to group them into episodes.
Although the characteristics of the disdrometer model and internal processes influence the values and quality of NP, RI, and HC data, when properly processed, these data can serve as valuable repositories in the context of climate monitoring and extreme weather surveillance.
It is important to note that this is a study with an Eulerian perspective (observing the rain at specific locations). In the future, it will be complemented with a Lagrangian perspective using radar records, allowing for a complete observation of the characteristics of the rain event and its temporal evolution.
There is a need to deepen the methodologies for constructing episodes, conducting a complete battery of tests related to the selection of parameters, and applying the most appropriate methodologies with minute data.
Further study and characterization of non-precipitation events within the episodes are needed, it is also planned to
complement statistical studies with representative case studies and to complete episode characterization by exploiting the available particle spectrum information.
R codes are not publicly accessible because they are for internal use.
The data sets are not publicly accessible because they are prepared for internal use.
SG conceived and conduct the study, set methodology, prepare data/graphs and write the article, JE contributed to the study and JAA maintained and provided disdrometer data.
The contact author has declared that none of the authors has any competing interests.
Publisher’s note: Copernicus Publications remains neutral with regard to jurisdictional claims made in the text, published maps, institutional affiliations, or any other geographical representation in this paper. While Copernicus Publications makes every effort to include appropriate place names, the final responsibility lies with the authors.
This article is part of the special issue “EMS Annual Meeting: European Conference for Applied Meteorology and Climatology 2024”. It is a result of the EMS Annual Meeting 2024, Barcelona, Spain, 2–6 September 2024. The corresponding presentation was part of session UP1.4: High-resolution precipitation monitoring and statistical analysis for hydrological and climate-related applications
Our thanks to Basque Government for maintaining and supporting research and operational services in the hydro-ocean-meteo-climatic field essential for the Basque community, and particularly to the Department of Security and the Directorate of Emergencies and Meteorology (DAEM) for Euskalmet support. Likewise, our recognition the open-software community and R contributors.
This paper was edited by Tanja Winterrath and reviewed by two anonymous referees.
EUSKALMET – Basque Meteorology Agency: Euskal Meteorologia Agentzia,https://www.euskalmet.euskadi.eus/hasiera/ (last access: 8 October 2024), 2024.
Cha, J. W. and Yum, S. S.: Characteristics of Precipitation Particles Measured by PARSIVEL Disdrometer at a Mountain and a Coastal Site in Korea, Asia-Pac. J. Atmos. Sci., 57, 261–276, https://doi.org/10.1007/s13143-020-00190-6, 2021.
Gaztelumendi, S. and Aranda, J. A.: Comparative study of rain measurement by optical disdrometers and tipping-bucket rain gauges in Basque Country, in: Proceedings of WMO Technical Conference on Meteorological and Environmental Instruments and Methods of Observation (TECO-2024), Vienna, Austria, 23–26 September 2024, https://community.wmo.int/en/activity-areas/imop/publications-and-iom-reports/teco-2024-presentations (last access: 9 March 2025), 2024.
Gaztelumendi, S., Otxoa de Alda, K., Egaña, J., Gelpi, I. R., Pierna, D., and Carreño, S.: Summer showers characterization in the Basque Country, Proceedings of the 5th ECSS, Landshut, Germany, 12–16 October 2009, 81–82, https://doi.org/10.13140/RG.2.2.27615.74400, 2009.
Gaztelumendi S., Otxoa de Alda, K., Hernández, R., Maruri, M., Aranda, J. A., and Anitua, P.: The Basque Automatic Weather Station Mesonetwork in perspective, in: Proceedings 2018 WMO/CIMO Technical Conference on Meteorological and Environmental Instruments and Methods of Observation (CIMO TECO-2018), 8–11 October 2018, Amsterdam, the Netherlands, https://doi.org/10.25607/OBP-125, 2018.
Gaztelumendi, S., Otxoa de Alda, K., Ruiz, R., Orue, J., Egaña, J., Maruri, M., and Aranda, J. A.: High temporal resolution monitoring of precipitation in the Basque Country, EMS Annual Meeting 2022, Bonn, Germany, 5–9 Sep 2022, EMS2022-584, https://doi.org/10.5194/ems2022-584, 2022.
Gaztelumendi, S., Egaña, J., and Otxoa de Alda, K.: Characterization of hydrometeorological events and flood impacts in the Basque Country, Adv. Sci. Res., 21, 27–39, https://doi.org/10.5194/asr-21-27-2024, 2024.
OTTHydromet: Operational Instructions, Present Weather Sensor OTT Parsivel 2, DN: 70.210.001.B.E. 12-1016, https://psl.noaa.gov/data/obs/instruments/OpticalDisdrometer.pdf (last access: 10 February 2024), 2016.
OTTHydromet: OTT Parsivel2 – Laser Weather Sensor, https://www.ott.com/products/meteorological-sensors-26/ott-parsivel2-laser-weather-sensor-2392/ (last access: 10 December 2024), 2024.
Park, S.-G., Kim, H.-L., Young-Woong, H., and Sung-Hwa, J.: Comparative evaluation of the OTT PARSIVEL2 using a collocated two-dimensional video disdrometer. J. Atmos. Ocean. Tech., 34, 2059–2082, https://doi.org/10.1175/JTECH-D-16-0256.1, 2017.
R Core Team: R: A language and environment for statistical computing, R Foundation for Statistical Computing, Vienna, Austria, http://www.R-project.org/ (last access: 28 November 2024), 2022.
Ro, Y., Chang, K. H., Hwang, H., Kim, M., Cha, J.-W., and Lee, C.: Comparative study of rainfall measurement by optical disdrometer, tipping-bucket rain gauge, and weighing precipitation gauge, Nat. Hazards, 120, 2829–2845, https://doi.org/10.1007/s11069-023-06308-z, 2024.
Tokay, A., Wolff, D. B., and Petersen, W. A.: Evaluation of the New Version of the Laser-Optical Disdrometer, OTT Parsivel2, J. Atmos. Ocean. Tech., 31, 1276–1288, 2014.
Tufte, R. E.: The Visual Display of Quantitative Information, in: 2nd Edn., Graphics Press, ISBN 13:978-0961392147, 2007.
Tukey, J. W.: Exploratory Data Analysis, Addison-Wesley, ISBN 978-0201076165, 1977.
USGS: Rainmaker, https://code.usgs.gov/water/analysis-tools/Rainmaker (last access: 30 January 2025), 2021.
Wickham, H.: ggplot2: Elegant Graphics for Data Analysis, Springer-Verlag, New York, ISBN 978-3-319-24277-4, 2016.
Wickham, H. and Grolemund, G.: R for data science, O'Reilly Media, ISBN 13:978-1491910399, 2017.
Wickham, H., Vaughan, D., and Girlich, M.: tidyr: Tidy Messy Data, R package version 1.3.1, https://github.com/tidyverse/tidyr (last access: 28 October 2024), 2023a.
Wickham, H., François, R., Henry, L., Müller, K., and Vaughan, D.: dplyr: A Grammar of Data Manipulation, GitHub, https://github.com/tidyverse/dplyr (last access: 28 November 2023), 2023b.
Wiley, M.: Efficient Data Management for Large Datasets, O'Reilly Media, ISBN 13:978-1801075764, 2021.
WMO: World Meteorological Organization Guide to Meteorological Instruments and Methods of Observation,WMO-No.8, Geneva, ISBN 978-92-63-10008-5, 2023.
Xie, Z., Yang, H., Lv, H., and Hu, Q.: Seasonal Characteristics of Disdrometer-Observed Raindrop Size Distributions and Their Applications on Radar Calibration and Erosion Mechanism in a Semi-Arid Area of China, Remote Sens., 12, 262, https://doi.org/10.3390/rs12020262, 2020.