 | 18 Jul 2025
Occurrence of tornado outbreaks influenced by solar wind–magnetosphere–ionosphere–atmosphere coupling
Vojto Rušin
The occurrence of tornado outbreaks in the United States is investigated in the context of solar wind coupling to the magnetosphere-ionosphere-atmosphere system. The superposed epoch analysis of daily occurrence of tornadoes reveals a peak in the cumulative number of tornadoes near the interplanetary magnetic field sector boundary crossings. Most of the large tornado outbreaks are associated with high-density plasma adjacent to the heliospheric current sheet and with co-rotating interaction regions at the leading edge of high-speed streams. Large tornado outbreaks also followed impacts of interplanetary coronal mass ejections or occurred in the declining phase of major high-speed streams. We consider the role of aurorally generated atmospheric gravity waves in severe weather development leading to tornado outbreaks. While these gravity waves reach the troposphere with attenuated amplitudes, they can contribute to conditional symmetric instability release in frontal zones of extratropical cyclones leading to synoptic-scale weather conditions favouring formation of supercells in a strong wind shear environment and high tornado occurrence.
- Article
(10060 KB) - Full-text XML
-
Supplement
(3412 KB) - BibTeX
- EndNote


Tornado outbreaks, particularly in the United States, have a significant impact on human lives and property (Brooks and Doswell, 2001; Tippett, 2014). The occurrence of tornadoes and the associated severe weather, including severe wind and hailstorms, have long been related to the synoptic situation (Fawbush et al., 1951). The latter authors have already discussed an empirical method of forecasting based on several necessary conditions that are known to characterize the synoptic situation during tornado developments, including the presence of conditional instability of the air column and an appreciable lifting of the moist layer near the surface surmounted by a layer of dry air. Many advances have been made in the understanding of the structure and dynamics of tornadoes, and the forecasting of severe weather has progressed (e.g., Bolton et al., 2003; Doswell et al., 1996, 2013; Gallo et al., 2016; Miller et al., 2020).
Brooks et al. (2014) investigated the possible impact of climate change on tornado occurrence. They found more clusters of tornadoes since the 1970s, i.e., an increase in the number of days with multiple tornadoes, but no clear trend in the annual number of tornadoes. Why this clustering effect would occur is not clear. Tippett et al. (2016) found that the frequency of U.S. tornado outbreaks is increasing and that it is increasing faster for more extreme outbreaks. Climate change is likely contributing to these trends (Elsner et al., 2015; Agee et al., 2016) and climate models indicate that environmental factors, particularly an increase of the convective available potential energy (CAPE), play a more significant role in a warmer climate (Diffenbaugh et al., 2013). However, other environmental factors, including vertical wind shear and storm relative helicity (Thompson et al., 2003), have also been considered to explain the upward trends of tornado outbreaks (Tippett et al., 2016).
Severe convective storms with an increased occurrence of tornadoes are known to develop in a strong vertical wind shear environment (Púčik et al., 2015, 2021, and references therein). Weisman and Rotunno (2000) compared, and contrasted, theories of supercell dynamics based on either the role of vertical wind shear (e.g., Rotunno and Klemp, 1982, 1985) or the concept of storm-relative environmental helicity (Davies-Jones, 1984; Davies-Jones et al., 1990). Their simulations results supported the vertical wind shear perspective on the supercell dynamics. A strong vertical wind shear appears to be a necessary ingredient for the development of long-lived supercells and increased probability of tornadoes (Púčik et al., 2021).
Low-level southerly winds and strong vertical wind shears are favourable conditions for over-reflection of globally propagating aurorally excited gravity waves that can reach the troposphere and contribute to conditional symmetric instability release leading to slantwise convection. We have proposed that aurorally excited atmospheric gravity waves (AGWs) may play a role in influencing storm development (Prikryl et al., 2009a) by contributing to the release of conditional symmetric instability (CSI) (Schultz and Schumacher, 1999; Chen et al., 2018) and intensification of extratropical cyclones (Prikryl et al., 2009a; Prikryl, 2024, and references therein). A tendency of significant weather events, including explosive extratropical cyclones (Prikryl et al., 2009b, 2016), rapid intensification of tropical cyclones (Prikryl et al., 2019), heavy rainfall and flash floods (Prikryl et al., 2018, 2021a, b; Prikryl and Rušin, 2023; Prikryl, 2024), to occur following arrivals of corotating interaction regions (CIRs) at the leading edge of solar wind high-speed streams (HSSs) from coronal holes and impacts of interplanetary coronal mass ejections (ICMEs), has been documented. In this paper, we investigate the occurrence of tornadoes in the context of solar wind-magnetosphere-ionosphere-atmosphere coupling.
In Sect. 2, Data and methods used are described. In Sect. 3, the superposed epoch method is used to investigate the occurrence of large tornado outbreaks relative to different types of solar wind disturbances. In Sect. 4, we discuss possible physical mechanisms mediating the solar influence in the troposphere. In particular, the role of aurorally excited AGWs by contributing to the release of CSI leading to slantwise convection influencing storm development is examined in Sects. 4 and 5. In Sect. 6, datasets of supercells from literature are used in superposed epoch analysis keyed to dates of supercells to further support the link between the solar wind and tornado occurrence. In Sect. 7, the current forecasts of severe weather by the NOAA National Weather Service are discussed in the context of the presented results with a potential of space weather forecasts contributing to forecasting of large tornado outbreak risk.
The National Oceanic and Atmospheric Administration (NOAA) National Weather Service storm database (https://www.ncdc.noaa.gov/stormevents/, last access: 24 June 2025) contains records of significant weather episodes. The severe weather database is provided by the Storm Prediction Center (http://www.spc.noaa.gov/wcm/#data, last access: 24 June 2025) including a database of tornadoes.
The hourly reanalysis dataset ERA5 with spatial resolution of 0.25×0.25° (Hersbach et al., 2020) is a product of the European Centre for Medium-Range Weather Forecasts (ECMWF). Following Chen et al. (2018), indices including CAPE, slantwise CAPE (SCAPE), vertically integrated extent of realizable symmetric instability (VRS; a measure to quantify the “releasable” CSI) are diagnosed, to assess the likelihood of slantwise convection during tornado outbreaks.
The solar wind data are provided by the National Space Science Data Center (NSSDC) OMNIWeb (http://omniweb.gsfc.nasa.gov, last access: 24 June 2025) (King and Papitashvili, 2005). The hourly averages of solar wind velocity, V, the interplanetary magnetic field (IMF) magnitude, , the standard deviation of IMF Bz, , and the proton density, np, are used to identify CIRs, the interfaces between the fast and slow solar wind at the leading edge of HSSs from coronal holes (Smith and Wolfe, 1976). The IMF sector boundaries (SBs) where the IMF reverses its polarity have been identified as heliospheric current sheets (HCSs) (Smith et al., 1978; Hoeksema et al., 1983) that usually closely precede, or sometimes coincide (Huang et al., 2016a, b), with stream interfaces. The high-density plasma (HDP) sheet ahead of HCS and stream interface leads to magnetic field compression that can cause recurring moderate to weak geomagnetic storms (Tsurutani et al., 1995). In the absence of IMF data, magnetic sector boundary crossings, which are now generally referred to as HCS crossings, can be estimated from ground-based magnetograms (Svalgaard, 1975). In the present paper we use an updated list of SBC/HCSs (Prikryl et al., 2009b). Also, we use a catalogue of near-Earth ICMEs since 1996 (Richardson and Cane, 2010) (https://izw1.caltech.edu/ACE/ASC/DATA/level3/icmetable2.html, last access: 24 June 2025).
Measurements of the green coronal emission line intensity at 530.3 nm (Fe XIV) by ground-based coronagraphs from 1939 to 2008 have been merged into a homogeneous coronal dataset (Rybanský, 1975; Rybanský et al., 2001, 2005; Dorotovič et al., 2014; https://www.kozmos-online.sk/, last access: 24 June 2025). The coronal intensities are expressed in absolute coronal units (ACU) representing the intensity of the continuous spectrum from the center of the solar disk with a width of 1 Å at the same wavelength as the observational spectral line (1 ACU = 3.89 W m−2 sr−1 at 530.3 nm). The coronal intensity IGC depletions, called coronal holes, are sources of HSSs. The green corona intensity for the solar central meridian is computed by averaging the intensities measured at the east and west limbs (Prikryl et al., 2009b).
The superposed epoch (SPE) method (e.g., Ambrož, 1979) is applied on time series of green corona intensity, solar wind parameters and tornado occurrence keyed to SB/HCS crossings and impacts of HSS/CIRs and ICMEs.
A large proportion of fatalities and injuries from tornadoes occur during major tornado outbreaks (e.g., Galway, 1975). Although there are no universally accepted definitions of outbreaks (Verbout et al., 2006), Ćwik et al. (2021) reviewed publications on tornado outbreaks focusing on the “tornado outbreak” definition, its perception, evolution, and limitations. Since the present analysis uses the time series of daily tornado occurrence numbers, we classify tornado outbreaks by number of tornadoes per day, assigning categories of small (6 to 9), moderate (10–19), and large (20 or more) outbreaks, which is similar to Pautz (1969) and Galway, 1977).
3.1 SPE analysis keyed to the IMF sector boundary (heliospheric current sheet) crossings
SPE analysis of the green corona intensity IGC (Fig. 1a) and solar wind variables (Fig. 1b) is keyed to SB/HCS crossings (n=1792) for the years 1963–2023. The mean IGC shows the primary minimum just prior to the key time as well as the secondary minima at epoch days −28 and +26. This is the result of superposition of coronal holes including recurrent coronal holes, which are sources of HSSs. Less prominent IGC depletions at −11 and +16 epoch days can also be seen. The intermediate IGC depletions are shallower because of averaging over evolving coronal holes that can shift in heliographic longitude. The mean IGC at heliographic latitude 0°, with the average value over the period of 60 d subtracted, is shown by a white dotted line. The standard error of the mean for the primary IGC minimum, and the ordinate scale bar corresponding to the color scale, are shown. Coronal holes are sources of HSSs that are superposed in Fig. 1b. As expected, the mean solar wind velocity increases from a minimum just before the key time to a maximum a few days later. The other solar wind parameters peak at the leading edge of the superposed HSS/CIRs (epoch day 0). In addition to the primary pattern, the superposition of recurrent HSS/CIRs results in peaks at ±27 epoch days.
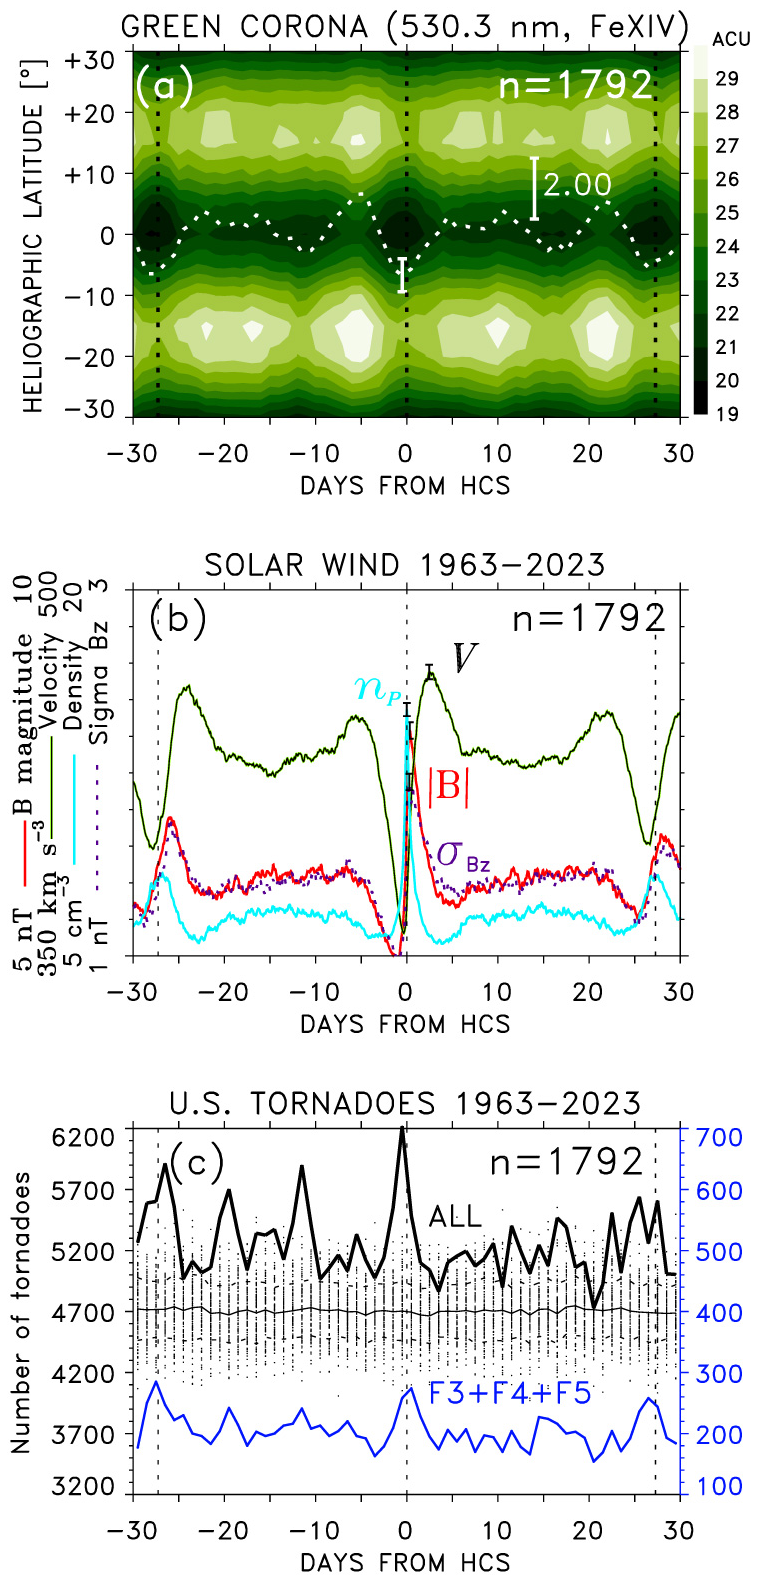
Figure 1SPE analysis of time series of (a) green corona intensity with mean values at heliospheric latitude 0° shown in dotted line, (b) mean solar wind plasma variables, and (c) cumulative numbers of all, as well as strong tornadoes, keyed to HCSs for a period ±30 d. The results of the simulated SPE analysis of cumulative numbers of tornadoes repeated 100 times using randomly chosen key times are shown by dots, with the mean (thin solid line) and ± standard deviation (dashed lines) overlaid. The vertical dotted lines are shown for the key time ±27.28 d (the synodic or Carrington rotation).
Figure 1c shows the cumulative numbers of tornadoes from the Storm Prediction Center database for each epoch day relative to the HCS crossing. When all tornadoes are included, the cumulative number of tornadoes peaks just before the key time. For comparison, the simulated SPE analysis of cumulative numbers of tornadoes using randomly chosen key times repeated 100 times is shown by dots, with the mean ± standard deviation overlaid. The cumulative number of strong tornadoes (F3 + F4 + F5) peaks at the key time and shows peaks near ±27 epoch days corresponding with CIRs at the leading edge of HSSs from recurrent coronal holes (Fig. 1a, b).

Figure 2SPE analysis of time series keyed to HCSs of (a) cumulative numbers of all tornadoes (black line) divided into groups of large, moderate and small tornado outbreaks (color lines), (b) cumulative numbers of tornadoes in logarithmic scale grouped by tornado magnitudes. (c, d) SPE analysis of corresponding cumulative numbers of tornado fatalities and injuries. The middle panels of the mean green corona intensity are repeated from Fig. 1a to show the correlation between the cumulative numbers of tornadoes/fatalities/injuries and the mean IGC at heliographic latitude 0°; the cross-correlation coefficients for tornado counts (CCALL, CC20+, CCF3, CCF4, CCF5), fatalities (CCde_ALL, CCde_20+), and injuries (CCinj_ALL, CCinj_20+) are printed.
In Fig. 2, more data from the Storm Prediction Center database are used to extend the SPE analyses from tornado counts to fatalities/injuries caused by tornadoes, and to show an inverse correlation with the mean IGC at heliographic latitude 0° (shown in the middle panels). In addition to the cumulative numbers of all tornadoes, Fig. 2a shows separately tornado counts in small, moderate, and large tornado outbreaks. The cumulative numbers of tornadoes in small and moderate outbreaks do not reveal any significant peaks. The principal peak of the cumulative numbers of tornadoes in large outbreaks (20+ tornadoes per day, shown in red line) is at −1 epoch day, with the secondary peaks near ±27 epoch days. These peaks closely correspond with the IGC minima due to recurrent coronal holes. Furthermore, there are peaks at −12 and +16 epoch days associated with less prominent secondary minima in the mean IGC. Figure 2b shows the cumulative numbers for all tornado categories in the logarithmic scale, with the principal and secondary peaks more prominent for higher categories of tornadoes.
The middle panel of the mean green corona intensity from Fig. 1a is used to show the inverse correlation between the cumulative numbers of tornadoes and the mean IGC at heliographic latitude 0° (shown in white line). The values of the cross-correlation coefficient (0.5 or higher) between the mean IGC and the cumulative numbers of all tornadoes, tornadoes in large outbreaks, and upper categories of tornadoes, are printed.
The peaks that are found in cumulative tornado counts (Fig. 2a, b) are also prominent in the statistics of fatalities (Fig. 2c) and injuries (Fig. 2d) for all tornadoes and large outbreaks. Also, there is a good correspondence (anti-correlation) between the primary and secondary peaks in the cumulative numbers of fatalities/injuries and the minima in the mean IGC. The values of the cross-correlation coefficient between the cumulative numbers of fatalities/injuries and the mean IGC at heliographic latitude 0° are similar or slightly higher than for the tornado counts.
3.2 Interpretation of the SPE analysis results
The SPE analysis of time series of green corona at the solar central meridian and solar wind plasma variables measured upstream from the Earth, keyed to HCS crossings (Fig. 1a and b), shows expected results of the superposition of coronal holes and HSSs, respectively. HCSs typically closely precede, or coincide with, the fast/slow stream interfaces in CIRs. Coronal holes and the associated HSSs often recur with the solar rotation period, which is shown by the SPE analysis extended to ±30 d from the key time.
The cumulative numbers of tornadoes relative to HCS crossing (Fig. 1c) show not only the primary peaks near the key time for all tornadoes and the upper category tornadoes but also secondary peaks near ±27 epoch days from the key time, indicating the association with HCS/CIRs at the leading edge of HSSs from recurrent coronal holes. The correlation between the mean IGC and cumulative numbers of tornado/fatalities/injuries further supports the link between solar wind and tornado occurrence.
These results are similar to previously published results that found a link between HCS and upper-tropospheric vorticity (Prikryl et al., 2009b; their Fig. 3), and between HCS/CIR/HSSs and heavy precipitation occurrence (Prikryl et al., 2021b, their Figs. 6 and 9, 2021a, their Figs. 7, 9 and 10).
Although not all CIRs are accompanied by HCSs, the high-density plasma (HDP) ahead of HCS/CIRs leads to magnetic field compression that can cause recurring geomagnetic storms (Tsurutani et al., 1995, 2006b). The geomagnetic effectiveness of interplanetary coronal mass ejections (ICMEs) has been well known (Gosling et al., 1991). Richardson et al. (2000, 2001) assessed the contributions to geomagnetic activity and relative importance of ICMEs and HSS/CIRs. Richardson (2006) pointed out that an interaction of HSS with a preceding, slower ICME may enhance the geo-effectiveness of the ICME. In the next Sect. 3.3, we investigate the occurrence of large tornado outbreaks in the context of different types of solar wind disturbances.
3.3 Occurrence of large tornado outbreaks in the context of solar wind
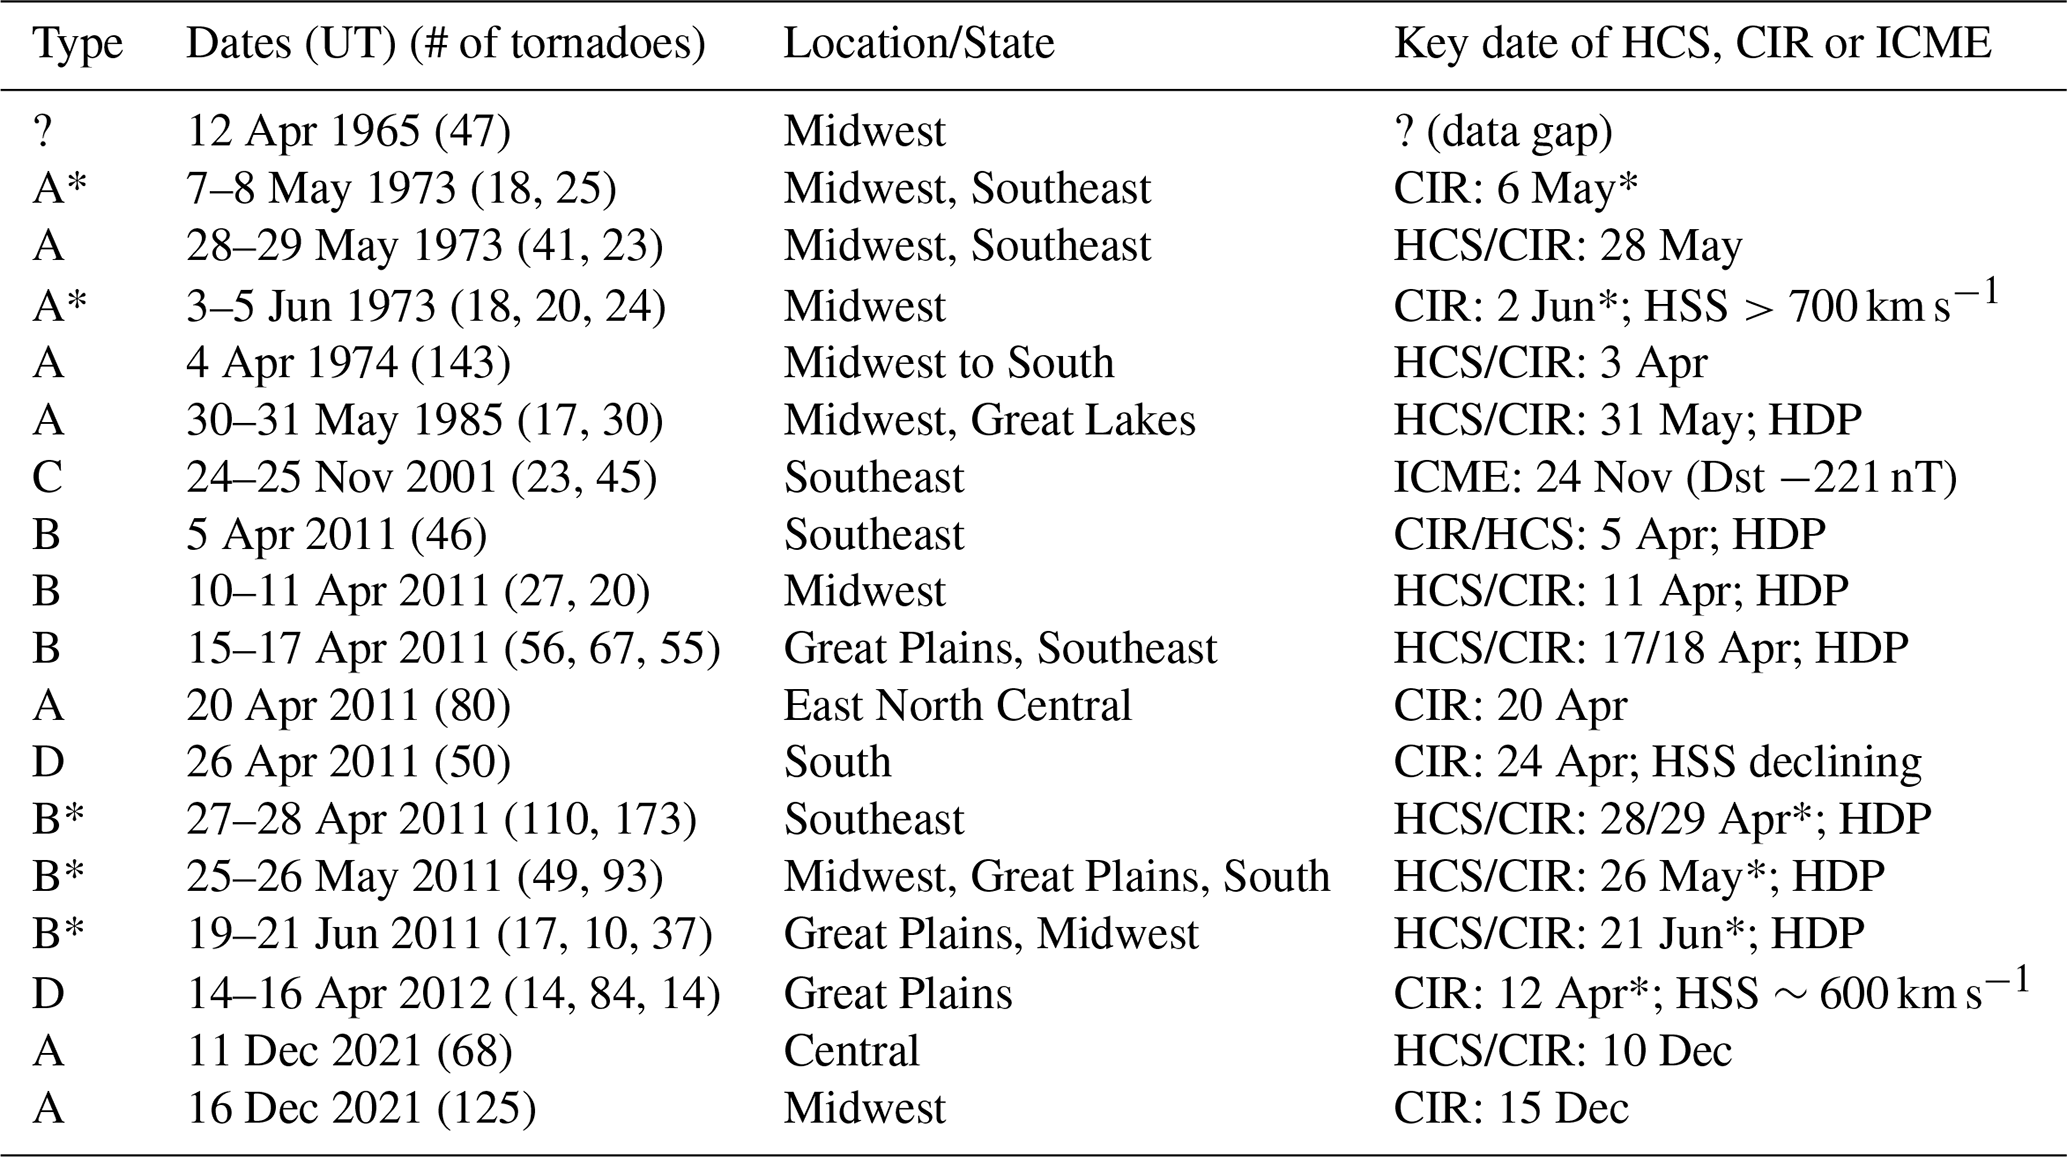
Large tornado outbreaks are associated with different types of solar wind disturbances: large tornado outbreaks that closely followed CIR (Type A); closely preceded HCS/CIR associated with HDP, including transient HCS (Type B); closely followed impacts of ICME (Type C); and tornado outbreaks that occurred in the declining phase of major HSS (Type D). The cases of large tornado outbreaks discussed in this section are listed in Table 1. The columns show the assigned group (Type), the outbreak dates with the 24 h tornado counts centered on 00:00 UT ±12 h in parentheses, the principal location, and the key dates of HCS, CIR or ICME, along with notes on the presence of HDP, maximum HSS velocity, or geomagnetic storm index Dst in cases of ICMEs. A complete list of large tornado outbreaks along with references to solar wind disturbances and assigned groups can be viewed in Table S1 in the Supplement.
Table 1Large tornado outbreaks (* recurrent). Tornado daily counts centered on 00:00 UT ±12 h for the given dates are shown in parentheses.
Figures 3 and S1 illustrate this classification of large tornado outbreaks based on their occurrence in the context of solar wind. Figure 3 shows solar wind variables V (solid black line), B (red), np (broken light blue line), (dotted purple line) with the y-axis scales shown on the left, and the magnetic field direction longitude (orange crosses) with the y axis shown on the right. The symbols on the time axis indicate the times of HSS/CIRs arrivals, impacts of ICMEs, and the IMF sector boundary/HCS crossings. Where available, the proxy magnetic field sectors (A: away, T: toward) are shown on the time axis. Hourly counts of tornadoes are plotted at the top of each panel, with daily numbers of tornadoes centered at 00:00 UT printed. Large tornado outbreaks of Type A, B, C, and D are highlighted.
In April 2011 (Fig. 3a), when many tornado outbreaks occurred, the first three Type-B outbreaks closely preceded HCS, including transient HCS (5 and 16 April). A Type-A outbreak on 19/20 April followed HSS/CIR arrival. The large outbreaks on 26–28 April are less clearly separable into Type D and B. Figure 3f shows a typical Type-D outbreak that occurred in the body of a major HSS, as the solar wind velocity started to decline. Figure 3g, in addition to a case of Type A outbreak shows one case of Type-C outbreak that closely followed the impact of a strong ICME on 24 November 2001.
Four most severe tornado outbreaks in the period between 1963 and 2011 were ranked by Doswell et al. (2012; their Fig. 3) using a method for ranking severe weather outbreaks (Shafer and Doswell, 2010). Two of these outbreaks are classified as Type A: Super Outbreak on 3–4 April 1974 (Fig. 3b), discussed in more detail by Corfidi et al. (2010), and the U.S.-Canada tornado outbreak on 31 May 1985 (Fig. 3e) (Witten, 1985; Fujita and Stiegler, 1985). Third outbreak is classified as Type B: Super Outbreak on 27–28 April 2011 (Fig. 3a) (Knox et al., 2013). During the fourth outbreak (Palm Sunday tornado outbreak on 11–12 April 1965), there were no solar wind data available, and the proxy IMF polarity (Svalgaard, 1975) did not indicate SB/HCS. However, a minor geomagnetic storm occurred on April 11 with auroral activity AE index reaching 520 nT, indicative of a possible HSS/CIR. In 1974, in addition to the 3–4 April tornado outbreak of Type A Fig. 3b and c show two large tornado outbreaks of Type B on 2 April and 8 June. A major tornado outbreak on 28 March 1984 (Fig. 3d) (Klingler and Smith, 1984; Fujita and Stiegler, 1985; Witten, 1985) was closely associated with HSS/CIRs arrivals (Type A).
Figure 3h shows rare winter tornado outbreaks that occurred on 10–11 and 16 December 2021. The first, likely the deadliest outbreak, closely followed the arrival of a strong HCS/CIR at the leading edge of a minor HSS, thus classified as Type-A outbreak. The tornado outbreak started in the local night hours and all tornadoes occurred after 00:00 UT on 11 December. Five days later another large outbreak followed the arrival of a major HSS/CIR on December 15. More examples of large tornado outbreaks coinciding with solar wind disturbances of Type A–D can be viewed in Fig. S1 in the Supplement.
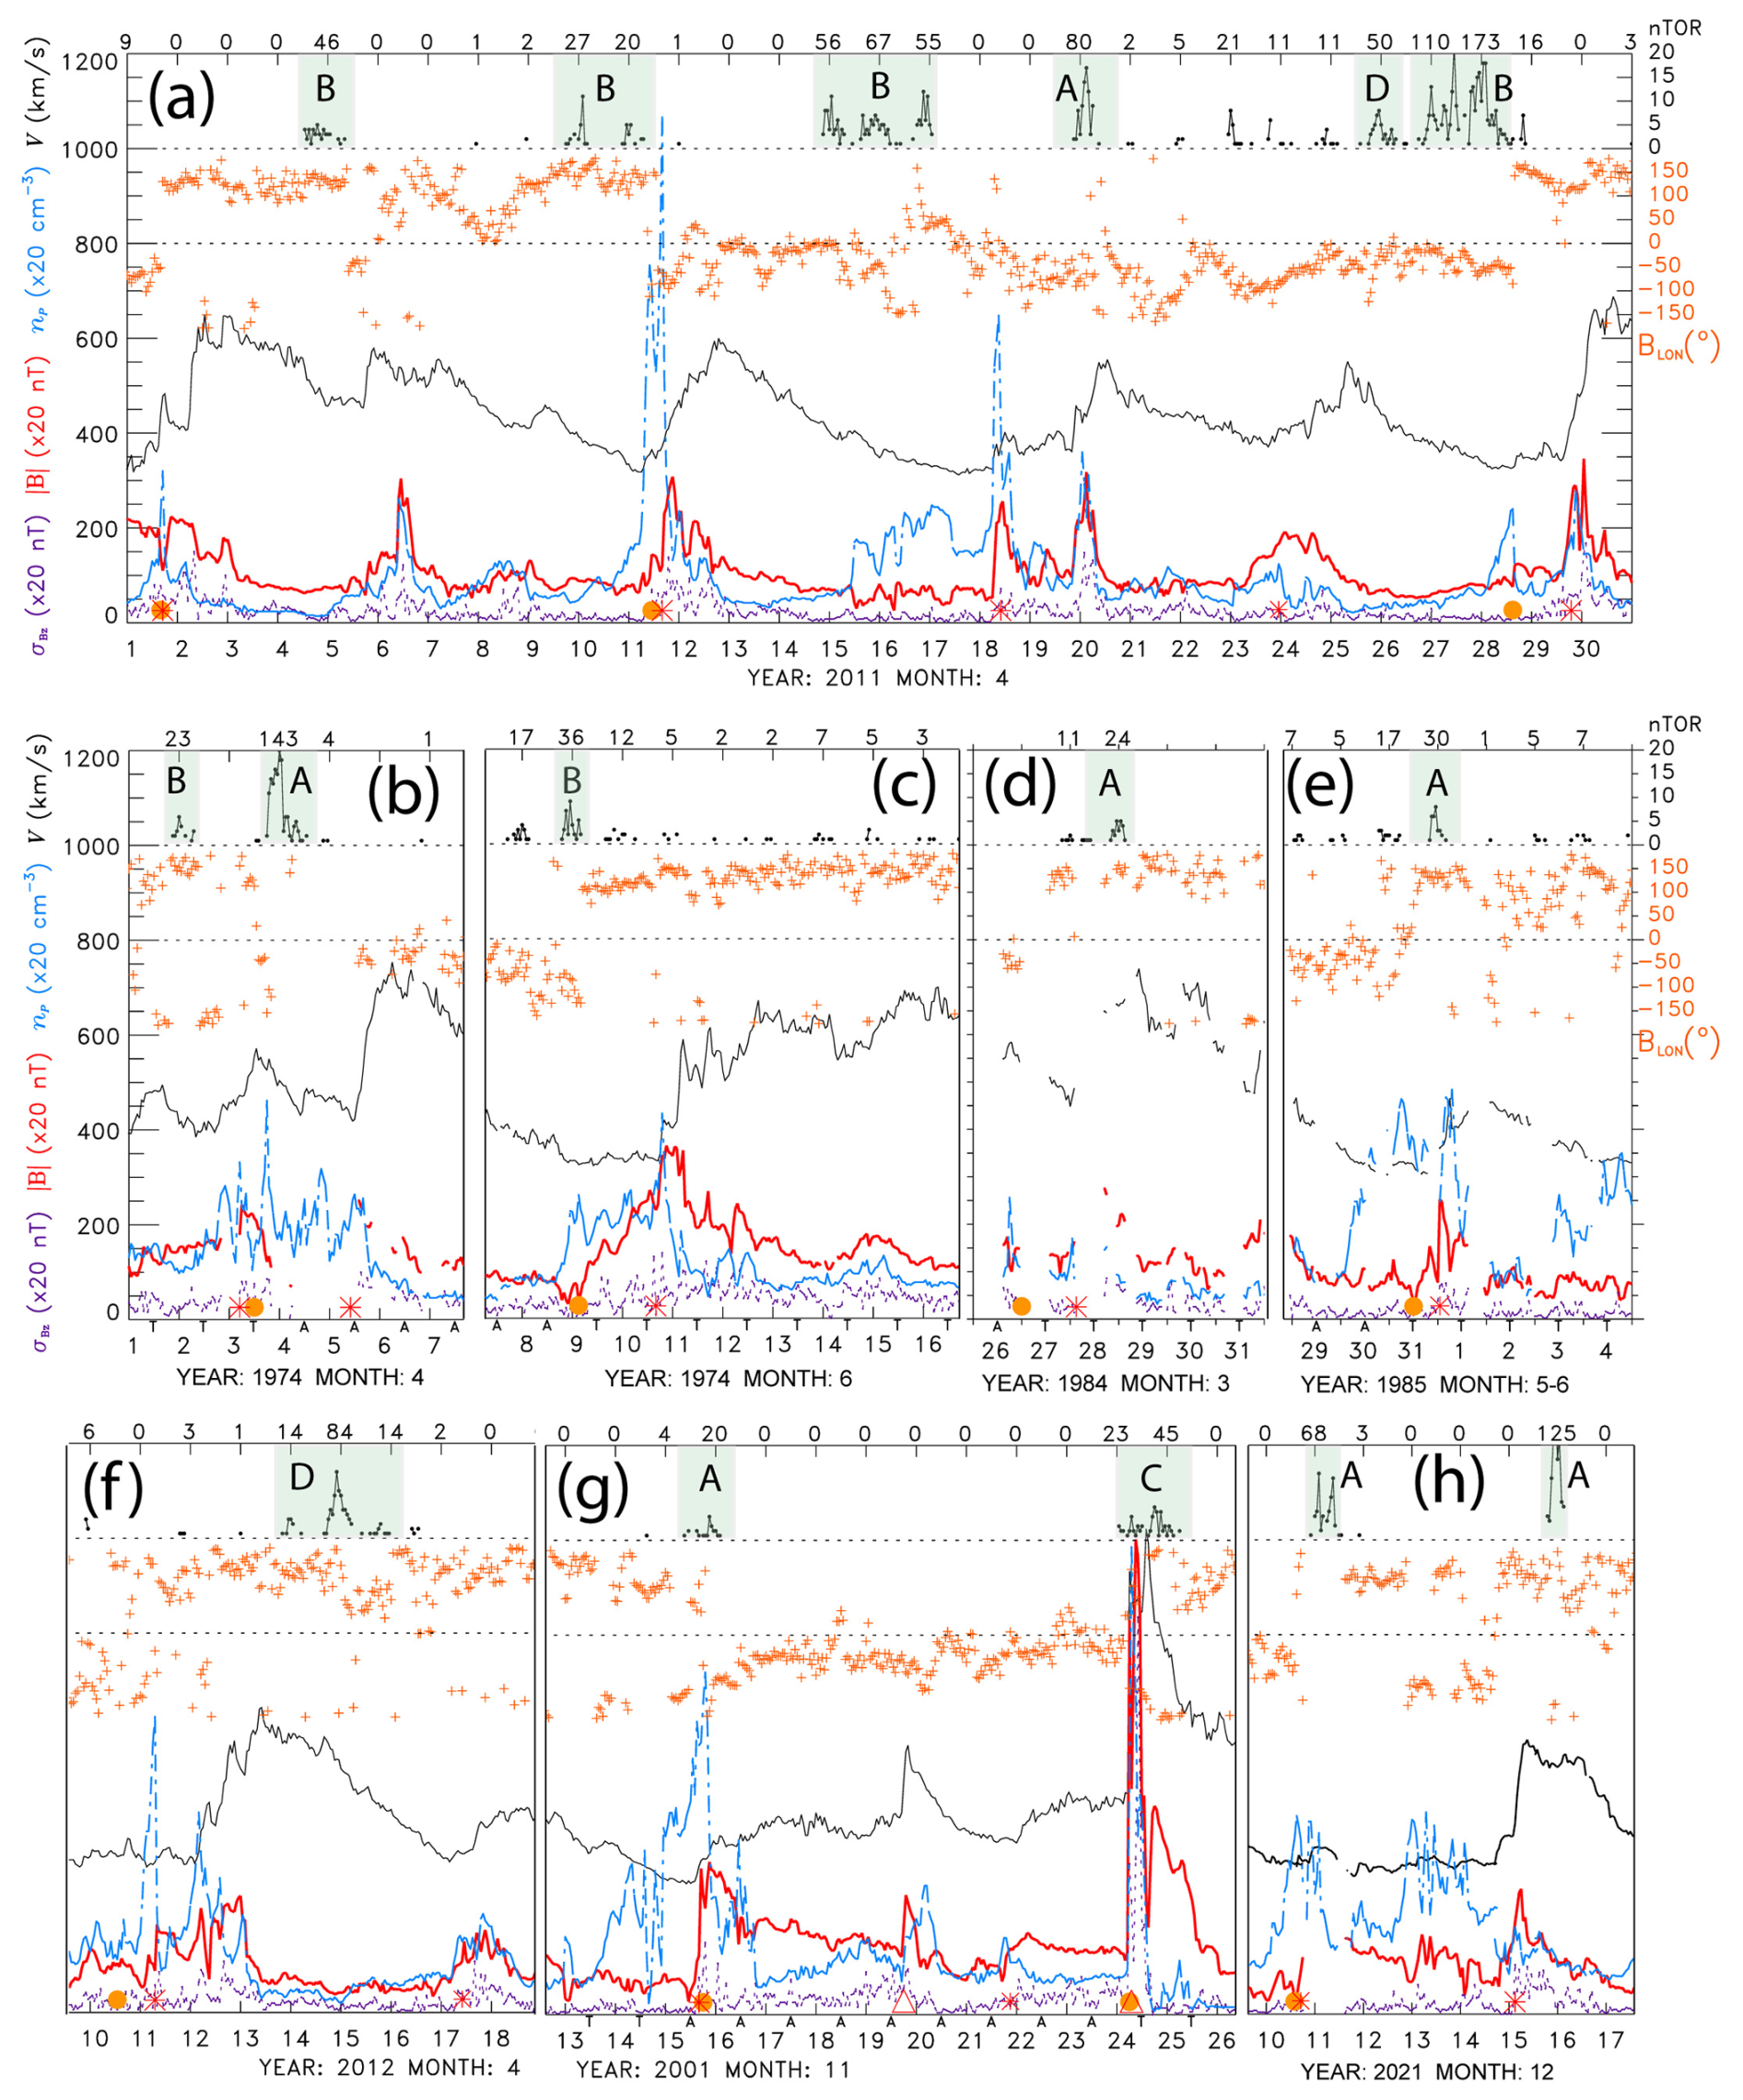
Figure 3The OMNI solar wind data along with tornado counts are shown for periods in (a) April 2011, (b) April 1974, (c) June 1974, (d) March 1984, (e) May–June 1985, (f) April 2012, (g) November 2001, and (h) December 2021. The solar wind V (solid black line), B (red), np (broken light blue line), (dotted purple line) with the y axis scales shown on the left, and the magnetic field direction longitude (orange crosses) with the y axis shown on the right. The symbols at the time axis indicate (red *) CIRs, (red Δ) ICMEs, (orange •) HCS crossings, and where available, the proxy magnetic field sectors (A: away, T: toward). Hourly counts of tornadoes are plotted at the top of each panel, with daily numbers of tornadoes centered at 00:00 UT printed. Large tornado outbreaks are highlighted and labeled as Type A–D.
3.3.1 Recurrent tornado outbreaks
The SPE results shown in Fig. 1 suggest a possibility of tornado outbreak recurrence with the solar rotation period. While the peaks in the cumulative numbers of tornadoes close to ±27 epoch days (Fig. 1) are partly due to the same tornado outbreaks as those contributing to the main central peak (because of recurrent coronal holes, HCS crossings and HSS/CIRs), there are cases of genuine recurrent occurrences of large tornado outbreaks associated with recurrent HSSs. The large outbreaks of tornadoes that recurred approximately with a period of solar rotation occurred in 1973 and 2011 are marked with asterisks in Table 1. For example, large tornado outbreaks of Type A in 1973 on 7–8 May and 3–5 June were associated with the same recurrent HSS (Fig. S1). In 2011, large tornado outbreaks of Type B on 27–28 April (Fig. 3e), 25–26 May and 19–21 June (Table 1) were associated with high-density plasma and HCS ahead of the same recurrent HSS. Other cases of recurrent tornado outbreaks are shown in Fig. S1 and listed in Table S1 in the Supplement.
3.3.2 SPE analysis of solar wind plasma variables for large tornado outbreaks
Figure 4 shows the SPE analysis of solar wind plasma variables and daily tornado occurrence keyed to CIR, HCS/HDP, ICME impact, and arrival of major HSS, associated with tornado outbreaks of Type A (30 %), B (32 %), C (10 %) and D (19 %), respectively. Remaining cases of large tornado outbreaks (9 %) could not be associated with any specific solar wind disturbances, mostly because of solar wind data gaps. The peaks in cumulative numbers of tornadoes reflect the adopted classification of tornado outbreak occurrence, mainly Type A and B (Fig. 4a and b). For Type A, B and D, the corresponding patterns of mean solar wind variables are like those shown in Fig. 1b for key time ±6 epoch days. For Type B, there is a broader density peak indicating the superposition of HDP ahead of HCSs. For Type C (Fig. 4c), as expected for interplanetary shocks ahead of ICMEs, the mean values of all four solar wind variables sharply increase at the key time. For Type D (Fig. 4d) the maximum mean velocity is the highest indicating major HSSs. As in Fig. 1c, the results of the simulated SPE analyses of cumulative numbers of tornadoes repeated 100 times for each group using randomly chosen key times are shown by dots with the mean and standard deviation overlaid.
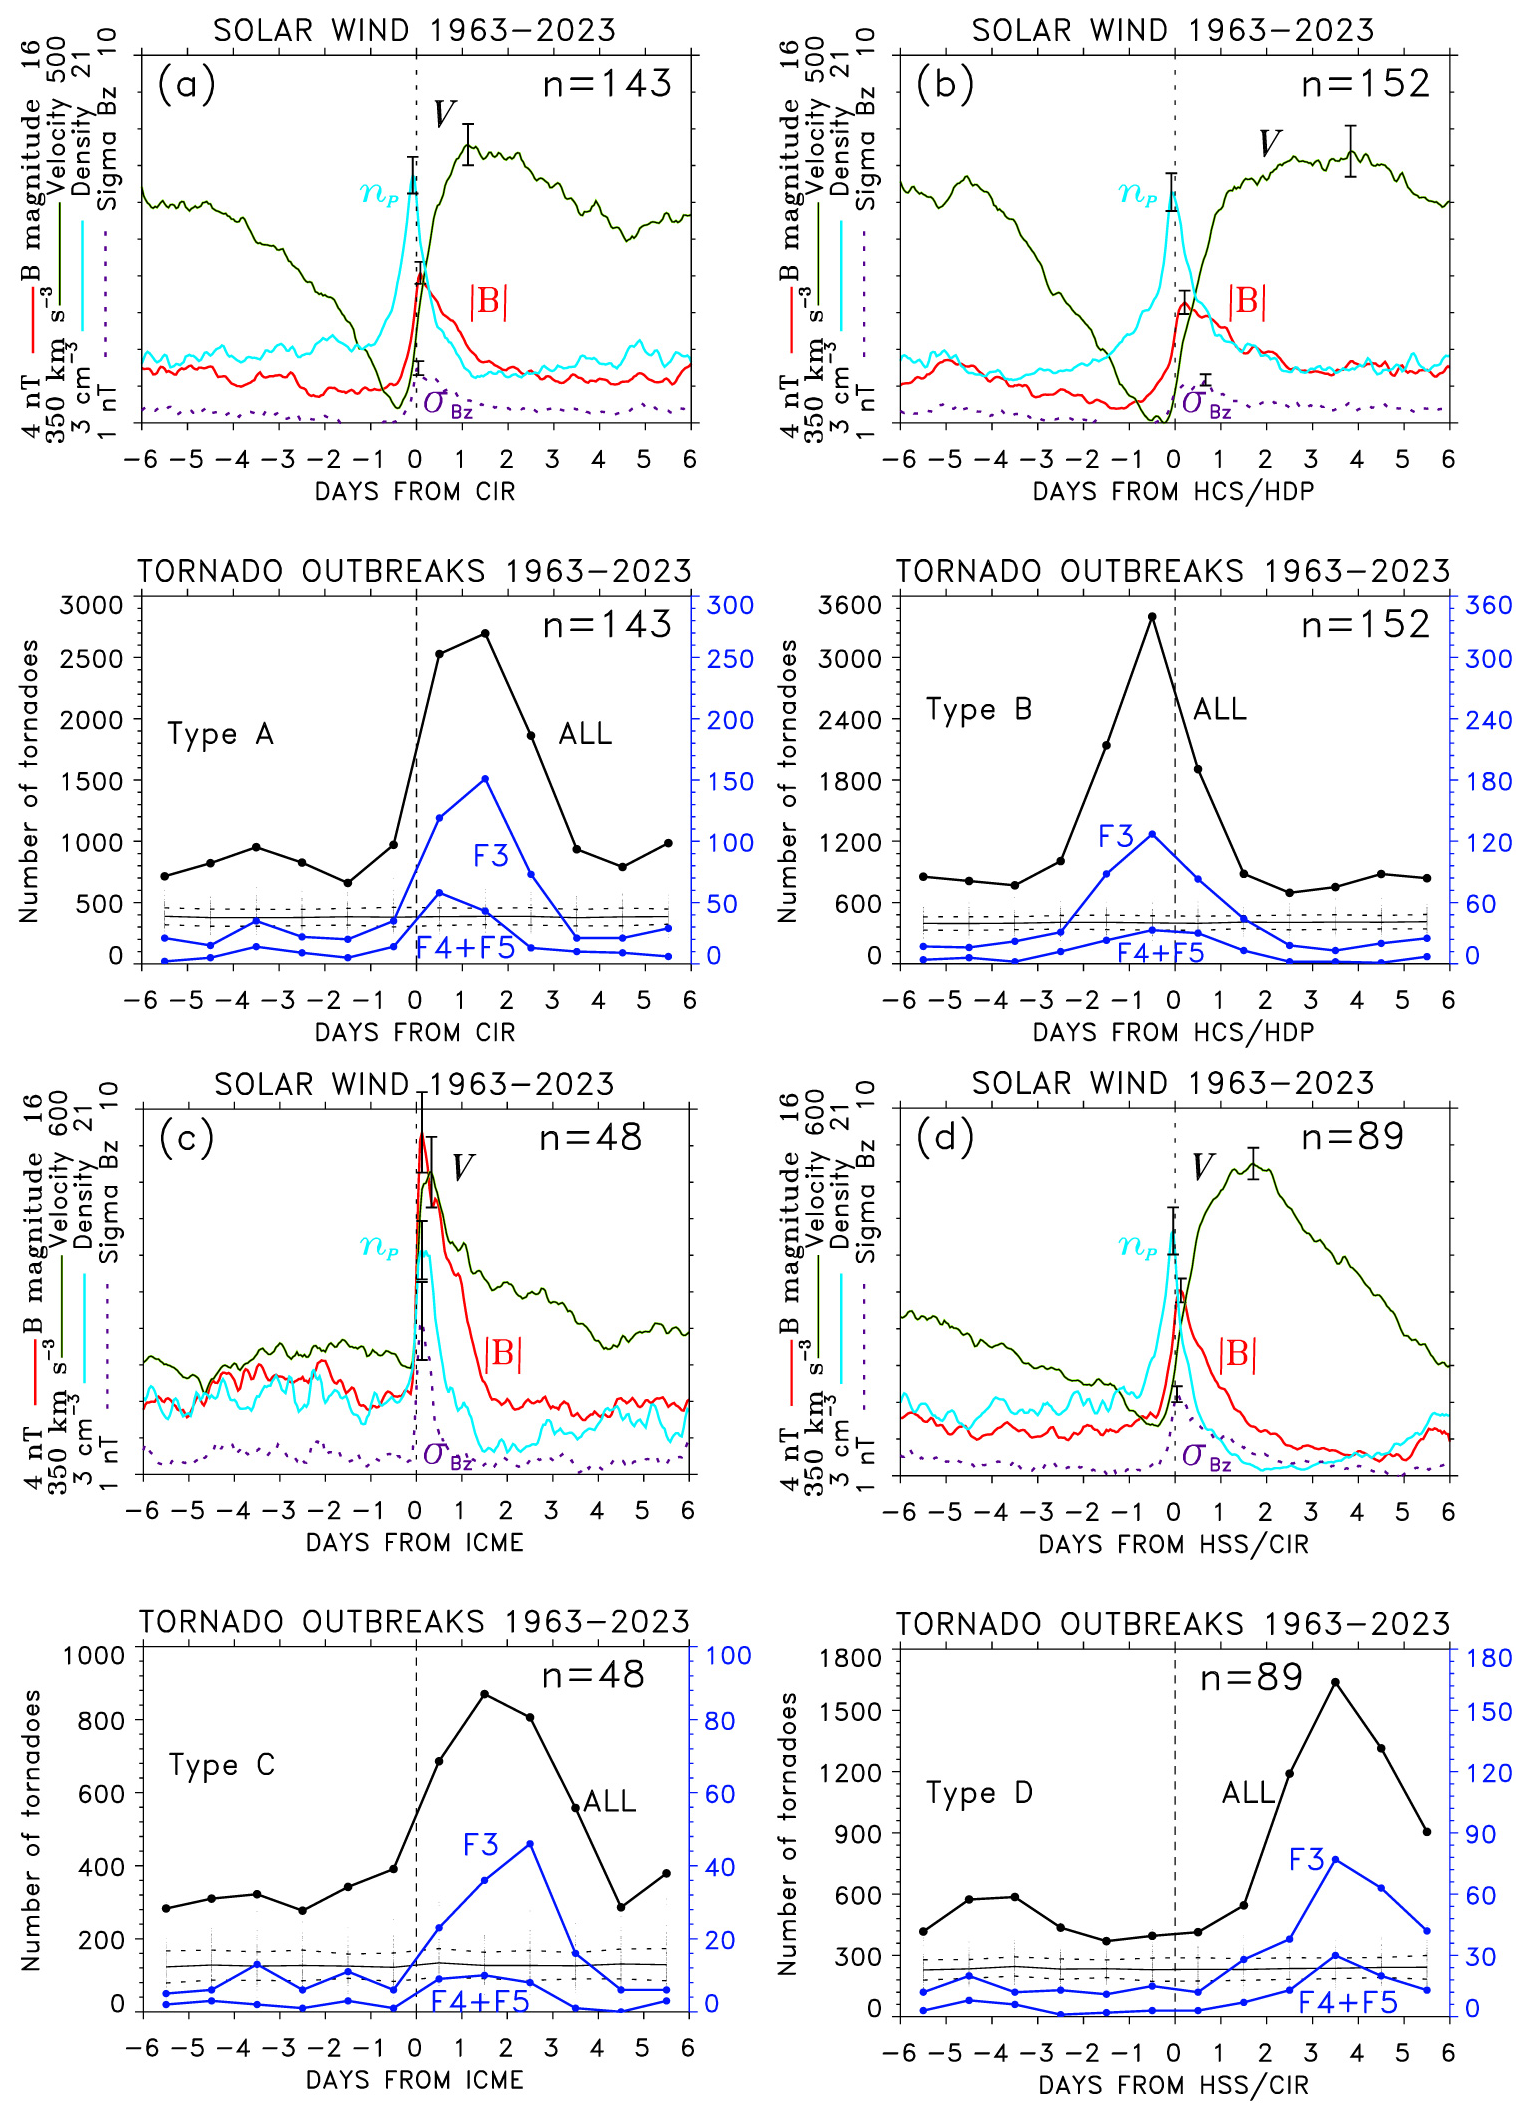
Figure 4The SPE analysis of time series of solar wind plasma variables and tornado occurrence keyed to (a) CIR, (b) HCS/HDP, (c) ICME impact, and (d) arrival of major HSS associated with large tornado outbreaks of Type A, B, C and D, respectively. The results of the simulated SPE analysis of cumulative numbers of tornadoes repeated 100 times using randomly chosen key times are shown by dots, with the mean (thin solid line) and ± standard deviation (dashed lines) overlaid.
As discussed in Sect. 3, large outbreaks of tornadoes appear to show a strong tendency to be associated with solar wind disturbances of different type: CIRs at the leading edge of HSSs (Type A), high-density plasma adjacent to the HCS (Type B), impacts of ICMEs (Type C), and major HSSs in their declining phase (Type D). This implies not only different solar wind structure associated with these disturbances but could be indicative of potentially different solar wind – MIA coupling and physical mechanism how the solar signal is transmitted to the troposphere, if it leads to increased tornado occurrence. It seems that solar signal transmission to the troposphere differs in timing (preceding HCS versus following CIR arrivals or ICME impacts), which could indicate electrostatic versus and geomagnetic coupling, as discussed below.
A link between HCS and upper-level tropospheric vorticity that has been discovered in the 1970s by Wilcox et al. (1973, 1974) has become known as “Wilcox effect”. Tinsley and Deen (1991) proposed a mechanism in which ionization in the lower atmosphere due to the flux of precipitating relativistic electrons affects cloud microphysics, namely, the nucleation and/or growth rate of ice crystals in high-level clouds. Aiming to explain the “Wilcox effect”, Tinsley et al. (1994) linked the global atmospheric electric circuit (AEC) and changes in relativistic electron precipitation to cloud microphysics. Recently, Tinsley (2023, 2024) further discussed the link between space weather and the global AEC, with the relevance to tropospheric weather and climate. Tsurutani et al. (2016) showed that the high-density plasma sheet impinging onto the magnetosphere results in the precipitation of magnetospheric relativistic electrons and considered importance of the energy deposited in the mesosphere and middle atmosphere. In the case of Type B tornado occurrence, the primary mechanism could be electrostatic coupling between the ionosphere and troposphere mediated through the global AEC and changes in the electric field.
On the other hand, the geo-effectiveness of ICMEs and HSSs/CIRs has been well established (Lindsay et al., 1995; Zhao and Webb, 2003; Tsurutani et al., 2006a, b; Zhang et al., 2007), which indicates that auroral activity potentially plays major role in the cases of Type A, C and D tornado occurrence. Solar wind HSSs are associated with high-intensity, long-duration continuous auroral electrojet activity (HILDCAAs) that includes auroral substorms (Tsurutani and Gonzalez, 1987; Tsurutani et al., 1990, 1995). HILDCAAs are caused by trains of solar wind Alfvén waves (Belcher and Davis, 1971) that couple to the magnetosphere-ionosphere system (Dungey, 1961, 1995). This coupling extends to the neutral atmosphere because it is a major source of large-amplitude aurorally excited gravity waves that can reach the troposphere with much attenuated amplitudes but can contribute to conditional symmetric instability release (Prikryl et al., 2009a; Prikryl, 2024). Given that a strong vertical wind shear environment is expected to play a role during tornadic activity (Púčik et al., 2021), over-reflecting AGWs may lead to intensification of extratropical cyclones and influence the development of synoptic-scale conditions favoring formation of supercells that spawn tornadoes.
The auroral electrojet currents have long been recognized as sources of medium- to large-scale AGWs (e.g., Hines, 1965; Chimonas and Hines, 1970; Hocke and Schlegel, 1996) propagating globally from sources in the lower thermosphere (Richmond, 1978; Hunsucker, 1982; Mayr et al., 1984a, 1990, 2013). They have been observed in the ionosphere as traveling ionospheric disturbances (TIDs), both on the dayside and nightside, using various techniques, including HF radars, ionosondes, and GPS TEC measurements (Hunsucker, 1982; Crowley and Williams, 1987; Crowley and McCrea, 1988; Samson et al., 1989; Bristow et al., 1996; Afraimovich et al., 2000; Cherniak and Zakharenkova, 2018).
The gravity wave dispersion relation (Hines, 1960) allows both upward group (downward phase) and downward group (upward phase) propagation and can be used for ray tracing of aurorally generated gravity waves (see, e.g., Prikryl et al., 2005, 2009a, 2016, and references therein). Using the Transfer Function Model (TFM), Mayr et al. (1984a, b, 1990, 2013) described gravity wave response in the atmosphere and showed that propagating waves originating in the thermosphere can excite a spectrum of AGWs in the lower atmosphere. The ray tracing method and the TFM simulations showed that the aurorally generated AGWs can reach the troposphere (Prikryl et al., 2016, 2018). Theoretical analysis of AGWs propagation in the lower atmosphere using an expansion in three-dimensional normal mode functions showed that the waves can reach the troposphere with attenuated amplitudes (Hagiwara and Tanaka, 2020). Waves encountering opposing winds may be reflected (Pitteway and Hines, 1965; Cowling et al., 1971). At the reflection point, the refractive index and vertical wavelength become imaginary, but the associated evanescent wave can tunnel through the reflection layer, transferring energy below it (Prikryl et al., 2005; their Appendix A). A wave incident upon a shear layer will over-reflect (reflection coefficient >1) if the wind velocity in the shear layer exceeds the horizontal phase speed of the wave and Richardson number is less than a critical value. The reflected gravity wave will then be amplified by extracting energy from the wind (Jones, 1968; McKenzie, 1972; Eltayeb and McKenzie, 1975). The latter authors also indicated that wave amplification can lead to instability if the boundary conditions are altered in such a way that the system behaves like an `amplifier'. Related problems of instability and over-reflection of internal gravity waves at a critical level were further addressed in another study (Lindzen and Barker, 1985).
Although the solar wind–MIT coupling generating AGWs and the electrostatic coupling between the ionosphere and troposphere mediated through the global AEC are different physical mechanisms, both can influence tropospheric weather development, and likely can work in synergy (Prikryl et al., 2009b) to enhance convection that may lead to increased tornado occurrence.
Chen et al. (2018) assessed CSI and slantwise convection in frontal zones of extratropical cyclones using ERA-Interim reanalysis data. The warm and cold frontal zones are regions where slantwise convection is likely (Chen et al., 2018). In a case study, Emanuel (1983) assessed moist symmetric instability in the cold frontal zone of a rapidly intensifying extratropical cyclone on 2–3 December 1982. Chen et al. (2018; their Fig. 7) revisited this and other observational cases associated with slantwise convection in the regions where slantwise convective available potential energy (SCAPE) was greater than CAPE. A tornado outbreak in Arkansas and Missouri occurred in the frontal zone of an intensifying extratropical cyclone characterized by large SCAPE and low-level southerly winds. The tornado outbreak (Type B) was associated with the HCS observed on 3 December (Table S1 in the Supplement), just prior to the arrival of HSS/CIR from a coronal hole that passed the solar meridian on 30 November 1982.
To evaluate the likelihood of slantwise convection in the cases of large tornado outbreaks in December 2021 several indices, including SCAPE, fractional SCAPE residual () and vertically integrated extent of realizable symmetric instability (VRS) (e.g., Glinton et al., 2017; Chen et al., 2018), are calculated based on the ERA5 reanalysis. High SCAPE, indicating high convective available potential energy for a slantwise ascending air parcel from the low levels, is found in the cold and warm frontal sectors of the cyclones on 11 and 15 December (Fig. 5a). A closer-to-one fs indicates the relative dominance of slantwise over upright convection (Fig. 5b). In Fig. 5c, VRS shows the thickness of air layer (measured in pressure) where conditional symmetric instability (CSI), high relative humidity, and vertical motion coexist (Chen et al., 2018). Start locations of tornadoes that are overlayed in Fig. 5 map to regions of high SCAPE, a closer-to-one fs, and enhanced VRS. The tornado outbreaks occurred in regions of low-level southerly winds and high vertical wind shear (Fig. 5d), which are the conditions conducive to over-reflection of down-going AGWs encountering opposing wind and vertical wind shears, as discussed in Sect. 4. Other cases of large tornado outbreaks in frontal zones of extratropical cyclones are shown in Fig. S2 in the Supplement.
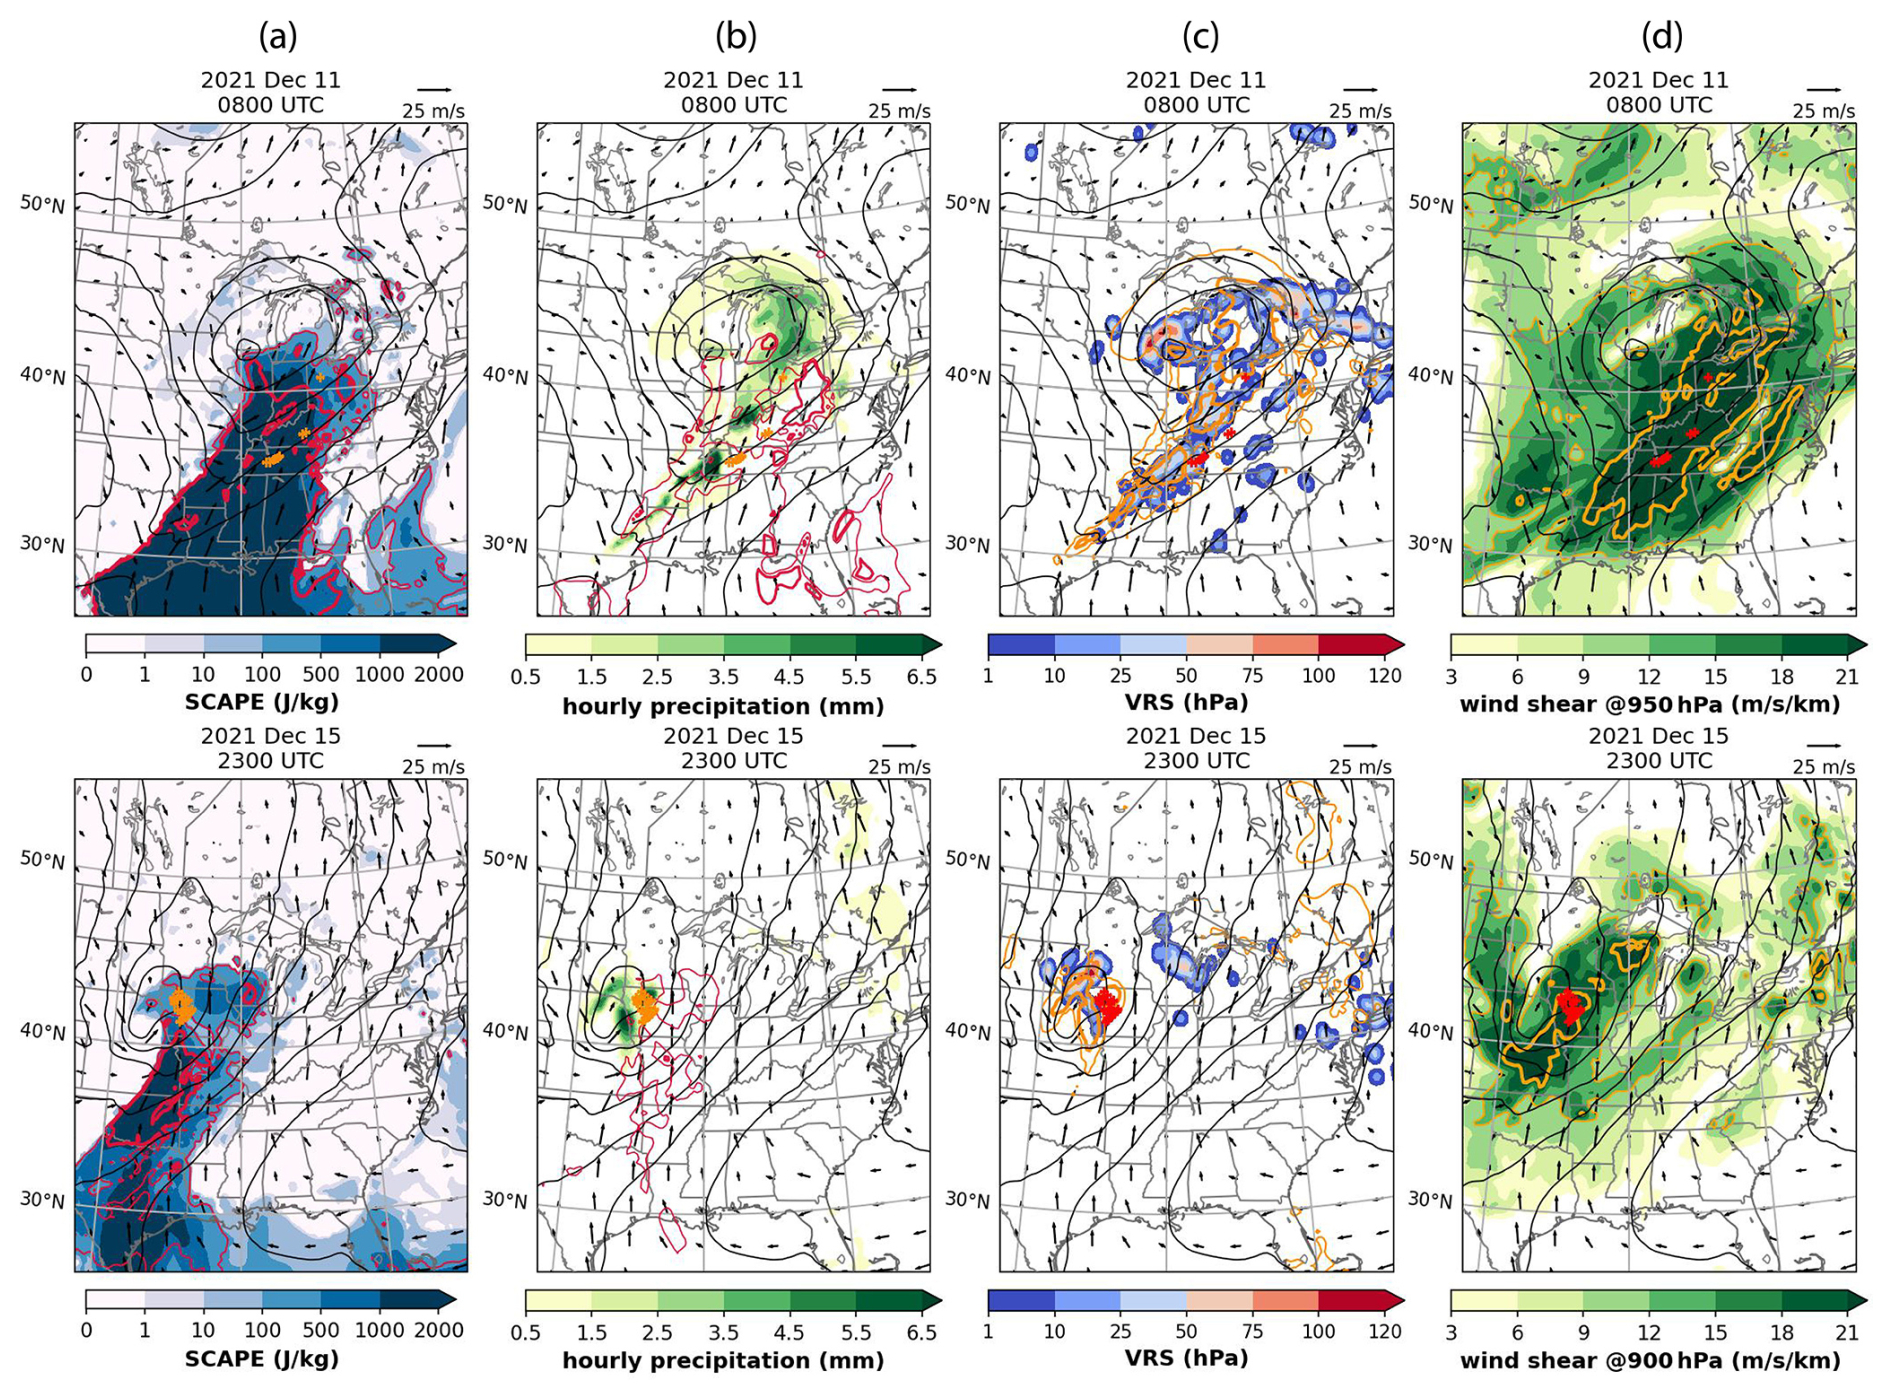
Figure 5(a) SCAPE (shaded), SCAPE-CAPE (red contours; 100, 300, 500 J kg−1), (b) 1 h accumulated precipitation (shaded), fs (red contours; thin for 0.5, thick for 0.8), (c) VRS (shaded), precipitation (yellow contours; 0.5, 5.5 mm h−1), (d) low-level wind shear (yellow contour; 12, 21 m s−1 km−1). (a–d) All overlapped with 950 hPa wind (vectors; m s−1), 950 hPa geopotential height (black contours; m; at intervals of 50 m). Tornado locations are shown by orange or red crosses.
Slantwise convection is not a necessary condition directly influencing tornado development that requires vertically extended supercells, which means strong CAPE but not necessarily SCAPE. However, the CSI release is known to lead to extratropical cyclone intensification, to which the auroral AGWs can contribute (Prikryl, 2024). Many studies have demonstrated that synoptic-scale processes play a major role in the occurrence or absence of tornado outbreaks (Shafer et al., 2009; Mercer et al., 2009, 2012). Tochimoto and Niino (2016) examined the structural and environmental characteristics of extratropical cyclones that cause tornado outbreaks in the warm sector where atmospheric instability, low-level southerly winds and vertical shear are strong. This is also the region where we find evidence for CSI and slantwise convection during large tornado outbreaks.
According to Bunkers et al. (2000) more than 90 % of supercells are associated with severe weather, and most strong tornadoes are produced by supercells in a strong wind shear environment (e.g., Moller et al., 1994; Davies-Jones, 2015). Bunkers et al. (2000) presented a method for predicting right- and left-moving supercell motions that have become important in the operational forecasting focused on storm-relative helicity as a measure of supercell rotation and tornadic potential (e.g., Davies-Jones, 1984; Davies-Jones et al., 1990). Tables A1 and A2 (Bunkers et al., 2000) list 39 right-moving and 23 left-moving supercell occurrences from 1962 to 1998. Almost all tornadoes are known to be produced by right-moving supercells that are also more frequent in the United States, while left-moving supercells produce significantly fewer tornadoes (Bunkers et al., 2000; Bunkers, 2002).
We now use the dates/times of these supercell cases as key times in the SPE analysis of green corona intensity IGC (Fig. 6a), solar wind variables (Fig. 6b), and daily tornado counts (Fig. 6c). For both right- and left-moving supercells included, Fig. 6b shows the mean solar wind velocity increasing from a minimum to a maximum after the key time, while the mean solar wind proton density and magnetic field peak just before and near the key time, respectively. This pattern that is like those discussed in Sect. 3 (Figs. 1b and 4a) is a result of the superposition of CIRs at the leading edge of HSSs, which indicates a strong tendency of these supercells to have developed following arrivals of HSS/CIRs from coronal holes (superposed in Fig. 6a). While most of the supercells were associated with HSS/CIR arrivals, a few followed ICME impacts, and several supercells coincided or closely preceded HCSs. The cumulative numbers of tornadoes that peak on epoch day 0 (Fig. 6c) include all tornadoes in the U.S., not only those that would be produced by the supercells used in this analysis. These results are very similar for left- and right-moving supercells separately, except that cumulative numbers of tornadoes are lower in the case of left-moving supercells (see Fig. S3 in the Supplement).
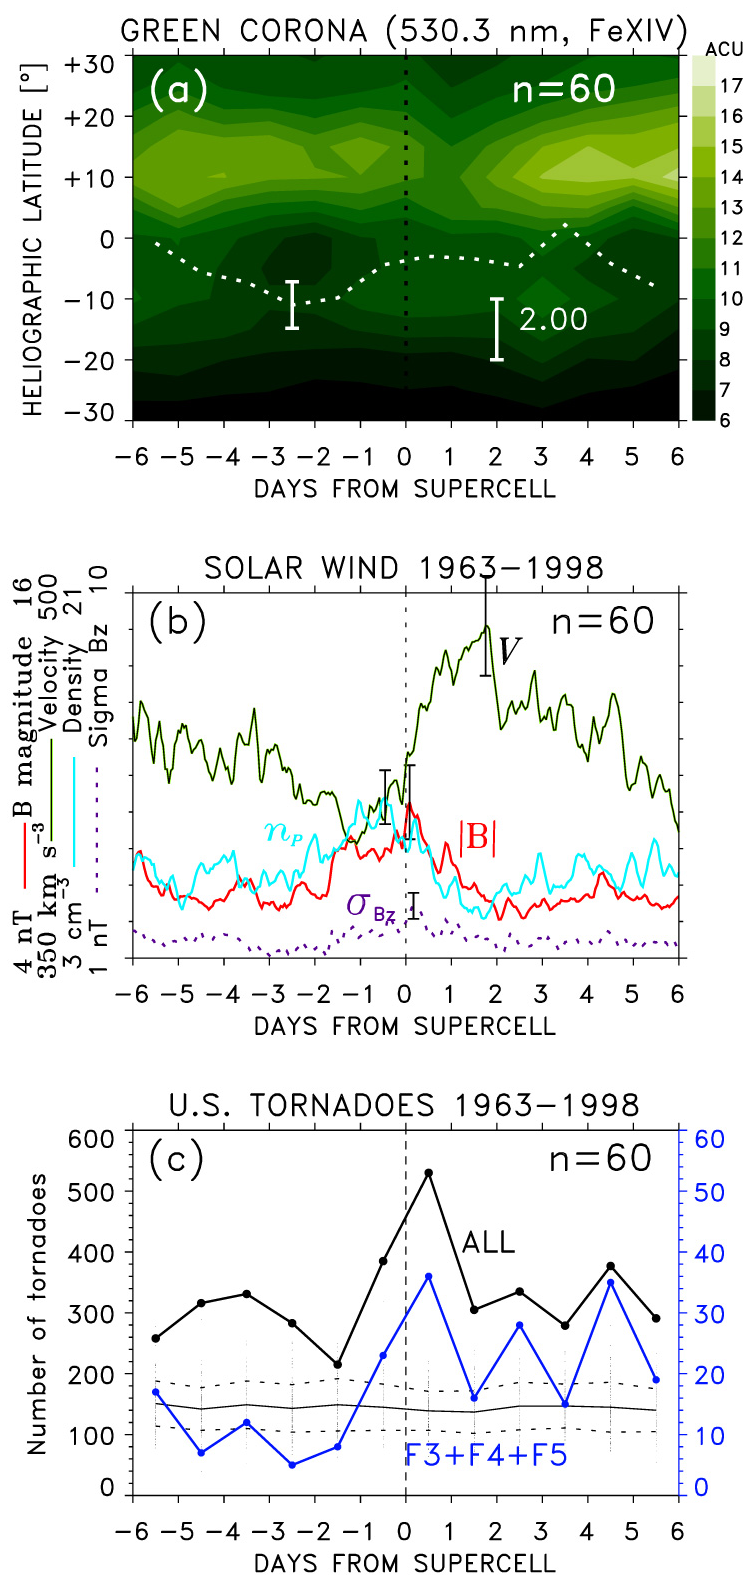
Figure 6SPE analysis of time series of (a) green corona intensity IGC (the mean IGC at heliographic latitude −5°, with the mean value over the period of 12 d subtracted, is shown by a white dotted line), (b) solar wind plasma variables, and (c) U.S. tornado counts, keyed to times of right- and left-moving supercells. The results of the simulated SPE analysis of cumulative numbers of tornadoes repeated 100 times using randomly chosen key times are shown by dots, with the mean (thin solid line) and ± standard deviation (dashed lines) overlaid.
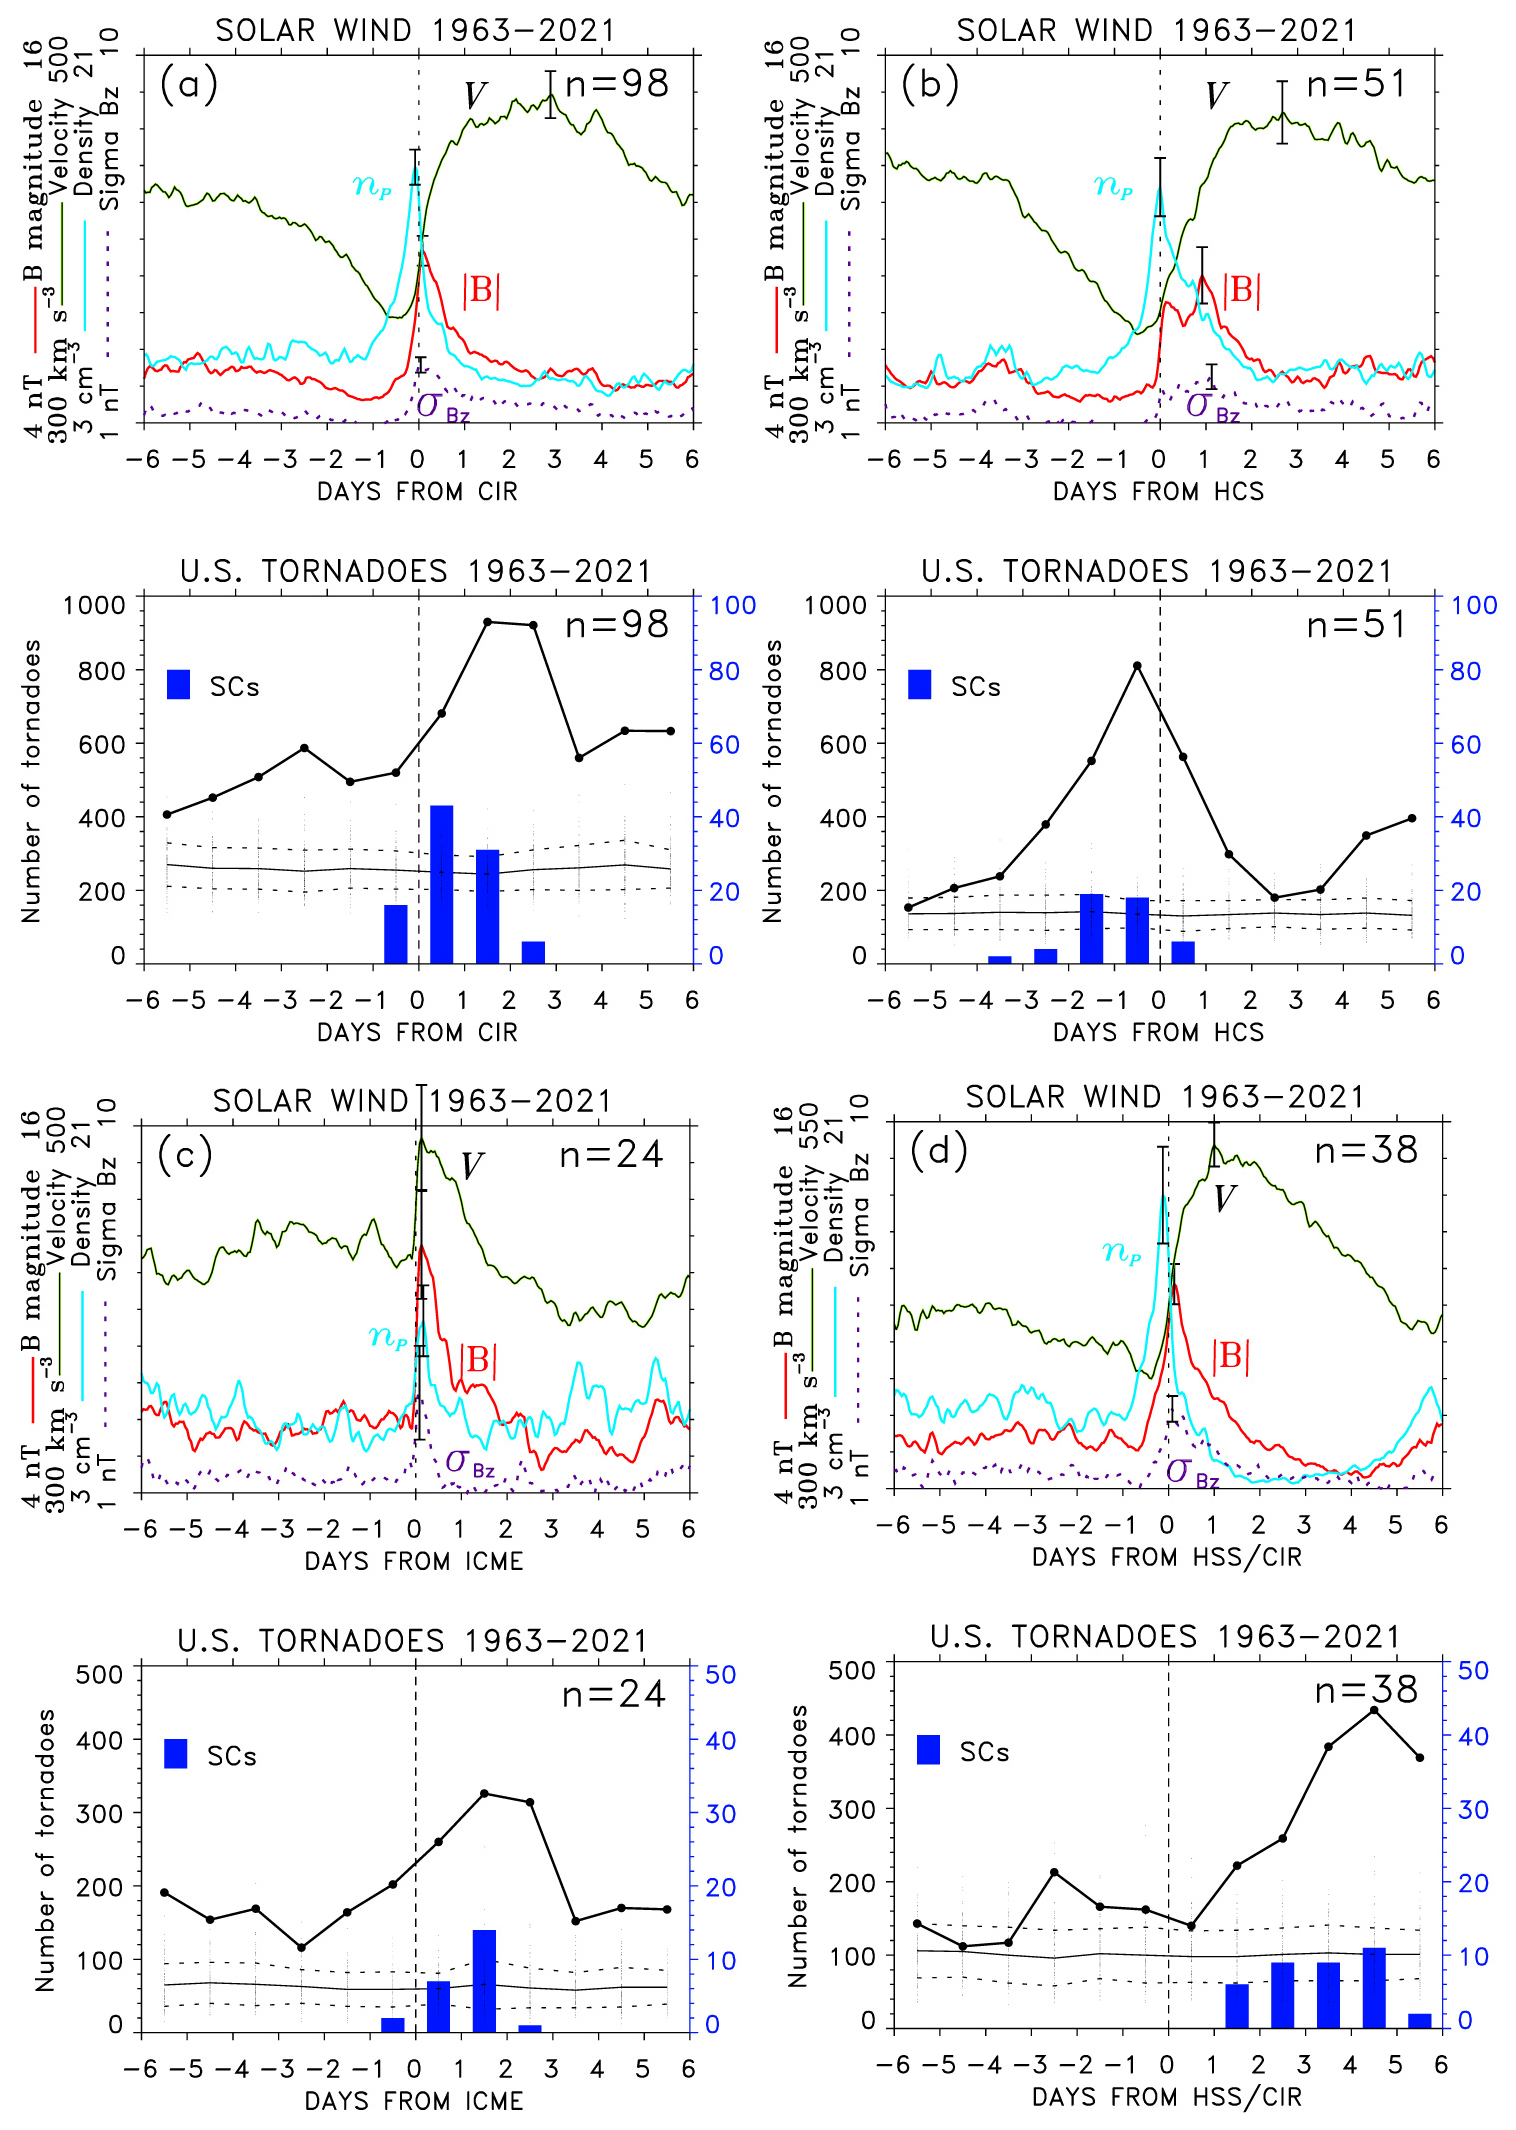
Figure 7The SPE analysis of time series of solar wind plasma variables, and occurrence of tornadoes and supercells, keyed to (a) CIRs, (b) HCSs, (c) ICMEs and (d) HSS/CIRs associated with supercells (SCs) shown in the histograms. The results of the simulated SPE analysis of cumulative numbers of tornadoes repeated 100 times using randomly chosen key times are shown by dots, with the mean (thin solid line) and ± standard deviation (dashed lines) overlaid.
Bunkers et al. (2022) examined storm motions for cases of tornadic and non-tornadic supercells (their Tables A1 and A2). Esterheld and Giuliano (2008) used a hodograph technique to discriminate between tornadic and non-tornadic supercells (their Table A1). These tables list dates/times of supercells soundings, for some supercells more than once. Similarly to large tornado outbreaks, as discussed in Sect. 3.3, almost all of these supercell occurrences can be associated with CIRs, HCSs, ICMEs, or major HSSs in the declining phase. Similarly to Fig. 3, Fig. 7 shows the SPE analysis of solar wind plasma variables and daily tornado occurrence keyed to CIRs, HCSs and ICMEs impacts, and arrivals of major HSS/CIRs, associated with supercell cases referenced above. As in Fig. 3, the bottom panels in Fig. 7a–d show the cumulative number of tornadoes in the U.S. The histograms show the occurrence of supercells relative to the key times. These results are very similar to those for large tornado outbreaks shown in Fig. 3. While the supercells include both tornadic and non-tornadic supercells, on average, they are associated with (followed by) an increase in tornado occurrence. This SPE analysis of supercells relative to the associated solar wind disturbances further support the link between the solar wind and tornado occurrence.
The SPE analysis of the occurrence of tornadoes in the United States keyed to the SB/HCS crossings by Earth reveals peaks in the cumulative numbers of tornadoes at or just prior to the crossing time, as well as peaks near ±27 d (synodic solar rotation) from the key time. Supported by the SPE analyses of timeseries of the green corona, measured by ground-based coronagraphs, and solar wind plasma parameters, these results point to a link between tornado occurrence and solar wind high-speed streams from coronal holes. Cases of recurrent occurrence of tornado outbreaks associated with HSSs recurring with a period of solar rotation are also observed. Most of the large tornado outbreaks either closely followed arrivals of co-rotating interaction regions at the leading edge of high-speed streams (Fig. 4a) or were associated with high-density plasma adjacent to HCS (Fig. 4b). Other large outbreaks occurred in the declining phase of major high-speed streams or closely followed impacts of interplanetary coronal mass ejections (Fig. 4c).
Of course, there are many more HCS/HSS/CIR/ICMEs that are not associated with large tornado outbreaks or any increased storminess in the troposphere. Comparing Figs. 1 and 4, only a small fraction of HCSs (n=1792), many of which coincided, or closely preceded HSS/CIRs, were associated with large tornado outbreaks (with CIRs n=143 and HCSs n=152). While AGWs are commonly generated by solar wind–MIT coupling, particularly following arrivals of HSS/CIRs, number of additional factors are required when considering a possibility of their potential contribution to weather development, including the actual generation and propagation of AGWs in real atmosphere, as well as the conditions in the troposphere the AGWs might reach. Also, as discussed in Sect. 5, the presence of CSI combined with southerly winds and high wind shear the AGWs would have to interact with, if they can contribute to latent heat release that leads to intensification of storms.
While the observed link between solar wind and tornado outbreaks still requires further investigation of the physical mechanism, it is of interest to consider possible joint space weather and tropospheric weather forecasting of the risk of large tornado outbreaks. The predictions of the solar wind in the near-Earth space environment have seen significant progress. The Wang-Sheeley-Arge/ENLIL (WSA/ENLIL) model is a hybrid empirical/physics-based coupled model (Owens et al., 2008) combining the WSA empirical coronal model (Arge and Pizzo, 2000; Arge et al., 2003) and the ENLIL magnetohydrodynamic model of the heliosphere (Odstrcil et al., 2004, and references therein).
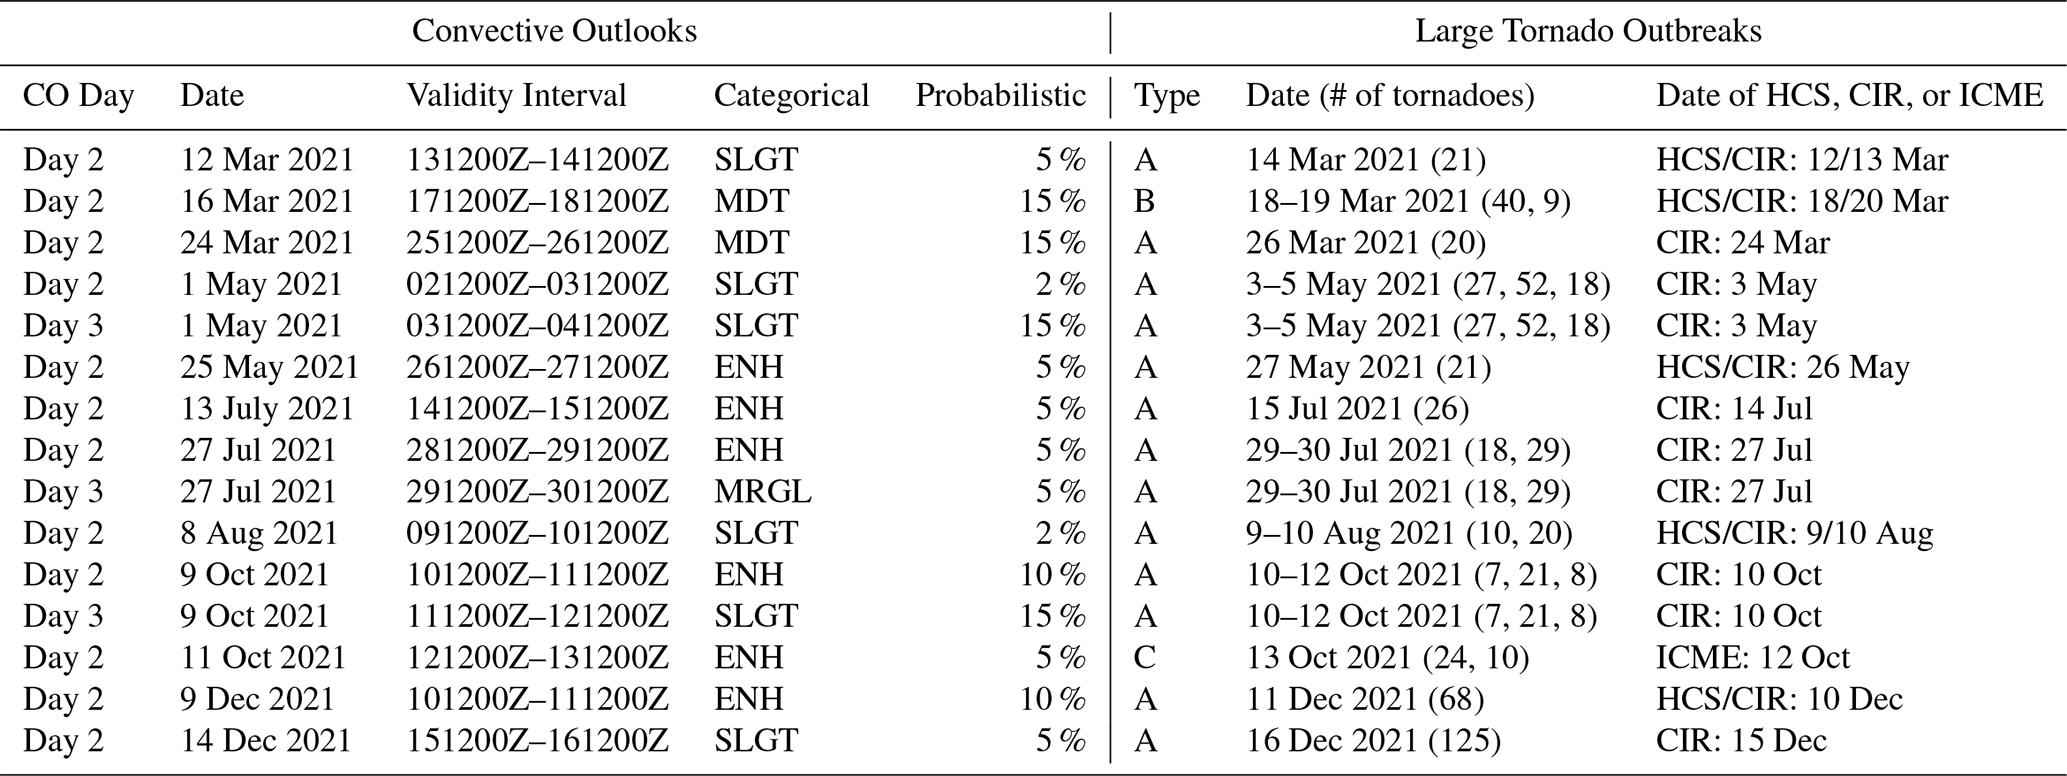
Table 2NOAA Storm Prediction Center forecasting of severe thunderstorms and tornadoes in 2021.
The NOAA National Weather Service (https://www.weather.gov/, last access: 24 June 2025) provides forecasts of severe weather. Convective Outlooks (https://www.spc.noaa.gov/, last access: 24 June 2025) issued by the NOAA Storm Prediction Center highlight areas across the U.S. of possible risk from severe thunderstorms and tornadoes. They are used for severe weather planning and emergency management (Cross et al., 2021). An archive of Convective Outlooks is available. The Space Weather Prediction Center (https://www.swpc.noaa.gov/, last access: 24 June 2025) has also been included in the NOAA website.
The WSA/ENLIL model provides 1–4 d advance warning of HSS and Earth-directed ICME that includes solar wind plasma density and radial velocity. If Convective Outlooks issued by NOAA Storm Prediction Center forecast a risk of convective activity, arrivals of HSS/CIR/ICMEs could indicate a higher risk of a tornado outbreak during such periods. For example, the archived Convective Outlooks Day 1 issued just prior to large tornado outbreaks in 11 and 16 December 2021 (Fig. 4e) indicated enhanced to moderate risk of thunderstorms and 10 %–15 % probability of tornadoes. In contrast, prior to HSS/CIR/HCSs on 19 and 27 December 2021 that were not associated with tornado outbreaks, the Convective Outlooks indicated no or only a marginal risk of convective activity, and no significant southerly winds bringing moisture from the south were observed on these days.
Table 2 lists the NOAA Storm Prediction Center Convective Outlooks issued prior to the large tornado outbreaks in 2021. The left columns show Convective Outlook Day, the date the forecast was issued, validity interval of the forecast, maximum severity and probabilistic risk (see, https://www.spc.noaa.gov/misc/SPC_probotlk_info.html, last access: 24 June 2025) taken from graphical representation of the forecast. The right columns in Table 2 show the information about the large tornado outbreaks from Tables 1 and S1. For example, for large tornado outbreaks on 11 and 16 December 2021 Convective Outlook Day 2 forecasted enhanced (10 %) and slight (5 %) risks of severe thunderstorms (tornado probabilities), respectively. In most of the cases of large tornado outbreaks in Table 2 Convective Outlook Days appear to underestimate the actual severity and occurrence of large tornado outbreaks. Forecasts of arrivals of solar wind disturbances (space weather outlooks) could contribute to further risk assessment.
The CAPE and vertical wind shear are often used to indicate whether the environment is conducive to tornado activity (Miller et al., 2020). The Storm Prediction Center forecast tools include CAPE, but not SCAPE. If the CSI release and slantwise convection, with a potential contribution of aurorally generated AGWs, play a role during tornado outbreaks, forecasting SCAPE could be beneficial.
A link between the solar wind and large tornado outbreaks is found. The superposed epoch analysis of tornado occurrence in the United States from 1963 to 2023 reveals a peak in the cumulative number of tornadoes near the interplanetary magnetic field sector boundary (heliospheric current sheet) crossings by Earth. The latter usually closely precede, or coincide, with co-rotating interaction regions at the leading edge of high-speed streams from coronal holes. The occurrence of large tornado outbreaks relative to solar wind disturbances is classified into four groups. Most of the large tornado outbreaks are associated with high-density plasma adjacent to the heliospheric current sheet or closely followed arrivals of co-rotating interaction regions. Other outbreaks followed impacts of interplanetary coronal mass ejections or occurred in the declining phase of major high-speed streams. The role of solar wind coupling to the magnetosphere-ionosphere-atmosphere system, mediated by globally propagating aurorally excited atmospheric gravity waves, is considered. While these gravity waves reach the troposphere with attenuated amplitudes, they can contribute to conditional symmetric instability release leading to intensification of extratropical cyclones and synoptic-scale conditions that favor supercells spawning tornadoes. The superposed epoch analysis of solar wind and tornado occurrence using date/times of supercells from published supercell studies provides further evidence of the link between the solar wind and tornado occurrence. If conditional symmetric instability and slantwise convection play a role in the synoptic-scale weather conditions leading to tornado outbreaks, forecasting SCAPE could be beneficial. With a potential contribution of aurorally generated gravity waves in the release of conditional symmetric instability, space weather forecasts may contribute to forecasting of large tornado outbreak risk.
| AEC | atmospheric electric circuit |
| ACU | absolute coronal unit |
| AGW | atmospheric gravity wave |
| CAPE | convective available potential energy |
| CIR | corotating interaction region |
| CSI | conditional symmetric instability |
| GC | green corona |
| HCS | heliospheric current sheet |
| HDP | high-density plasma |
| HILDCAA | high-intensity, long-duration continuous auroral electrojet activity |
| HSS | high-speed stream |
| ICME | interplanetary coronal mass ejection |
| IMF | interplanetary magnetic field |
| MIA | magnetosphere – ionosphere – atmosphere |
| SC | supercell |
| SB | sector boundary |
| SBC | sector boundary crossing |
| SCAPE | slantwise convective available potential energy |
| SPE | superposed epoch |
| TID | traveling ionospheric disturbance |
| VRS | vertically integrated extent of realizable symmetric instability |
Severe weather databases are provided by the Storm Prediction Center http://www.spc.noaa.gov/wcm/#data (NOAA, 2025), including database of tornadoes. The ERA5 reanalysis dataset is available at https://doi.org/10.24381/cds.bd0915c6 (Hersbach et al., 2020, 2023). The National Space Science Data Center (NSSDC) OMNIWeb at http://omniweb.gsfc.nasa.gov provides the solar wind data (King and Papitashvili, 2005). The Modified Homogeneous Data Set of Coronal Intensities (Dorotovič et al., 2014) is accessible using Firefox browser at https://www.kozmos-online.sk/slnko/modifikovany-homogenny-rad-modified-homogeneous-data-set/ (KOZMOS, 2025).
The supplement related to this article is available online at https://doi.org/10.5194/asr-22-19-2025-supplement.
PP: conceptualization, formal analysis, investigation, methodology, project administration, resources, software, supervision, validation, visualization, writing original draft, review, and editing. VR: conceptualization, formal analysis of coronal data, investigation, methodology, resources, validation, review, and editing.
The contact author has declared that neither of the authors has any competing interests.
Publisher's note: Copernicus Publications remains neutral with regard to jurisdictional claims made in the text, published maps, institutional affiliations, or any other geographical representation in this paper. While Copernicus Publications makes every effort to include appropriate place names, the final responsibility lies with the authors.
This article is part of the special issue “EMS Annual Meeting: European Conference for Applied Meteorology and Climatology 2024”. It is a result of the EMS Annual Meeting 2024, Barcelona, Spain, 2–6 September 2024. The corresponding presentation was part of session UP1.3: Understanding and modelling of atmospheric hazards and severe weather phenomena.
This research was supported by the University of New Brunswick and by the VEGA project 2/0043/24 (Slovak Academy of Sciences). The authors would like to thank Ting-Chen Chen at the Institute of Meteorology and Climate Research, Karlsruhe Institute of Technology, for sharing the computer code for the analysis of conditional symmetric instability. Contributions by the ACE, Geotail, IMP-8, SoHO and Wind spacecraft teams, and the NSSDC OMNIWeb projects are acknowledged. The coronal dataset is maintained by the Slovak Central Observatory Hurbanovo. Tornado databases were accessed online at web pages provided by the NOAA National Weather Service Storm Prediction Center.
Vojto Rušin is supported by the VEGA project 2/0043/24 (Slovak Academy of Sciences).
This paper was edited by Victoria Sinclair and reviewed by two anonymous referees.
Afraimovich, E. L., Kosogorov, E. A., Leonovich, L. A., Palamartchouk, K. S., Perevalova, N. P., and Pirog, O. M.: Determining parameters of large-scale traveling ionospheric disturbances of auroral origin using GPS-arrays, J. Atmos. Sol.-Terr. Phy., 62, 553–565, https://doi.org/10.1016/S1364-6826(00)00011-0, 2000.
Agee, E., Larson, J., Childs, S., and Marmo, A.: Spatial Redistribution of U.S. Tornado Activity between 1954 and 2013, J. Appl. Meteorol. Clim., 55, 1681–1697, 2016.
Ambrož, P.: Statistical method of superposition of epochs. I-Methodical analysis and some criteria of application, Bull. Astron. Inst. Czechoslov., 30, 114–121, 1979.
Arge, C. N. and Pizzo, V. J.: Improvement in the prediction of solar wind conditions using near-real time solar magnetic field updates, J. Geophys. Res., 105, 10465–10479, https://doi.org/10.1029/1999JA000262, 2000.
Arge, C. N., Odstricil, D., Pizzo, V. J., and Mayer, L. R.: Improved method for specifying solar wind speed near the sun, in: AIP conference proceedings, 679, 190–193, https://doi.org/10.1063/1.1618574, 2003.
Belcher, J. W. and Davis Jr., L.: Large-amplitude Alfvén waves in the interplanetary medium, J. Geophys. Res., 76, 3534–3563, https://doi.org/10.1029/JA076i016p03534, 1971.
Bolton, N., Elsomb, D. M., and Meaden, G. T.: Forecasting tornadoes in the United Kingdom, Atmos. Res., 67–68, 53–72, https://doi.org/10.1016/S0169-8095(03)00083-8, 2003.
Bristow, W. A., Greenwald, R. A., and Villain, J. P.: On the seasonal dependence of medium-scale atmospheric gravity waves in the upper atmosphere at high latitudes, J. Geophys. Res., 101, 15685–15699, https://doi.org/10.1029/96JA01010, 1996.
Brooks, H. E. and Doswell III, C. A.: Normalized Damage from Major Tornadoes in the United States: 1890–1999, Weather Forecast., 16, 168–176, https://doi.org/10.1175/1520-0434(2001)016<0168:NDFMTI>2.0.CO;2, 2001.
Brooks, H. E., Carbin, G. W., and Marsh, P. T.: Increased variability of tornado occurrence in the United States, Science, 346, 349–352, https://doi.org/10.1126/science.1257460, 2014.
Bunkers, M. J.: Vertical Wind Shear Associated with Left-Moving Supercells, Weather Forecast., 17, 845–855, https://doi.org/10.1175/1520-0434(2002)017<0845:VWSAWL>2.0.CO;2, 2002.
Bunkers, M. J., Klimowski, B. A., Zeitler, J. W., Thompson, R. L., and Weisman, M. L.: Predicting Supercell Motion Using a New Hodograph Technique, Weather Forecast., 15, 61–79, https://doi.org/10.1175/1520-0434(2000)015<0061:PSMUAN>2.0.CO;2, 2000.
Bunkers, M. J., Wilson, M. B., Van Den Broeke, M. S., and Healey, D. J.: Scan-by-Scan Storm-Motion Deviations for Concurrent Tornadic and Nontornadic Supercells, Weather Forecast., 37, 749–770, https://doi.org/10.1175/WAF-D-21-0153.1, 2022.
Chen, T.-C., Yau, M. K., and Kirshbaum, D. J.: Assessment of conditional symmetric instability from global reanalysis data, J. Atmos. Sci., 75, 2425–2443, https://doi.org/10.1175/JAS-D-17-0221.1, 2018.
Cherniak, I. and Zakharenkova, I.: Large-scale traveling ionospheric disturbances origin and propagation: Case study of the December 2015 geomagnetic storm, Space Weather, 16, 1377–1395, https://doi.org/10.1029/2018SW001869, 2018.
Chimonas, G. and Hines, C. O.: Atmospheric gravity waves launched by auroral currents, Planet. Space Sci., 18, 565–582, https://doi.org/10.1016/0032-0633(70)90132-7, 1970.
Corfidi, S. F., Weiss, S. J., Kain, J. S., Corfidi, S. J., Rabin, R. M., and Levit, J. J.: Revisiting the 3–4 April 1974 Super Outbreak of Tornadoes, Weather Forecast., 25, 465–510, https://doi.org/10.1175/2009WAF2222297.1, 2010.
Cowling, D. H., Webb, H. D., and Yeh, K. C.: Group rays of internal gravity waves in a wind stratified atmosphere, J. Geophys. Res., 79, 213–220, https://doi.org/10.1029/JA076i001p00213, 1971.
Cross, H. A., Cavanaugh, D., Buonanno, C. C., and Hyman, A.: The Impact of the Storm Prediction Center's Convective Outlooks and Watches on Emergency Management Operational Planning, J. Oper. Meteorol., 9, 36–46, https://doi.org/10.15191/nwajom.2021.0903, 2021.
Crowley, G. and Williams, P. J. S.: Observations of the source and propagation of atmospheric gravity waves, Nature, 328, 231–233, https://doi.org/10.1038/328231a0, 1987.
Crowley, G. and McCrea, I. W.: A synoptic study of TIDs observed in the UK during the first WAGS campaign, October 10–18, 1985, Radio Sci., 23, 905–917, https://doi.org/10.1029/RS023i006p00905, 1988.
Ćwik, P., McPherson, R. A., and Brooks, H. E.: What Is a Tornado Outbreak?: Perspectives through Time, B. Am. Meteorol. Soc., 102, E817–E835, https://doi.org/10.1175/BAMS-D-20-0076.1, 2021.
Davies-Jones, R.: Streamwise vorticity: The origin of updraft rotation in supercell storms, J. Atmos. Sci., 41, 2991–3006, https://doi.org/10.1175/1520-0469(1984)041<2991:SVTOOU>2.0.CO;2, 1984.
Davies-Jones, R.: A review of supercell and tornado dynamics, Atmos. Res., 158–159, 274–291, https://doi.org/10.1016/j.atmosres.2014.04.007, 2015.
Davies-Jones, R. P., Burgess, D. W., and Foster, M.: Test of helicity as a tornado forecast parameter. 16th Conference on Severe Local Storms, Kananaskis Park, AB, Canada, Amer. Meteor. Soc., 588–592, 1990.
Diffenbaugh, N. S., Scherer, M., and Trapp, R. J.: Robust increases in severe thunderstorm environments in response to greenhouse forcing, P. Natl. Acad. Sci. USA, 110, 16361–16366, 2013.
Dorotovič, I., Minarovjech, M., Lorenc, M., and Rybanský, M.: Modified homogeneous data set of coronal intensities, Solar. Phys., 289, 2697–2703, https://doi.org/10.1007/s11207-014-0501-2, 2014.
Doswell, C. A., Brooks, H. E., and Maddox, R. A.: Flash flood forecasting: An ingredients-based methodology, Weather Forecast., 11, 560–581, https://doi.org/10.1175/1520-0434(1996)011<0560:FFFAIB>2.0.CO;2, 1996.
Doswell III, C. A., Carbin, G. W., and Brooks, H. E.: The tornadoes of spring 2011 in the USA: An historical perspective, Weather, 67, 88–94, https://doi.org/10.1002/wea.1902, 2012.
Doswell III, C. A., Weiss, S. J., Johns, R. H.: Tornado Forecasting: A Review, in: The Tornado: Its Structure, Dynamics, Prediction, and Hazards, edited by: Church, C., Burgess, D., Doswell, C., and Davies-Jones, R., Geophysical Monograph 79, Amer. Geophys. Union, 557–571, https://doi.org/10.1029/GM079p0557, 2013.
Dungey, J. W.: Interplanetary Magnetic Field and the Auroral Zones, Phys. Rev. Lett., 6, 47–48. https://doi.org/10.1103/PhysRevLett.6.47, 1961.
Dungey, J. W.: Origin of the concept of reconnection and its application to the magnetopause: A historical view, Physics of the Magnetopause. Geophysical Monograph 90, edited by: Song, P., Sonnerup, B. U. O., and Thomsen, M. F., 17–19, AGU, Washington, D.C., 1995.
Elsner, J. B., Elsner, S. C., and Jagger, T. H.: The increasing efficiency of tornado days in the United States, Clim. Dynam., 45, 651–659, https://doi.org/10.1007/s00382-014-2277-3 2015.
Eltayeb, I. A. and McKenzie, J. F.: Critical-level behaviour and wave amplification of a gravity wave incident upon a shear layer, J. Fluid Mech., 72, 661–671, https://doi.org/10.1017/S0022112075003217, 1975.
Emanuel, K. A.: On Assessing Local Conditional Symmetric Instability from Atmospheric Soundings, Mon. Weather Rev., 111, 2016–2033, https://doi.org/10.1175/1520-0493(1983)111<2016:OALCSI>2.0.CO;2, 1983.
Esterheld, J. M. and Giuliano, D. J.: Discriminating between tornadic and non-tornadic supercells: A new hodograph technique, Electronic J. Severe Storms Meteor., 3, 1–50, https://doi.org/10.55599/ejssm.v3i2.15, 2008.
Fawbush, E. J., Miller, R. C., and Starrett, L. G.: An empirical method of forecasting tornado development, B. Am. Meteorol. Soc., 32, 1–9, https://doi.org/10.1175/1520-0477-32.1.1, 1951.
Fujita, T. T. and Stiegler, D.: Detailed analysis of the tornado outbreak in the Carolinas by Using Radar, Satellite, and Aerial Survey Data, 14th Conference on Severe Local Storms, Indianapolis, American Meteorological Society, Boston, 271–274, https://swco-ir.tdl.org/handle/10605/262009 (last access: 15 July 2025), 1985.
Gallo, B. T., Clark, A. J., and Dembek, S. R.: Forecasting Tornadoes Using Convection-Permitting Ensembles, Weather Forecast., 31, 273–295, https://doi.org/10.1175/WAF-D-15-0134.1, 2016.
Galway, J. G.: Relationship of tornado deaths to severe weather watch areas, Mon. Weather Rev. 103, 737–741, https://doi.org/10.1175/1520-0493(1975)103<0737:ROTDTS>2.0.CO;2, 1975.
Galway, J. G.: Some climatological aspects of tornado outbreaks, Mon. Weather Rev., 105, 477–484, https://doi.org/10.1175/1520-0493(1977)105<0477:SCAOTO>2.0.CO;2, 1977.
Glinton, M., Gray, S. L., Chagnon, J. M., and Morcrette, C. J.: Modulation of precipitation by conditional symmetric instability release, Atmos. Res., 185, 186–201, https://doi.org/10.1016/j.atmosres.2016.10.013, 2017.
Gosling, J. T., McComas, D. J., Phillips, J. L., and Bame, S. J.: Geomagnetic activity associated with earth passage of interplanetary shock disturbances and coronal mass ejections, J. Geophys. Res., 96, 7831–7839, https://doi.org/10.1029/91JA00316, 1991.
Hagiwara, M. and Tanaka, H. L.: A theoretical analysis of the atmospheric gravity wave that connects the thermosphere and the troposphere, Tsukuba Geoenvironmental Sciences, 16, 1–14, 2020.
Hersbach, H., Bell, B., Berrisford, P., Hirahara, S., Horányi, A., Muñoz-Sabater, J., Nicolas, J., Peubey, C., Radu, R., Schepers, D., Simmons, A., Soci, C., Abdalla, S., Abellan, X., Balsamo, G., Bechtold, P., Biavati, G., Bidlot, J., Bonavita, M., De Chiara, G., Dahlgren, P., Dee, D., Diamantakis, M., Dragani, R., Flemming, J., Forbes, R., Fuentes, M., Geer, A., Haimberger, L., Healy, S., Hogan, R. J., Hólm, E., Janisková, M., Keeley, S., Laloyaux, P., Lopez, P., Lupu, C., Radnoti, G., de Rosnay, P., Rozum, I., Vamborg, F., Villaume, S., and Thépaut, J.-N.: The ERA5 global reanalysis, Q. J. Roy. Meteor. Soc., 146, 1999–2049, https://doi.org/10.1002/qj.3803, 2020.
Hersbach, H., Bell, B., Berrisford, P., Biavati, G., Horányi, A., Muñoz Sabater, J., Nicolas, J., Peubey, C., Radu, R., Rozum, I., Schepers, D., Simmons, A., Soci, C., Dee, D., and Thépaut, J.-N.: ERA5 hourly data on pressure levels from 1940 to present, Copernicus Climate Change Service (C3S) Climate Data Store (CDS) [data set], https://doi.org/10.24381/cds.bd0915c6, 2023.
Hines, C. O.: Internal atmospheric gravity waves at ionospheric heights, Can. J. Phys., 38, 1441–1481, https://doi.org/10.1139/p60-150, 1960.
Hines, C. O.: Motions of the neutral atmosphere, in: Physics of the Earth's Upper Atmosphere, edited by: Hines, C. O., Paghis, I., Hartz, T. R., and Fejer, J. A., Prentice-Hall, Inc., London, ISBN-10 0136722792, 1965.
Hocke, K. and Schlegel, K.: A review of atmospheric gravity waves and travelling ionospheric disturbances: 1982–1995, Ann. Geophys., 14, 917–940, https://doi.org/10.1007/s00585-996-0917-6, 1996.
Hoeksema, J. T., Wilcox, J. M., and Scherrer, P. H.: The structure of the heliospheric current sheet: 1978–1982, J. Geophys. Res., 88, 9910–9918, https://doi.org/10.1029/JA088iA12p09910, 1983.
Huang, J., Liu, Y.C.-M., Klecker, B., and Chen, Y.: Coincidence of heliospheric current sheet and stream interface: implications for the origin and evolution of the solar wind, J. Geophys. Res.-Space Phys., 121, 19–29, https://doi.org/10.1002/2015JA021729, 2016a.
Huang, J., Liu, Y. C.-M., Qi, Z., Klecker, B., Marghitu, O., Galvin, A. B., Farrugia, C. J., and Li, X.: A multievent study of the coincidence of heliospheric current sheet and stream interface, J. Geophys. Res.-Space Phys., 121, 10768–10782, https://doi.org/10.1002/2016JA022842, 2016b.
Hunsucker, R. D.: Atmospheric gravity waves generated in the highlatitude ionosphere: a review, Rev. Geophys., 20, 293–315, https://doi.org/10.1029/RG020i002p00293, 1982.
Jones, W. L.: Reflexion and stability of waves in stable stratified fluids with shear flow: numerical study, J. Fluid Mech., 34, 609–624, 1968.
King, J. H. and Papitashvili, N. E.: Solar wind spatial scales in and comparisons of hourly Wind and ACE plasma and magnetic field data, J. Geophys. Res., 110, A02104, https://doi.org/10.1029/2004JA010649, 2005 (data available at: http://omniweb.gsfc.nasa.gov, last access: 15 July 2025).
Klingler, T. E. and Smith, D. R.: An Analysis of the 28 March 1984 Tornado Outbreak in the Carolinas, Indiana Academy of Science, 94, 555–564, 1984.
KOZMOS: Modified homogeneous data set, KOZMOS [data set], https://www.kozmos-online.sk/slnko/modifikovany-homogenny-rad-modified-homogeneous-data-set/, last access: 15 July 2025.
Knox, J. A., Rackley, J. A., Black, A. W., Gensini, V. A., Butler, M., Dunn, C., Gallo, T., Hunter, M. R., Lindsey, L., Phan, M., Scroggs, R., and Brustad, S.: Tornado debris characteristics and trajectories during the 27 April 2011 Super Outbreak as determined using social media data, B. Am. Meteorol. Soc., 94, 1371–1380, https://doi.org/10.1175/BAMS-D-12-00036.1, 2013.
Lindsay, G. M., Russell, C. T., and Luhmann, J. G.: Coronal mass ejection and stream interaction region characteristics and their potential geomagnetic effectiveness, J. Geophys. Res., 100, 16999–17013, https://doi.org/10.1029/95JA00525, 1995.
Lindzen, R. S. and Barker, J.: Instability and wave over-reflection in stably stratified shear flow, J. Fluid Mech., 151, 189–217, https://doi.org/10.1017/S0022112085000921, 1985.
Mayr, H. G., Harris, I., Varosi, F., and Herrero, F. A.: Global excitation of wave phenomena in a dissipative multiconstituent medium 1. Transfer function of the Earth's thermosphere, J. Geophys. Res., 89, 10929–10959, https://doi.org/10.1029/JA089iA12p10929, 1984a.
Mayr, H. G., Harris, I., Varosi, F., and Herrero, F. A.: Global excitation of wave phenomena in a dissipative multiconstituent medium 2. Impulsive perturbations in the Earth's thermosphere, J. Geophys. Res., 89, 10961–10986, https://doi.org/10.1029/JA089iA12p10961, 1984b.
Mayr, H. G., Harris, I., Herrero, F. A., Spencer, N. W., Varosi, F., and Pesnell, W.D.: Thermospheric gravity waves: Observations and interpretation using the transfer function model, Space Sci. Rev., 54, 297–375, https://doi.org/10.1007/BF00177800, 1990.
Mayr, H. G., Talaat, E. R., and Wolven, B. C.: Global propagation of gravity waves generated with the whole atmosphere transfer function model, J. Atmos. Sol.-Terr. Phy., 104, 7–17, https://doi.org/10.1016/j.jastp.2013.08.001, 2013.
McKenzie, J. F.: Reflection and amplification of acoustic-gravity waves at a density and velocity discontinuity, J. Geophys. Res., 77, 2915–2926, https://doi.org/10.1029/JA077i016p02915, 1972.
Mercer, A. E., Shafer, C. M., Doswell, C. A., Leslie, L. M., and Richman, M. B.: Objective Classification of Tornadic and Nontornadic Severe Weather Outbreaks, Mon. Weather Rev., 137, 4355–4368, https://doi.org/10.1175/2009MWR2897.1, 2009.
Mercer, A. E., Shafer, C. M., Doswell, C. A., Leslie, L. M., and Richman M. B.: Synoptic Composites of Tornadic and Nontornadic Outbreaks, Mon. Weather Rev., 140, 2590–2608, https://doi.org/10.1175/MWR-D-12-00029.1, 2012.
Miller, D. E., Wang, Z., Trapp, R. J., and Harnos, D. S.: Hybrid prediction of weekly tornado activity out to Week 3: Utilizing weather regimes, Geophys. Res. Lett., 47, e2020GL087253, https://doi.org/10.1029/2020GL087253, 2020.
Moller, A. R., Doswell, C. A., Foster, M. P., and Woodall, G. R.: The Operational Recognition of Supercell Thunderstorm Environments and Storm Structures, Weather Forecast., 9, 327–347, https://doi.org/10.1175/1520-0434(1994)009<0327:TOROST>2.0.CO;2, 1994.
NOAA: Severe Weather Database Files (1950–2024), NOAA [data set], https://www.spc.noaa.gov/wcm/#data, last access: 15 July 2025.
Odstrcil, D., Pizzo, V. Linker, J. A., Riley, P., Lionello, R. and Mikic, Z.: Initial coupling of coronal and heliospheric numerical magnetohydrodynamic codes, J. Atmos. Sol.-Terr. Phy., 66, 1311–1320, https://doi.org/10.1016/j.jastp.2004.04.007, 2004.
Owens, M. J., Spence, H. E., McGregor, S., Hughes, W. J., Quinn, J. M., Arge, C. N., Riley, P., Linker, J., and Odstrcil, D.: Metrics for solar wind prediction models: Comparison of empirical, hybrid, and physics-based schemes with 8 years of L1 observations, Space Weather, 6, S08001, https://doi.org/10.1029/2007SW000380, 2008.
Pautz, M. E. (Ed.): Severe local storm occurrences 1955–1967, vol. 12, 1–77, Environmental Science Services Administration, Weather Bureau, 1969.
Pitteway, M. L. V. and Hines, C. O.: The reflection and ducting of atmospheric acoustic-gravity waves, Can. J. Phys., 43, 2222–2243, https://doi.org/10.1139/p65-217, 1965.
Prikryl, P.: Mesoscale weather influenced by auroral gravity waves contributing to conditional symmetric instability release?, Adv. Sci. Res., 21, 1–17, https://doi.org/10.5194/asr-21-1-2024, 2024.
Prikryl, P. and Rušin, V.: Occurrence of heavy precipitation influenced by solar wind high-speed streams through vertical atmospheric coupling, Front. Astron. Space Sci., 10, https://doi.org/10.3389/fspas.2023.1196231, 2023.
Prikryl, P., Muldrew, D. B., Sofko, G. J., and Ruohoniemi, J. M.: Solar wind Alfvén waves: a source of pulsed ionospheric convection and atmospheric gravity waves, Ann. Geophys., 23, 401–417, https://doi.org/10.5194/angeo-23-401-2005, 2005.
Prikryl, P., Muldrew, D. B., and Sofko, G. J.: The influence of solar wind on extratropical cyclones – Part 2: A link mediated by auroral atmospheric gravity waves?, Ann. Geophys., 27, 31–57, https://doi.org/10.5194/angeo-27-31-2009, 2009a.
Prikryl, P., Rušin, V., and Rybanský, M.: The influence of solar wind on extratropical cyclones – Part 1: Wilcox effect revisited, Ann. Geophys., 27, 1–30, https://doi.org/10.5194/angeo-27-1-2009, 2009b.
Prikryl, P., Iwao, K., Muldrew, D. B., Rušin, V., Rybanský, M., and Bruntz, R.: A link between high-speed solar wind streams and explosive extratropical cyclones, J. Atmos. Sol.-Terr. Phy., 149, 219–231, https://doi.org/10.1016/j.jastp.2016.04.002, 2016.
Prikryl, P, Bruntz, R, Tsukijihara, T, Iwao, K, Muldrew, D. B., Rušin, V, Rybanský, M, Turňa, M, Šťastný, P.: Tropospheric weather influenced by solar wind through atmospheric vertical coupling downward control, J. Atmos. Sol.-Terr. Phy., 171, 94–110, https://doi.org/10.1016/j.jastp.2017.07.023, 2018.
Prikryl, P., Nikitina, L., and Rušin, V.: Rapid intensification of tropical cyclones in the context of the solar wind-magnetosphere-ionosphere-atmosphere coupling, J. Atmos. Sol.-Terr. Phy., 183, 36–60, https://doi.org/10.1016/j.jastp.2018.12.009, 2019.
Prikryl, P., Rušin, V., and Prikryl, E. A.: High-Rate Precipitation Occurrence Modulated by Solar Wind High-Speed Streams, Atmosphere, 12, 1186, https://doi.org/10.3390/atmos12091186, 2021a.
Prikryl, P., Rušin, V., Prikryl, E. A., Šťastný, P., Turňa, M., and Zeleňáková, M.: Heavy rainfall, floods, and flash floods influenced by high-speed solar wind coupling to the magnetosphere–ionosphere–atmosphere system, Ann. Geophys., 39, 769–793, https://doi.org/10.5194/angeo-39-769-2021, 2021b.
Púčik, T., Groenemeijer, P., Rýva, D., and Kolář, M.: Proximity soundings of severe and non-severe thunderstorms in central Europe, Mon. Weather Rev., 143, 4805–4821, https://doi.org/10.1175/MWR-D-15-0104.1, 2015.
Púčik, T., Groenemeijer, P., and Tsonevsky, I.: Vertical Wind Shear and Convective Storms, Technical memorandum, European Centre for Medium-Range Weather Forecasts, https://doi.org/10.21957/z0b3t5mrv, 2021.
Richardson, I. G.: The formation of CIRs at stream-stream interfaces and resultant geomagnetic activity, in Recurrent Magnetic Storms: Corotating Solar Wind, AGU monograph, 167, https://doi.org/10.1029/167GM06, 2006.
Richardson, I. G. and Cane, H. V.: Near-Earth interplanetary coronal mass ejections during solar cycle 23 (1996–2009), catalog and summary of properties, Sol. Phys., 264, 189–237, https://doi.org/10.1007/s11207-010-9568-6, 2010.
Richardson, I. G., Cliver, E. W., and Cane, H. V.: Sources of geomagnetic activity over the solar cycle: Relative importance of CMEs, high-speed streams, and slow solar wind, J. Geophys. Res., 105, 18203–18213, https://doi.org/10.1029/1999JA000400, 2000.
Richardson, I. G., Cliver, E. W., and Cane, H. V.: Sources of geomagnetic storms for solar minimum and maximum conditions during 1972–2000, Geophys. Res. Lett., 28, 2569–2572, https://doi.org/10.1029/2001GL013052, 2001.
Richmond, A. D.: Gravity wave generation, propagation, and dissipation in the thermosphere, J. Geophys. Res., 83, 4131–4145, https://doi.org/10.1029/JA083iA09p04131, 1978.
Rotunno, R. and Klemp, J. B.: The influence of the shear-induced pressure gradient on thunderstorm motion, Mon. Weather Rev., 110, 136–151, https://doi.org/10.1175/1520-0493(1982)110<0136:TIOTSI>2.0.CO;2, 1982.
Rotunno, R. and Klemp, J. B.: On the rotation and propagation of simulated supercell thunderstorms, J. Atmos. Sci., 42, 271–292, https://doi.org/10.1175/1520-0469(1985)042<0271:OTRAPO>2.0.CO;2, 1985.
Rybanský, M.: Coronal index of solar activity, Bull. Astron. Inst. Czechoslov., 28, 367–370, 1975.
Rybanský, M., Rušin, V., and Minarovijech, M.: Coronal index of solar activity, Space Sci. Rev., 95, 227–234, 2001.
Rybanský, M., Rušin, V., Minarovjech, M., Klocok, L., and Cliver, E. W.: Reexamination of the coronal index of solar activity, J. Geophys. Res., 110, A08106, https://doi.org/10.1029/2005JA011146, 2005.
Samson, J. C., Greenwald, R. A., Ruohoniemi, J. M., and Baker, K. B.: High-frequency radar observations of atmospheric gravity waves in the high latitude ionosphere, Geophys. Res. Lett., 16, 875–878, https://doi.org/10.1029/GL016i008p00875 1989.
Schultz, D. M. and Schumacher, P. N.: The use and misuse of conditional symmetric instability, Mon. Weather Rev., 127, 2709–2732, https://doi.org/10.1175/1520-0493(1999)127<2709:TUAMOC>2.0.CO;2, 1999.
Shafer, C. M. and Doswell III, C. A.: A multivariate index for ranking and classifying severe weather outbreaks, Electron. J. Severe Storms Meteorol., 5, 1–39, 2010.
Shafer, C. M., Mercer, A. E., Doswell, C. A., Richman, M. B., and Leslie, L. M.: Evaluation of WRF Forecasts of Tornadic and Nontornadic Outbreaks When Initialized with Synoptic-Scale Input, Mon. Weather Rev., 137, 1250–1271, https://doi.org/10.1175/2008MWR2597.1, 2009.
Smith, E. J. and Wolfe, J. H.: Observations of interaction regions and corotating shocks between one and five AU: Pioneers 10 and 11, Geophys. Res. Lett., 3, 137–140, https://doi.org/10.1029/gl003i003p00137, 1976.
Smith, E. J., Tsurutani, B. T., and Rosenberg, R. L.: Observations of the interplanetary sector structure up to heliographic latitudes of 16°: Pioneer 11, J. Geophys. Res., 83, 717–724, https://doi.org/10.1029/JA083iA02p00717, 1978.
Svalgaard, L.: On the use of Godhavn H component as an indicator of the interplanetary sector polarity, J. Geophys. Res., 80, 2717–2722, https://doi.org/10.1029/JA080i019p02717, 1975.
Thompson, R. L., Edwards, R., Hart, J. A., Elmore, K. L., and Markowski, P. M.: Close proximity soundings within supercell environments obtained from the Rapid Update Cycle, Weather Forecast., 18, 1243–1261, https://doi.org/10.1175/1520-0434(2003)018<1243:CPSWSE>2.0.CO;2, 2003.
Tinsley, B. A.: Solar Activity, Weather, and Climate: The Elusive Connection, B. Am. Meteorol. Soc., 104, E2171–E2191, https://doi.org/10.1175/BAMS-D-23-0065.1, 2023.
Tinsley, B. A.: The influence of the solar wind electric and magnetic fields on the latitude and temporal variations of the current density, JZ, of the global electric circuit, with relevance to weather and climate, J. Atmos. Sol.-Terr. Phys., 265, 106355, https://doi.org/10.1016/j.jastp.2024.106355, 2024.
Tinsley, B. A. and Deen, G. W.: Apparent tropospheric response to MeV-GeV particle flux variations: A connection via electrofreezing of supercooled water in high-level clouds?, J. Geophys. Res., 96, 22283–22296, https://doi.org/10.1029/91JD02473, 1991.
Tinsley, B. A., Hoeksema, J. T., and Baker, D. N. Stratospheric volcanic aerosols and changes in air-earth current density at solar wind magnetic sector boundaries as conditions for the Wilcox tropospheric vorticity effect, J. Geophys. Res., 99, 16805–16813, https://doi.org/10.1029/94JD01207, 1994.
Tippett, M. K.: Changing volatility of U.S. annual tornado reports, Geophys. Res. Lett., 41, 6956–6961, https://doi.org/10.1002/2014GL061347, 2014.
Tippett, M. K., Lepore, C., and Cohen, J. E.: More Tornadoes in the Most Extreme U.S. Tornado Outbreaks, Science, 354, 1419–1423, https://doi.org/10.1126/science.aah7393, 2016.
Tochimoto, E. and Niino, H.: Structural and Environmental Characteristics of Extratropical Cyclones that Cause Tornado Outbreaks in the Warm Sector: A Composite Study, Mon. Weather Rev., 144, 945–969, https://doi.org/10.1175/MWR-D-15-0015.1, 2016.
Tsurutani, B. T. and Gonzalez, W. D.: The cause of High-Intensity, Long-Duration Continuous AE Activity (HILDCAAs): Interplanetary Alfvén wave trains, Planet. Space Sci., 35, 405–412, https://doi.org/10.1016/0032-0633(87)90097-3, 1987.
Tsurutani, B. T., Gould, T., Goldstein, B. E., Gonzalez, W. D., and Sugiura, M.: Interplanetary Alfvén waves and auroral (substorm) activity: IMP-8, J. Geophys. Res., 95, 2241–2252, https://doi.org/10.1029/JA095iA03p02241, 1990.
Tsurutani, B. T., Gonzalez, W. D., Gonzalez, A. L. C., Tang, F., Arballo, J. K., and Okada, M.: Interplanetary origin of geomagnetic activity in the declining phase of the solar cycle, J. Geophys. Res., 100, 21717–21733, https://doi.org/10.1029/95JA01476, 1995.
Tsurutani, B. T., Gonzalez, W. D., Gonzalez, A. L. C., Guarnieri, F. L., Gopalswamy, N., Grande, M., Kamide, Y., Kasahara, Y., Lu, G., Mann, I., McPherron, R., Soraas, F., and Vasyliunas, V.: Corotating solar wind streams and recurrent geomagnetic activity: A review, J. Geophys. Res., 111, A07S01, https://doi.org/10.1029/2005JA011273, 2006a.
Tsurutani, B. T., McPherron, R. L., Gonzalez, W. D., Lu, G., Gopalswamy, N., and Guarnieri, F. L.: Magnetic Storms Caused by Corotating Solar Wind Streams, in Recurrent Magnetic Storms: Corotating Solar Wind, AGU monograph, 167, https://doi.org/10.1029/167GM03, 2006b.
Tsurutani, B. T., Hajra, R., Tanimori, T., Takada, A., Remya, B., Mannucci, A. J., Lakhina, G. S., Kozyra, J. U., Shiokawa, K., Lee, L. C., Echer, E., Reddy, R. V., and Gonzalez, W. D.: Heliospheric plasma sheet (HPS) impingement onto the magnetosphere as a cause of relativistic electron dropouts (REDs) via coherent EMIC wave scattering with possible consequences for climate change mechanisms, J. Geophys. Res., 121, 10130–10156, https://doi.org/10.1002/2016JA022499, 2016.
Verbout, S. M., Brooks, H. E., Leslie, L. M., and Schultz, D. M: Evolution of the US tornado database: 1954–2003, Weather Forecast., 21, 86–93, 2006.
Weisman, M. L. and Rotunno, R.: The Use of Vertical Wind Shear versus Helicity in Interpreting Supercell Dynamics, J. Atmos. Sci., 57, 1452–1472, https://doi.org/10.1175/1520-0469(2000)057<1452:TUOVWS>2.0.CO;2, 2000.
Wilcox, J. M., Scherrer, P. H., Svalgaard, L., Roberts, W. O., and Olson, R. H.: Solar Magnetic Sector Structure: Relation to Circulation of the Earth's Atmosphere, Science, 180, 185–186, https://doi.org/10.1126/science.180.4082.185, 1973.
Wilcox, J. M., Scherrer, P. H., Svalgaard, L., Roberts, W. O., Olson, R. H., and Jenne, R. L.: Influence of Solar Magnetic Sector Structure on Terrestrial Atmospheric Vorticity, J. Atmos. Sci., 31, 581–88, https://doi.org/10.1175/1520-0469(1974)031<0581:IOSMSS>2.0.CO;2, 1974.
Witten, D. E.: May 31, 1985 a Deadly Tornado Outbreak, Weatherwise, 38, 193–198, https://doi.org/10.1080/00431672.1985.9933314, 1985.
Zhang, J., Richardson, I. G., Webb, D. F., Gopalswamy, N., Huttunen, E., Kasper, J. C., Nitta, N. V., Poomvises, W., Thompson, B. J., Wu, C.-C., Yashiro, S., and Zhukov, A. N.: Solar and interplanetary sources of major geomagnetic storms (Dst nT) during 1996–2005, J. Geophys. Res., 112, A10102, https://doi.org/10.1029/2007JA012321, 2007.
Zhao, X. P. and Webb, D. F.: Source regions and storm effectiveness of frontside full halo coronal mass ejections, J. Geophys. Res., 108, 1234, https://doi.org/10.1029/2002JA009606, 2003.
- Abstract
- Introduction
- Data and methods
- Results of SPE analysis of solar variables and tornado occurrence relative to solar wind disturbances
- Solar wind–magnetosphere–ionosphere– atmosphere coupling
- Assessment of conditional symmetric instability and slantwise convection
- Supercells and tornado occurrence relative to solar wind disturbances
- Discussion
- Summary and conclusions
- Appendix A: List of abbreviations – acronyms
- Data availability
- Author contributions
- Competing interests
- Disclaimer
- Special issue statement
- Acknowledgements
- Financial support
- Review statement
- References
- Supplement