 | 17 Nov 2025
How to best evaluate and communicate the value of severe weather warnings?
Kathrin Wapler
Anders Sivle
The value of a weather forecast and a warning is the benefit realized by decision makers through the use of the product. It is important to know what determines how valuable a warning is from a user's point of view. Further, it is unclear whether users and providers have the same understanding of the value of a warning. To address the question of how to best evaluate and communicate the value of weather warnings a survey was designed, conducted and analysed. The survey includes questions with respect to the relevance of various aspects of a warning, the potential benefit of providing information on warning quality, the type of potentially useful information, and suitable ways of providing such information. 66 experts in the field of weather warnings and/or their communication responded to the survey in the frame of scientific conference in 2024. Additionally, a small sample of the general public responded to a selected excerpt of the original survey during the German national weather service's open house. Apart from the core information of warnings, i.e. time, place and severity of the hazard, impact information, and behavioural advice are seen to add value to a warning. Being able to understand the information in the warning is seen as important for the majority of the respondents in the study. Information on the accuracy in timing, location and severity of an event are rated as useful, either to increase trust in warnings or for decision making. Dependent on which user groups are asked, different formats are most suited for warning quality communication. The experts stated that they have more practical experience regarding the content of warning quality information and its usefulness compared to the suitability of different formats. This suggest that there is still a need for testing various formats for best communicating warning quality information to different user groups.
- Article
(1505 KB) - Full-text XML
- BibTeX
- EndNote


There is a global need for meaningful weather warnings. Impact-based warnings are developed to meet this demand. However, there is as need to develop evaluation methods that also includes e.g. behavioural responses and avoided losses, to explore the actual value of impact-based warnings compared to traditional warnings (Potter et al., 2025). The need for evaluation and verification of impact-based warnings, in order to determine their strengths and weaknesses and consequently to lead to improvements, is supported from the perspective of the National Meteorological and Hydrological Services (NMHSs) in Germany and Norway. Despite the challenges arising during the analysis of rare meteorological events, a set of statistical methods are suitable for comparing weather forecasts or warnings with observations to assess the (physical) accuracy of forecasts (e.g. Jolliffe and Stephenson, 2011). Such comparisons are called verification, while evaluation aims for the assessment of the practical usability of a warning. In the following text, the word evaluation is used in place of “evaluation and verification”.
Since an increased public understanding of the impending hazard and the impacts caused by severe weather was achieved when providing impact-based warnings, such warnings are implemented in several National Meteorological and Hydrological Services (WMO, 2015; Kaltenberger et al., 2020). For impact-based warnings, the complexity of evaluation is increased due to the fact that it is not enough to compare the forecasted meteorological parameters against corresponding measurements. The societal consequences of the hazard should also be considered (e.g. by comparing forecasts with damage compensation statistics). Additionally, the preventive measures taken by various actors – based on the warning content – to reduce risk and damages pose a challenge in warning evaluation (e.g. Potter et al., 2021, 2025). When relying on impact data for the evaluation of impact-based warnings, it is difficult to distinguish between incorrect warnings (i.e. the warning described a scenario which did not occur as described and thus induced no impacts) and correct warnings (i.e. the warning described a scenario correctly, however, people responded to the warning and took preventive measures and thus no impacts were induced).
According to Murphy (1993), the value of a forecast is the incremental economic and/or other benefits realized by decision makers through the use of the forecasts. This raises the question of what determines how valuable a warning is from a user's point of view? Do users and providers have the same understanding of the value of a warning? How can the value of a warning be best communicated to users to support their decisions to mitigate risk or prepare for it as best as possible? Some potential factors to consider in an evaluation could address how accessible the warning is, how understandable the information about the weather is, how timely the warning was issued (lead time), how well the consequences and the risks are described, and how useful the information is in the user's decision-making processes. The latter might be affected by e.g. how trustworthy they consider the (provider of the) warning to be, how skilful or accurate the information is, or how relevant the information is to their specific situation or context. Do users understand the impact of the hazard, such that they make better decisions and preventive actions, or is something lost between warning and action?
Increasing the complexity of these questions, it has to be noted that among users, e.g. emergency services, authorities in civil protection, and the general public, the way in which warnings – especially regarding severe weather warnings – are used and understood varies widely (Golding, 2022; Sivle et al., 2022). Hence, a user-oriented evaluation could help the NMHSs understand the capabilities and limits of warnings among the different user groups, and consequently improve users decision-making capabilities, such as safeguarding life and property.
To address the question of how to best evaluate and communicate the value of weather warnings a survey was designed, conducted and analysed. The survey addresses the relevance of various aspects of a warning, the potential benefit of providing information on warning quality, the type of potentially useful information, and suitable ways of providing such information.
To get an overview of evaluation activities in the field of weather warning and its communication to users, and to collect input and opinions on how to best perform user-oriented evaluation of warnings, we (the authors of this paper) developed a short survey. The survey included questions with respect to the relevance of various aspects of a warning, the potential benefit of providing information on warning quality, the type of potentially useful information, and suitable ways of providing such information.
This survey could have been completed within approximately 10 to 20 min. The survey was anonymous. No sensitive data was collected. The responses are used for scientific analysis only.
2.1 The questionnaire
The questions had different foci: (1) warning content and perception, (2) warning value and its communication, and (3) background of the participants. All questions are listed below.
-
Warning content and perception:
-
If you think of the information you typically get from a weather warning, which three statements make most sense to you? [Q1.1]
-
Several factors are important for the value of a warning. Which ones are important to you? [Q1.2]
-
How do you, in general, perceive the thresholds for issued warnings in the country where you live? [Q1.3]
-
Are there specific phenomena and warning levels where you think differently than in question 1.3? [Q1.4]
-
-
Warning quality and its communication:
-
How could the knowledge of the quality (verification/evaluation) of a warning be useful for users? [Q2.1]
-
What kind of information related to warning quality would be useful? [Q2.2]
-
The assessment (in questions Q2.1 and Q2.2) is based on: [Q2.3]
-
Which format(s) to share warning quality do you think is suitable for these different user groups? [Q2.4]
-
The assessment (in question Q2.4) is based on: [Q2.5]
-
If you know one, please refer to a specific example of good practice in evaluating warnings (including consequences and preventive measures). E.g. a link to a research article, a website with more information etc. [Q2.6.]
-
If you know one, please refer to a specific example of good practice in communicating warning quality. E.g. a link to a research article, a website with more information etc. [Q2.7]
-
-
Background of the respondents:
-
Which role do you primarily have related to weather warnings? [Q3.1]
-
Where do you live? [Q3.2]
-
-
Open question:
-
Do you have any other comments regarding the topic “How to best evaluate and communicate the value of severe weather warnings?”? [Q4.1]
-
2.2 The data collection and respondents
The survey was introduced at three expert conferences during 2024: (a) the Weather and Society Conference (online conference, 26 February–1 March 2024) initiated by the Societal and Economics Research Application (SERA) Working Group of the World Weather Research Programme (WWRP) of WMO, (b) the European Meteorological Society (EMS) Annual Meeting (taking place 2–6 September 2024 in Barcelona, Spain) and (c) the final conference of the HIWeather project within the WWRP (taking place 9–13 September 2024 in Munich, Germany). The conference participants were invited to participate in this online survey that could be completed during or after the conferences. During the first of those conferences the link to the survey was also forwarded to colleagues engaged within the Weather and Climate Information Services (WISER) project. At the Weather and Society Conference as well as the HIWeather final conference experts from various fields come together, while the European Meteorological Society Annual Meeting mainly attracts scientists working in meteorological research.
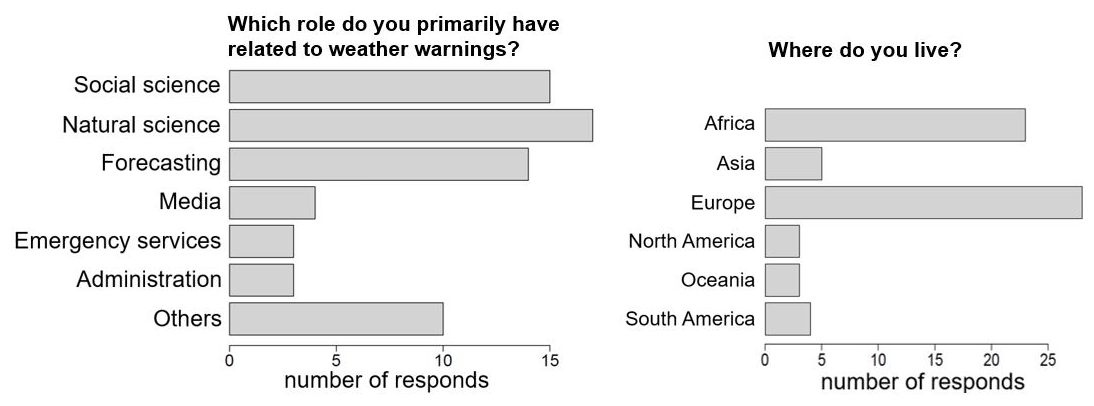
Figure 1Respondents' primary role related to weather warning (left) and continent the respondents live in (right).
In total 66 experts responded to the survey. Among the respondents were 15 (23 %) researchers in social and behavioural sciences or related fields, 17 (26 %) researchers in meteorology, hydrology or related fields and 14 (21 %) forecasters issuing warnings. The remaining 20 (30 %) respondents gave media and communication (4, 6 %), emergency services (3, 5 %), administration (3, 5 %) or others (10, 15 %) as their primary role related to weather warnings (Fig. 1, left). The respondents came from all continents (see Fig. 1, right), with a majority based in Europe (28 respondents, 42 %) or Africa (23 respondents, 35 %, of which a majority is engaged in the WISER projects).
Additionally, three of the questions (slightly adapted and reworded versions of questions Q2.1, Q2.2 and Q2.4) were posed to the visitors at the “open house” in the headquarter of Deutscher Wetterdienst (DWD, Offenbach, Germany; German Meteorological Service). The open house was announced in local TV, local radio, local newspaper, on the webpage and on a banner at the building. The people who participated in this survey at the open house are considered a sample of the general public. They could be neighbours who wanted to get to know the well-known institution based in their town, or people with at least a basic interest in weather, climate or environment. Some might have a specific interest in weather, such as a weather-dependent hobby or engagement in voluntary emergency relief services.
The questions were presented on a poster, which also provided some basic information on forecast evaluation. The people could respond to the questions by dropping chips in special ballot boxes. Since it was possible to select more than one of the given options per question, the number of participants can't be determined. (In the same room visitors were asked to judge the quality of six sample forecasts; between 142 and 217 people used the chance to rate these sample forecasts, thus it is assumed that a somewhat similar number answered the questions on warning quality and its communication.). The responses from the public are presented next to the responses from the experts, in Sect. 4.
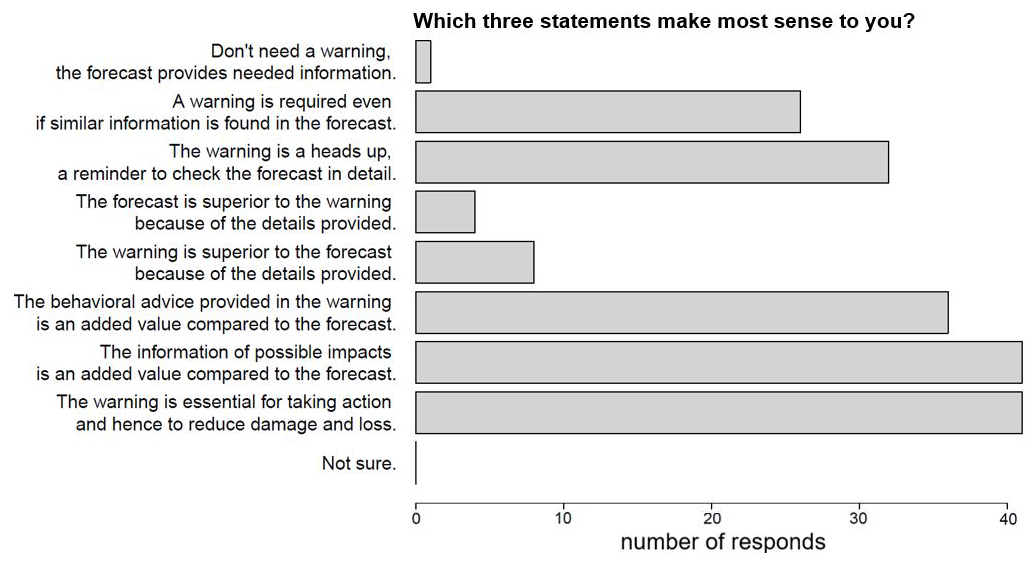
In the first of the questions [Q1.1] regarding the warning content, the respondents were asked to select three statements from a list of eight options, that make most sense to them. (12 respondents, 18 %, only selected one of the statements.) Most of the given statements relate the content of warnings to the content of forecasts (Fig. 2). The two statements “The warning is essential for taking action and hence to reduce damage and loss” and “The information of possible impacts provided in the warning is an added value compared to the forecast” were selected by 41 respondents (62 %). This is followed by the statement “The behavioural advice provided in the warning is an added value compared to the forecast” which was selected by 36 respondents (55 %). These findings are in line with Weyrich (2020), who found that impact-based warnings were more likely to engage people in self-protective behaviours than people receiving standard warnings.
Similarly, the following question [Q1.2] asked: “Several factors are important for the value of a warning. Which ones are important to you?”. Ten factors were given and the respondents could select the importance from “1 Low” to “5 High” for each factor (Fig. 3). “Understandable” is of highest importance (average of 4.23), followed by “place of event” (average 4.14), “time of event” (average 4.12) and “severity of event” (average 4.12). The respondents agreed about this (standard deviation between 1.01 and 1.08). Of lowest, but still relatively high, importance (average 3.5; standard deviation 1.23) is whether the warning is “accessible in my preferred channels”. While among the most selected statements in the previous question, “advice which actions to take” and “impact information” was indicated as less important compared to time, place and severity of the event. One explanation for this could be that time, place and severity can be seen as core information in a warning, that must be there, and impact information and behavioural advice only makes sense and improves understanding when you also know what hazard is expected, when and where. This explanation is supported by Weyrich et al. (2018), who found that standard warnings were seen as more difficult to understand compared to impact-based warnings, and that impact information and behavioural advice increased people's intention to act.
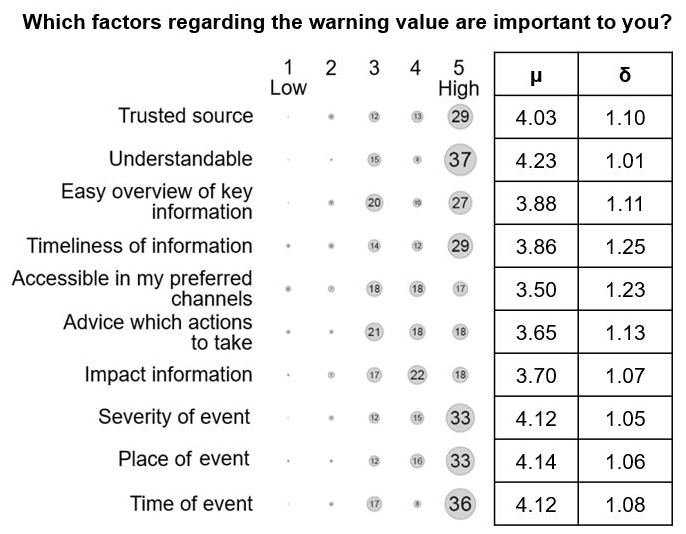
Figure 3Importance of different factors with respect to the value of a warning. Ratings for each factor, mean (μ) and standard deviation (δ).
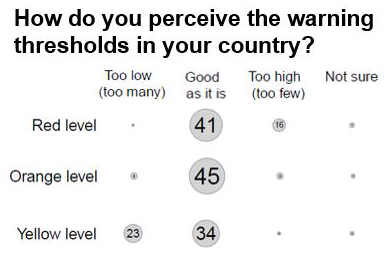
Even though guiding criteria for awareness levels are somewhat standardized (e.g., Meteoalarm, 2025), specific warning criteria are typically different in every country. Nevertheless, one question was concerned with thresholds used for issuing warnings: “How do you, in general, perceive the thresholds for issued warnings in the country where you live?”. For each warning level (“yellow level”, “orange level” and “red level”) respondents could select one of the options: “too low (too many)”, “good as it is” or “too high (too few)” (Fig. 4). For the orange level 45 respondents (68 %) perceive the warning thresholds “good as it is” with 8 responses (12 %) on both sides (too low; too high). For the other warning levels the distribution is skewed. 23 respondents (35 %) perceive the thresholds for yellow level warnings as too low (meaning too many warnings). This finding is supported by one of the responses in the open question (1.3), claiming that yellow level to them meant “don't act”, and is in line with other studies. For example, Sivle et al., (2022) found that 34 % of the respondents in a European survey thought that too many warnings made a dulling effect. Interestingly, 16 respondents (24 %) in the present study perceive the thresholds for red level warnings as too high (meaning too few warnings), providing us a more nuanced view on the topic. Additionally, two respondents said that red levels are helpful for them to take action and prepare as such a warning means “do or die”. On the other hand, orange level warnings were found confusing by one respondent who stated that action “depends on the end user”.
Concerning the warning quality and its communication, three aspects are of interest: how could the knowledge on warning quality be useful, what kind of information would be useful and the formats suitable for distributing such information on warning quality. The question “How could the knowledge of the quality (verification/evaluation) of a warning be useful for users?” was asked to both the experts as well as the general public. While the experts could rate the usability of four given options from “1 not useful” to “5 very useful” in the online survey, the general public just picked the options they thought were applicable (with the possibility to select more than one option). The results are shown in Fig. 5. The experts responded that the knowledge of the warning quality would be most useful “to increase trust in warnings” and “for decision making” (average 4.3 for both with a standard deviation of 0.8 and 0.9 respectively). This was followed by the rating for the option “to understand the strengths and weaknesses” (average 3.8, standard deviation 1.0). The lowest usability (average 3.4, standard deviation 1.3) was given by experts for the option “to calculate the economic value of a warning”, as well as by the general public (10 responses). Compared to the responses by the experts, the general public rated “for decision making” (76 responds) approximately twice as often as useful as the options “to increase trust in warnings” (42 responses) and “to understand the strengths and weaknesses” (35).
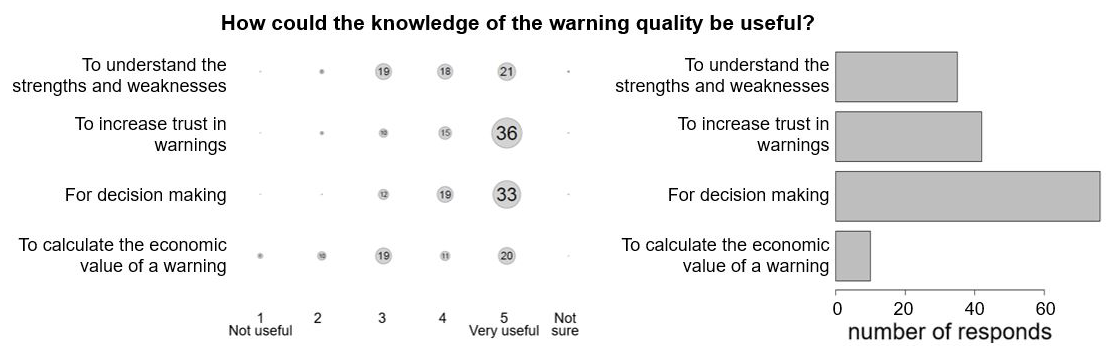
Figure 5Usefulness of knowledge of the warning quality as rated by experts (left) and the general public (right). Note that the experts had the opportunity to choose a rating (1 not useful to 5 very useful or not sure) whereas the general public just had the opportunity to select the different statements.
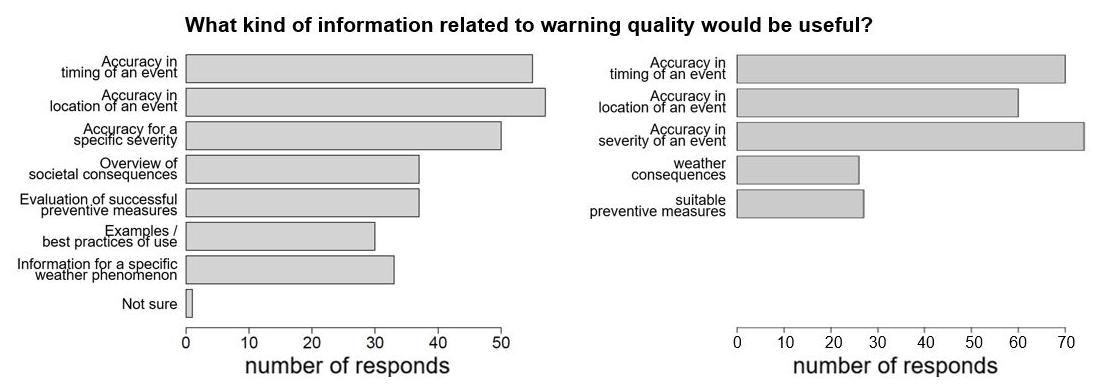
Figure 6Kind of information related to warning quality that would be useful according to the experts (left) and the general public (right). Note that in the adapted survey for the general public the list of different information was reduced.
While the previous question addressed the usefulness of warnings quality information in general, the following question differentiates various aspects of quality information: “What kind of information related to warning quality would be useful?“. The online survey for the experts had seven options (plus “not sure”), whereas two options were left out in the question for the general public (Fig. 6). “Accuracy in location of the event” (57 responds; 86 %), “accuracy in timing of the event” (55; 83 %) and “accuracy in severity of the event” (50; 75 %) were rated most useful by the experts. This was followed by “overview of societal consequences” and “evaluation of successful preventive measures” (both 37 responses, 56 %). Information on accuracy of severity, timing and location of the event was also judged most useful by the general public. These three were selected 2.5 times more often than the options “weather consequences” and “suitable preventive measures”. Results from the survey to the experts show a factor of 1.5 between the number of responds for those groups of options.
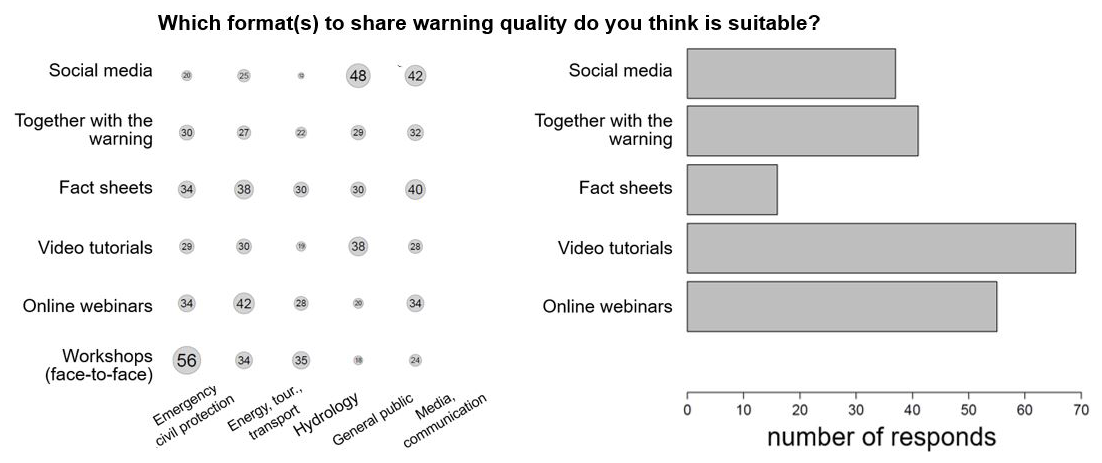
Figure 7Formats suitable for warning quality communication as rated by the experts (left) and a sample from the general public (right). Note that in the adapted survey for the general public face-to-face workshops were dropped from the list of different formats.
Following the question about the potentially useful content of warning quality information, the suitable formats were addressed: “Which format(s) to share warning quality do you think is suitable for these different user groups?” (Fig. 7). The different users were grouped into: “Emergency and civil protection”, “Energy, tourism, transportation, etc.”, “Hydrology”, “General public” and “Media and communication”. For the first user group (emergency and civil protection), the vast majority (56 respondents; 85 %) think that workshops (face-to-face) are suitable, 52 % (34 respondents) picked “online webinars” and “fact sheets” as suitable formats. For the “energy, tourism, transportation etc.” sectors “online webinars” (42 respondents; 64 %) and “fact sheets” (38 respondents; 58 %) are most often selected. “Workshops” is the only format which was identified as useful for the “hydrology” sector with more than half of the respondents (35 respondents; 53 %) choosing this option. “Social media” is most often (42 respondents; 64 %) indicated as useful for the “media and communication” group, followed by “fact sheets” (40 respondents; 61 %). Both the experts as well as the sample of the general public itself gave their opinion on the suitability of the different formats for sharing warning quality information to the general public. While asking the general public, the option “workshops (face-to-face)” was dropped from the list of options, since it is not really realisable. Most of the experts (48 respondents; 73 %) chose “social media” as a suitable format, followed by “video tutorials” (38 respondents; 58 %). In contrast, the sample of the general public chose “video tutorials” most often (69 respondents) followed by “online webinars” (55 respondents). However, the representativity of the sample of the general public is limited. (Since the number of respondents is not known, percentiles cannot be given.)
One of the given options regarding formats is “together with the warning”. This was not selected most often for any of the user groups, however, between 33 % (hydrology) and 48 % (media, communication) of the experts classified this option as suitable across the user groups and 41 respondents from the sample of the general public also found it suitable. Thus, this might also be a way forward in warning communication.
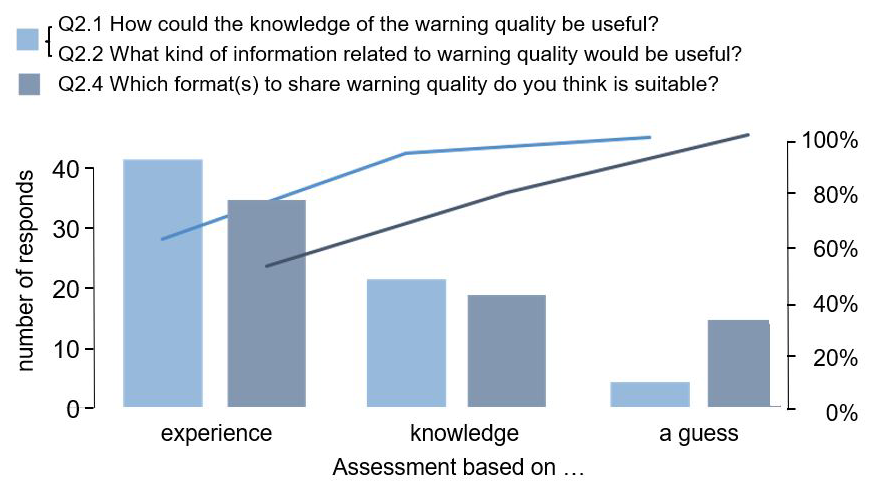
For the questions regarding warning quality and its communication, the survey also asked what the participants based their assessment on: “Practical experience from work with severe weather and warning information”, “Good knowledge of severe weather warnings, its communication, and use” and “A guess”. It was possible to select more than one option. Those who selected both, “practical experience …” as well as “good knowledge …”, were counted for “practical experience”. Figure 8 shows that the fraction of respondents having practical experience is higher for the questions regarding the content of warning quality information and its usefulness (Q2.1 and Q2.2). Regarding suitable formats (Q2.4), 21 % of the respondents based their assessment on a guess. This could indicate that there is still a need for testing various formats for best communicating warning quality information to different user groups.
The survey was conducted at three different scientific conferences, resulting in 66 respondents. While this provides a useful starting point for gathering insights, further research is needed to advance understanding in this area. In particular, future studies should explore different formats for effectively communicating warning quality information to different user groups. Moreover, the existing knowledge gap concerning how to collect, evaluate and redistribute near-real-time data on weather impacts warrants greater attention.
6.1 Core information and warning language
In this study we found that there are some elements of a warning that are seen as core information: time, place and severity of the hazard. On top of that, impact information and behavioural advice are seen to add value and are essential for taking action. A recent study from Norway (Eikenes et al., 2025) supports this by suggesting an argumentative order of the content of warning messages: first providing a description of the hazard, followed by what the situation may mean (by categorial sub-headings summarising the content). Such a structure will produce plain language by removing barriers for finding information, understanding information, and using the information in decisions. Being able to understand the information in the warning is seen as important to several of the respondents in our study, and a few of them also explicitly mentioned that they would welcome information provided in “layman's language” or to be “communicated in easy language so that everyone can understand even if [English] is not their native language” in the free text questions. NMHSs producing and providing warnings should keep the language issue in mind, since many people are mobile and travel between countries. This means that people with diverse backgrounds need to understand national hazard warnings and be able to use them in a new location to stay safe (Sivle et al., 2024).
6.2 Verification builds trust
According to the respondents in this study, information about the quality of warnings was considered particularly valuable for enhancing trust and supporting decision making. This finding aligns with previous research reporting that verification results can lead to increased confidence in weather forecast information (Sivle et al., 2022). Among the different attributes of warning quality, the accuracy of severity, timing and location of the event were identified as the most critical factors. Similar results have been reported in studies on risk communication, where the credibility of warnings depends strongly on their perceived precision and relevance (Lindell and Perry, 2012).
Respondents also highlighted several formats and channels through which warning quality could be communicated. While not the most frequently selected option, providing quality information directly alongside the warning may open new and valuable opportunities for user engagement. For instance, as is well known among meteorologist, convective events such as thunderstorms and flash floods are particularly difficult to predict with high spatial and temporal accuracy. When warnings cover large areas but only parts of the region are actually impacted, trust in such warnings may be undermined (Trainor et al., 2015).
One potential approach could be the provision of warning quality information along with the warning based on (weather situation dependent) verification results. A further approach could be the integration of real-time updates on the evaluation of warnings, such as live information on storm tracks, rainfall intensity, and reported impacts or successful protective measures. Such impact-based communication can improve both comprehension and protective action (Potter et al., 2018). Previous studies have also shown that social media can be successfully used during disasters to understand the situation and coordinate efforts; however, real-time acquisition and analysis of data are critical (Vieweg et al., 2014). Furthermore, incorporating crowdsourced data – such as weather reports collected by NHMS weather apps, images of impacts or status reports from individuals, local newspapers or community groups – may strengthen the perception of warnings as credible and actionable (Goodchild and Glennon, 2010).
Due to DWD regulations, the code is not publicly available. The study uses only the data collected in the survey which was developed and conducted for the purpose of this study; it is therefore not publicly available.
KW and AS planned, conducted and analysed the survey among experts; KW planned, conducted and analysed the survey among a sample of the general public; KW and AS wrote the manuscript.
The contact author has declared that neither of the authors has any competing interests.
Publisher's note: Copernicus Publications remains neutral with regard to jurisdictional claims made in the text, published maps, institutional affiliations, or any other geographical representation in this paper. While Copernicus Publications makes every effort to include appropriate place names, the final responsibility lies with the authors. Views expressed in the text are those of the authors and do not necessarily reflect the views of the publisher.
This article is part of the special issue “EMS Annual Meeting: European Conference for Applied Meteorology and Climatology 2024”. It is a result of the EMS Annual Meeting 2024, Barcelona, Spain, 2–6 September 2024. The corresponding presentation was part of session ES2.1: Communication and media.
We thank all participants of the survey.
This paper was edited by Tanja Cegnar and reviewed by Amanda Blatch-Jones and Filip Bukowski.
Eikenes, Å., Sivle, A., and Jeuring, J.: Combining design-driven innovation with plain language to improve warning communication, Nordic Journal of Innovation in the Public Sector, in review, 2025.
Golding, B.: Towards the “perfect” weather warning: Bridging disciplinary gaps through partnership and communication, 270 pp., Springer Nature, https://doi.org/10.1007/978-3-030-98989-7, 2022.
Goodchild, M. F. and Glennon, J. A.: Crowdsourcing geographical information for disaster response: a research frontier, Int. J. of Digital Earth, 3, 231–241, https://doi.org/10.1080/17538941003759255, 2010.
Jolliffe, I. T. and Stephenson, D. B.: Forecast Verification: A Practioner's Guide in Atmospheric Sciences, Wiley, 292 pp., https://doi.org/10.1111/j.1467-985X.2004.00347_9.x, 2011.
Kaltenberger, R., Schaffhauser, A., and Staudinger, M.: “What the weather will do” – results of a survey on impact-oriented and impact-based warnings in European NMHSs, Adv. Sci. Res., 17, 29–38, https://doi.org/10.5194/asr-17-29-2020, 2020.
Lindell, M. K. and Perry, R. W.: The protective action decision model: Theoretical modifications and additional evidence, Risk Analysis: An International Journal, 32, 616–632, https://doi.org/10.1111/j.1539-6924.2011.01647.x, 2012.
Meteoalarm: The meaning of colours and symbols, https://meteoalarm.org/en/live/page/website-guide#list (last access: 14 November 2025), 2025.
Murphy, A. H.: What is a good forecast? An essay on the nature of goodness in weather forecasting, Wea. Forecast., 8, 281–293, https://doi.org/10.1175/1520-0434(1993)008<0281:WIAGFA>2.0.CO;2, 1993.
Potter, S., Harrison, S., and Kreft, P.: The Benefits and Challenges of Implementing Impact-Based Severe Weather Warning Systems: Perspectives of Weather, Flood, and Emergency Management Personnel, Wea. Climate Soc., 13, 303–314, https://doi.org/10.1175/WCAS-D-20-0110.1, 2021.
Potter, S. H., Kreft, P. V., Milojev, P., Noble, C., Montz, B., Dhellemmes, A., Woods, R. J., and Gauden-Ing, S.: The influence of impact-based severe weather warnings on risk perceptions and intended protective actions, Int. J. Disaster Risk Reduction, 30, 34–43, https://doi.org/10.1016/j.ijdrr.2018.03.031, 2018.
Potter, S. H., Knox, T., Mills, B., Taylor, A., Robbins, J., Cerrudo, C., Wyatt, F., Harrison, S., Golding, B., Lang, W., Harris, A. J. L., Kaltenberger, R., Kienberger, S., Brooks, H., and Tupper, A.: Research gaps and challenges for impact-based forecasts and warnings: Results of international workshops for High Impact Weather in 2022, Int. J. Disaster Risk Reduction, 118, 105234, https://doi.org/10.1016/j.ijdrr.2025.105234, 2025.
Sivle, A., Jeuring, J., Svehagen, M. L. F., Ovhed, M., Hagen, B., Borander, P., and Gislefoss, G.: Hva tenker innbyggerne om farlig vær og farevarsler?, Naturen, 5–6, 230–238, https://doi.org/10.18261/naturen.148.5-6.2, 2024.
Sivle, A. D., Agersten, S., Schmid, F., and Simon, A.: Use and perception of weather forecast information across Europe, Meteorological Applications, 29, e2053, https://doi.org/10.1002/met.2053, 2022.
Trainor, J. E., Nagele, D., Philios, B., and Scott, B.: Tornadoes, social science, and the false alarm effect, Weather, Climate, and Society, 7, 333–352, https://doi.org/10.1175/WCAS-D-14-00052.1, 2015.
Vieweg, S., Castillo, C., and Imran, M.: Integrating social media communications into the rapid assessment of sudden onset disasters, In International conference on social informatics, Springer International Publishing, Cham, 444–461, https://doi.org/10.1007/978-3-319-13734-6_32, 2014.
Weyrich, P.: To act or not to act: Warning communication and decision-making in response to weather-related hazards, Doctoral thesis, ETH Zurich, ETH Zurich Research Collection, https://www.research-collection.ethz.ch/entities/publication/4313befa-4b62-4ec1-9d7e-49a90ec71272 (last access: 14 November 2025), 2020.
Weyrich, P., Scolobig, A., Bresch, D. N., and Patt, A.: Effects of impact-based warnings and behavioural recommendations for extreme weather events, Weather, Climate, and Society, 10, 781–796, https://doi.org/10.1175/WCAS-D-18-0038.1, 2018.
WMO: WMO guidelines on multi-hazard impact-based forecast and warning services, WMO Doc. 1150, 34 pp., https://etrp.wmo.int/pluginfile.php/42254/mod_page/content/18/WMO-1150_multihazard-guidelines_en.pdf (last access: 14 November), 2015.
- Abstract
- Introduction
- Methodology and data
- Warning content and perception
- Warning quality and its communication
- Limitations and future research
- Summary and conclusions
- Code and data availability
- Author contributions
- Competing interests
- Disclaimer
- Special issue statement
- Acknowledgements
- Review statement
- References