 | 20 Jun 2019
Verifying the spatial consistency of the CAMS Radiation Service and HelioClim-3 satellite-derived databases of solar radiation using a dense network of measuring stations: the case of The Netherlands
Mathilde Marchand
Mireille Lefèvre
Laurent Saboret
Etienne Wey
Lucien Wald
The present work deals with two well-known databases of hourly mean of solar irradiance that are derived from satellite imagery: the CAMS Radiation Service version 3.2, abbreviated as CAMS-Rad and part of the Copernicus Atmosphere Monitoring Service version 3.2 (CAMS), and the HelioClim-3 version 5, abbreviated as HC3v5. It adds up to the continuous documentation of these two databases that demonstrates that both databases capture the temporal and spatial variability of the solar radiation and are reliable sources of data. The spatial consistency of the uncertainties of these databases is verified against measurements performed within a dense network of ground stations in the Netherlands from the Royal Meteorological Institute KNMI for the period 2014–2017.
For the CAMS-Rad database, the correlation coefficients between ground measurements and estimates are around 0.94–0.97 for irradiance E and 0.85–0.89 for clearness index KT. The bias ranges between −12 and 27 W m−2 (−4 % and 10 %). The standard deviation for E is almost constant at all stations and around 67 W m−2 (24 %) except at Valkenburg (57 W m−2, 20 %) and De Bilt (73 W m−2, 27 %). For this database, the statistical indicators are constant at inland stations showing the spatial consistency of the performances of CAMS-Rad dataset. At seashore stations, statistical indicators are more variable. The sea proximity influences CAMS-Rad performances and a weak spatial consistency is observed near seashore.
For the HC3v5 database, the correlation coefficients are around 0.96–0.98 for E and 0.86–0.91 for KT. The bias ranges between −3 and 15 W m−2 (−1 % and 5 %). The standard deviation ranges between 48 (17 %) and 60 W m−2 (22 %). It is constant at inland stations and around 54 W m−2 (20 %) with peaks at Ell (59 W m−2, 21 %) and De Bilt (60 W m−2, 22 %). For this database, statistical indicators are constant at all stations as a whole, showing a strong spatial consistency of uncertainties. An exception is the standard deviation which tends to decrease at the seashore stations and is close to 50 W m−2 (17 %); this could be related to the general trend of decreasing standard deviation with increasing KT already reported in the scientific literature.
As a whole, it is found that both databases are reliable sources on solar radiation in the Netherlands.
- Article
(1544 KB) - Full-text XML
- BibTeX
- EndNote


The downwelling solar radiation received at ground level is known to be an essential variable in many domains (Lefèvre et al., 2014), including weather and climate, but also life on Earth for animals, plants (Bois et al., 2008; Colombo et al., 2009; Wagner et al., 2012) and humans (Juzeniene et al., 2011), or solar energy. The solar irradiance E is the density of power received from the sun on a horizontal surface at ground level and per unit surface.
High to good quality measurements of E can be reached with ground-based instruments if well maintained. Unfortunately, such instruments are quite few in the world. Other means are exploited to assess E at any place and any time. Several meteorological reanalyses provide estimates of E for the entire world and span several decades back in time, such as ERA-Interim, ERA5, MERRA, and MERRA-2. Published validations of these reanalyses against measurements of E performed by instruments based inland or offshore found that the bias is not constant in space and reported that these reanalysis exhibits large standard deviation of errors (Bengulescu et al., 2017; Boilley and Wald, 2015; Jones et al., 2017; Trolliet et al., 2018). It is also reported that reanalyses often exhibit cloudy conditions while actual conditions are cloud-free and vice versa.
Satellite images are another means to having a synoptic view of E over several decades (see e.g. Amillo et al., 2014; Lefèvre et al., 2014; Müller et al., 2015). For example, the series of geostationary Meteosat satellites offer synoptic views of Europe, Africa and the Atlantic Ocean since 1983 with a spatial resolution of approximately 3 km at nadir and a temporal frequency of 30 min for the first generation and 15 min for the second generation. Several databases have been created from the Meteosat images. Two of these are dealt with in this article: the CAMS Radiation Service, abbreviated as CAMS-Rad and part of the Copernicus Atmosphere Monitoring Service (CAMS), and the HelioClim-3 version 5, abbreviated as HC3v5. Both databases are available online (http://www.soda-pro.com/, last access: 6 May 2019) and are used by several hundred academics and engineers each year (Thomas et al., 2016a). HC3v5 data is not for free except for the period 2004–2006. Time series used for this work are freely available on request. These databases are routinely validated against ground-based measurements. Results are publicly available, and this provides up to date knowledge of each database to their users. For example, within the CAMS Radiation Service, an “evaluation and quality assurance” report is published every 3 months at: https://atmosphere.copernicus.eu/supplementary-services (last access: 12 January 2018). Each report contains the results of the comparison against measurements made at several stations in Europe, Africa and South America. Validations of CAMS-Rad and HC3v5 have been performed at various measuring stations in the tropical Atlantic Ocean (Trolliet et al., 2018), Brazil (Thomas et al., 2016a), Egypt (Eissa et al., 2015), Europe (Thomas et al., 2016b), Morocco (Marchand et al., 2018), and Oman (Marchand et al., 2017).
The present work adds up to the continuous documentation of these two databases that demonstrates that both databases capture the temporal and spatial variability of E and are reliable sources of solar radiation. It focuses on the verification of the spatial consistency of both databases using the dense network of measuring stations in the Netherlands. The stations are close one to each other and are experiencing the same climate. For a given database, the quality is expected to be the same at all stations. This is checked by comparing hourly means of E from the measurements to those from each database. This article addresses the question of how the accuracy of the satellite-derived estimate varies within an area of limited extension under the same climate. A small variability increases the confidence a user may have in using this database.
The stations and their measurements are described in Sect. 2. CAMS-Rad and HC3v5 are described in Sect. 3. Results are presented and discussed in Sect. 4. Section 5 “Conclusions and perspectives” concludes the article.
The Royal Meteorological Institute KNMI is operating a network of 32 stations in the Netherlands measuring the hourly mean of global irradiance on horizontal surface E. In this study, 16 stations were selected (Fig. 1). From North to South, Leeuwarden, Marknesse, Deelen, Volkel, Ell, and Maastricht are located approximately on the same longitude and are inland stations. From East to West, Twenthe, Hupsel, Deelen, De Bilt, Cabauw, Valkenburg, and Voorschoten are located approximately on the same latitude. The five first are also inland stations. Valkenburg, and Voorschoten are very close from each other (approx. 3 km) and are located approximately at 10 km from the shoreline. The four stations De Kooy, Wijk An Zee, Hoek Van Holland, and Vlissingen are along the shoreline, from North to South. The elevation of the stations above the mean sea level is small, ranging from 0 at De Kooy and Valkenburg to 114 m at Maastricht.
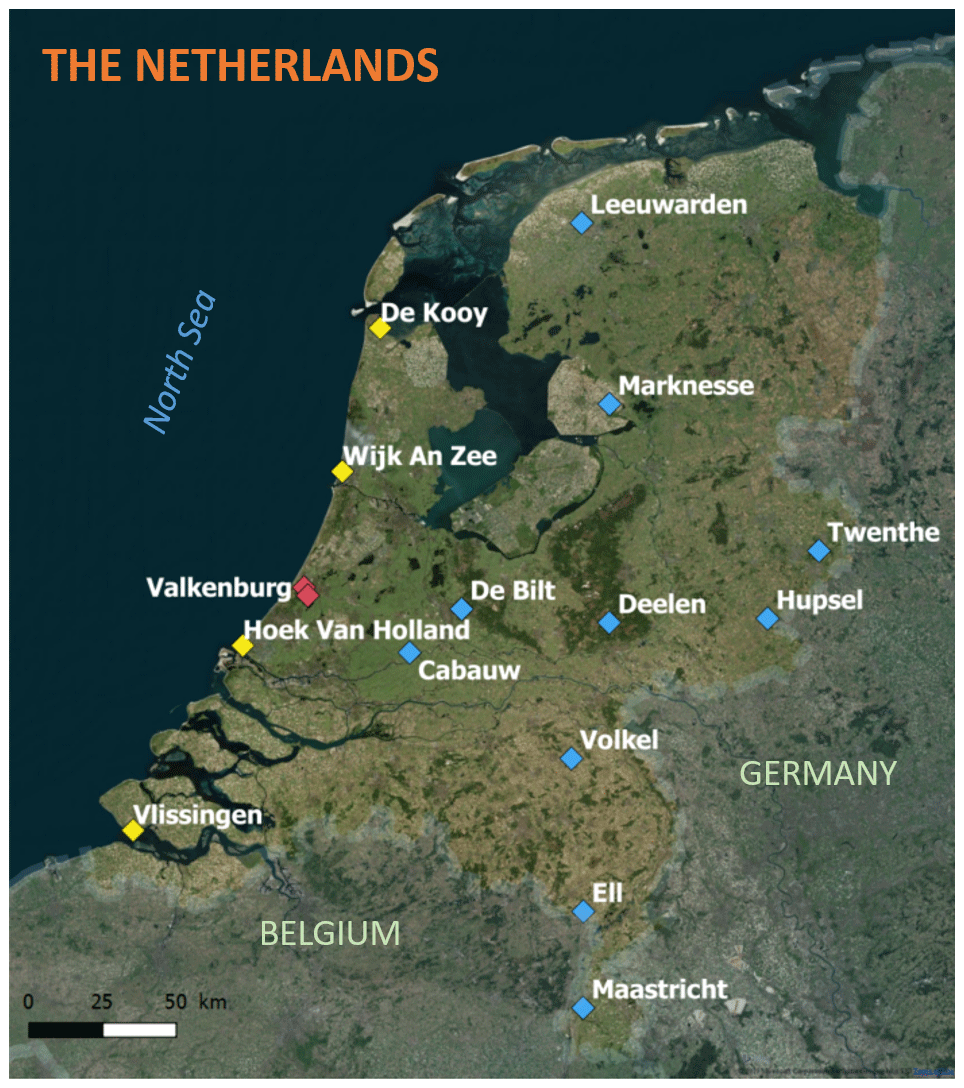
Figure 1Map of the selected stations. In blue: inland sites. In yellow: coastal sites. In red: stations close to the seashore.
Figure 2 displays the average of the retained measurements for the period 2014–2017 at each station. According to the Köppen-Geiger climate classification (Peel et al., 2007), the climate in the Netherlands is of Cfb type, i.e. a temperate climate without dry season and warm summer. This country has a large marine facade and is under the influence of the North Sea and the Atlantic Ocean. Stations exhibit averages of irradiance which are close one to each other and range between 266 and 295 W m−2. However, one may note that the stations on the shoreline exhibit the greatest averages; the frequency of cloud-free conditions and thus of the greatest irradiances is less inland than along the shoreline.
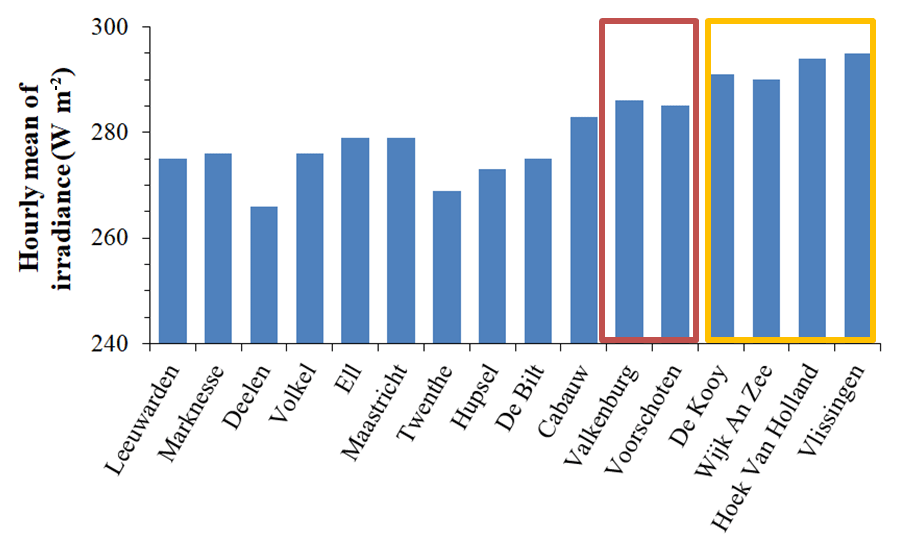
Figure 2Average of the hourly mean of irradiance for the period 2014–2017 at the selected stations. Colors refer to the map in Fig 1.
The measurements made by the KNMI stations by the means of Kipp and Zonen CM-11 pyranometers are made available to anyone on the KNMI web site (https://www.knmi.nl, last access: 13 April 2018). In the framework of CAMS, MINES ParisTech is collecting routinely the measurements of E for validation purposes. An automated procedure – detailed in Korany et al. (2016) – checks whether the measurements of E exceed physically possible and extremely rare limits and flags them as suspicious. Then, a visual check is performed on the results to flag other outliers. Finally, the data are stored with their flags for subsequent analysis.
In this work, data were extracted for the period 2014 to 2017. Only non-suspicious data were used. A further constraint is applied considering that the lowest values can be mostly noise and are therefore insignificant in a validation process. Taking into account the uncertainty (defined as twice the standard deviation of the errors) given by WMO (2012) for measurements of moderate quality of 50 W m−2, a threshold of 75 W m−2 is set which is equal to 1.5 times this uncertainty. If E>75 W m−2, there is a 99.7 % chance that the actual irradiance is significantly different from 0 and that it can be used for the comparison. All measurements less than this threshold were rejected.
The measurements were used as reference against satellite-derived estimates. The validation was performed for both E and the clearness index KT. KT is defined as the ratio of E to the irradiance E0 at the top of atmosphere on a horizontal surface for a given instant. KT is much less dependent than E on the solar zenithal angle and is a stricter indicator of the ability of a database in assessing the optical state of the atmosphere. KT for cloud-free conditions is close to 0.7, while it is close to 0.2 in overcast conditions. One may note that KT is not correlated to E. For example, in cloud-free conditions, E depends mostly on the solar zenithal angle. It is of high magnitude when the sun is close to the zenith and of medium magnitude when the sun is half-way between the zenith and horizon, while KT is close to 0.7 in both cases.
Differences were obtained by subtracting measurements from the satellite-derived estimates. They were summarized by the bias (mean of the differences), their standard deviation and root mean square error, the correlation coefficient and the slope of the fitting line between the measurements and the estimates to assess. Additional indicators and graphs were computed and drawn to provide an in-depth view of the differences. The bias denotes the systematic error. A very large correlation coefficient combined with a slope close to 1 and a low standard deviation of the errors ensures that the variability of the measurements is well reproduced by the satellite-derived data set.
The first series of Meteosat geostationary satellites was initiated in the 70's by the European Space Agency to provide synoptic views of the clouds and other phenomena over Europe, Africa and Atlantic Ocean to the meteorological community. The Meteosat programme is currently operated by EUMETSAT, an agency in Germany. The Meteosat second generation satellites have an Earth observing multispectral imager SEVIRI that comprises 12 channels, enabling an accurate depiction of the cloud properties. There are 4 images per hour and the spatial resolution is 3 km at nadir.
The HelioClim databases result from an ambitious initiative of MINES ParisTech launched in 1997 aiming at providing knowledge on the solar radiation at any place in the field of view of Meteosat (Blanc et al., 2011). The HelioClim-3 database is being constructed from images acquired by the SEVIRI since February 2004. Once the multispectral images converted in radiances, the radiances of the two narrow visible bands of the SEVIRI are combined to produce broadband radiances that are almost identical to those observed in the broadband channel of the imager aboard the Meteosat first generation satellites (Cros et al., 2006). The Heliosat-2 method (Lefèvre et al., 2007; Rigollier et al., 2004) combined with the ESRA clear-sky model (Rigollier et al., 2000, with revisions in Geiger et al., 2002) is applied to these broadband radiances to yield estimates of the solar irradiance. A clear-sky model is a model predicting the solar irradiance in cloud-free conditions. The cloud-free irradiance is multiplied by a cloud index denoting the extinction due to the possible presence of clouds. The cloud index is computed at each instant by comparing the observed radiance to that which should be observed if the sky were cloud free. HelioClim-3 time series of data are obtained from the SoDa web site (http://www.soda-pro.com/, last access: 6 November 2018) (Gschwind et al., 2006). When a request for a time-series is made by any user, post-processing algorithms are applied on-the-fly in order to correcting observed drawbacks and bringing improvements to the original HC3 database, thus creating different versions of the HelioClim-3 database. An example of on-the-fly improvements is the modulation of the data stored in HelioClim-3 to account for the elevation of the required location and the shadowing effect of the horizon. This post-processing approach has avoided several re-processing phases of the whole set of images dating back to 2004. HC3v5 is the most recent version. It calls upon a very accurate modelling of the cloud-free conditions by the CAMS McClear clear-sky model (Gschwind et al., 2019; Lefèvre et al., 2013) with inputs on aerosols, and atmospheric content in ozone and water vapour from CAMS as recommended by Qu et al. (2014).
Oumbe et al. (2014) have shown that the global, respectively direct, solar irradiance at ground level under all-sky conditions can be accurately approximated by the product of the cloud-free global, direct, irradiance and a factor depending of the solar zenithal angle, cloud properties and ground reflective properties, and sometimes termed “cloud modification factor” or “clear-sky index”. The more recent Heliosat-4 method (Qu et al., 2017) is based on this approximation. The cloud-free solar irradiance is given by the McClear model with CAMS atmospheric constituents as inputs (Lefèvre et al., 2013). The SEVIRI images are routinely processed by the German Aerospace Center (DLR) using the APOLLO method (Qu et al., 2017), yielding cloud properties that are input to Heliosat-4 to compute the cloud modification factor. Other inputs are the solar angles computed by the Solar Geometry 2 algorithm (Blanc and Wald, 2012) and a data set provided by MODIS describing the bidirectional reflectance of the ground (Blanc et al., 2014). These inputs are stored at Transvalor, MINES ParisTech and DLR as databases. The results of the Heliosat-4 method yield the CAMS-Rad database. By construction, the CAMS Radiation Service performs the calculation of the radiation on-the-fly at the request of any user. It processes the necessary information and does not create a proper database of the results. It follows that the CAMS-Rad database is also a live collection of data and is more or less easily corrected a posteriori as flaws or drawbacks are discovered, yielding several versions that apply from now on back to 1 February 2004. For example, version 3 of the CAMS Radiation Service was introduced on 11 October 2017 for reduction of bias and removal of potential discontinuities in time series or maps. Major changes were made in the process itself, permitting the removal of these discontinuities and easing future changes in the process. CAMS-Rad v3.2 is the most recent version and calls upon the latest version v3 of the McClear model (Gschwind et al., 2019).
CAMS-Rad and HC3v5 time series of hourly mean of irradiance E were obtained at the sixteen stations from the SoDa web site. These time-series also contain the irradiance at the top of atmosphere on a horizontal surface, E0, thus allowing the computation of the clearness indices KT.
Figure 3 displays the correlation coefficients for E and KT at the sixteen stations for CAMS-Rad (in blue) and HC3v5 (in red). The correlation coefficients for E are large and range between 0.94 and 0.97 for CAMS-Rad, and between 0.96 and 0.98 for HC3v5. There is almost no variation from station to station. The coefficients are slightly less for KT; they range between 0.85 and 0.89 for CAMS-Rad and between 0.86 and 0.91 for HC3v5. As for the latter, one may note that the correlation coefficient for KT tends to increase as the latitude decreases. There is no obvious cause for this observation, though caution should be taken as the range of latitude is small.

Figure 3Correlation coefficients for irradiance E and clearness index KT at the sixteen stations for CAMS-Rad (in blue) and HC3v5 (in red).
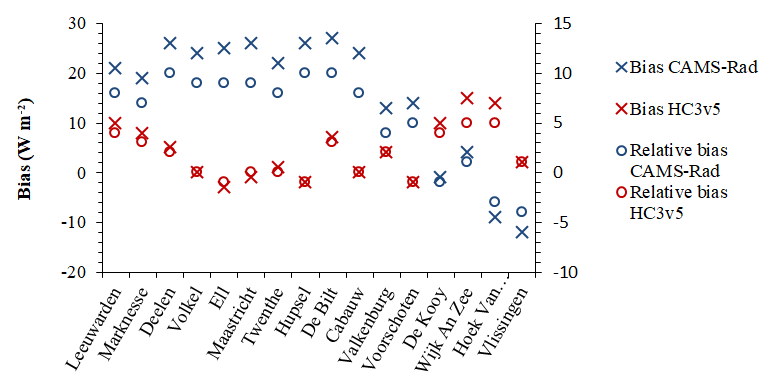
Figure 4Bias (left axis) and relative bias (in percent, right axis) for irradiance E at the sixteen stations for CAMS-Rad (in blue) and HC3v5 (in red).
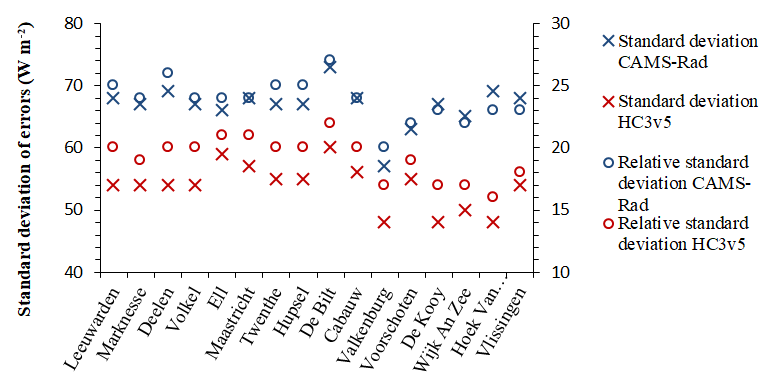
Figure 5Standard deviation of errors (left axis) and relative standard deviation (in percent, right axis) for irradiance E at the sixteen stations for CAMS-Rad (in blue) and HC3v5 (in red).
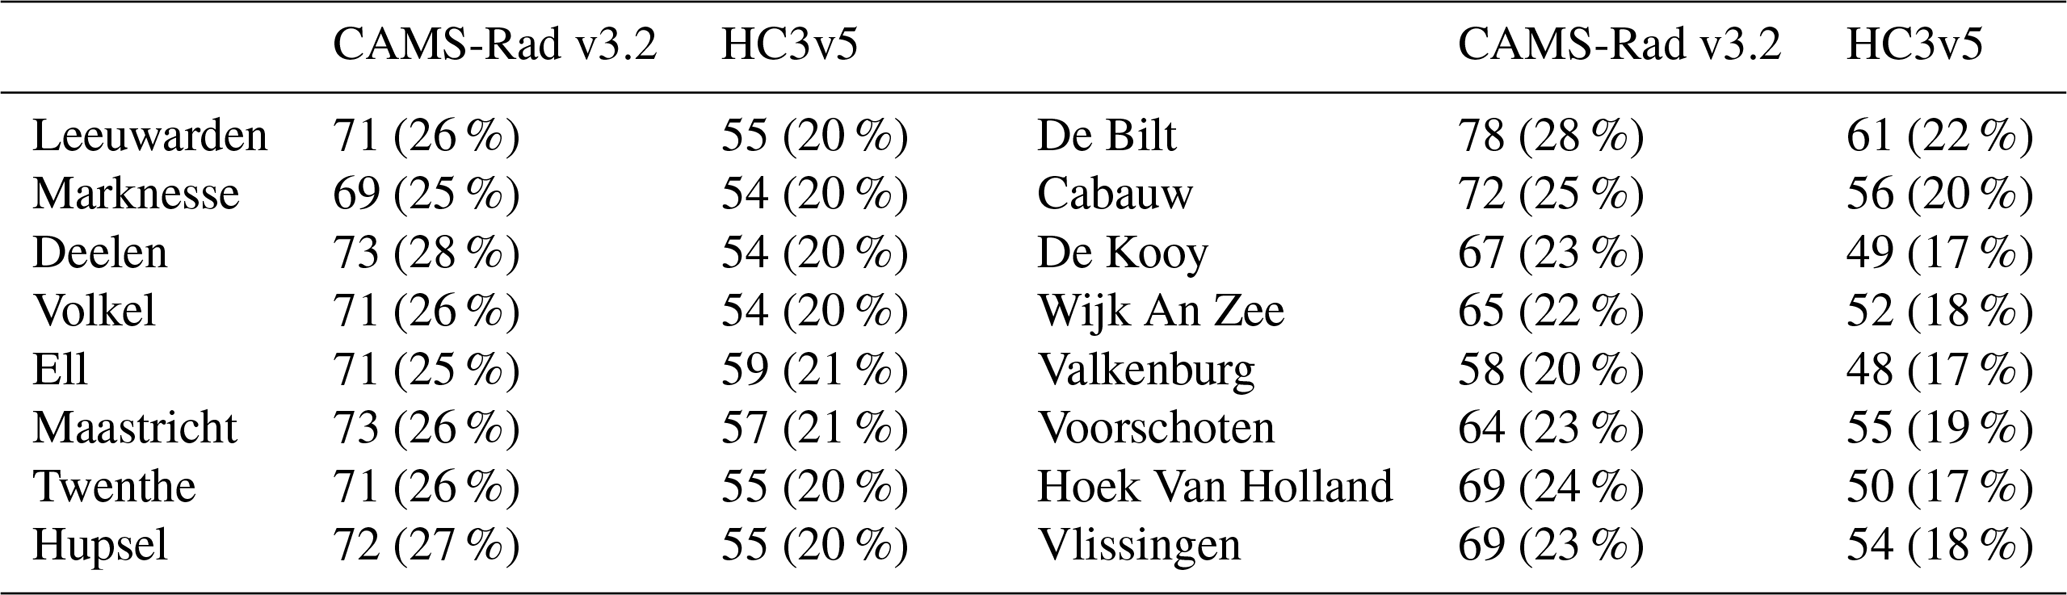
Figures 4 and 5 exhibit respectively the biases and relative biases (Fig. 4) and the standard deviations of errors and their relative values (Fig. 5) for E at the sixteen stations and for both databases. Table 1 reports the root mean square errors (RMSE) and their relative value. The relative values are computed by dividing the biases, standard deviations and RMSE by the mean of irradiance at each station (Fig. 2).
Table 1Root mean square error (RMSE, in W m−2) and its relative value in percent at each station for each database.
For CAMS-Rad database (in blue in Figs. 4 and 5), the bias ranges between −12 and 27 W m−2 (−4 % and 10 % in relative value). Figure 4 shows that the bias is fairly constant at the inland stations and in the range [19, 27] W m−2. It is less at the stations close to or at the seashore (rightmost part of the graph) and is negative at the two southernmost coastal sites: Hoek van Holland (−9 W m−2) and Vlissingen (−12 W m−2). This denotes a clear influence of the proximity to the coast or of the latitude on the bias. On the contrary, no such influence is found for the standard deviation. It ranges between 57 and 73 W m−2 ([20 %, 27 %]). Actually, one may note visually in Fig. 5, that it is almost constant at all stations and around 67 W m−2 (ca. 24 %) with two exceptions: Valkenburg (57 W m−2, 20 %) and De Bilt (73 W m−2, 27 %).
For HC3v5 database, the bias (in red in Fig. 4) fluctuates around 0 W m−2 with no specific trend or other feature. It ranges between −3 (Ell) and 15 W m−2 (Wijk An Zee), i.e. between −1 % and 5 % in relative value. The variation from station to station is small. There is no clear influence of the proximity to the coast or of the latitude. The standard deviation (in red in Fig. 5) ranges between 48 and 60 W m−2, i.e. between 17 % and 22 % in relative value. Figure 5 shows that the standard deviation is constant at the inland stations (leftmost part of the graph) and around 54 W m−2 (20 %) with some peaks at Ell (59 W m−2, 21 %) and De Bilt (60 W m−2, 22 %). The values at the stations close to or at the coastline (rightmost part) are close to 50 W m−2 (17 %) and are less than at inland stations. The difference is small and its significance may be questioned. However, the decrease is observed at all stations close to or at the coastline.
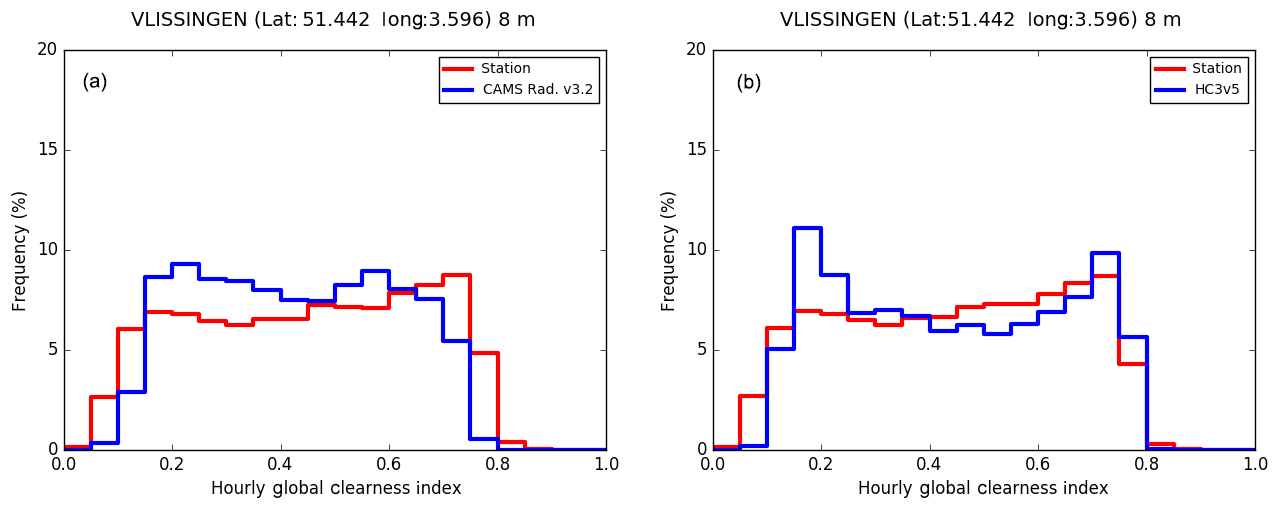
Figure 6Frequency distribution of the clearness index at Vlissingen for the measurements (in red) and CAMS-Rad (in blue in a) and HC3v5 (in blue in b).
The decrease in standard deviation could be related to the more frequent cloud-free cases at these stations compared to the inland stations (Fig. 2). In cloud-free conditions, and provided Heliosat-2 identify correctly the cloud free cases, the uncertainties of HC3v5 are those of the McClear clear sky model with CAMS data as inputs. The McClear model with CAMS data as inputs has been shown to be accurate for such a climate with very low biases and low standard deviations of errors (Gschwind et al., 2019; Lefèvre et al., 2013; Thomas et al., 2016b). The low standard deviation in cloud-free conditions combined with the higher frequency of these conditions at the stations close to or at the coastline compared to inland stations may explain the smaller standard deviations at the former compared to the latter.
Since Heliosat-4 is also using the McClear model, this observation should be also true for CAMS-Rad which is actually not. This could be related to some drawbacks in the identification of the actual cloud-free conditions. This is illustrated in Fig. 6 displaying the distribution frequency of the clearness index for the measurements and each database at Vlissingen. It appears (left graph) that CAMS-Rad underestimates the frequency of cloud-free conditions (corresponding to large clearness index, greater than 0.7) while HC3v5 provides a more accurate estimate (right graph). The CAMS “evaluation and quality assurance” reports indicate that these discrepancies for CAMS-Rad may be traced back to the over- or underestimation of the occurrences of cloud-free cases or to any gross errors in aerosol conditions modelled as input to McClear. Since correct results are obtained for HC3v5, systematic gross errors in aerosol properties may be ruled out in this study. These reports also indicate that the validation performed is not able to discriminate the cases of underestimation of the occurrences of cloud-free cases and those of overestimation of the optical depth of the optically thin clouds, both cases appearing as an underestimation by CAMS-Rad of the frequency of large clearness indices.
Figure 7 displays the slopes of the fitting line for E and KT at the sixteen stations for CAMS-Rad (in blue) and HC3v5 (in red). The closer to 1 the slope, the better. The slopes for CAMS-Rad for E are close to 1 at the inland stations. They are less than 1 at the stations on the shoreline (0.94 and 0.91); this may be related to the underestimation of the cloud-free conditions, and thus of the greatest E. The slopes for CAMS-Rad for KT are also less than 1, are more constant and do not depend on the stations. They range between 0.84 and 0.88, indicating an underestimation of the range of variation of KT. This could be related to the underestimation of the cloud-free conditions that happen at all stations and that result in the underestimation of the greatest KT. As for HC3v5, the slope for E is in the range [0.99, 1.03] indicating an accurate estimation of the range of variation of E; that for KT is more variable and ranges between 0.93 and 1.03. For both E and KT, there is no clear dependency with the stations.
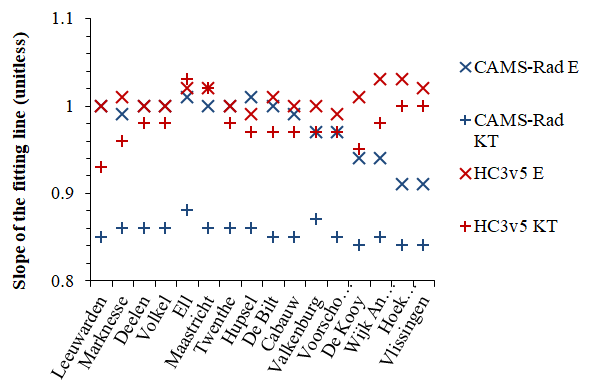
Figure 7Slopes of the fitting line for irradiance E and clearness index KT at the sixteen stations for CAMS-Rad (in blue) and HC3v5 (in red).
One may ask if the estimates from CAMS-Rad and HC3v5 meet the definition of “moderate quality” of measurements as set up by WMO (2012). Defined as the 95 % probability (P95), the relative uncertainty for “moderate quality” should not exceed 20 % for hourly mean of irradiance (WMO, 2012). Here, both the uncertainty of KNMI measurements and the uncertainty of the satellite-derived estimates should be taken into account. The total uncertainty can be expressed as the square root of the quadratic sum of both uncertainties in a first approximation. Assuming that both the KNMI measurements and the satellite estimates meet the “moderate quality”, the relative total uncertainty would be equal to 28 %. If one assumes in addition that the relative total uncertainty can be expressed by twice the relative RMSE, one can see from Table 1 that the relative total uncertainty is around 50 % for CAMS-Rad and 40 % for HC3v5, well above 28 %. It can be concluded that to a first approximation, the quality of CAMS-Rad and HC3v5 estimates is less than “moderate quality”. Efforts are needed to decrease the bias as well as the scattering of the errors around the bias. This disagrees with conclusions from previous studies which report that both datasets met the moderate quality for Arabic Peninsula (Marchand et al., 2016), Morocco (Marchand et al., 2018) and tropical Atlantic Ocean (Trolliet et al., 2018). This disagreement is likely related to the greatest occurrence of cloud-free days in these 3 regions compared to the Netherlands. The re-examination of results of Thomas et al. (2016a, b) and Eissa et al. (2015) confirms that the relative RMSE and standard deviations tend to decrease as mean KT increases, i.e. as the occurrence of cloud-free conditions is increasing.
This paper reports on a comparison of two satellite-derived radiation databases against the measurements of 16 stations in the Netherlands. We apply a quality control to use only non-suspicious data.
It was found that the two databases reproduce the hour-to-hour changes in E very well with correlation coefficients for the solar irradiance E of around 0.94–0.97 for CAMS-Rad and 0.96–0.98 for HC3v5. For KT, the coefficients are slightly less and are in the range [0.85, 0.89] for CAMS-Rad and [0.96, 0.91] for HC3v5.
Regarding the spatial consistency of the uncertainties of the satellite estimates, mixed outcomes were obtained. There is a clear influence of the proximity to the coast or of the latitude on the bias for CAMS-Rad: it tends to be less at the stations close to or at the seashore. At these stations, there is a tendency to underestimate the occurrence of cloud-free conditions, and therefore to underestimate the greatest E and KT; the slope is less than 1. On the contrary, no such influence is found for the standard deviation but the values are large (around 24 % in relative values).
As for HC3v5, the bias ranges between −3 and 15 W m−2 (−1 % and 5 %) with no specific trend or feature, and no clear influence of the proximity to the coast or of the latitude. For both E and KT, the slopes of the fitting lines are close to 1 and there is no clear dependency with the stations. At that point, one may conclude that the performances of HC3v5 do not depend on the station. However, it is observed that the standard deviation is slightly less at the stations close to or at the coastline (50 W m−2, 17 %) than at the inland stations (54 W m−2, 20 %). This decrease is likely related to the more frequent cloud-free cases at the seashore compared to the inland stations.
Efforts are needed to decrease the bias as well as the scattering of the errors around the bias. This observation is related to the climate in the Netherlands: temperate climate without dry season and warm summer. The difference between the results of this study and those from previous studies may be partly explained by the number of cloud-free days in Arabic Peninsula, Morocco and tropical Atlantic Ocean compared to the Netherlands. This comparison with previous studies confirms that the relative RMSE and standard deviations tend to decrease as the occurrence of cloud-free conditions is increasing (i.e. increasing mean KT).
Measurements performed at the KNMI stations are available online at the KNMI web site (https://www.knmi.nl, last access: 13 April 2018). CAMS-Rad and HC3v5 are available online at the SoDa website (http://www.soda-pro.com/, last access: 6 May 2019). Time series used for this work are freely available on request (mathilde.marchand@transvalor.com).
MM and LW designed the study. ML collected the data from the KNMI. ML, LS and EW performed the calculations. MM set up the first draft of the paper. ML, LS, EW and LW contributed to the final writing and the revisions.
The authors declare that they have no conflict of interest.
This article is part of the special issue “18th EMS Annual Meeting: European Conference for Applied Meteorology and Climatology 2018”. It is a result of the EMS Annual Meeting: European Conference for Applied Meteorology and Climatology 2018, Budapest, Hungary, 3–7 September 2018.
The authors praise the KNMI for the quality of their measurements and for making them available. The research leading to these results has been partly undertaken within the Copernicus Atmosphere Monitoring Service (CAMS) of the European Union.
This paper was edited by Sven-Erik Gryning and reviewed by Robert Hoeller, Ronny Petrik, and one anonymous referee.
Amillo, A. G., Huld, T., and Müller, R.: A new database of global and direct solar radiation using the Eastern Meteosat Satellite, models and validation, Remote Sens.-Basel, 6, 8165–8189, https://doi.org/10.3390/rs6098165, 2014.
Blanc, P. and Wald, L.: The SG2 algorithm for a fast and accurate computation of the position of the Sun, Sol. Energy, 86, 3072–3083, https://doi.org/10.1016/j.solener.2012.07.018, 2012.
Blanc, P., Gschwind, B., Lefèvre, M., and Wald, L.: The HelioClim project: Surface solar irradiance data for climate applications, Remote Sens.-Basel, 3, 343–361, https://doi.org/10.3390/rs3020343, 2011.
Blanc, P., Gschwind, B., Lefèvre, M., and Wald, L.: Twelve monthly maps of ground albedo parameters derived from MODIS data sets, in: Proceedings of IGARSS 2014, 13–18 July 2014, Quebec, Canada, USBKey, pp. 3270–3272, 2014.
Bengulescu, M., Blanc, P., Boilley, A., and Wald, L.: Do modelled or satellite-based estimates of surface solar irradiance accurately describe its temporal variability?, Adv. Sci. Res., 14, 35–48, https://doi.org/10.5194/asr-14-35-2017, 2017.
Boilley, A. and Wald L.: Comparison between meteorological re-analyses from ERA-Interim and MERRA and measurements of daily solar irradiation at surface, Renew. Energ., 75, 135–143, https://doi.org/10.1016/j.renene.2014.09.042, 2015.
Bois, B., Pieri, P., Van Leeuwen, C., Wald, L., Huard, F., Gaudillere, J.-P., and Saur, E.: Using remotely sensed solar radiation data for reference evapotranspiration estimation at a daily time step, Agr. Forest Meteorol., 148, 619–630, https://doi.org/10.1016/j.agrformet.2007.11.005, 2008.
Colombo, R., Busetto, L., Migliavacca, M., Meroni, M., Della Torre, C., Tagliaferri, A., Grassi, G., and Seufert, G.: Modelling carbon cycle of agro-forest ecosystems in Lombardy (Italy), Forest, 6, 277–288, 2009.
Cros, S., Albuisson, M., and Wald, L.: Simulating Meteosat-7 broadband radiances at high temporal resolution using two visible channels of Meteosat-8, Sol. Energy, 80, 361–367, https://doi.org/10.1016/j.solener.2005.01.012, 2006.
Eissa, Y., Korany, M., Aoun, Y., Boraiy, M., Abdel Wahab, M., Alfaro, S., Blanc, P., El-Metwally, M., Ghedira, H., and Wald, L.: Validation of the surface downwelling solar irradiance estimates of the HelioClim-3 database in Egypt, Remote Sens.-Basel, 7, 9269–9291, https://doi.org/10.3390/rs70709269, 2015.
Geiger, M., Diabaté, L., Ménard, L., and Wald, L.: A web service for controlling the quality of measuments of global solar irradiation, Sol. Energy, 73, 475–480, https://doi.org/10.1016/S0038-092X(02)00121-4, 2002.
Gschwind, B., Ménard, L., Albuisson, M., and Wald, L.: Converting a successful research project into a sustainable service: the case of the SoDa Web service, Environ. Modell. Softw., 21, 1555–1561, https://doi.org/10.1016/j.envsoft.2006.05.002, 2006.
Gschwind, B., Wald, L., Blanc, P., Lefèvre, M., Schroedter-Homscheidt, M., and Arola, A.: Improving the McClear model estimating the downwelling solar radiation at ground level in cloud-free conditions – McClear-v3, Meteorol. Z., in press, published online on 25 March 2019, https://doi.org/10.1127/metz/2019/0946, 2019.
Juzeniene, A., Brekke, P., Dahlback, A., Andersson-Engels, S., Reichrath, J., Moan, K., Holick, M.F., Grant, W. B., and Moan, J.: Solar radiation and human health, Rep. Prog. Phys., 74, 066701, https://doi.org/10.1088/0034-4885/74/6/066701, 2011.
Jones, P. D., Harpham, C., Troccoli, A., Gschwind, B., Ranchin, T., Wald, L., Goodess, C. M., and Dorling, S.: Using ERA-Interim reanalysis for creating datasets of energy-relevant climate variables, Earth Syst. Sci. Data, 9, 471–495, https://doi.org/10.5194/essd-9-471-2017, 2017.
Korany, M., Boraiy, M., Eissa, Y., Aoun, Y., Abdel Wahab, M. M., Alfaro, S. C., Blanc, P., El-Metwally, M., Ghedira, H., Hungershoefer, K., and Wald, L.: A database of multi-year (2004–2010) quality-assured surface solar hourly irradiation measurements for the Egyptian territory, Earth Syst. Sci. Data, 8, 105–113, https://doi.org/10.5194/essd-8-105-2016, 2016.
Lefèvre, M., Diabaté, L., and Wald, L.: Using reduced data sets ISCCP-B2 from the Meteosat satellites to assess surface solar irradiance, Sol. Energy, 81, 240–253, 2007.
Lefèvre, M., Oumbe, A., Blanc, P., Espinar, B., Gschwind, B., Qu, Z., Wald, L., Schroedter-Homscheidt, M., Hoyer-Klick, C., Arola, A., Benedetti, A., Kaiser, J. W., and Morcrette, J.-J.: McClear: a new model estimating downwelling solar radiation at ground level in clear-sky conditions, Atmos. Meas. Tech., 6, 2403–2418, https://doi.org/10.5194/amt-6-2403-2013, 2013.
Lefèvre, M., Blanc, P., Espinar, B., Gschwind, B., Ménard, L., Ranchin, T., Wald, L., Saboret, L., Thomas, C., and Wey, E.: The HelioClim-1 database of daily solar radiation at Earth surface: an example of the benefits of GEOSS Data-CORE, IEEE J.-STARS, 7, 1745–1753, https://doi.org/10.1109/JSTARS.2013.2283791, 2014.
Marchand, M., Al-Azri, N., Oumbe-Ndeffotsing, A., Wey, E., and Wald, L.: Evaluating meso-scale change in performance of several databases of hourly surface irradiation in South-eastern Arabic Pensinsula, Adv. Sci. Res., 14, 7–15, https://doi.org/10.5194/asr-14-7-2017, 2017.
Marchand, M., Ghennioui, A., Wey, E., and Wald, L.: Comparison of several satellite-derived databases of surface solar radiation against ground measurement in Morocco, Adv. Sci. Res., 15, 21–29, https://doi.org/10.5194/asr-15-21-2018, 2018.
Müller, R., Pfeifroth, U., Träger-Chatterjee, C., Trentmann, J., and Cremer, R.: Digging the METEOSAT treasure – 3 decades of solar surface radiation, Remote Sens., 7, 8067–8101, https://doi.org/10.3390/rs70608067, 2015.
Oumbe, A., Qu, Z., Blanc, P., Lefèvre, M., Wald, L., and Cros, S.: Corrigendum to “Decoupling the effects of clear atmosphere and clouds to simplify calculations of the broadband solar irradiance at ground level” published in Geosci. Model Dev., 7, 1661–1669, 2014, Geosci. Model Dev., 7, 2409–2409, https://doi.org/10.5194/gmd-7-2409-2014, 2014.
Peel, M. C., Finlayson, B. L., and McMahon, T. A.: Updated world map of the Köppen-Geiger climate classification, Hydrol. Earth Syst. Sci., 11, 1633–1644, https://doi.org/10.5194/hess-11-1633-2007, 2007.
Qu, Z., Gschwind, B., Lefevre, M., and Wald, L.: Improving HelioClim-3 estimates of surface solar irradiance using the McClear clear-sky model and recent advances in atmosphere composition, Atmos. Meas. Tech., 7, 3927–3933, https://doi.org/10.5194/amt-7-3927-2014, 2014.
Qu, Z., Oumbe, A., Blanc, P., Espinar, B., Gesell, G., Gschwind, B., Klüser, L., Lefèvre, M., Saboret, L., Schroedter-Homscheidt, M., and Wald L.: Fast radiative transfer parameterisation for assessing the surface solar irradiance: The Heliosat-4 method, Meteorol. Z., 26, 33–57, https://doi.org/10.1127/metz/2016/0781, 2017.
Rigollier, C., Bauer, O., and Wald, L.: On the clear sky model of the ESRA – European Solar Radiation Atlas – with respect to the Heliosat method, Sol. Energy, 68, 33–48, https://doi.org/10.1016/S0038-092X(99)00055-9, 2000.
Rigollier, C., Lefèvre, M., and Wald, L.: The method Heliosat-2 for deriving shortwave solar radiation from satellite images, Sol. Energy, 77, 159–169, https://doi.org/10.1016/j.solener.2004.04.017, 2004.
Thomas, C., Wey, E., Blanc, P., and Wald, L.: Validation of three satellite-derived databases of surface solar radiation using measurements performed at 42 stations in Brazil, Adv. Sci. Res., 13, 129–136, https://doi.org/10.5194/asr-13-129-2016, 2016a.
Thomas, C., Wey, E., Blanc, P., Wald, L., and Lefèvre, M.: Validation of HelioClim-3 version 4, HelioClim-3 version 5 and MACC-RAD using 14 BSRN stations, 2015 Solar Heating and Cooling, Enrgy. Proced., 91, 1059–1069, 2016b.
Trolliet, M., Walawender, J. P., Bourlès, B., Boilley, A., Trentmann, J., Blanc, P., Lefèvre, M., and Wald, L.: Downwelling surface solar irradiance in the tropical Atlantic Ocean: a comparison of re-analyses and satellite-derived data sets to PIRATA measurements, Ocean Sci., 14, 1021–1056, https://doi.org/10.5194/os-14-1021-2018, 2018.
Wagner, R., Marxsen, J., Zwick, P., and Cox, E. J.: Central European Stream Ecosystems: The Long Term Study of the Breitenbach, Wiley, New York, NY, USA, 2012.
WMO: Guide to Meteorological Instruments and Methods of Observation, WMO-No 8, 2008 edition updated in 2010, World Meteorological Organization, Geneva, Switzerland, 2012.
- Abstract
- Introduction
- Description of measurements used for comparison and quality control
- The Meteosat satellites, the HelioClim database and the CAMS Radiation Service
- Results and discussion
- Conclusions and perspectives
- Data availability
- Author contributions
- Competing interests
- Special issue statement
- Acknowledgements
- Review statement
- References