 | 29 Jul 2019
A generic gust definition and detection method based on wavelet-analysis
Felix Ament
Björn Maronga
Wind gusts can have destructive effects on many structures and objects deemed valuable to humans. The aviation industry, for example, views gusts as a major hazard. Their destructive effect is proportional to the momentum that a specific gust imposes onto an object. The actual definition of a gust has a strong influence on how its impact can be quantified. Existing gust definitions, however, are largely based on fixed parameters describing shape requirements and thresholds and are often developed only for specific use cases. These gust definitions do not provide a direct link to the physical impact a particular gust has on a structure or object. The overall goal of this study is to provide such a direct link. The application of a wavelet-analysis to a turbulence-resolving wind velocity signal allows for the localization of signal amplitudes in the period as well as in the time domain. In this paper, we use wavelet-analysis in order to develop a straight-forward method of deriving information about gusts from a wind velocity signal. In order to define what a particular gust might be, we suggest the specification of a characteristic period and amplitude in the time-domain. We define a generic gust as a section of a wind velocity signal, where the wavelet-analysis detects that characteristic amplitude to be matched or exceeded within that characteristic period. The characteristic amplitudes and periods are generic and span a two-dimensional space of generic gust definitions. The method can be applied to turbulence resolving simulation data as well as high-resolution wind velocity measurement data. It can detect gusts of any shape, it is unbiased regarding any specific use case and invariant to changes of the mean wind. We provide a detailed description of the method, its capabilities and demonstrate its application to high resolution wind velocity measurement data.
- Article
(1999 KB) - Full-text XML
- BibTeX
- EndNote


Wind gusts are generally considered an aviation hazard, as they can cause loads on the aircraft structure that potentially exceeds its load limits and may lead to structural damage. Especially close to the ground during takeoff and landing the aircraft is particularly vulnerable as sudden changes in wind speed can cause unrecoverable loss of control even if load limits are not exceeded (Frost and Reddy, 1978). Wind gusts induced by surface features such as vegetation or buildings in the vicinity of airports are therefore particularly dangerous. Other industries like wind energy (Ciang et al., 2008), construction (ASCE, 2013) and forestry (Jackson et al., 2019) are also coping with the destructive effects of wind gusts. Even city planers, concerned with the wind comfort of pedestrians, investigate gusts (Ahmad et al., 2017).
In order to prevent accidents or damage caused by wind gusts, reliable gust prediction methods are needed. Current numerical weather prediction models are not capable of resolving individual gusts due to their coarse resolution. They utilize wind gust estimation methods which use fully parameterized approaches like gust velocity estimates based on available turbulence kinetic energy (Brasseur, 2001). Weather reporting products based on observation data (e.g. METAR) currently define a wind gust with a peak-over-threshold approach. According to such a definition wind gusts are observed if the peak wind is more than a certain threshold stronger than the mean wind. Such a gust definition does not provide any information about the shape or amplitude of individual gusts.
Numerous existing studies focus on the shape of individual gusts. A collection of gust shape investigations based on mast measurement data can be found in Camp (1968), Kristensen et al. (1991), Verheij et al. (1992) and Bierbooms et al. (1999). Unfortunately, there is no consistent gust definition and detection method and approaches vary depending on the field of application. Existing literature suggest one-dimensional gust definitions aimed at aviation (Hoblit, 1988), weather forecast (Friederichs et al., 2009) or wind energy (Hau and von Renouard, 2015). Knigge and Raasch (2016) even provide a gust detection method for two-dimensional gusts. All these studies, however, suggest specific criteria that need to be met in order to detect a specific gust in a turbulence-resolving wind velocity signal. In these methods a gust is generally defined as a portion of the signal, where the wind velocity starts from a local minimum, exceeds a certain value at a local maximum and falls again below a certain value, all within a fixed time interval. They usually consist of fixed parameter sets describing shape requirements, thresholds and duration but do not provide information about how the amplitudes the signal consists of, are localized in the period domain and fail to create a direct link between a gust and its physical impact on a structure or object. They also fail to detect any superposition of gusts with different amplitude and duration.
The overall goal of this study is to provide a direct link between a gust and its physical impact using a generic gust definition. We aim to be able to detect individual generically defined gusts within a turbulence resolving wind velocity signal.
For the physical impact of an individual gust, the amplitude and duration are of major importance, as they determine the total momentum that the gust may transmit onto an object. Amplitude and duration of an individual gust therefore determine if an object is significantly affected by the gust. The inertia of e.g. an aircraft can be overcome by sufficient force (proportional to the gust amplitude) over a sufficiently long duration. Conversely that aircraft might fail to counteract the impact of a gust with its flight controls, if the gust duration is too short (Frost and Reddy, 1978).
Aircraft manufacturers take amplitude and duration of gusts into account as they design an aircraft. The two main regulatory documents for aircraft design with respect to gust loads are FAA AC 25.341 (2014) and EASA CS 25.341 (2007). In accordance with these regulations, aircraft manufacturers are required to compute a gust load limit envelope which describes the range of gust loads the aircraft can safely operate in. Such an envelope is computed using an idealized gust model that represents a gust to have the shape of a single 1-cosine oscillation. Amplitude and period of these idealized gusts are varied within a structural load simulation in order to determine the amplitude and period ranges that lead to gust loads the aircraft can safely operate in. The limits of these amplitude and period ranges define the gust load limit envelope. Note that such gust load limit envelopes can also be computed for any other object or structure like a wind turbine, a building or even a pedestrian.
To create a direct link between a gust load limit envelope of an object and a gust in a real turbulence-resolving wind velocity signal, we assume that any such signal can be viewed as a superposition of many roughly 1-cosine shaped oscillations with varying amplitude and period. Fourier-Analysis is a common way of investigating what periods are contained in an oscillating signal. Unfortunately, Fourier-Analysis does not provide any localization in the time domain, which is required in order to identify individual gusty sections within a wind velocity signal. Using the wavelet transform of this signal, however, allows to determine what amplitude at what periods are contained in this very signal at a given time.
The wavelet transform can be used to analyze signals with a heterogeneous distribution of amplitudes over a wide range of periods (Daubechies, 1990). It is therefore a viable tool to investigate how the amplitudes, the signal is composed of, change over time and what the dominant oscillation periods are.
For the wavelet transform used in this work, we chose the real-valued second derivative of a Gaussian (DOG2) wavelet, also known as the Mexican hat wavelet, because of its good localization in time and its close resemblance of a single 1-cosine gust. Its mother wavelet function reads
and depends on the non-dimensional time η.
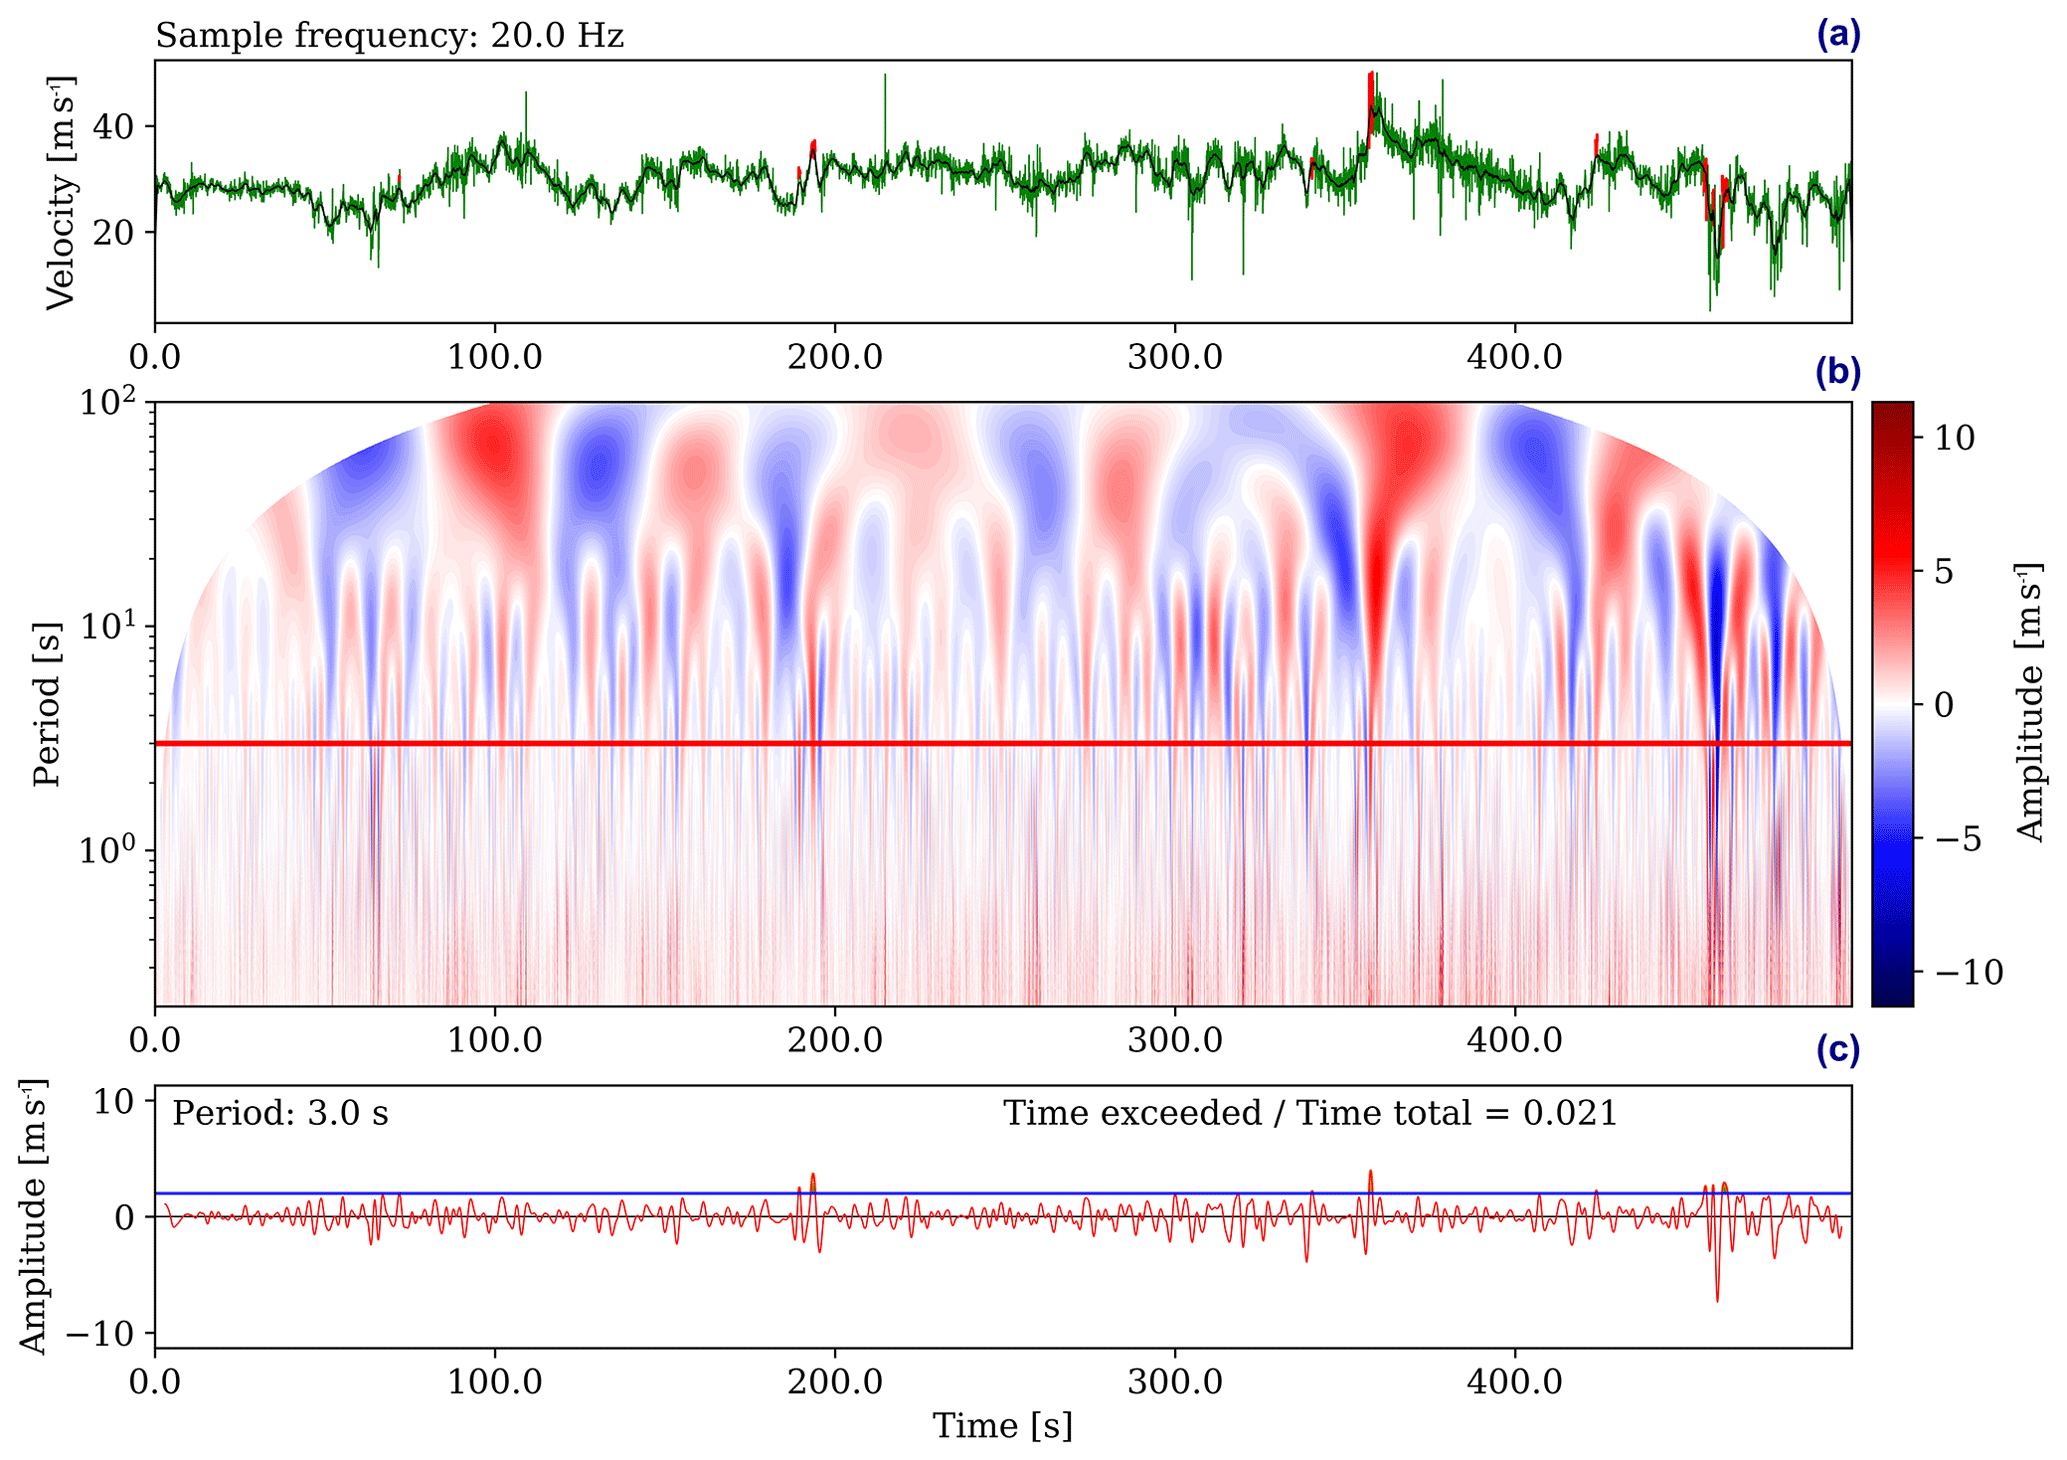
Figure 1(a) shows a 500 s long portion of turbulence-resolving wind velocity data (green) taken from mast-measurements at the Hamburg Weather Mast. The running mean with a window of 3 s is shown in black and detected gusts are marked in red. (b) shows the 2-D contour of wind velocity amplitudes An(T) over a period range from 0.2 to 100 s. The color contour represents amplitudes contained in the wind velocity data depending on time and period. The white masked-out area within (b) is the COI. (c) shows wind velocity amplitudes An(T) for the distinct period of 3 s along the horizontal red line in (b). The blue line in (c) marks an amplitude of 2 m s−1. About 2.1 % of the investigated time series contains gusts that have a period of 2 s and an amplitude that matches or exceeds 2 m s−1. Note that an amplitude of 2 m s−1 means signal value changes of 4 m s−1.
Given a discrete turbulence-resolving wind velocity signal vn with ), the total number N of discrete data points and a constant time step δt. The continuous wavelet transform of such a signal is defined as the convolution of vn with a scaled and translated version of ψ0(η) and reads
with the wavelet scale s. The DOG2-specific factor is used to transform a given Fourier period T into its equivalent wavelet scale (Torrence and Compo, 1998). This however is only an approximation since wavelets cannot be perfectly localized in the period domain. As DOG2 is a non-orthogonal wavelet function, it can be used with an arbitrary set of scales (Torrence and Compo, 1998). The specific wavelet used in each convolution operation is called daughter wavelet and is normalized as
We can retrieve the amplitude An(T) of the velocity signal depending on the period T by partially reconstructing the signal from Wn(s) for that specific period as
with and the empirically derived factors δj0=1.4 and Cδ=3.541 from Torrence and Compo (1998). Note that a specific amplitude means signal value changes in a range that is double the amplitude.
We propose that a specific gust in this context is to be fully described by a specific amplitude and a specific period as it is done in the 1-cosine gust model. A specific portion of the wind velocity signal vn is marked as such a gust, if the wavelet transform followed by the partial reconstruction matches or exceeds a specific amplitude in the specific period within this portion of the signal. Note that the possibility to freely choose amplitude and period to define a specific gust makes the method a fully generic definition of a gust. The method can even distinguish between positive and negative gusts. Also note that since wavelets integrate to zero by design, this gust definition is invariant to changes of the mean wind and only detects deviations from the local mean. The wavelet analysis for a specific range of amplitudes and periods yields complete information about all gusts that are defined within this specific range of amplitudes and periods and are contained in the wind velocity signal. The range of amplitudes and periods can now be chosen depending on the load limit envelope of a specific object, in order to investigate if a wind velocity signal contains gusts, that are potentially dangerous for that specific object.
Note that the investigatable range of periods has a lower limit depending on the time step of 4δt. As we are investigating finite-length time series, the wavelet analysis of the data close to the beginning and end of the time dimension contains errors due to edge effects while computing the convolution. These erroneous regions grow in size along the time dimension as the investigated period increases and are masked as seen in Fig. 1b. This masked-out region is called the cone of influence (COI) and within it, the wavelet analysis data can not be used to detect gusts.
Figure 1a shows a 500 s long portion of a turbulence-resolving wind velocity signal taken from a mast-measurement at the Hamburg Weather Mast of Universität Hamburg and the Max Planck Institute for Meteorology. This (arbitrary) signal is used below to illustrate how the gust detection method works.
Figure 1b is the output of the full wavelet analysis and partial reconstruction performed on the mast-measurement data and shows the gust amplitudes An(T) in the contour plot depending on period and time. By picking a specific period of e.g. 3 s, the wavelet analysis data provides time dependent information about the signal amplitudes that are associated with that specific period (shown in Fig. 1c). We can pick a specific amplitude of e.g. 2 m s−1 and can immediately compute how much of the time this amplitude is matched or exceeded within the chosen period. The example in Fig. 1c shows that gusts with a period of 3 s and an amplitude that matches or exceeds 2 m s−1 are detected in about 2.1 % of the observed time. Note that the percentage needs to be computed with the COI taken into account.
We can now perform a two-dimensional (2-D) scan through a specific range of periods and amplitudes. For each respective gust defined by that specific amplitude and period we compute the probability that this gust occurs at any point within the original wind velocity data. This scan yields 2-D gust probability information as shown in Fig. 2.
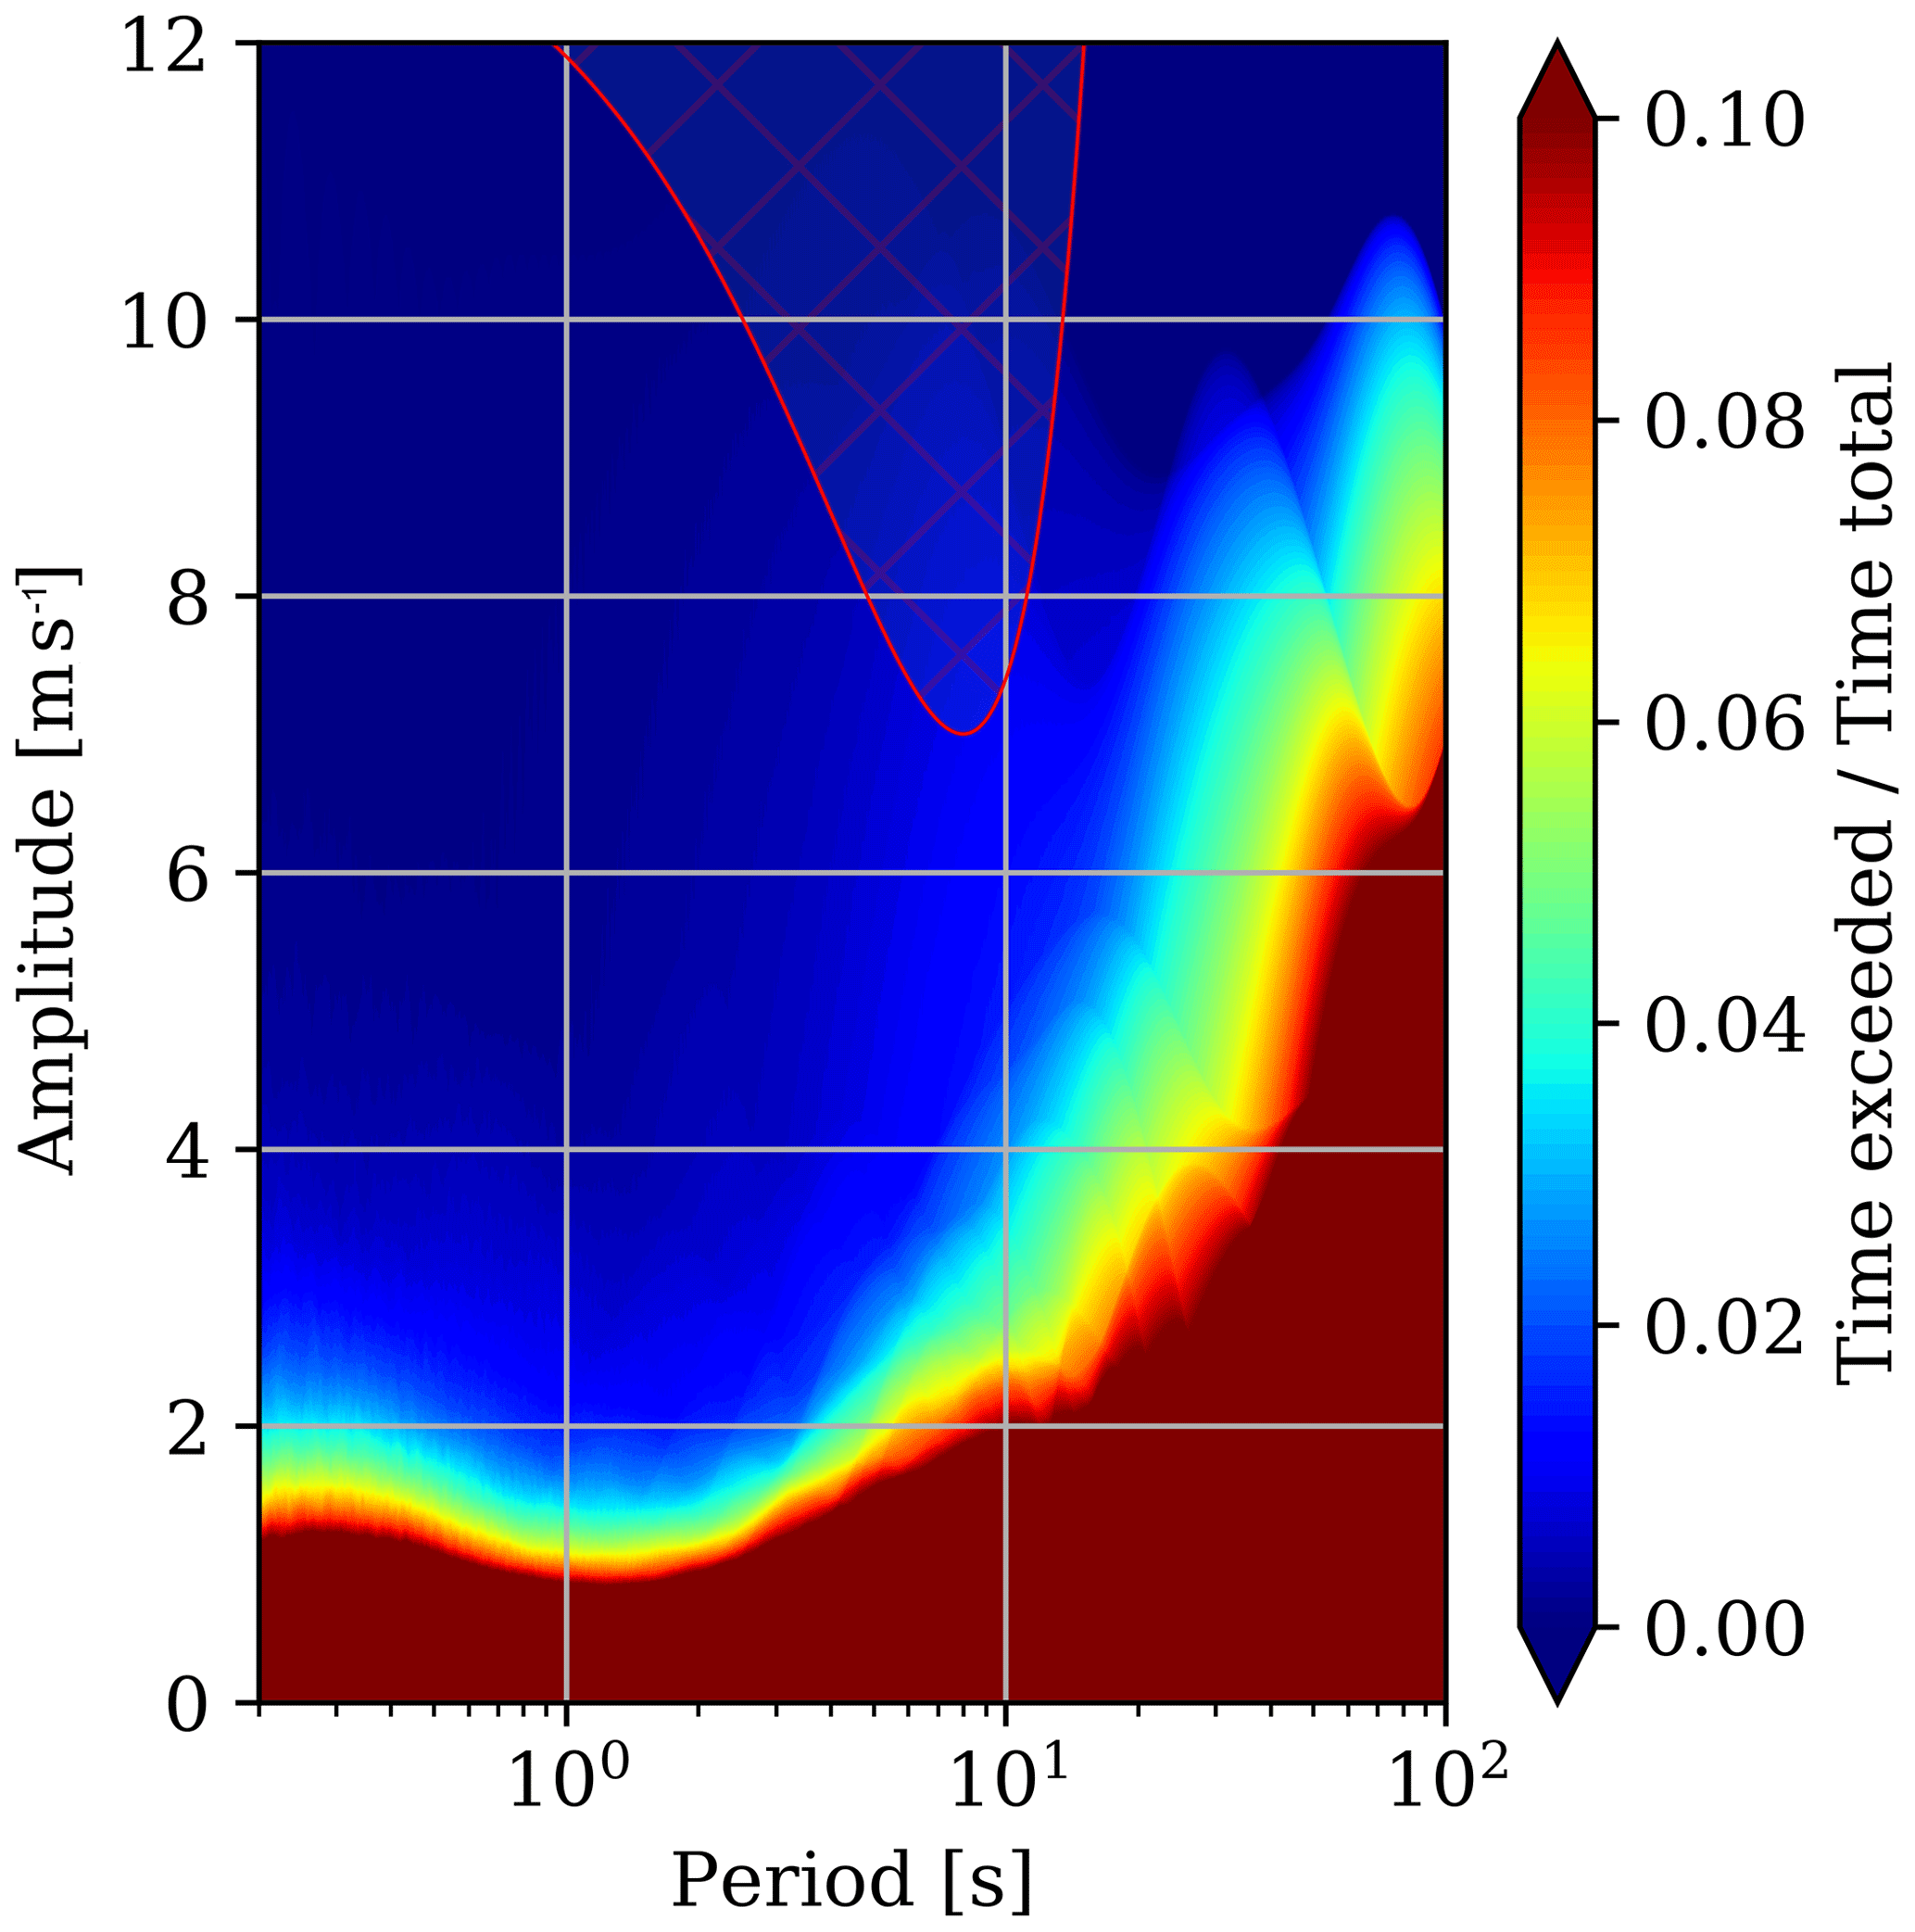
Figure 2The 2-D contour plot shows the probability of a specific gust, defined by a distinct period and amplitude. The color contour encodes the probability that such a specific gust occurs or is exceeded at any point within the original wind velocity signal shown in Fig. 1a. We call this 2-D information the characteristic gust distribution of the signal in Fig. 1a. The hatched area in red at the top of the plot marks an exemplary dangerous gust zone of a fictitious aircraft.
The 2-D gust probability information as shown in Fig. 2 can be viewed as the characteristic gust distribution of a particular wind velocity signal. In case such a signal is representative for a particular weather condition, the scan result can even be viewed as the characteristic gust distribution of that particular weather condition. Note that the method can easily be applied to simulation data as well as wind velocity measurement data, as long as the data is turbulence-resolving and resolves all relevant oscillation periods. The method is therefore a viable tool to derive gust forecasting products based on turbulence-resolving simulations in the future.
With the characteristic gust distribution of a particular weather condition at hand, it is now possible to asses whether a particular object or structure might encounter potentially harmful gusts while being exposed to that particular weather condition. This assessment is performed by mapping the object specific gust load limit envelope, onto the characteristic gust distribution for that particular weather condition. If we assume that an object is only sensitive to gusts within a certain range of periods and can be safely exposed to such gusts if these gusts do not exceed a certain amplitude depending on the period, we can identify a distinct area on the characteristic gust distribution that represents the dangerous gust zone for that particular object (the hatched area in Fig. 2 represents such an exemplary dangerous gust zone). It is therefore possible to derive customized warning products for any given object, because the proposed gust definition based on wavelet-analysis provides a direct link to the load limit envelop of that object.
It is now possible to map a gust load limit envelope of any aircraft, wind turbine, building or even a pedestrian onto the characteristic gust distribution, in order to assess for a potential gust hazard for that particular object. This enables the creation of custom warning products specific to e.g. a certain aircraft type. A major advantage of the proposed method is the common interface between characteristics of any particular weather situation and the characteristics of design and structure of a given object. The dangerous gust zone for a particular object needs to be computed only once and the characteristic gust distribution for a particular weather condition needs a single wavelet-analysis in order to enable the mapping of any arbitrary dangerous gust zone. Note that so far we have not computed dangerous gust zones of any real aircraft, as we have not received any gust load limit envelope data of a real aircraft yet. Also note that the application of the proposed method is not limited to aviation. A gust load limit envelope of any arbitrary object can be used, as long as it is fully described in amplitudes and periods.
We proposed a new generic gust definition and detection method using wavelet-analysis. Based on the assumption, that any turbulence-resolving wind velocity signal can be viewed as a superposition of many roughly 1-cosine shaped oscillations with varying amplitude and period, we have derived a characteristic gust distribution for that wind velocity signal by using wavelet-analysis. An arbitrary dangerous gust zone based on the gust load limit envelope of any solid object can then be mapped onto the characteristic gust distribution in order to provide a new, custom and direct link between gusty weather conditions and their physical impact on a specific solid object. We emphasize that the method can be applied to simulation data as well as wind velocity measurement data. In contrast to existing gust definitions that are often biased towards a specific use-case and are all based on somewhat arbitrarily chosen parameter sets, our method can detect any type of gust regardless of its shape and is unbiased regarding its use-case.
Further work will deliver a detailed comparison of the proposed method with existing gust detection methods. An application to larger mast-measurement data sets from the Hamburg Weather Mast is also work in progress in order to derive characteristic gust distributions for common weather conditions and show the characteristic gusts found in wind phenomena like e.g. low-level jets.
Code and data required to recreate Figs. 1 and 2 can be found in the Dataset: https://doi.org/10.25835/0067988 (Knoop et al., 2019).
HK and BM conceived the original idea. HK developed and implemented the method and performed all analysis. FA provided the measurement data. HK wrote the manuscript. BM supervised the project.
The authors declare that they have no conflict of interest.
This article is part of the special issue “18th EMS Annual Meeting: European Conference for Applied Meteorology and Climatology 2018”. It is a result of the EMS Annual Meeting: European Conference for Applied Meteorology and Climatology 2018, Budapest, Hungary, 3–7 September 2018.
This research has been supported by the Deutscher Wetterdienst (grant no. 2015EMF-13).
The publication of this article was funded by the open-access fund of Leibniz Universität Hannover.
This paper was edited by Irene Suomi and reviewed by two anonymous referees.
Ahmad, N. H., Inagaki, A., Kanda, M., Onodera, N., and Aoki, T.: Large-Eddy Simulation of the Gust Index in an Urban Area Using the Lattice Boltzmann Method, Bound.-Lay. Meteorol., 163, 447–467, https://doi.org/10.1007/s10546-017-0233-6, 2017. a
ASCE: Minimum Design Loads for Buildings and Other Structures, American Society of Civil Engineers, American Society of Civil Engineers, Reston, Virginia, USA, https://doi.org/10.1061/9780784412916, 2013. a
Bierbooms, W., Dragt, J. B., and Cleijne, H.: Verification of the mean shape of extreme gusts, Wind Energy, 2, 137–150, https://doi.org/10.1002/(SICI)1099-1824(199907/09)2:3<137::AID-WE24>3.0.CO;2-W, 1999. a
Brasseur, O.: Development and Application of a Physical Approach to Estimating Wind Gusts, Mon. Weather Rev., 129, 5–25, https://doi.org/10.1175/1520-0493(2001)129<0005:DAAOAP>2.0.CO;2, 2001. a
Camp, D. W.: Low Level Wind Gust Amplitude and Duration Study, Technical Memorandum, National Aeronautics and Space Administration, George C. Marshall Space Flight Center (MSFC), Huntsville, Alabama, 1968. a
Ciang, C. C., Lee, J.-R., and Bang, H.-J.: Structural health monitoring for a wind turbine system: a review of damage detection methods, Meas. Sci. Technol., 19, 1–20, https://doi.org/10.1088/0957-0233/19/12/122001, 2008. a
Daubechies, I.: The wavelet transform, time-frequency localization and signal analysis, IEEE T. Inform. Theory, 36, 961–1005, https://doi.org/10.1109/18.57199, 1990. a
EASA CS 25.341: Gust and turbulence loads, in: Certification Specifications and Acceptable Means of Compliance for Large Aeroplanes 25, European Aviation Safety Agency, Cologne, Germany, 2007. a
FAA AC 25.341: Dynamic Gust Loads, in: Advisory Circular 25, Federal Aviation Administration, Washington, D.C., USA, 2014. a
Friederichs, P., Göber, M., Bentzien, S., Lenz, A., and Krampitz, R.: A probabilistic analysis of wind gusts using extreme value statistics, Meteorol. Z., 18, 615–629, https://doi.org/10.1127/0941-2948/2009/0413, 2009. a
Frost, W. and Reddy, K. R.: Investigation of aircraft landing in variable wind fields, NASA Contractor Report 3073, University of Tennessee Space Institute, Tullahoma, Tennessee, 1978. a, b
Hau, E. and von Renouard, H.: Wind turbines, in: vol. 109, Springer, Berlin, Heidelberg, https://doi.org/10.1007/978-94-017-9627-9_10, 2015. a
Hoblit, F. M.: Gust loads on aircraft: concepts and applications, American Institute of Aeronautics and Astronautics, Washington, D.C, https://doi.org/10.2514/4.861888, 1988. a
Jackson, T., Shenkin, A., Kalyan, B., Zionts, J., Calders, K., Origo, N., Disney, M., Burt, A., Raumonen, P., and Malhi, Y.: A New Architectural Perspective on Wind Damage in a Natural Forest, Front. Forests Global Change, 1, 13, https://doi.org/10.3389/ffgc.2018.00013, 2019. a
Knigge, C. and Raasch, S.: Improvement and development of one- and two-dimensional discrete gust models using a large-eddy simulation model, J. Wind Eng. Indust. Aerodynam., 153, 46–59, https://doi.org/10.1016/j.jweia.2016.03.004, 2016. a
Knoop, H., Ament, F., and Maronga, B.: A generic gust definition and detection method based on wavelet-analysis, Dataset, https://doi.org/10.25835/0067988, 2019. a
Kristensen, L., Casanova, M., Courtney, M. S., and Troen, I.: In search of a gust definition, Bound.-Lay. Meteorol., 55, 91–107, https://doi.org/10.1007/BF00119328, 1991. a
Torrence, C. and Compo, G. P.: A Practical Guide to Wavelet Analysis, B. Am. Meteorol. Soc., 79, 61–78, https://doi.org/10.1175/1520-0477(1998)079<0061:APGTWA>2.0.CO;2, 1998. a, b, c
Verheij, F. J., Cleijne, J. W., and Leene, J. A.: Gust modelling for wind loading, J. Wind Eng. Indust. Aerodynam., 42, 947–958, https://doi.org/10.1016/0167-6105(92)90101-F, 1992. a