 | 08 Aug 2019
Web-based decision support toolbox for Spanish reservoirs
Jose Voces-Aboy
Inmaculada Abia-Llera
Eroteida Sánchez-García
Beatriz Navascués
Ernesto Rodríguez-Camino
María Nieves Garrido-del-Pozo
María Concepción García-Gómez
José Adolfo Álvarez-González
Fernando Pastor-Argüello
Under the S-ClimWaRe (Seasonal Climate prediction in support of Water Reservoirs management) initiative, a climate service to support decision-making process by water managers in Spanish reservoirs has been developed. It consists in a web-based toolbox jointly designed with stakeholders.
The website is organized in two main areas. The first one allows the user to explore, for any water reservoir or grid point over continental Spain, the existing hydrological variability and risk linked to climate variability. This is performed through a set of indicators obtained from time series of hydrological and meteorological observations and North Atlantic Oscillation (NAO) index, identified as main climate driver in this geographical region. The second main area provides seasonal forecasts of NAO and both reservoir inflow and precipitation, complemented by information on probabilistic forecasts skill.
Currently the NAO index is the only driver implemented for display, and forecasts come from a statistical forecasting system developed only for the extended winter NDJFM period. Through the MEDSCOPE (MEDiterranean Services Chain based On climate PrEdictions) project new sources of predictability and relationships with different climate drivers will be explored. Forecast skill improvement is expected after the combination and weighting of ensemble members of the Copernicus seasonal forecasting systems. These forecasts will feed more sophisticated hydrological models. The toolbox has been flexible designed with respect to sources of seasonal forecasts and extension to additional drivers, variables and seasons. In this way, user requirements and scientific progress will be easily incorporated to new versions of this climate service.
- Article
(6213 KB) - Full-text XML
- BibTeX
- EndNote


Reservoirs in Spain are hydraulic infrastructures that play an important role in water resources management, as well as in flood lamination and in reducing droughts' impacts. Both water resources allocation and hazards impact reduction could benefit from adding seasonal prediction to the input set of variables for decision making. Water management in inter-regional catchments is assigned to River Basin Authorities, being responsible for water planning, concession rights for water use, quality control or new hydraulic infrastructures projects, among others. Water allocation among different uses is planned in advance, and involves a participative approach.
The main goal of S-ClimWaRe (Seasonal Climate predictions to support Water Reservoirs management in Spain) initiative is to improve the management of reservoirs in Spain by using scientifically based climate information and seasonal forecasts. This service emerged as a case study within the EU FP7 EUPORIAS project. A collaborative process of interaction between seasonal forecasts providers and the Spanish water reservoirs' management community has allowed to build a long term partnership. In this context, a novel web-based toolbox has been developed and is presented in this paper. This climate service has been co-designed by a team headed by AEMET, the Spanish National Meteorological Service, and the DG Water of Spain, along with concerned stakeholders (River Basin Authorities of Ebro, Douro, Miño-Sil and Tagus). Each of these institutions makes its contribution to build a multidisciplinary team of meteorologists, scientists, engineers and water managers that advances in the knowledge of the processes determining the complexities of water resources behaviour.
The guiding principle for the development of the S-ClimWaRe climate service was to serve as an additional tool to be integrated in and complementary to the decision support systems already implemented. Ordinary management of water resources is conducted for a range of time scales including the seasonal scale. However up to now only weather forecasts or historic climatology have been used to inform such planning. This work aims also to promote the use of climate predictions on seasonal time horizon, without forgetting inherent limitations associated to forecasts at seasonal scales.
This document is structured as follows. In Sect. 2 the climate service developed is presented and the main components and contents of the web-based toolbox are described. Conclusions and final remarks are summarized in Sect. 3.
Two main goals have driven the design of the climate service developed and here described. The first one is to help stakeholders to analyse and understand the link between water resources and climate variability. The second one is to provide them useful information about future water availability on seasonal scales. According to user's requirements, the variables to be predicted in this climate service are accumulations of reservoirs water inflow and of precipitation for the extended winter (NDJFM).
The starting point has been to exploit the role of the North Atlantic Oscillation (NAO) as main climate driver influencing winter precipitation in the Iberian Peninsula area (Rodríguez Puebla et al., 1998). However, only very recently significant predictive skill for the mean winter North Atlantic Oscillation and Arctic Oscillation (AO) has been reported for a few of seasonal forecasting systems (e.g., Athanasiadis et al., 2017; Scaife et al., 2014). Due to these models limitations, statistical seasonal predictions based on single predictors are still a plausible alternative for certain mid-latitude regions influenced by NAO. In the first version of the toolbox, seasonal predictions come from the empirical model developed for S-ClimWaRe at AEMET (Voces et al., 2016). This statistical system relies on the NAO variability that is externally driven by the October snow cover advance over Eurasia or North America, following Cohen and Jones (2011). This simple method has proved to provide skilful seasonal forecasts for dam inflow and precipitation for the Iberian Peninsula (Voces et al., 2016).
The methodology here applied follows closely the approach described by Brown et al. (2010) and recommended for cases where hydroclimate variability is linked to certain dominant variability patterns. It has been successfully applied over certain regions of the world where there is a strong ENSO-rainfall correlation (Brown et al., 2010).
Apart from several baseline geographical datasets, the system is fed by different hydrological, meteorological and climate sources of information:
-
Time series of water reservoir inflow and water reserve data, provided by the General Directorate for Water of Spain (https://www.miteco.gob.es/en/cartografia-y-sig/ide/descargas/agua/anuario-de-aforos.aspx, last access: 5 August 2019).
-
Gridded (5 km resolution) daily precipitation data (from 1951 to 2017) covering the Iberian Peninsula and Balearic Islands provided by AEMET (Peral et al., 2017).
-
NAO index data, which comes from the standardized index published by the National Oceanic and Atmospheric Administration (NOAA) (https://www.cpc.ncep.noaa.gov/products/precip/CWlink/pna/nao.shtml, last access: 5 August 2019).
-
Seasonal forecasts of NAO, precipitation and dam inflow from the S-ClimWaRe statistical system. Results of the objective verification over a hindcast period are also input data to the application (Voces et al., 2016).
The website is organized into two views: one for diagnostic and another one for forecasting. Their content is described below.
2.1 Diagnostic view
Figure 1 shows the diagnostic view of the toolbox. This view includes tools helping the user to explore hydrological variability and risk associated with climate variability for any reservoir or grid point over the domain. Different statistical parameters calculated with observed hydrological and meteorological time series and NAO index are presented.
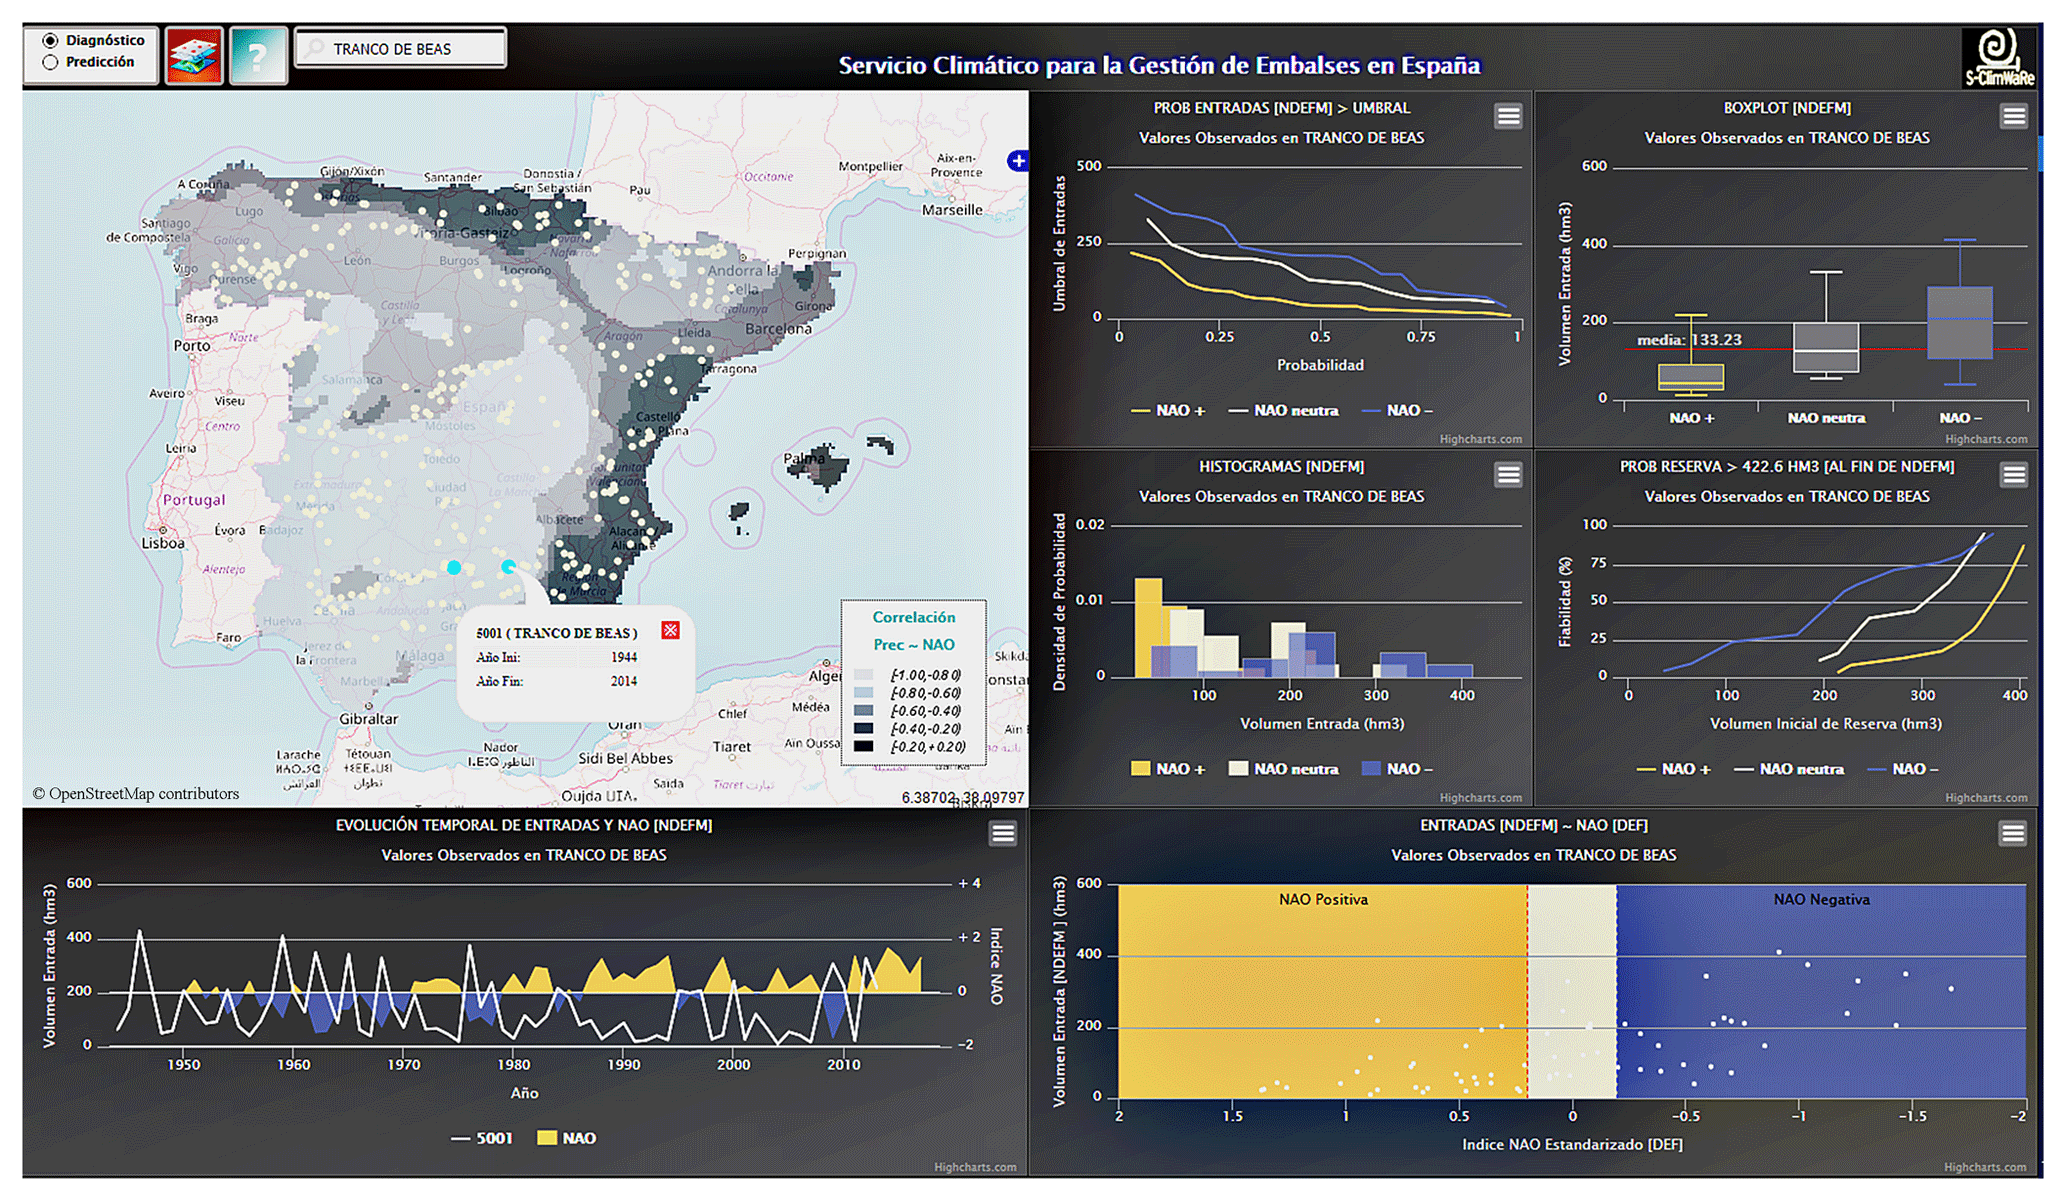
Figure 1Diagnostic view. It shows the link between NAO climate pattern and precipitation or water reservoir inflow and displays different types of indicators obtained by means of time series of NAO index data and meteorological or hydrological observations. © OpenStreetMap contributors 2019. Distributed under a Creative Commons BY-SA License.
The main panel (Fig. 2) shows correlation between NAO index and precipitation for the extended winter (NDJFM). Reservoirs appear in the map plotted as yellow dots. By clicking one of them, the set of indicators presented also in the window (Figs. 3 and 4) are updated with reservoir data. By clicking on any other point (not being reservoirs), indicators are updated with the precipitation data from the nearest grid point.

Figure 2Main panel in diagnostic view showing the selected Tranco de Beas reservoir. © OpenStreetMap contributors 2019. Distributed under a Creative Commons BY-SA License.
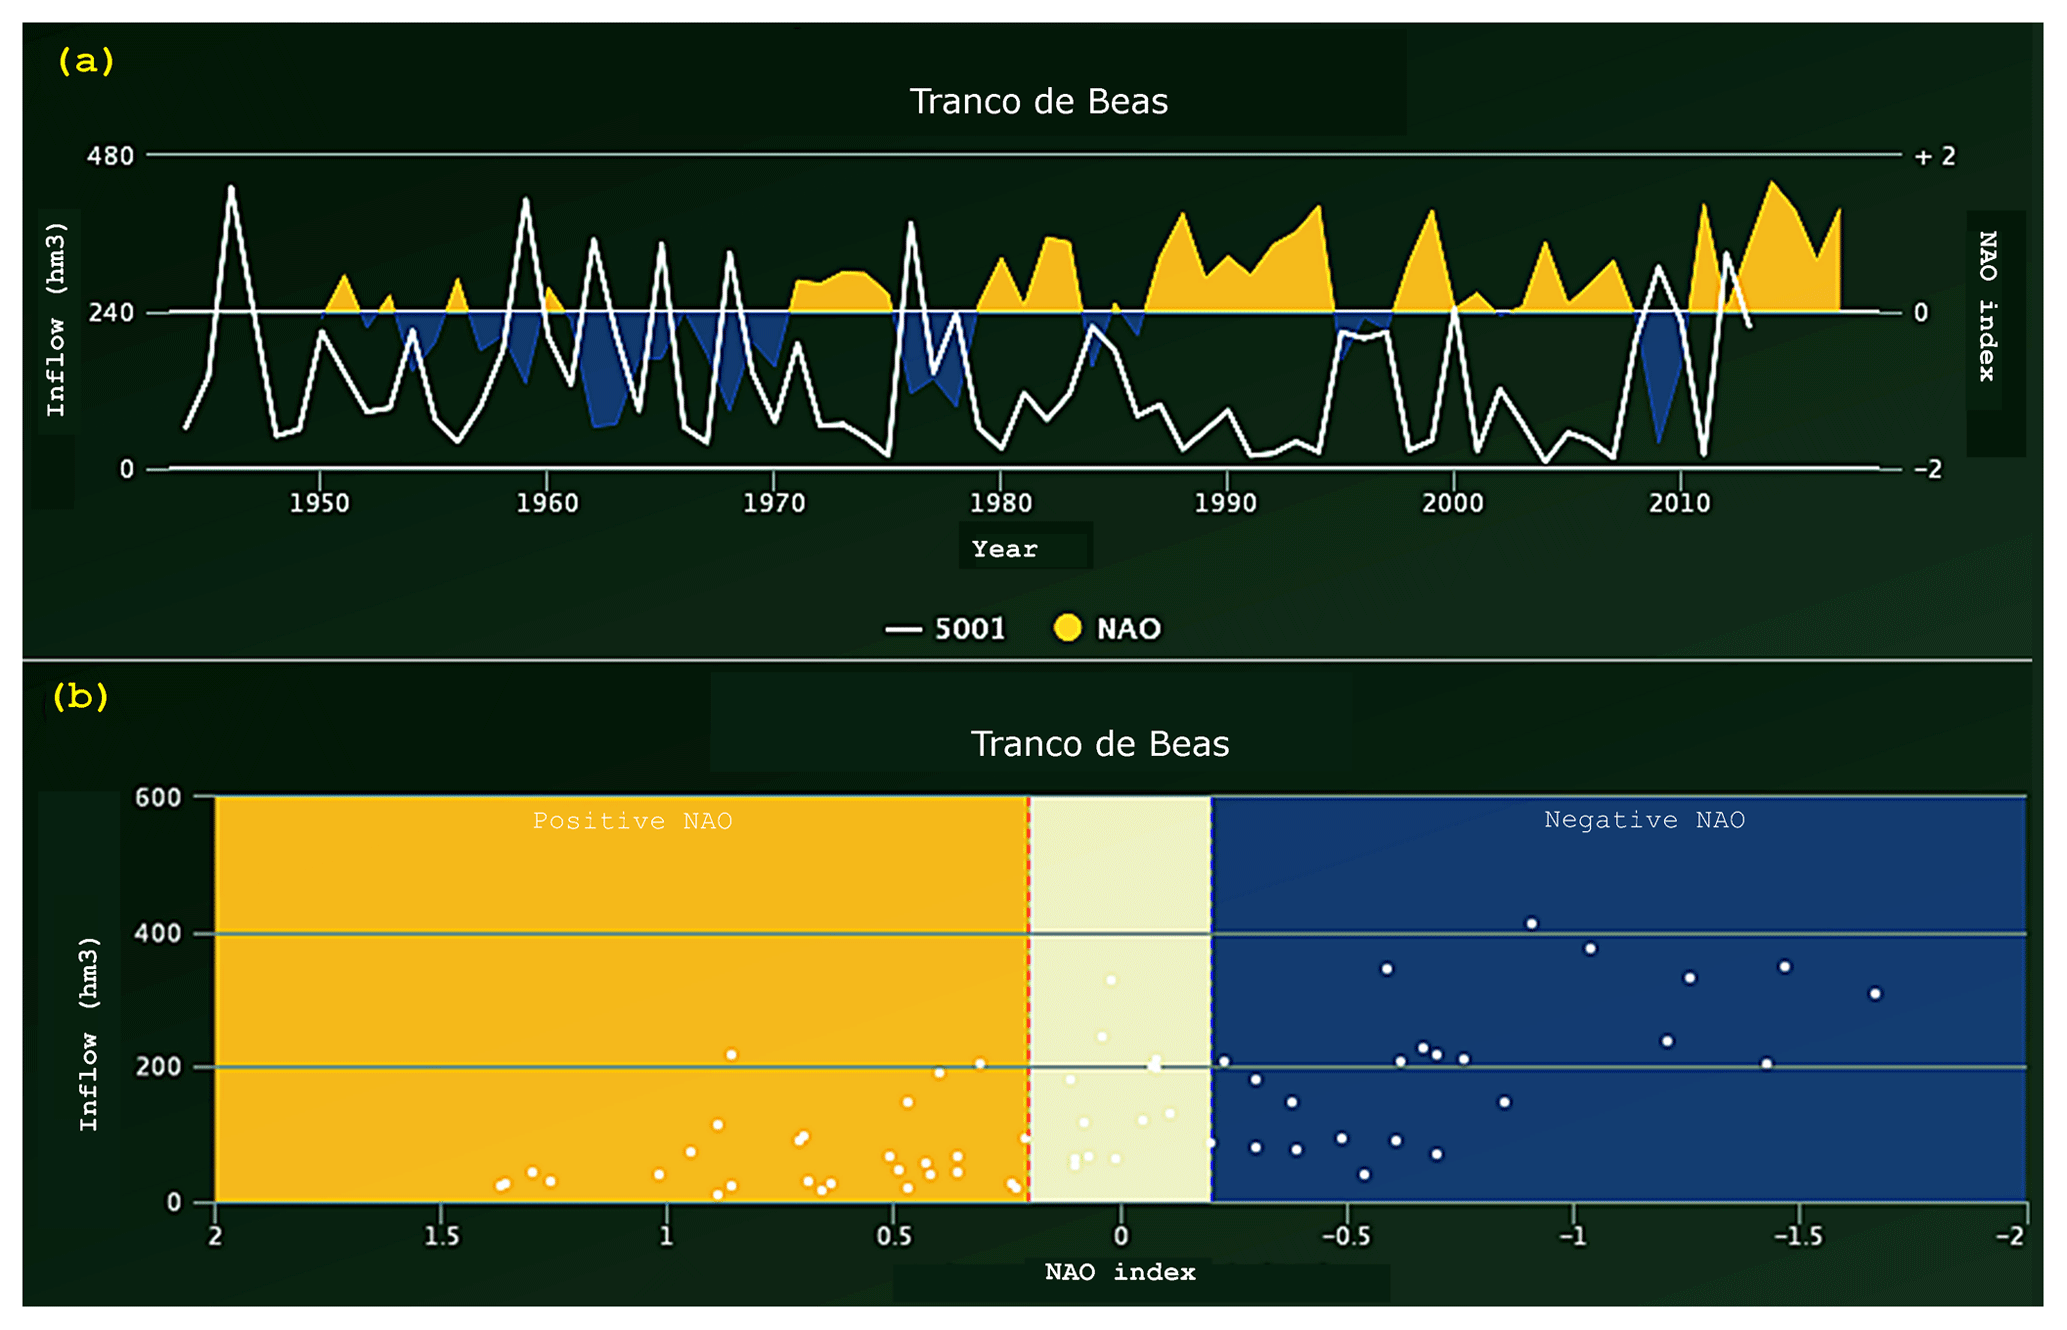
Figure 3Graphs in diagnostic view showing: (a) time evolution for extended winter reservoir inflow (white line, left y-axis) and NAO index (orange/blue shadow for ± DJF NAO, right y-axis); (b) scatterplot for extended winter reservoir inflow and NAO index.
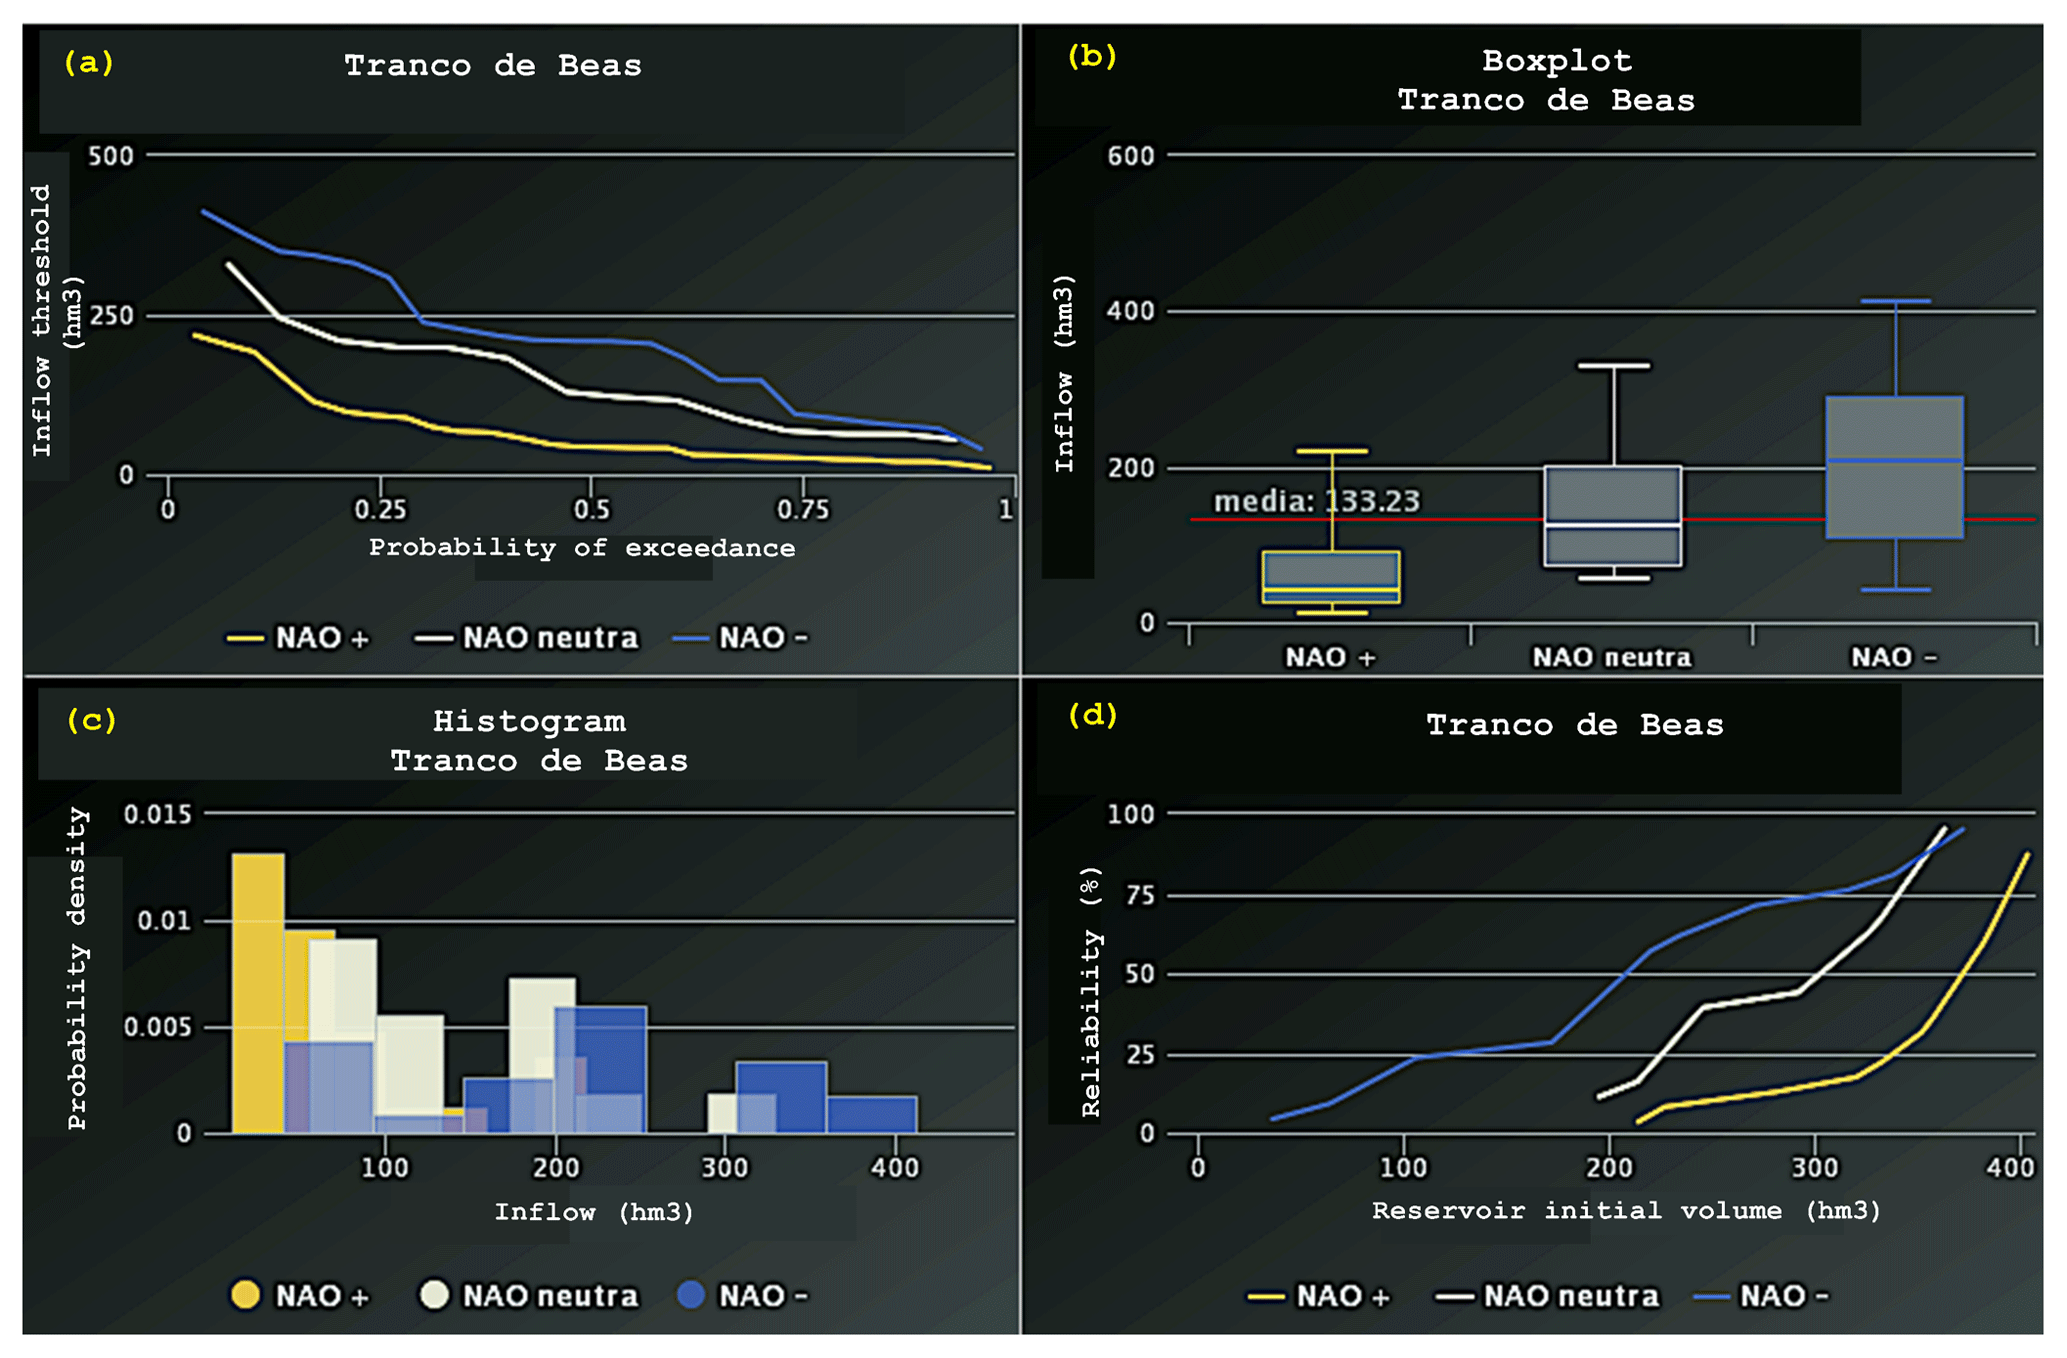
Figure 4Top right panel in diagnostic view. Four indicators show the distribution of observed precipitation or water reservoir inflow according to NAO phase displayed in the diagnostic view of S-ClimWaRe web toolbox.
The set of indicators displayed both for the water reservoir or geographical point chosen, allows the user to explore more thoroughly hydrological risk linked to NAO. The two graphs in Fig. 3 show the time evolution (a) and scatterplot (b) of inflow/precipitation and NAO index for the Tranco de Beas reservoir, located in Southern Spain. Both are straightforward to understand, and prepare the user for the rest of diagnostics shown in the window. Figure 3a depicts temporal evolution of hydrological and climate variables showing opposite sign. Positive NAO indexes are closely linked with low reservoir inflow/precipitation winters, whereas negative NAO indexes are negatively correlated with high inflow/precipitation values (Fig. 3b). So, for most tools, NAO values have been classified into three categories or NAO phases (positive, negative, and neutral) for the corresponding winter.
The four graphs in Fig. 4 present in different ways the occurrence frequencies of the reservoir historical data depending on the NAO phase (positive, neutral and negative). Whenever the NAO driver clearly discriminates total winter precipitation, the set of indicators provides the user an intuitive evidence, for example, of the link between past positive NAO and drought periods.
The graphs plotted in Fig. 4 are:
- a.
Exceedance probability curve showing probability of inflow over different thresholds that appear in y-axis.
- b.
Boxplot of total inflow/precipitation for each NAO class, indicating quartiles and extremes values of data distribution.
- c.
Histogram showing the relative frequency of different bins of total inflow/precipitation for each NAO class.
- d.
Reliability plot. It provides the probability of filling the water reservoir at the end of winter depending on the initial water reservoir level at the beginning of the hydrological year. This indicator is also calculated separately for each NAO class. For different values of initial water storage at the beginning of November, it depicts the likelihood of being above 75th percentile of water reservoir level at the end of March.
2.2 Forecasting view
This area of the toolbox gives access to seasonal forecasts for precipitation on the 5 km resolution grid points and for dam inflow in case of the different reservoirs (see Fig. 5).
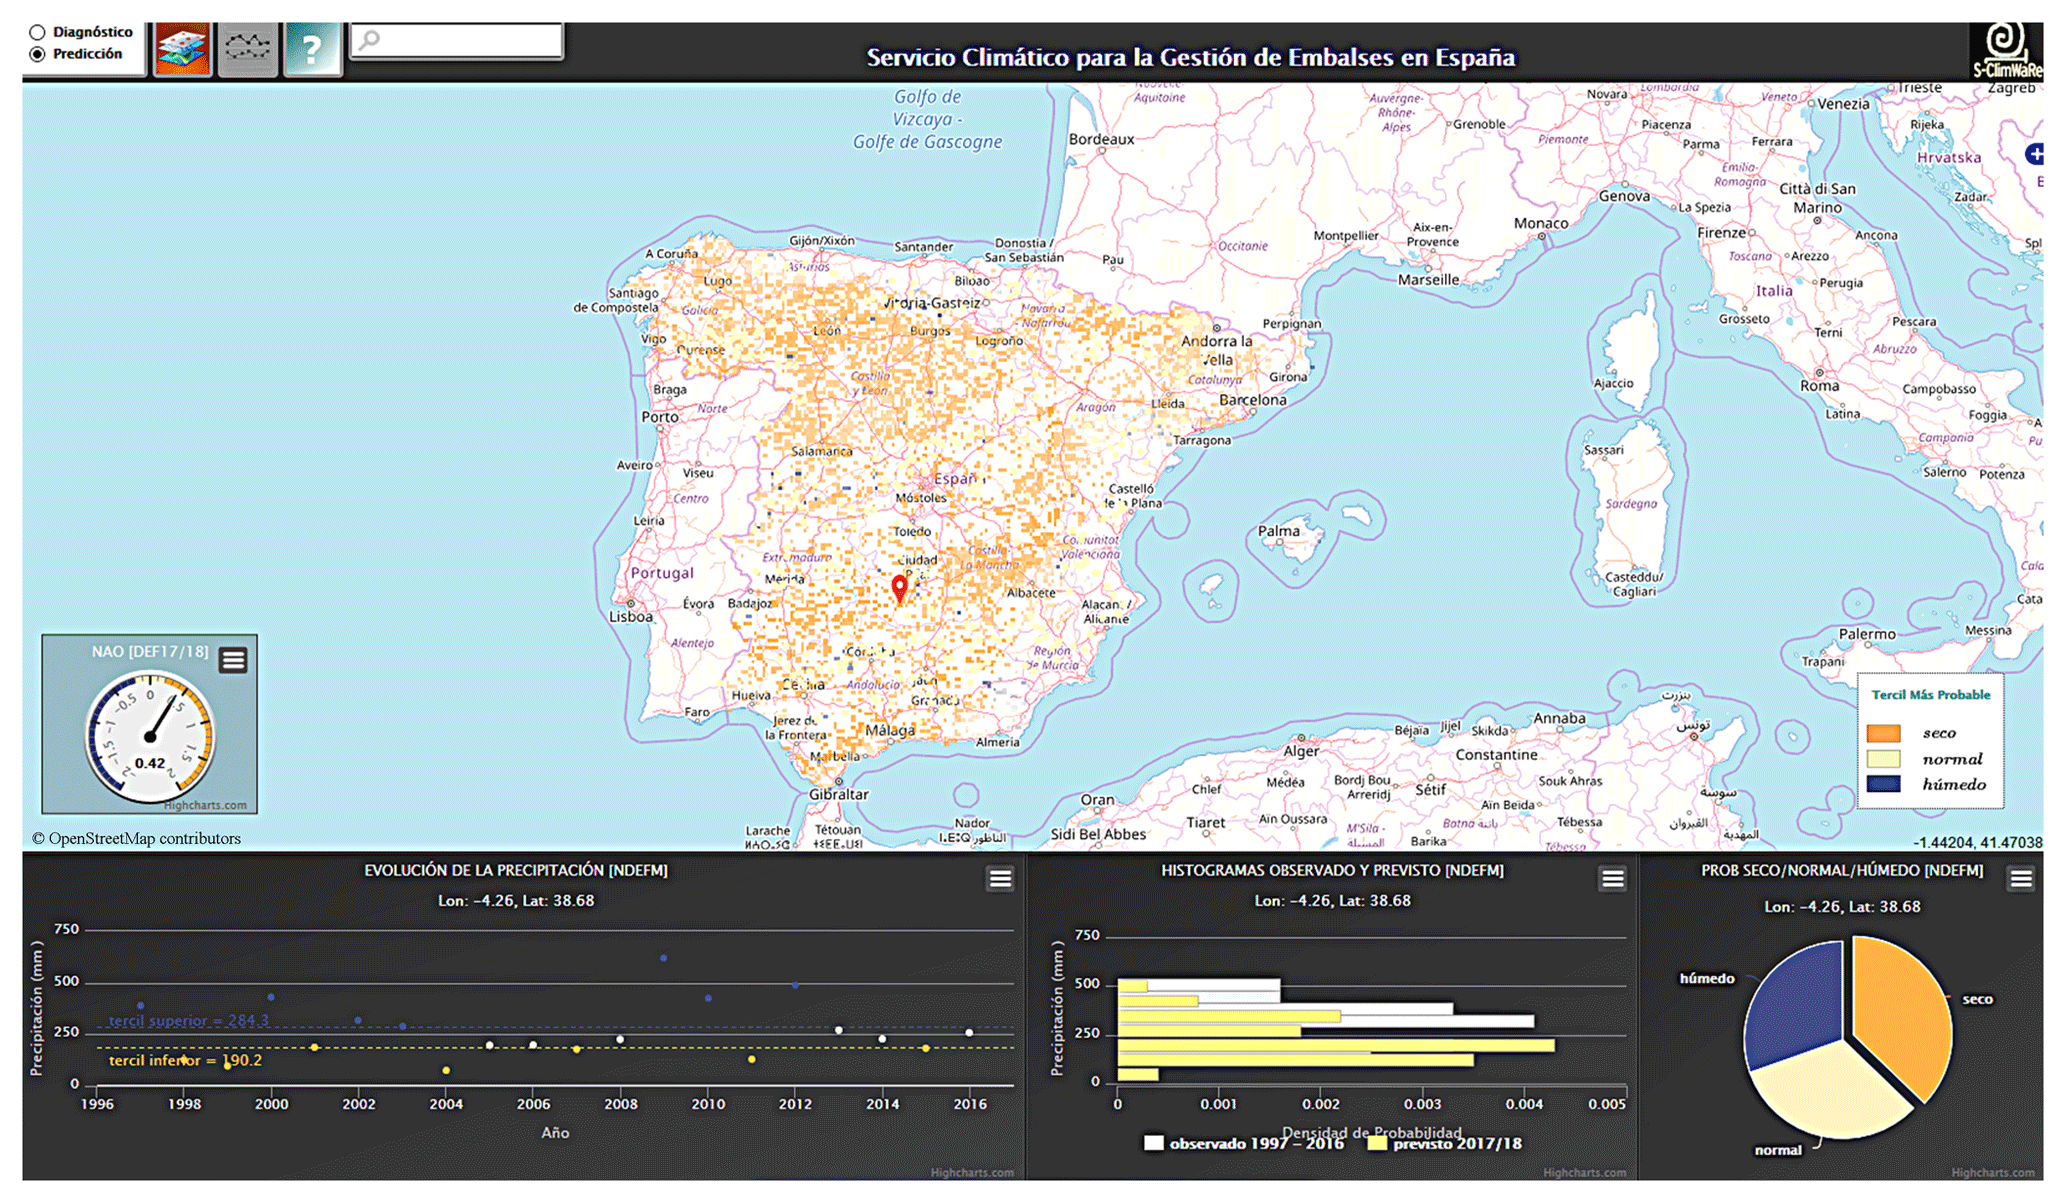
Figure 5Forecasting view. It displays spatial distribution of the winter precipitation seasonal prediction, the forecasted winter DJF NAO, and different graphics concerning the precipitation or water reservoir inflow prediction at the selected geographical location. © OpenStreetMap contributors 2019. Distributed under a Creative Commons BY-SA License.
The first information provided to the user is a map summarizing the probabilistic forecasts for the extended winter (NDJFM). The most likely rainfall tercile is plotted on the map, with a colour code indicating dry, normal and wet winter categories.

Figure 6Graphs in the bottom panel in the forecasting view. (a) Historical evolution of winter total inflow/precipitation over the hindcast period. Two horizontal lines indicate the two terciles allowing to classify the different winters as dry/normal/wet, and each data value is plotted accordingly in blue/beige/orange. (b) Two histograms corresponding to observed (white) and forecasted (yellow) pdf for winter inflow/precipitation, respectively. (c) Pie chart in graph displaying forecasted probability for each category: wet (blue), normal (beige) and dry (orange). Each sector surface is proportional to the category probability.
In order to provide a measure of the skill of the system, the Relative Operating Characteristic (ROC) area has been used (see e.g., Wilks, 2006). In short, the ROC area can be considered a summary of the performance of a probabilistic forecasting system with respect to its ability to discriminate the occurrence or not of a certain event (e.g. a wet winter) Each pixel on the map has a level of transparency based on the skill of the forecasting system according to the value of ROC area score. The more reliable the forecast, the brighter (less transparent) the colour. The forecasts showing little sharpness (similar probability for the 3 terciles) are not displayed. With these features, a fast look to this map allows the user to know where skilful seasonal forecasts present a significant signal with respect to the default climatological distribution. This panel also contains a clock-type graph that indicates the deterministic forecast of the winter NAO. Having previously explored the hydrological risk linked to the NAO with the diagnostic view of this toolbox, the user can have a better understanding of the seasonal forecasts shown in the forecasting view.
Clicking on a reservoir or grid point in the map, the toolbox provides more complete information there.
Figure 6 shows the tools that appear when selecting a grid point or a reservoir:
- a.
time evolution of the observed category (dry, normal or wet) of winter inflow/precipitation over the hindcast period;
- b.
two histograms corresponding to observations and forecasted pdf of winter inflow/precipitation, respectively;
- c.
pie chart representing probability and skill of the seasonal forecast for the three, dry, normal and wet categories.
A climate service to support decision-making process in Spanish reservoirs has been developed. This climate service consists in a web-based toolbox that has been co-designed with stakeholders. This web toolbox is basically, but not fully, Open Source compliant and most data follows OGC standards. It has been conceived as a very flexible application with a scalable and modular structure, in order to facilitate its expected future evolution. In addition, being web-based, the user has the confidence of accessing the latest version with an updated content.
The S-ClimWaRe project is characterised by a strong and regular interaction' between stakeholders and developers through meetings and workshops. User's requirements have emerged from all the surveys and workshops organised and have motivated the initial design and the implementation of new functionalities that were feasible.
An important input for improvements of this toolbox is the scientific progress. Currently, NAO is the only climate driver implemented for display. Within the EU ERA4CS (European Research Area for Climate Services) initiative, the MEDSCOPE (MEDiterranean Services Chain based On climate PrEdictions) project is currently exploring new sources of predictability and relationships with different climate drivers for the Mediterranean region. Their outcomes will allow new sources of data for the toolbox. This toolbox will also incorporate some techniques to downscale global climate models variables. Forecast skill improvements achieved by combination and weighting of ensemble members of the Copernicus seasonal forecasting systems are also expected from MEDSCOPE project. In the future it is foreseeable that the empirical seasonal forecasts module within S-ClimWaRe toolbox will be superseded by dynamical seasonal forecasting system products coupled to hydrological models as soon as combination algorithms of seasonal climate models, bias correction, downscaling, and weighting ensemble members algorithms that are being developed improve precipitation forecast performance over mid-latitudes. In the current version of the toolbox, only the extended winter NDJFM period is considered. Water managers have already expressed their need of information also for other seasons and variables. Achievements in these fields from MEDSCOPE will be also incorporated.
Finally, the access to the current version of the web-based tool here described is administered by the DG Water of Spain and its pilot phase is password protected while being evaluated by different Spanish River Basin Authorities previously to its open and free use.
Seasonal forecast S-ClimWaRe statistical system and AEMET gridded daily precipitation data can be requested from the authors. Water reservoirs data from General Directorate for Water of Spain are available via its service at https://www.miteco.gob.es/es/cartografia-y-sig/ide/descargas/agua/anuario-de-aforos.aspx (last access: 5 August 2019) as Tabla del Anuario de Aforos. NAO index data from National Oceanic and Atmospheric Administration (NOAA) are available via its service at https://www.cpc.ncep.noaa.gov/products/precip/CWlink/pna/nao.shtml (last access: 5 August 2019).
It has been mainly a team work.
The authors declare that they have no conflict of interest.
This article is part of the special issue “18th EMS Annual Meeting: European Conference for Applied Meteorology and Climatology 2018”. It is a result of the EMS Annual Meeting: European Conference for Applied Meteorology and Climatology 2018, Budapest, Hungary, 3–7 September 2018.
The research leading to these results has received funding from EUPORIAS and MEDSCOPE projects. EUPORIAS was funded by the European Commission through the 7th Framework Programme for Research, grant agreement 308291. MEDSCOPE is co-funded by the European Commission as part of ERA4CS, an ERA-NET initiated by JPI Climate, grant agreement 690462
This paper was edited by Silvio Gualdi and reviewed by two anonymous referees.
Athanasiadis, P. J., Bellucci, A., Scaife, A. A., Hermanson, L., Materia, S., Sanna, A., Borrelli, A., MacLachlan, C., and Gualdi, S.: A multisystem view of wintertime NAO seasonal predictions, J. Climate, 30, 1461–1475, https://doi.org/10.1175/JCLI-D-16-0153.1, 2017.
Brown, C., Baroang, K. M., Conrad, E., Lyon, B., Watkins, D., Fiondella, F., Kaheil, Y., Robertson, A., Rodriguez, J., Sheremata, M., and Ward, M. N.: Managing Climate Risk in Water Supply Systems, IRI Technical Report, International Research Institute for Climate and Society, Palisades, NY, 10–15, https://doi.org/10.7916/D83T9Q27, 2010.
Cohen, J. and Jones, J: A new index for more accurate winter predictions, Geophys. Res. Lett., 38, L21701, https://doi.org/10.1029/2011GL049626, 2011.
Peral, C., Navascues, B., and Ramos, P.: Serie de precipitación diaria en rejilla con fines climáticos, Nota Técnica no. 24, AEMET, available at: http://hdl.handle.net/20.500.11765/7573 (last access: 5 August 2019), 2017.
Rodríguez-Puebla, C., Encinas, A. H., Nieto, S., and Garmendia, J.: Spatial and temporal patterns of annual precipitation variability over the Iberian península, Int. J. Climatol., 18, 299–316, https://doi.org/10.1002/(SICI)1097-0088(19980315)18:3<299::AID-JOC247>3.0.CO;2-L, 1998.
Scaife, A. A., Arribas, A., Blockley, E., Brookshaw, A., Clark, R. T., Dunstone, N., Eade, R., Fereday, D., Folland, C. K., Gordon, M., Hermanson, L., Knight, J. R., Lea, D. J., MacLachlan, C., Maidens, A., Martin, M., Peterson, A. K., Smith, D., Vellinga, M., Wallace, E., Waters, J., and Williams, A.: Skillful long-range prediction of European and North American winters, Geophys. Res. Lett., 41, 2514–2519, https://doi.org/10.1002/2014GL059637, 2014.
Voces, J., Sanchez-Garcia, E., Navascues, B., Franco, F., and Rodriguez-Camino, E.: Sistema estadístico de predicción estacional para la gestión de los embalses en España, Nota Técnica no. 21, AEMET, available at: http://hdl.handle.net/20.500.11765/4431 (last access: 5 August 2019), 2016.
Wilks, D. S.: Statistical methods in the atmospheric sciences, 2nd Edn., Academic Press, USA, 627 pp., ISBN 13:978-0-12-751966-1, 2006.