 | 19 Aug 2019
Comparison of manual and automatic daily sunshine duration measurements at German climate reference stations
Lisa Hannak
Karsten Friedrich
Florian Imbery
Frank Kaspar
Precise quantification of climate change depends on long time series of meteorological variables. Such time series should be as homogeneous as possible but some changes of measurement conditions cannot be prevented. At German climate reference stations, parallel measurements are used to analyze the effects of changes in measurement systems for example for the transition from manual to automatic instruments. These parallel measurements aim to identify measurement uncertainties and to analyze the comparability of measurement systems to investigate the homogeneity.
In this study, we investigate daily sunshine duration. Traditionally, manual measurements of daily sunshine duration are taken with Campbell-Stokes sunshine recorders. For automatic measurements the SONIe or SCAPP instrument is used. The different measurement principles (glass sphere and photodiode) cause systematic differences between the observations. During summer, values for manual observations are larger especially in case of frequent alternations between sunny and cloudy conditions. Furthermore, the standard deviation of the differences between the two measurement systems is larger during summer because of the greater day length. To adjust the automatic measurements a linear regression model is suggested based on parallel measurements from 13 climate reference stations in Germany. To validate the regression coefficients, a leave-one-out cross validation was performed (by leaving out data of individual stations). The regression coefficients (derived from different sets of stations) are similar, thereby indicating a robust data set for the estimation of the linear model. With this method we want to prevent breaks in long time series of daily sunshine duration caused by the transition from manual to automatic instruments.
- Article
(4647 KB) - Full-text XML
- BibTeX
- EndNote


Parallel measurements can be used to quantify the impact of changes in the measurement systems. At German climate reference stations, up to ten years of parallel measurements are available to analyze the impact of the transition from historical to the current operational measurement system. The first results on the comparison of temperature measurements are summarized in Kaspar et al. (2016). In contrast to these results the effect of changing the measurement instrument for daily sunshine duration has a larger influence on the homogeneity.
The Campbell-Stokes sunshine recorder is a reference instrument to measure daily sunshine duration and is used worldwide since 1880 (Sanchez-Lorenzo et al., 2013). The improvement of Stoke on the instrument designed by Campbell resulted in the name “Campbell-Stokes sunshine recorder” (Stanhill, 2003). To measure the sunny hours, a glass sphere is used surrounded by a metallic semi-ring. On this ring, a paper card is attached. If the sun is shining, the ray of sunlight is focused by the glass sphere and burns a black line on the paper card. Using the labeling on the card the daily sunshine hours can be read out by a trained observer (Sanchez-Lorenzo et al., 2013). The paper card has to be replaced every day. Dependent on the season of the year, the position on the ring differs. Disadvantages and potential sources for inhomogeneities of Campbell-Stokes recorders are discussed by Brázdil et al. (1994), especially the effect of aging, replacement of instruments, location, and air pollution.
Nowadays automatic instruments are used to measure shortwave irradiance. Radiation measurements can be transformed to sunshine duration data by applying a defined threshold. Worldwide, different automatic instruments are in use. Kerr and Tabony (2004) analyzed the differences between Campbell-Stokes measurements and automatic measurements of the Kipp and Zonen CSD-1 instrument used in the UK Met Office. The Campbell-Stokes measurements overestimate the daily sunshine duration especially in situations with broken cloud cover and high elevation angles of the sun. Similar results are found by Legg (2014). In their study, a quadratic model is used to adapt the measurements. Matuszko (2015) compared Campbell-Stokes and CSD3 sunshine recorder measurements. The lower threshold used for the automatic measurements results in larger values for the automatic sunshine duration. For small elevation angles, the intensity of solar radiation is not strong enough to reach the intensity to burn a line in the paper card of the Campbell-Stokes but the threshold of the automatic instruments is reached. Furthermore, the presence of clouds influences the differences between the two measurement systems. In the United States inhomogeneities are found in long time series of sunshine duration caused by changing the measurement systems (Cerveny and Balling Jr., 1990).

Figure 1Differences of daily sunshine duration (automatic minus manual observations) in hours. The blue line is the normal distribution using the statistic of the differences; the pink line is a normal distribution with a mean of zero and the standard deviation according to the statistic of the differences. All data is used.
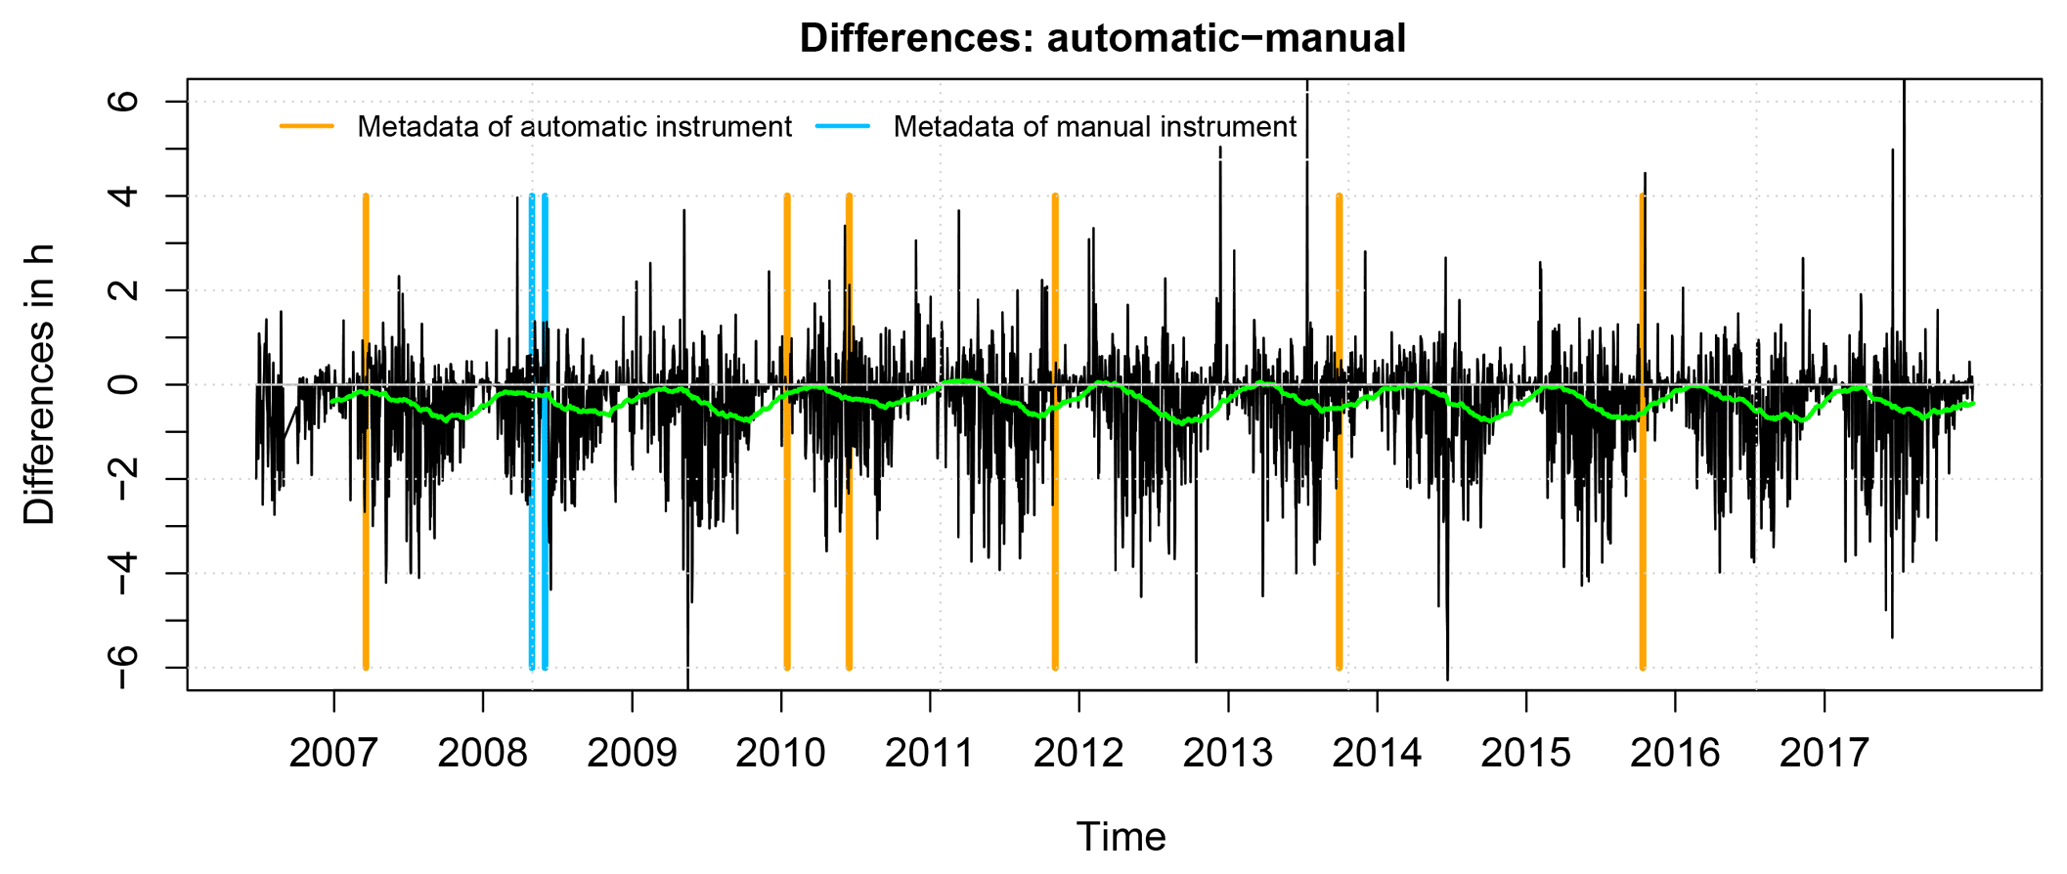
Figure 2Differences of daily sunshine duration (automatic minus manual observations) in hours at the station Schleswig. The green line is a moving average over 150 values; the vertical orange/blue line represents date of metadata information of the automatic/manual instrument (replacements of instruments). Extreme outliers are not shown in this figure.
As solar irradiance is an important part of the energy budget of the atmosphere, it is of interest to convert historical daily sunshine records to solar irradiance. Therefore several studies tried to develop methods for the purpose using the so-called Angström-Prescott formulas (some of them are summarized in the study of Martinez-Lozano et al., 1984). Sánchez-Romero et al. (2015) use digital image processing to incorporate the burn width of Campbell-Stokes measurements in an approach to calculate direct solar irradiance.
The automatic instrument mainly used in Germany is the SONIe instrument (manufacturer: Siggelkow). This instrument measures direct solar radiation through a narrow rotating slit. Using a threshold of 120 W m−2, the sunshine duration can be calculated. This threshold is recommended by WMO. At some stations the SCAPP instrument (manufacturer: Siggelkow) is used which is an improved development of the SONIe instrument. The instruments compared in this study differ in their measuring principle and observed component. The impact on the differences of daily sunshine duration is analyzed to ensure the homogeneity of long time series. In the first part, the data is briefly summarized. The results of the differences are shown in the second section followed by a description of a method to adapt the automatic measurements. Finally, the results are summarized.
Table 1Time range with parallel measurements; location and elevation (in meters) of each climate reference station.
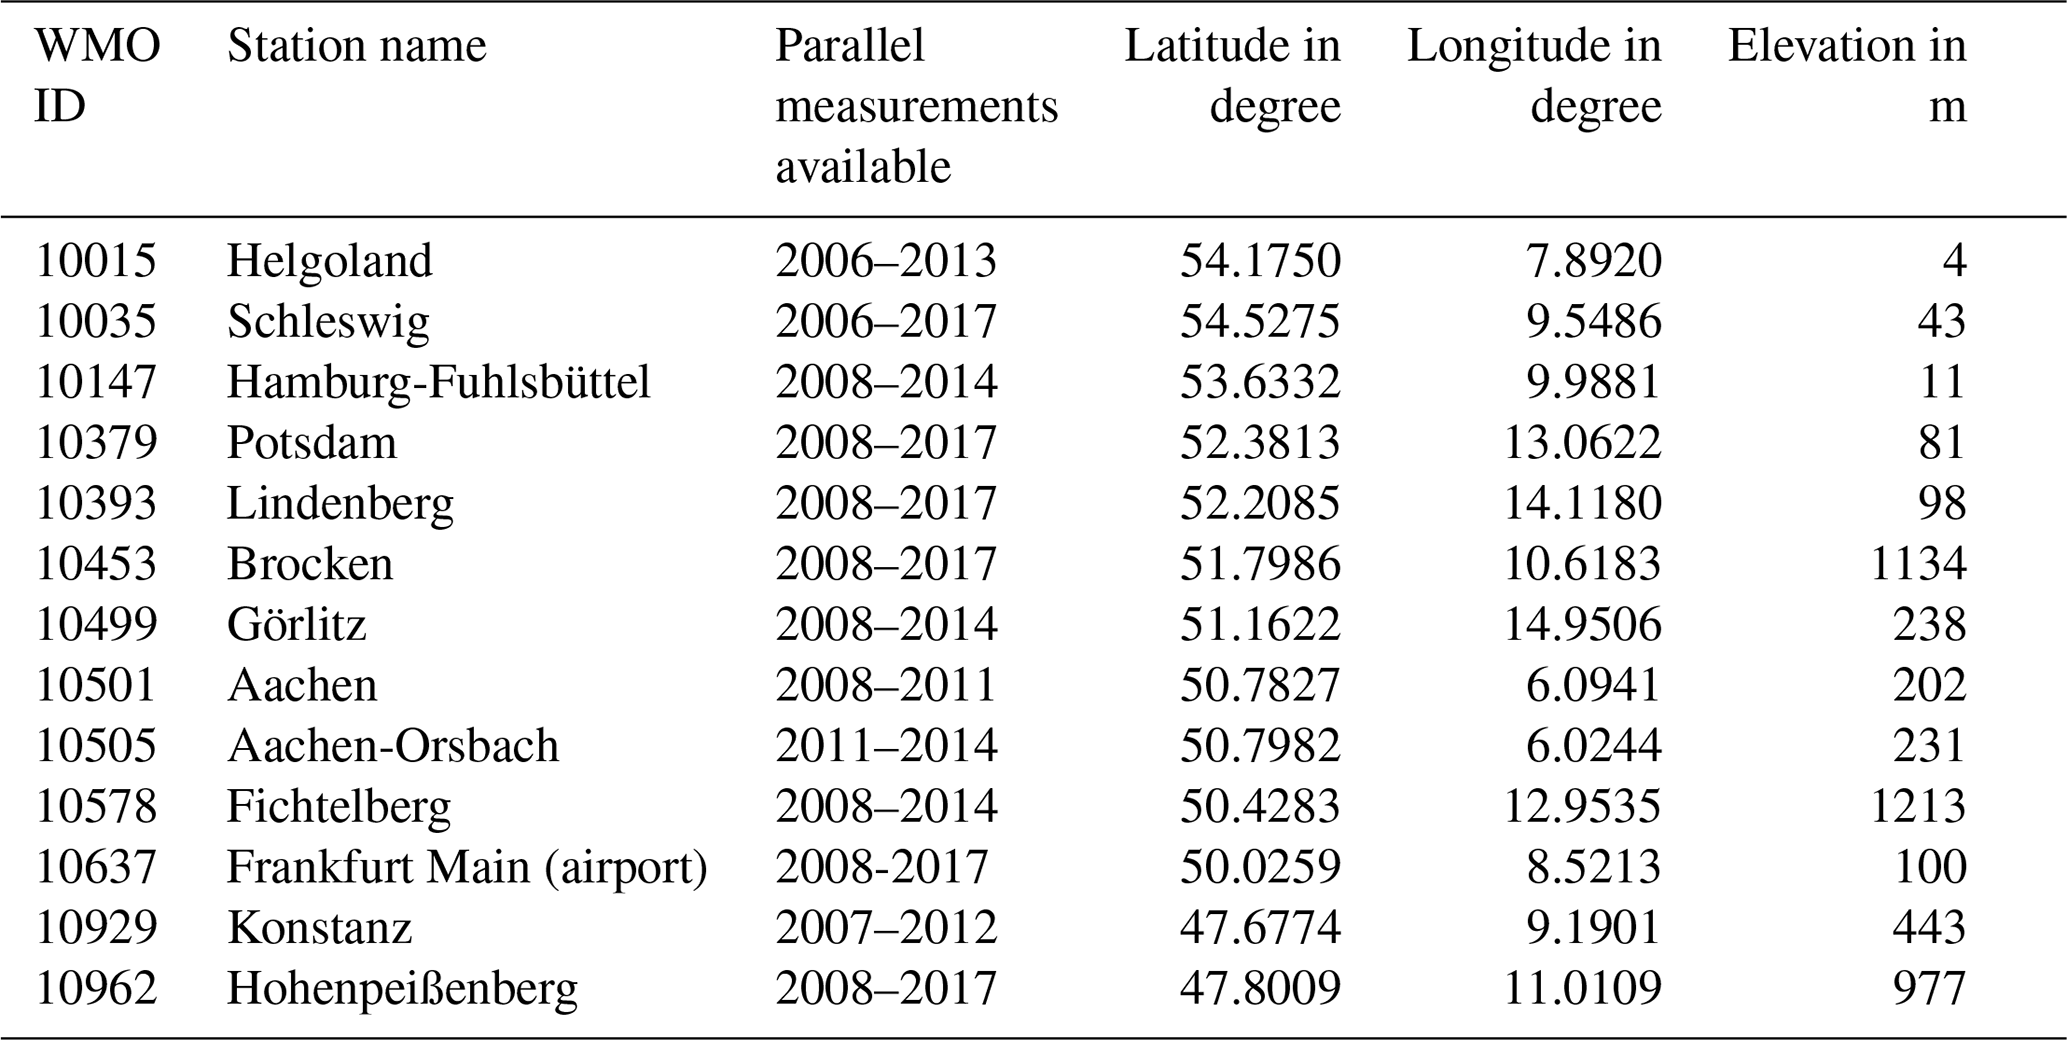
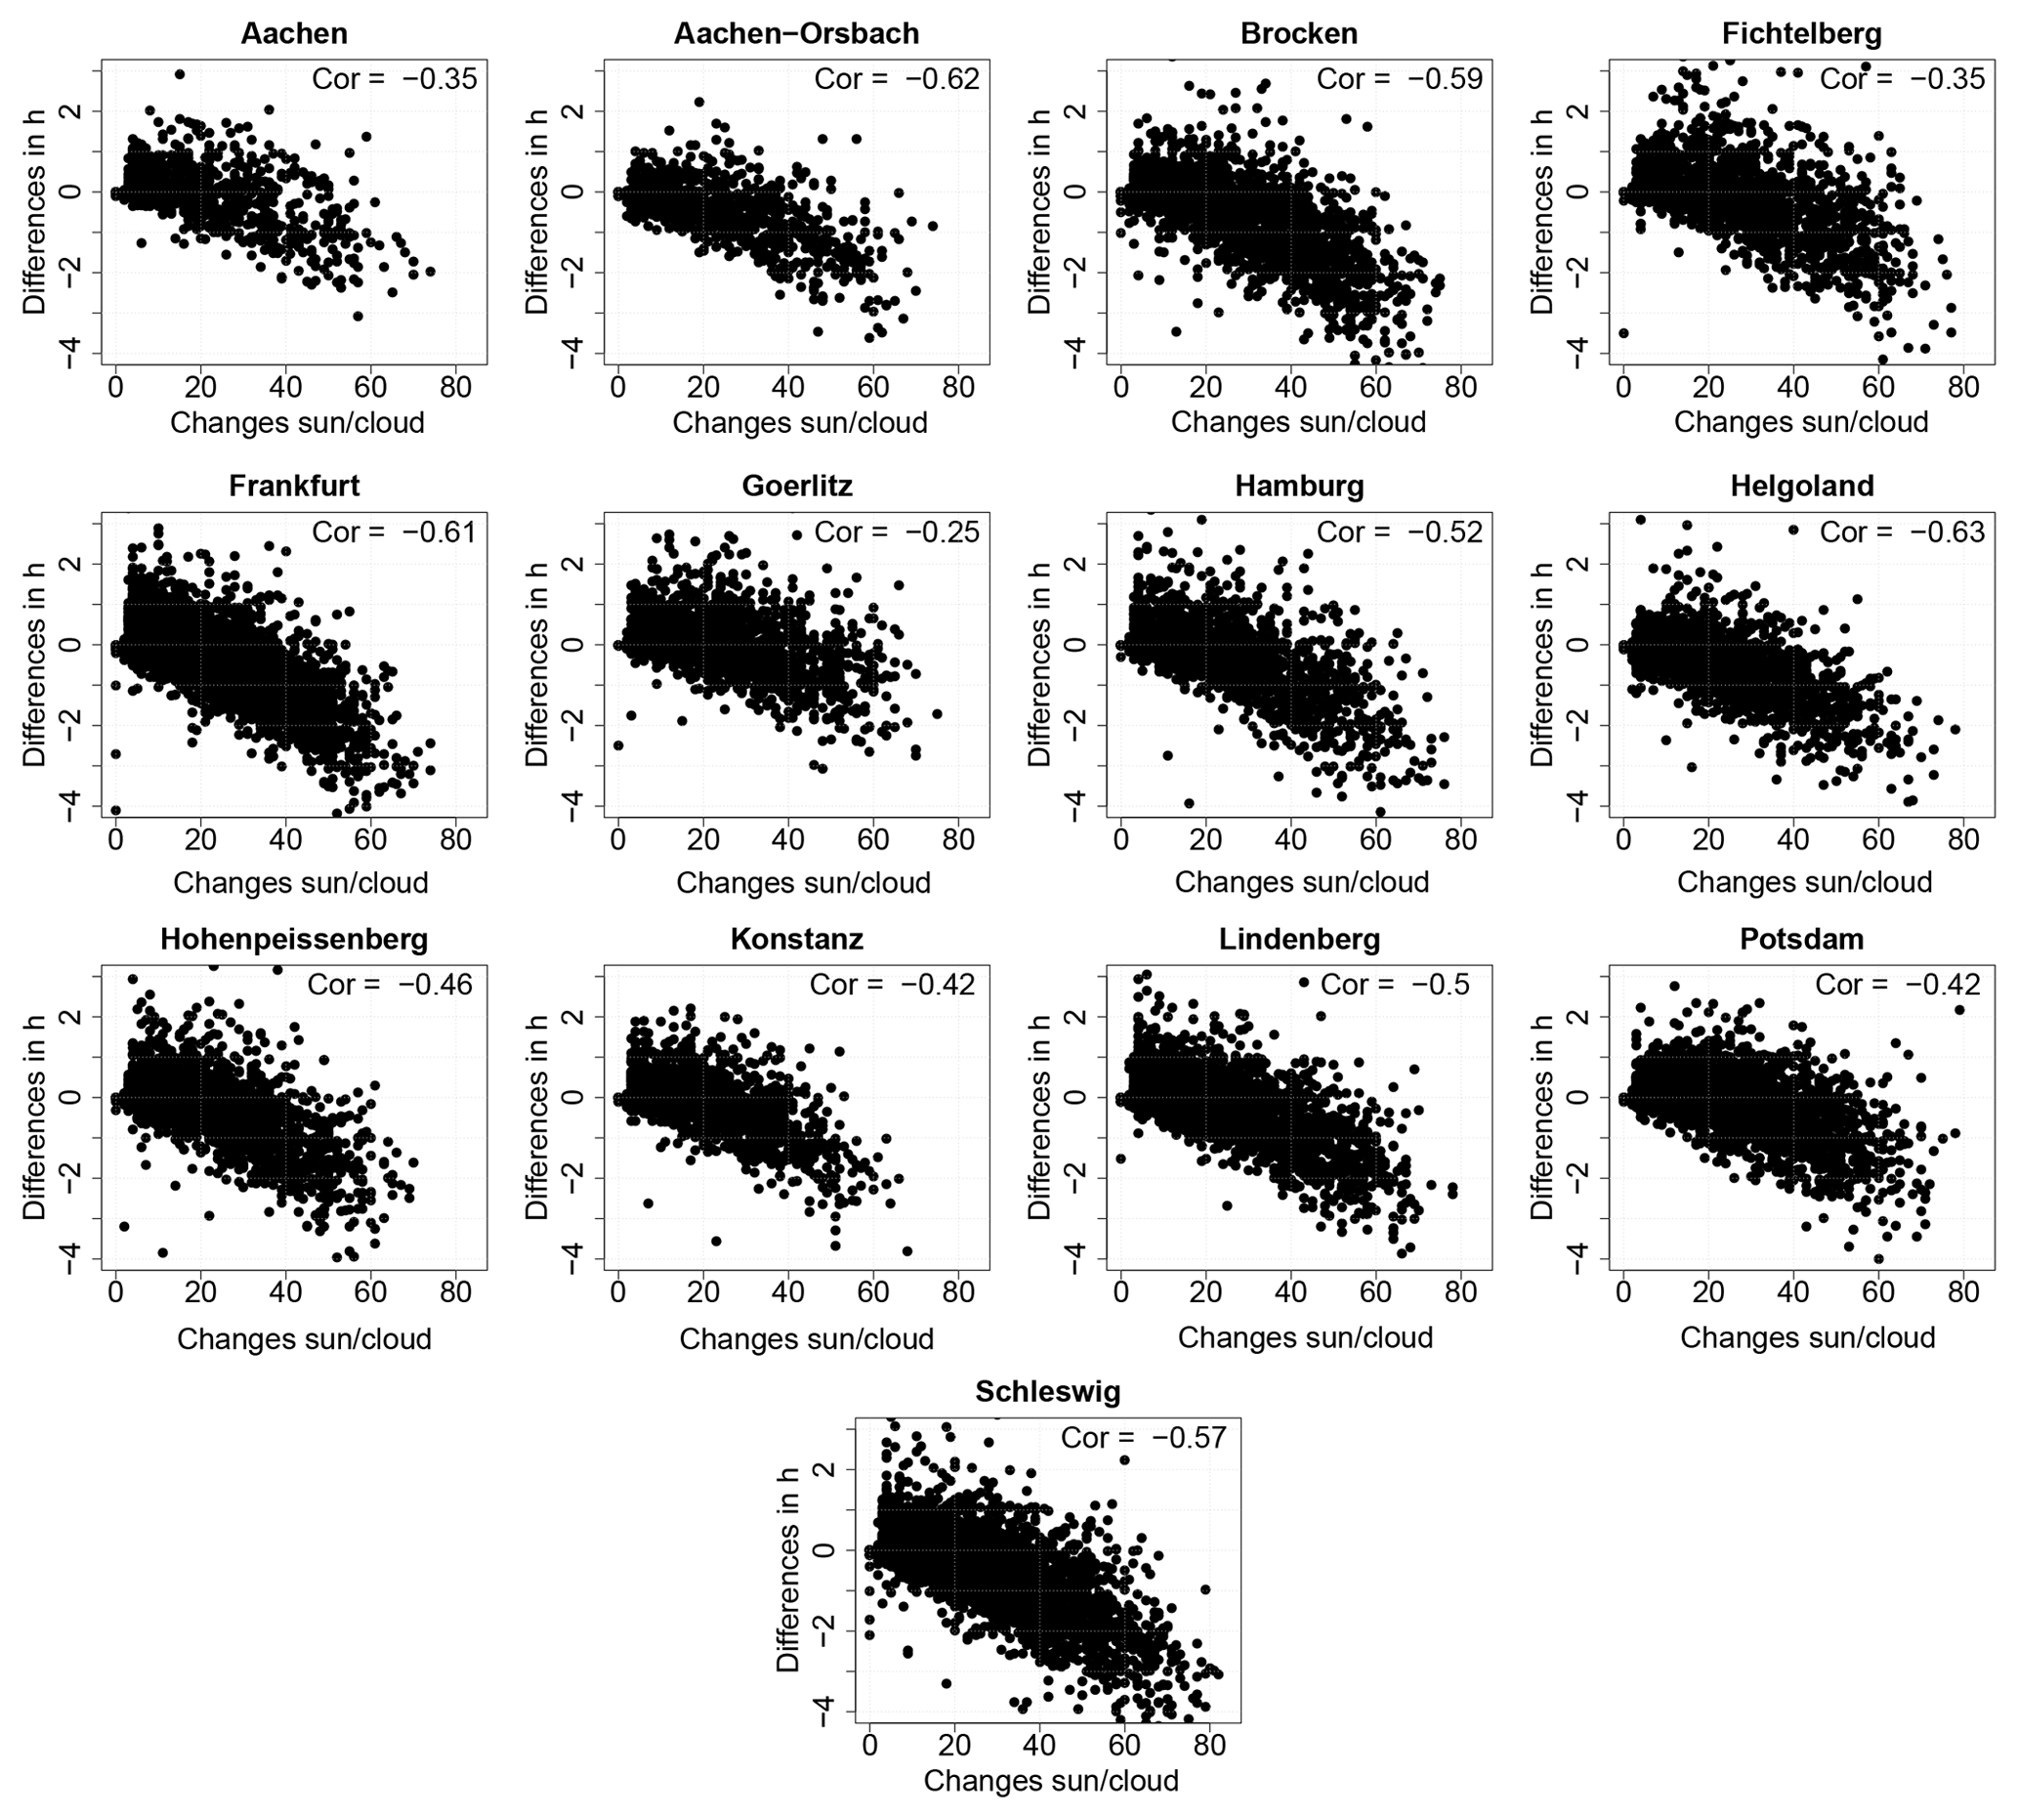
Figure 3Scatterplot of differences of daily sunshine duration (automatic minus manual measurement) in hours and the daily changes between sunny and cloudy periods for all 13 climate reference stations and the correlation coefficients after Spearman.
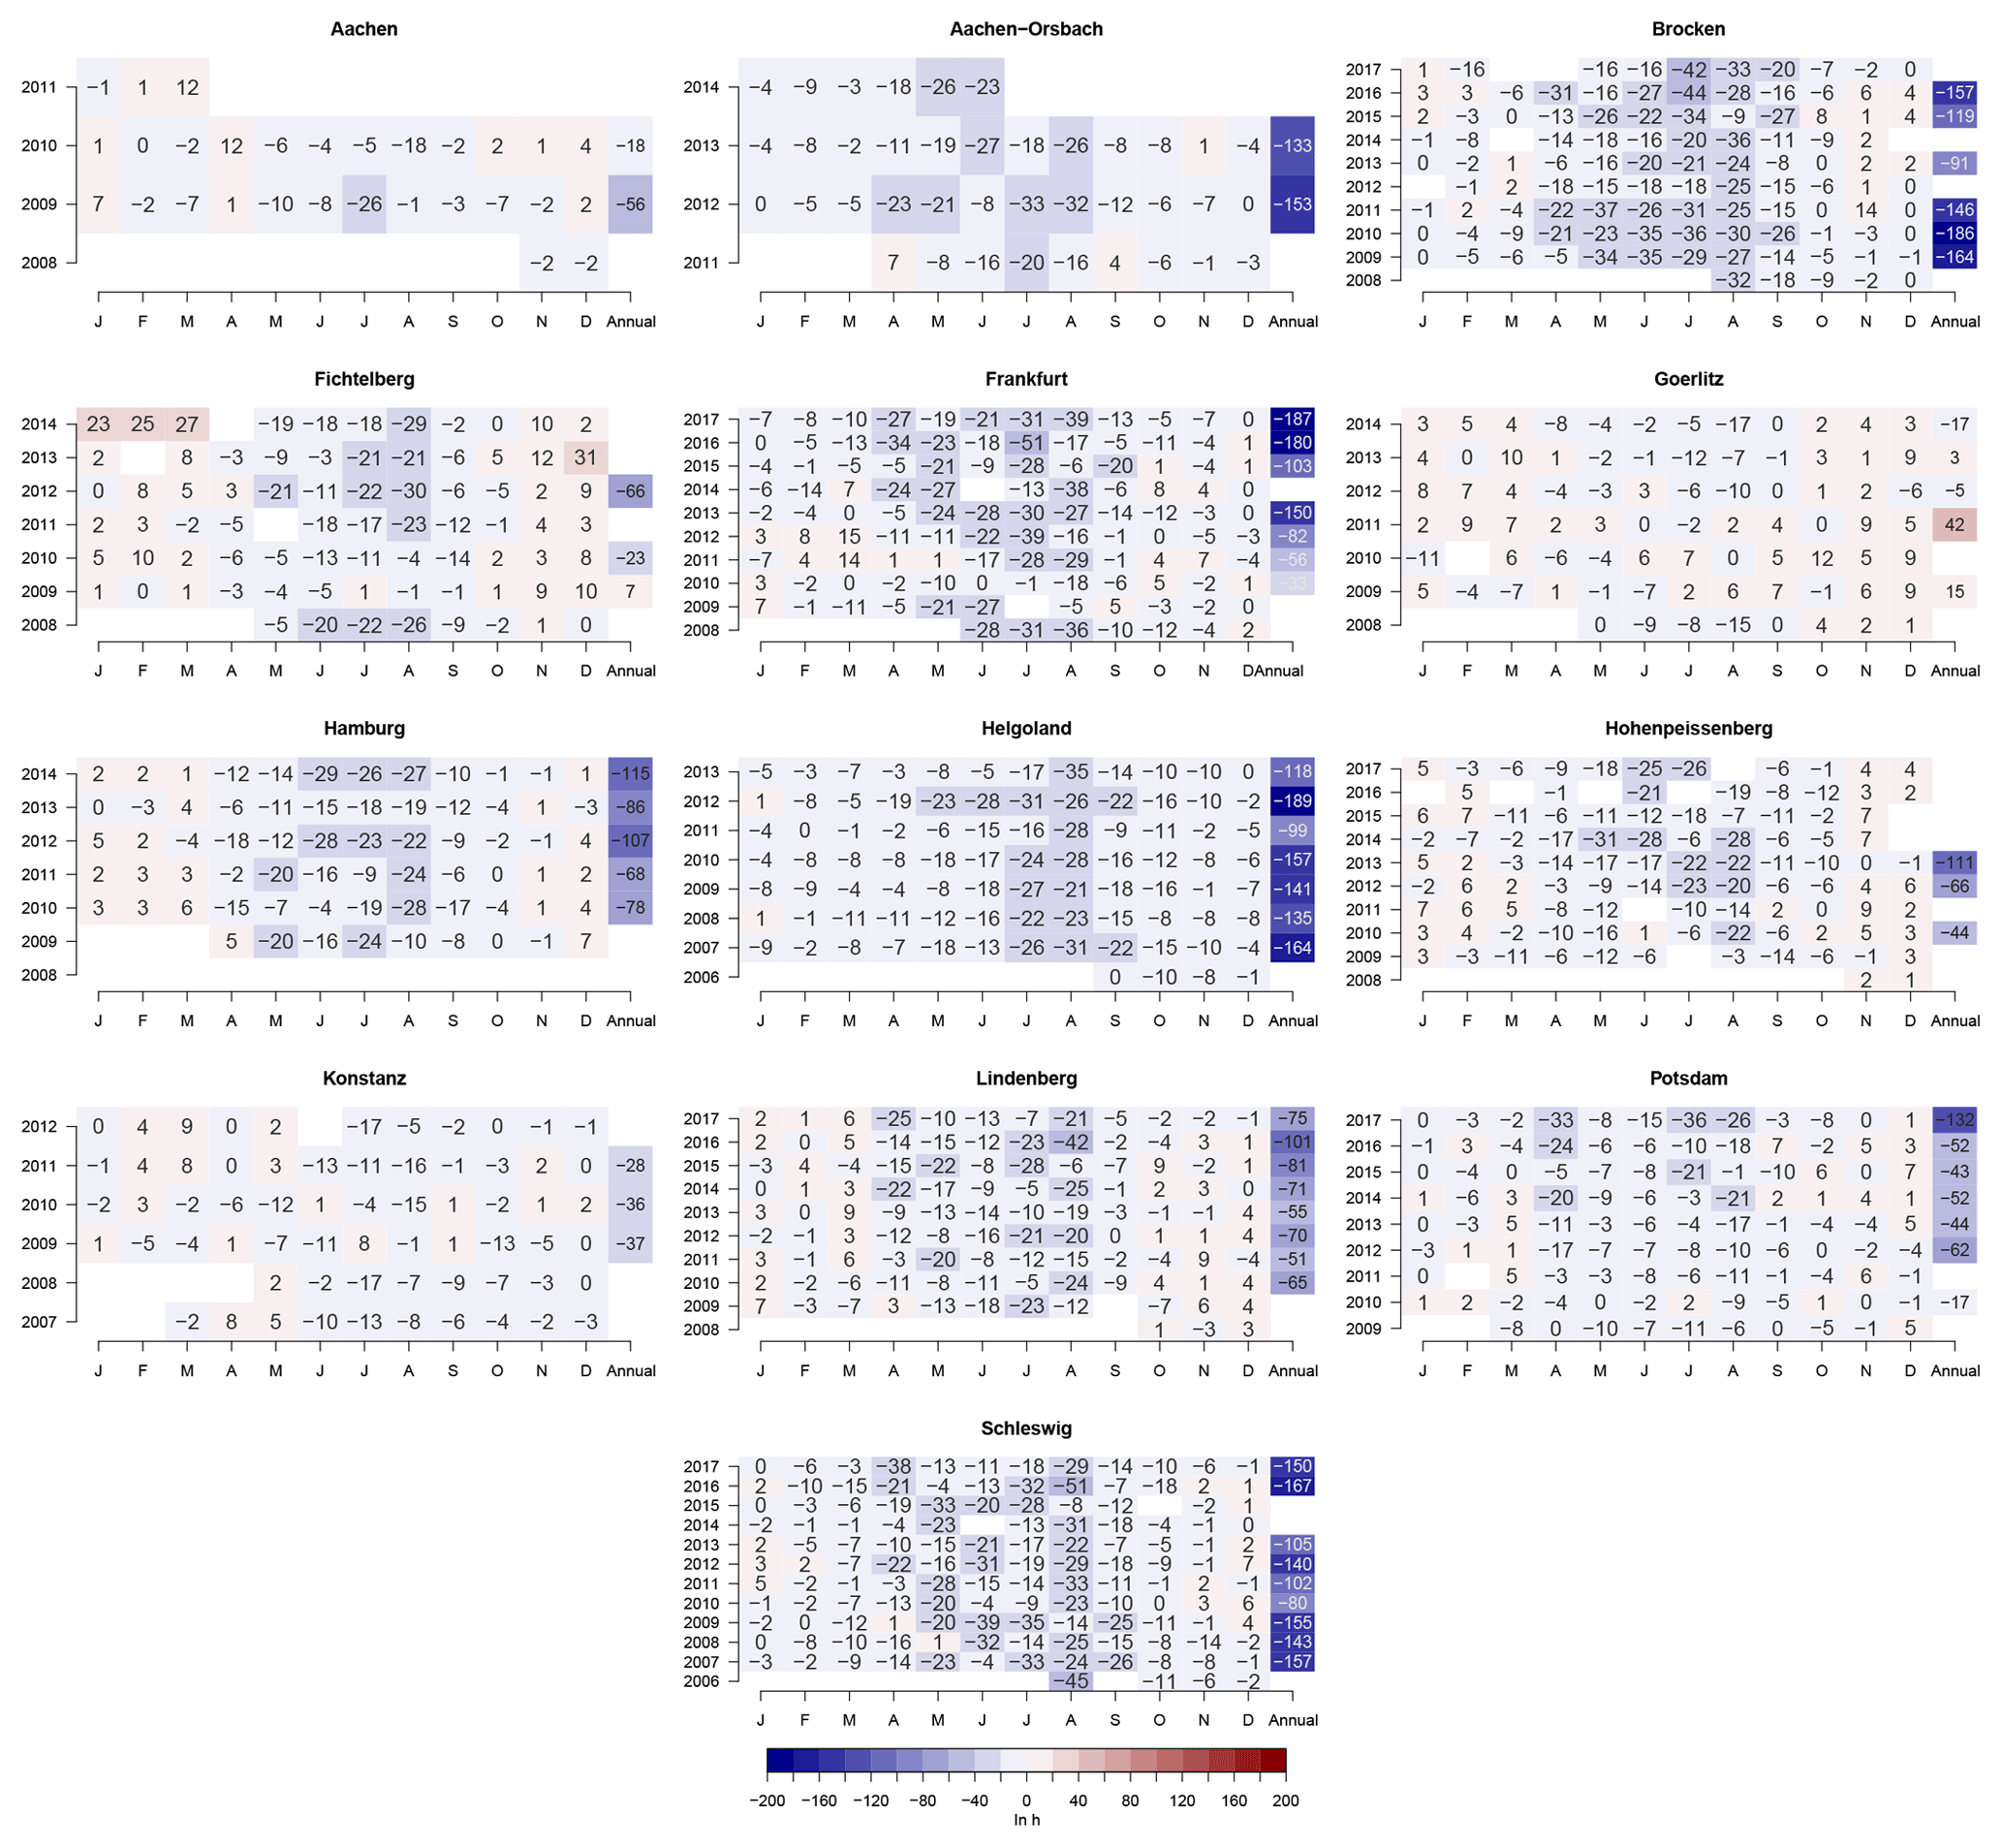
Figure 4Monthly and annual differences of automatic and manual measurements in hours for each station. Negative values (blue) represent less sunshine duration recorded by automatic instruments.
Daily data from 13 stations are used. The availability varies between three to almost ten years. At some stations, data are available from 2008 to the end of 2017. The stations cover all climate regions of Germany. Some stations are located on a mountain top, some are close to the sea or on flat terrain. Table 1 shows the locations and the temporal coverage as used in this study (see Kaspar et al., 2016 for more information).
Time series of parallel measurements differ in the data record, temporal resolution, and precision. The manual instrument is the Campbell-Stokes sunshine recorder. The measurements have daily resolution with a precision of six minutes. The automatic measurements have a temporal resolution of ten minutes with a precision of one minute. The automatic measurements are performed with the SONIe (Brocken, Frankfurt, Hohenpeißenberg, Lindenberg, Potsdam, Schleswig, Görlitz, Hamburg, Aachen, Fichtelberg, Konstanz) or SCAPP (Helgoland, Aachen-Orsbach) instrument (available at Climate Data Center, 2019).
To analyze the comparability of the observations, differences between automatic minus manual measurements are calculated. The mean value of these differences is negative, i.e. on average manual observations are larger than automatic measurements (Fig. 1). This result is consistent to findings of Kerr and Tabony (2004) and Legg (2014). Largest differences occur during summer (see Fig. 2, station Schleswig). The main reason for larger values of manual daily sunshine duration is the so-called “overburning effect”, well known in the literature (e.g. Bider, 1958; Sonntag and Behrens, 1992; Stanhill, 2003). The burnt area on the paper card of the Campbell-Stokes sunshine recorder does not cease immediately at the moment when a cloud disturbs the sunshine. This “overburning” leads to an overestimation of sunny conditions. The automatic instrument records changes in the direct solar radiation faster than the manual instrument. This characteristic leads to large differences in sunshine duration between the two instruments in situations with frequent changes between cloudy and sunny conditions. In this study, the daily number of changes between sunny and cloudy conditions are estimated based on the automatic measurements by counting how often subsequent automatic measurements (with a temporal resolution of ten minutes) alternate during the day. For example, the automatic measurements with a temporal resolution of ten minutes are 0.033, 0.017, 0.083, 0.167, 0.150, and 0.150 h. The changes between sunny and cloudy conditions in this sequence are four. The daily differences of automatic and manual measurements are highly correlated with the daily number of changes between sunny and cloudy situations (see Fig. 3, based on correlation coefficients according to Spearman). Significant correlation coefficients indicate a negative relationship between these two parameters. For the analysis the R-functions “cor” and “cor.test” are used (based on methods described in Kendall, 1938, 1945; Hollander and Wolfe, 1973; Best and Roberts, 1975; Becker et al., 1988). The day length is also correlated.
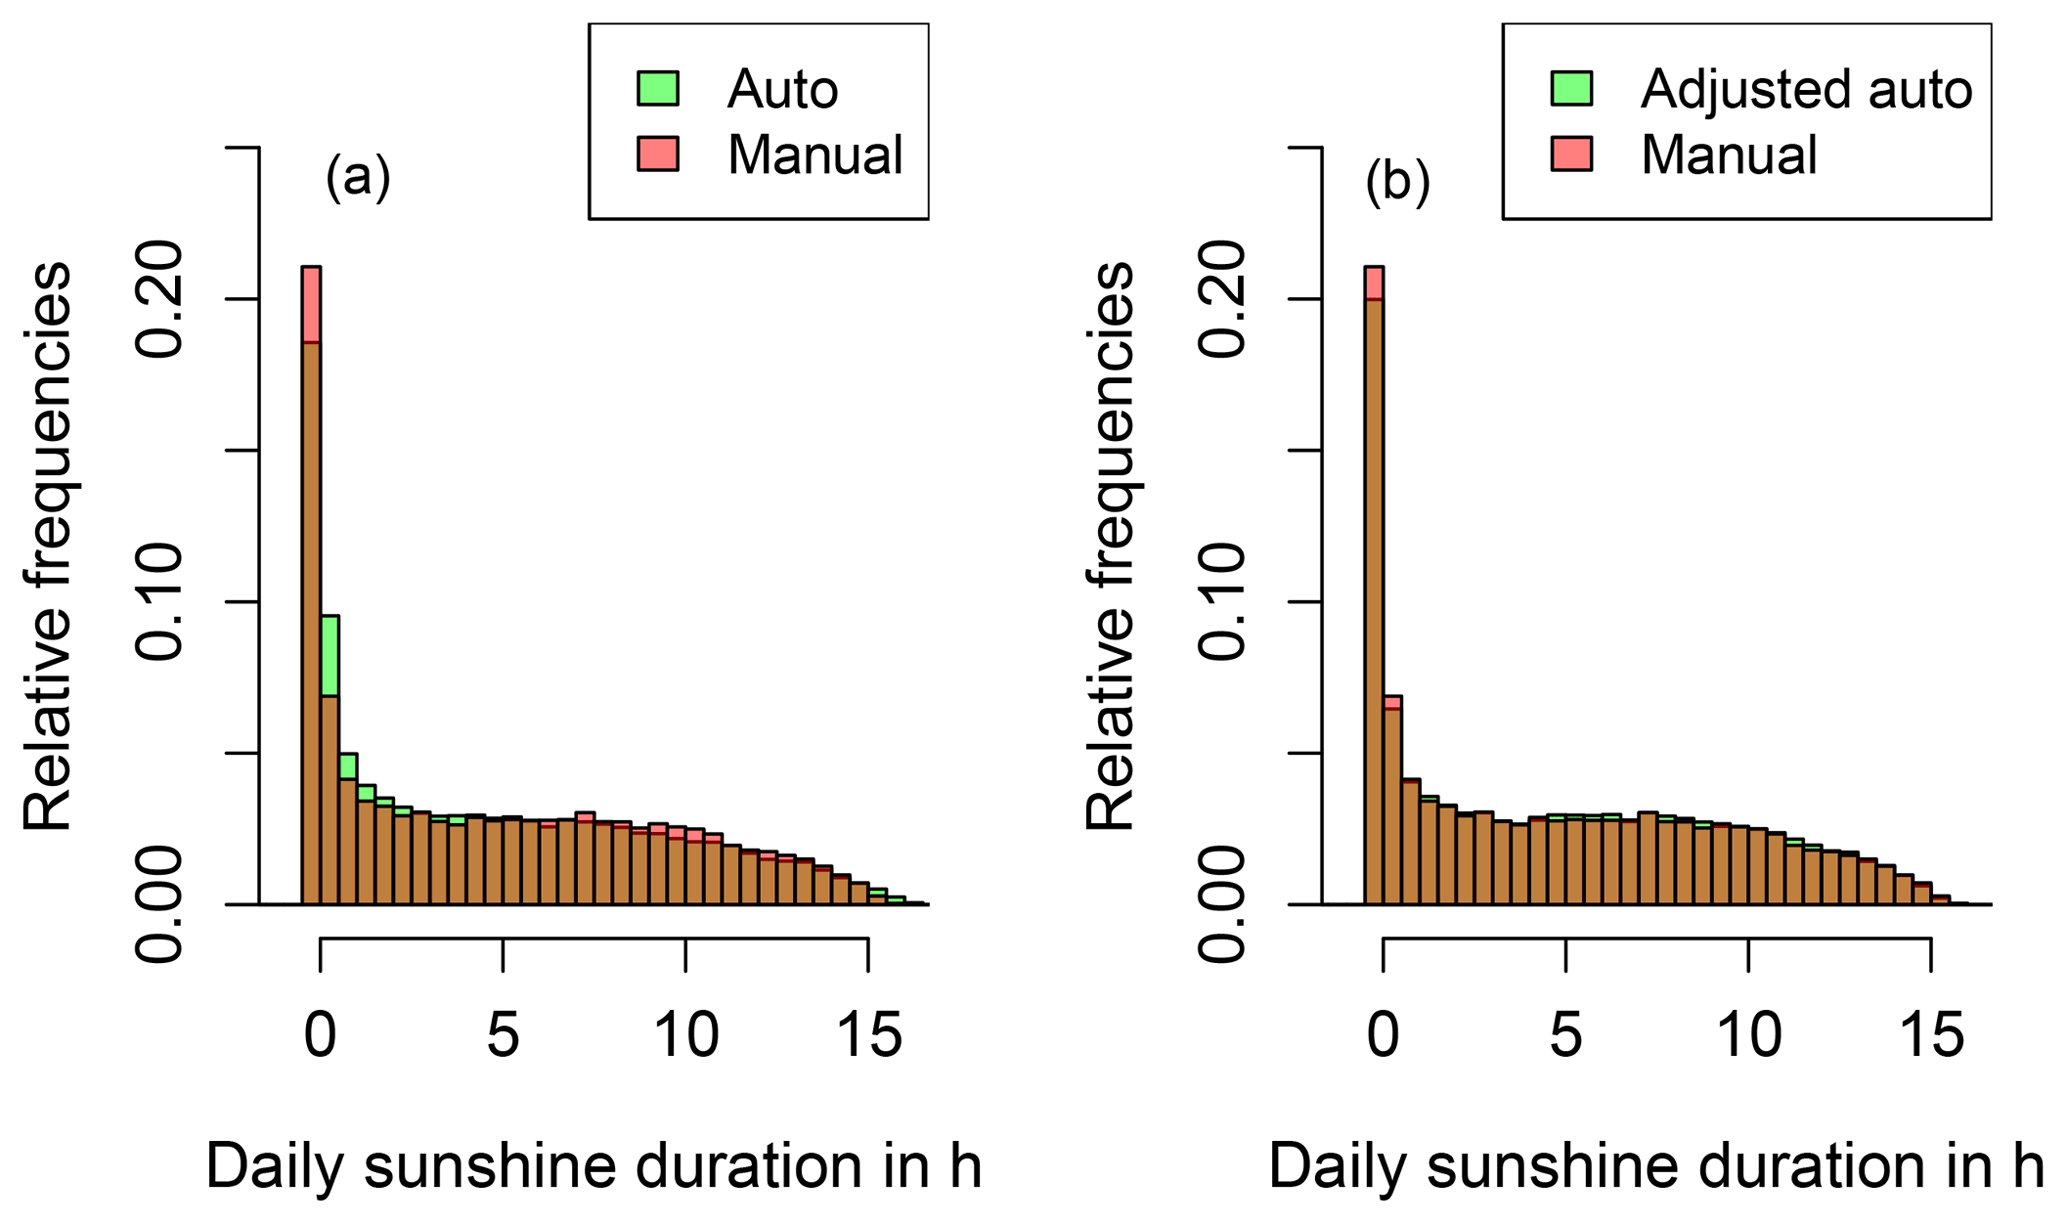
Figure 5Histograms of manual (red) and automatic (green) measurements. (a) raw data is used; (b) all automatic measurements are adjusted using the linear model.
The sum of differences of automatic and manual measurements for each month and the complete year is shown in Fig. 4. Negative differences predominate in the summer months. The annual differences can be up to −189 h (station Helgoland in 2012; the annual sum of automatic measurements in 2012 was 1593 h for this station , i.e., a difference of more than 10 % between automatic and manual measurements.).
To prevent breaks in long time series of daily sunshine duration, a linear model is suggested to fit automatic measurements to manual observations. The automatic measurements, the day length, and the daily number of changes between sunny and cloudy conditions are used as predictors. Before estimating the linear model, outliers are eliminated. If the absolute daily difference between manual and automatic measurements is larger than four hours, the values are deleted. To consider only useful predictors, the R-function “step” out of the package “stats” was applied. This function allows to choose a linear model with a stepwise algorithm and the “Akaike information criterion” (AIC). After starting with the simplest model, the number of predictors is increased. With every new predictor included, the other predictors in the model are tested if they are still useful. So the direction to choose and test the model is a combination of forward and backward. All parameters (automatic measurements, number of changes sun/cloud per day, and day length) are identified as useful predictors. To estimate the regression parameters all available data (13 stations; n = 32 378) are used. The formula to adapt the automatic measurements is
After applying this method the histogram of the adjusted automatic measurements fits better to the histogram of the manual measurements (Fig. 5, on the right).
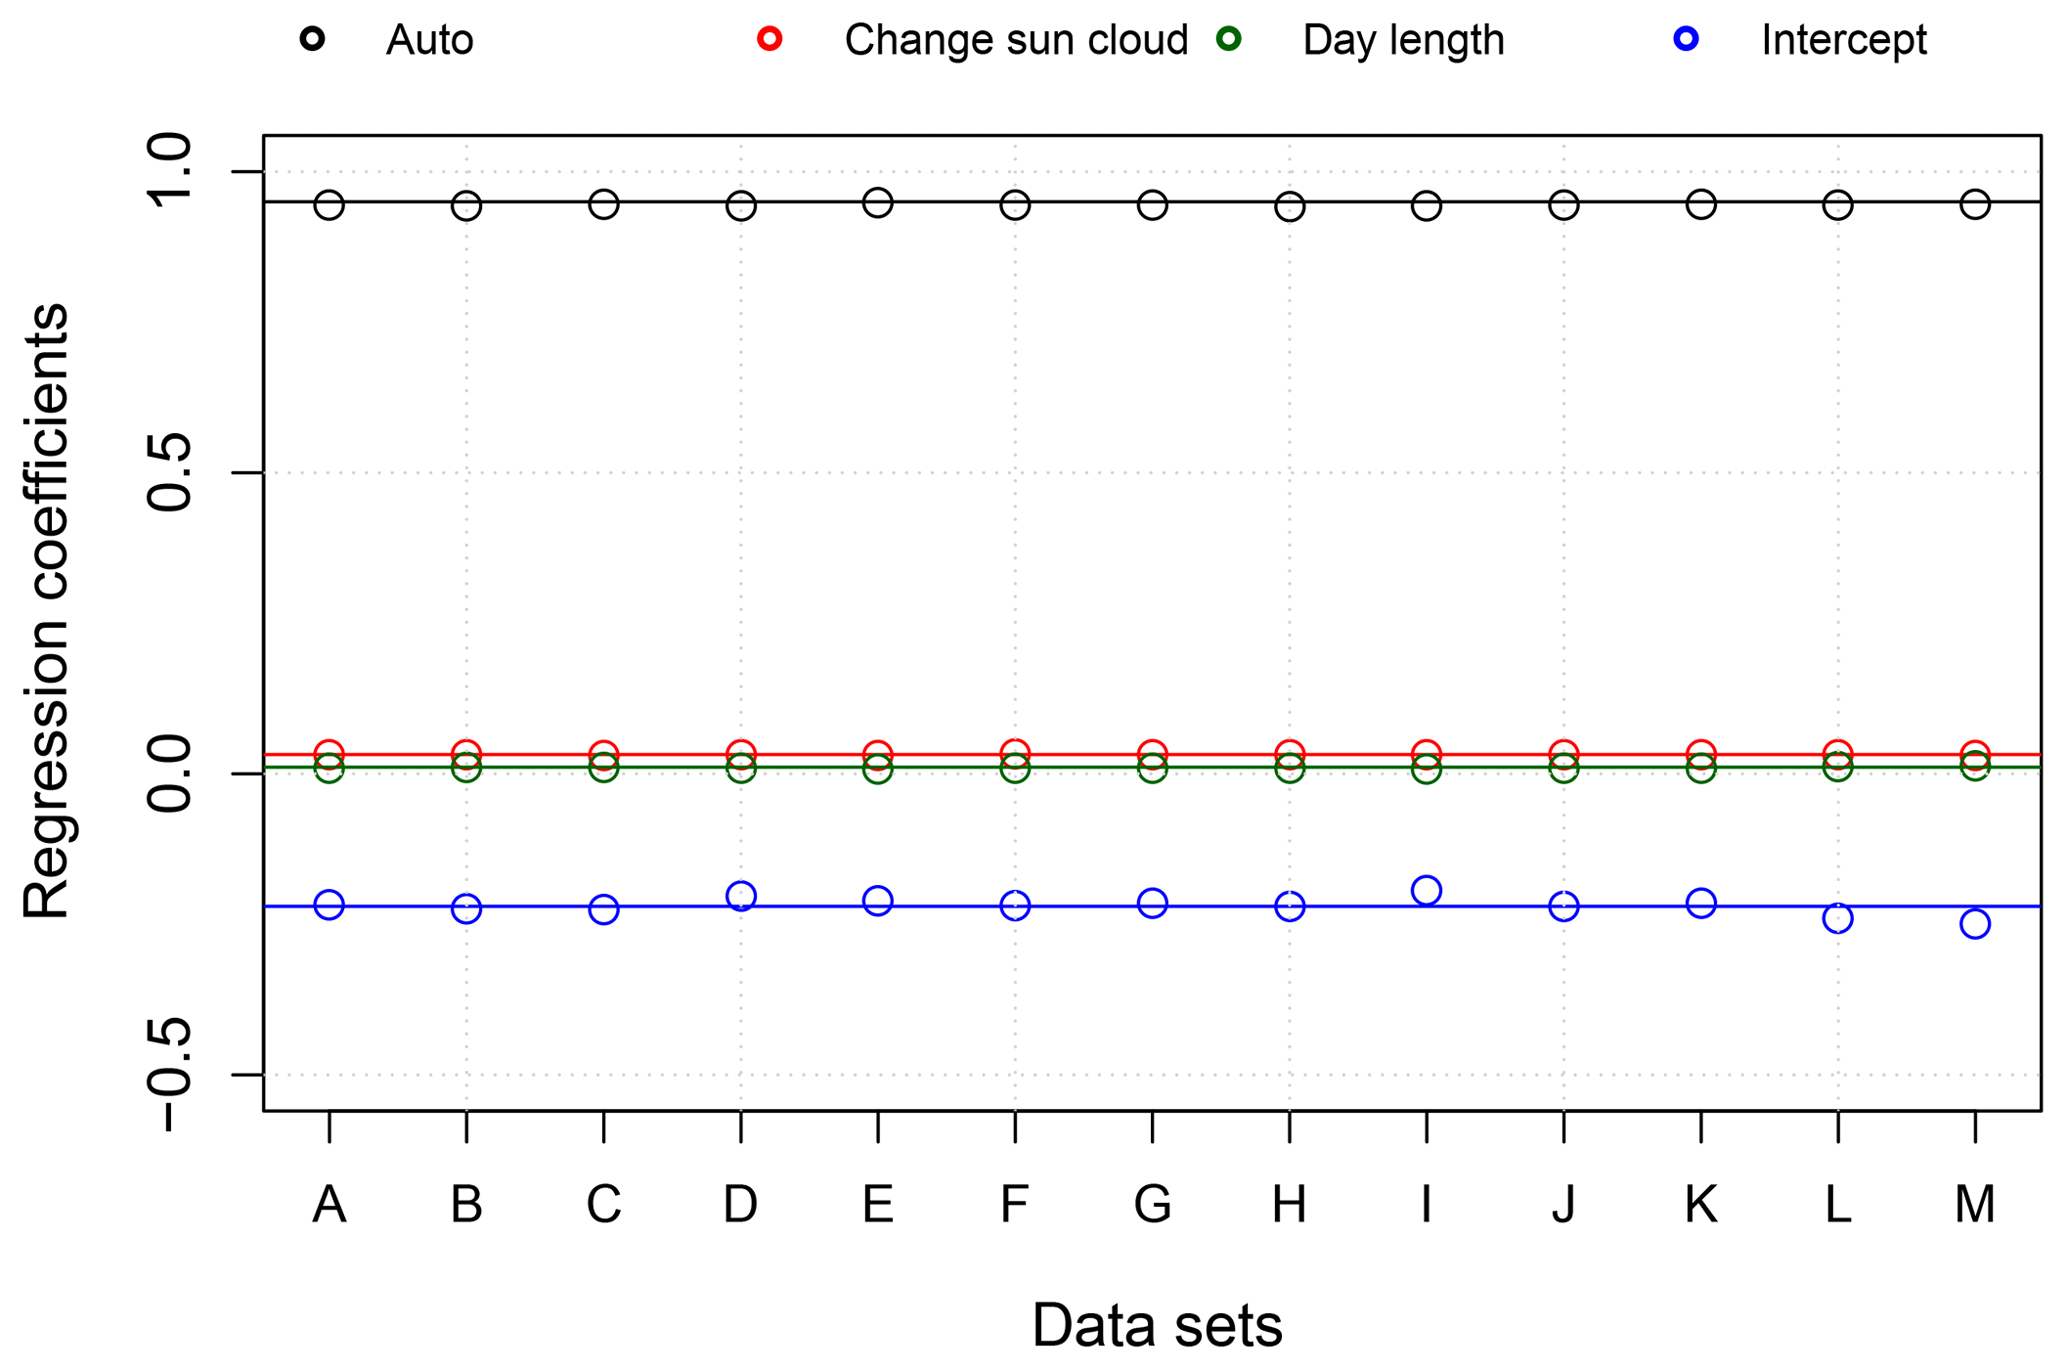
Figure 6Regression parameters of different combinations of stations (points) for leave-one-out cross validation and using all stations (straight lines).
The next step is the validation of the model. Therefore, a leave-one-out cross validation was performed (by leaving out data of one individual station) and the regression parameters for the data of the remaining twelve stations are calculated. The points in Fig. 6 show the results for every combination of stations (with data of one station missing). For all combinations of stations similar regression parameters are obtained. The straight lines represent the regression parameters using all available data (13 stations). All points are close to that line. The model parameters do not depend on data from one specific station.
After the adjustments of the automatic measurements the mean and the standard deviation of the differences during summer months are reduced (Fig. 7). The monthly differences for the station Lindenberg and Hamburg are illustrated in Fig. 8 (plot at the top and in the middle). After the adjustments, the annual cycle is strongly reduced. Only at one station (Görlitz; Fig. 8, bottom) the adjustments with the linear model leads strengthening of the annual cycle. As shown in Fig. 3 the correlation between daily differences of automatic and manual measurements and daily changes between sunny and cloudy conditions is smaller at station Görlitz compared to the other stations. Reasons or assumptions to explain this effect are not yet found. The measurement setup at the station Görlitz is comparable to the other stations.
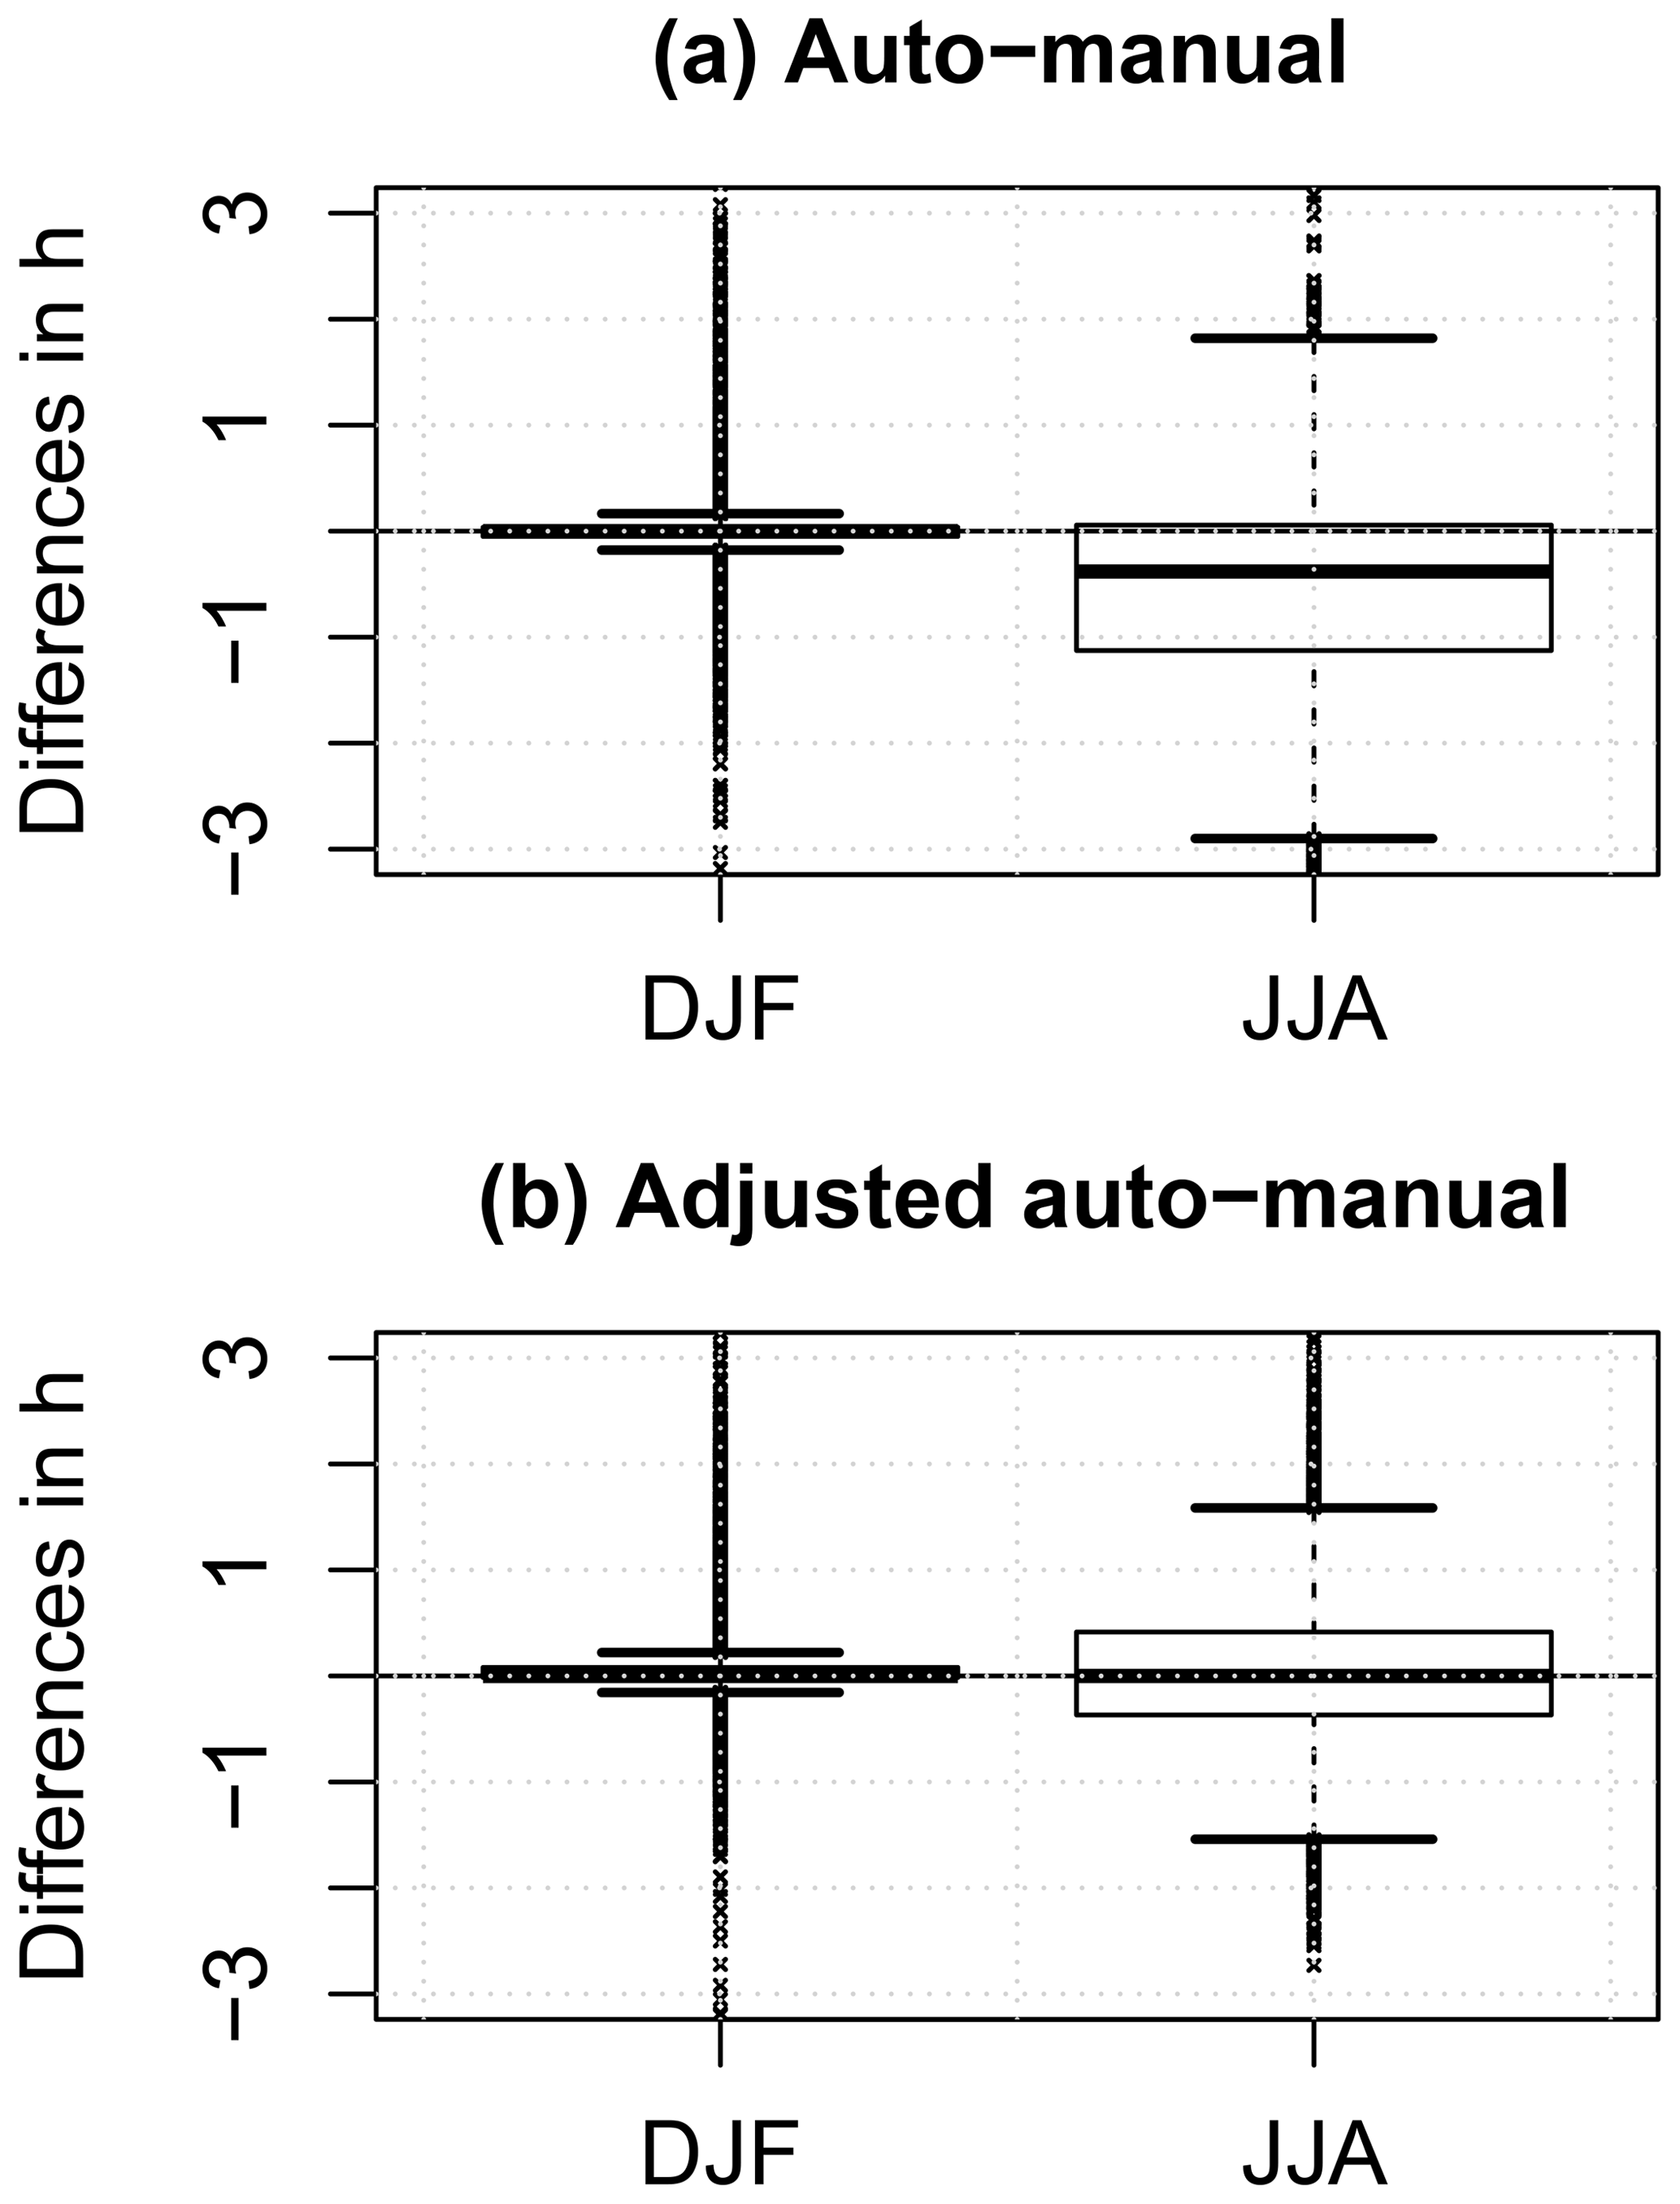
Figure 7Boxplot of daily differences between automatic and manual measurements in hours; left: only winter values are used; right: only summer values are used. (a) raw data is used; (b) adjusted automatic measurements are used.
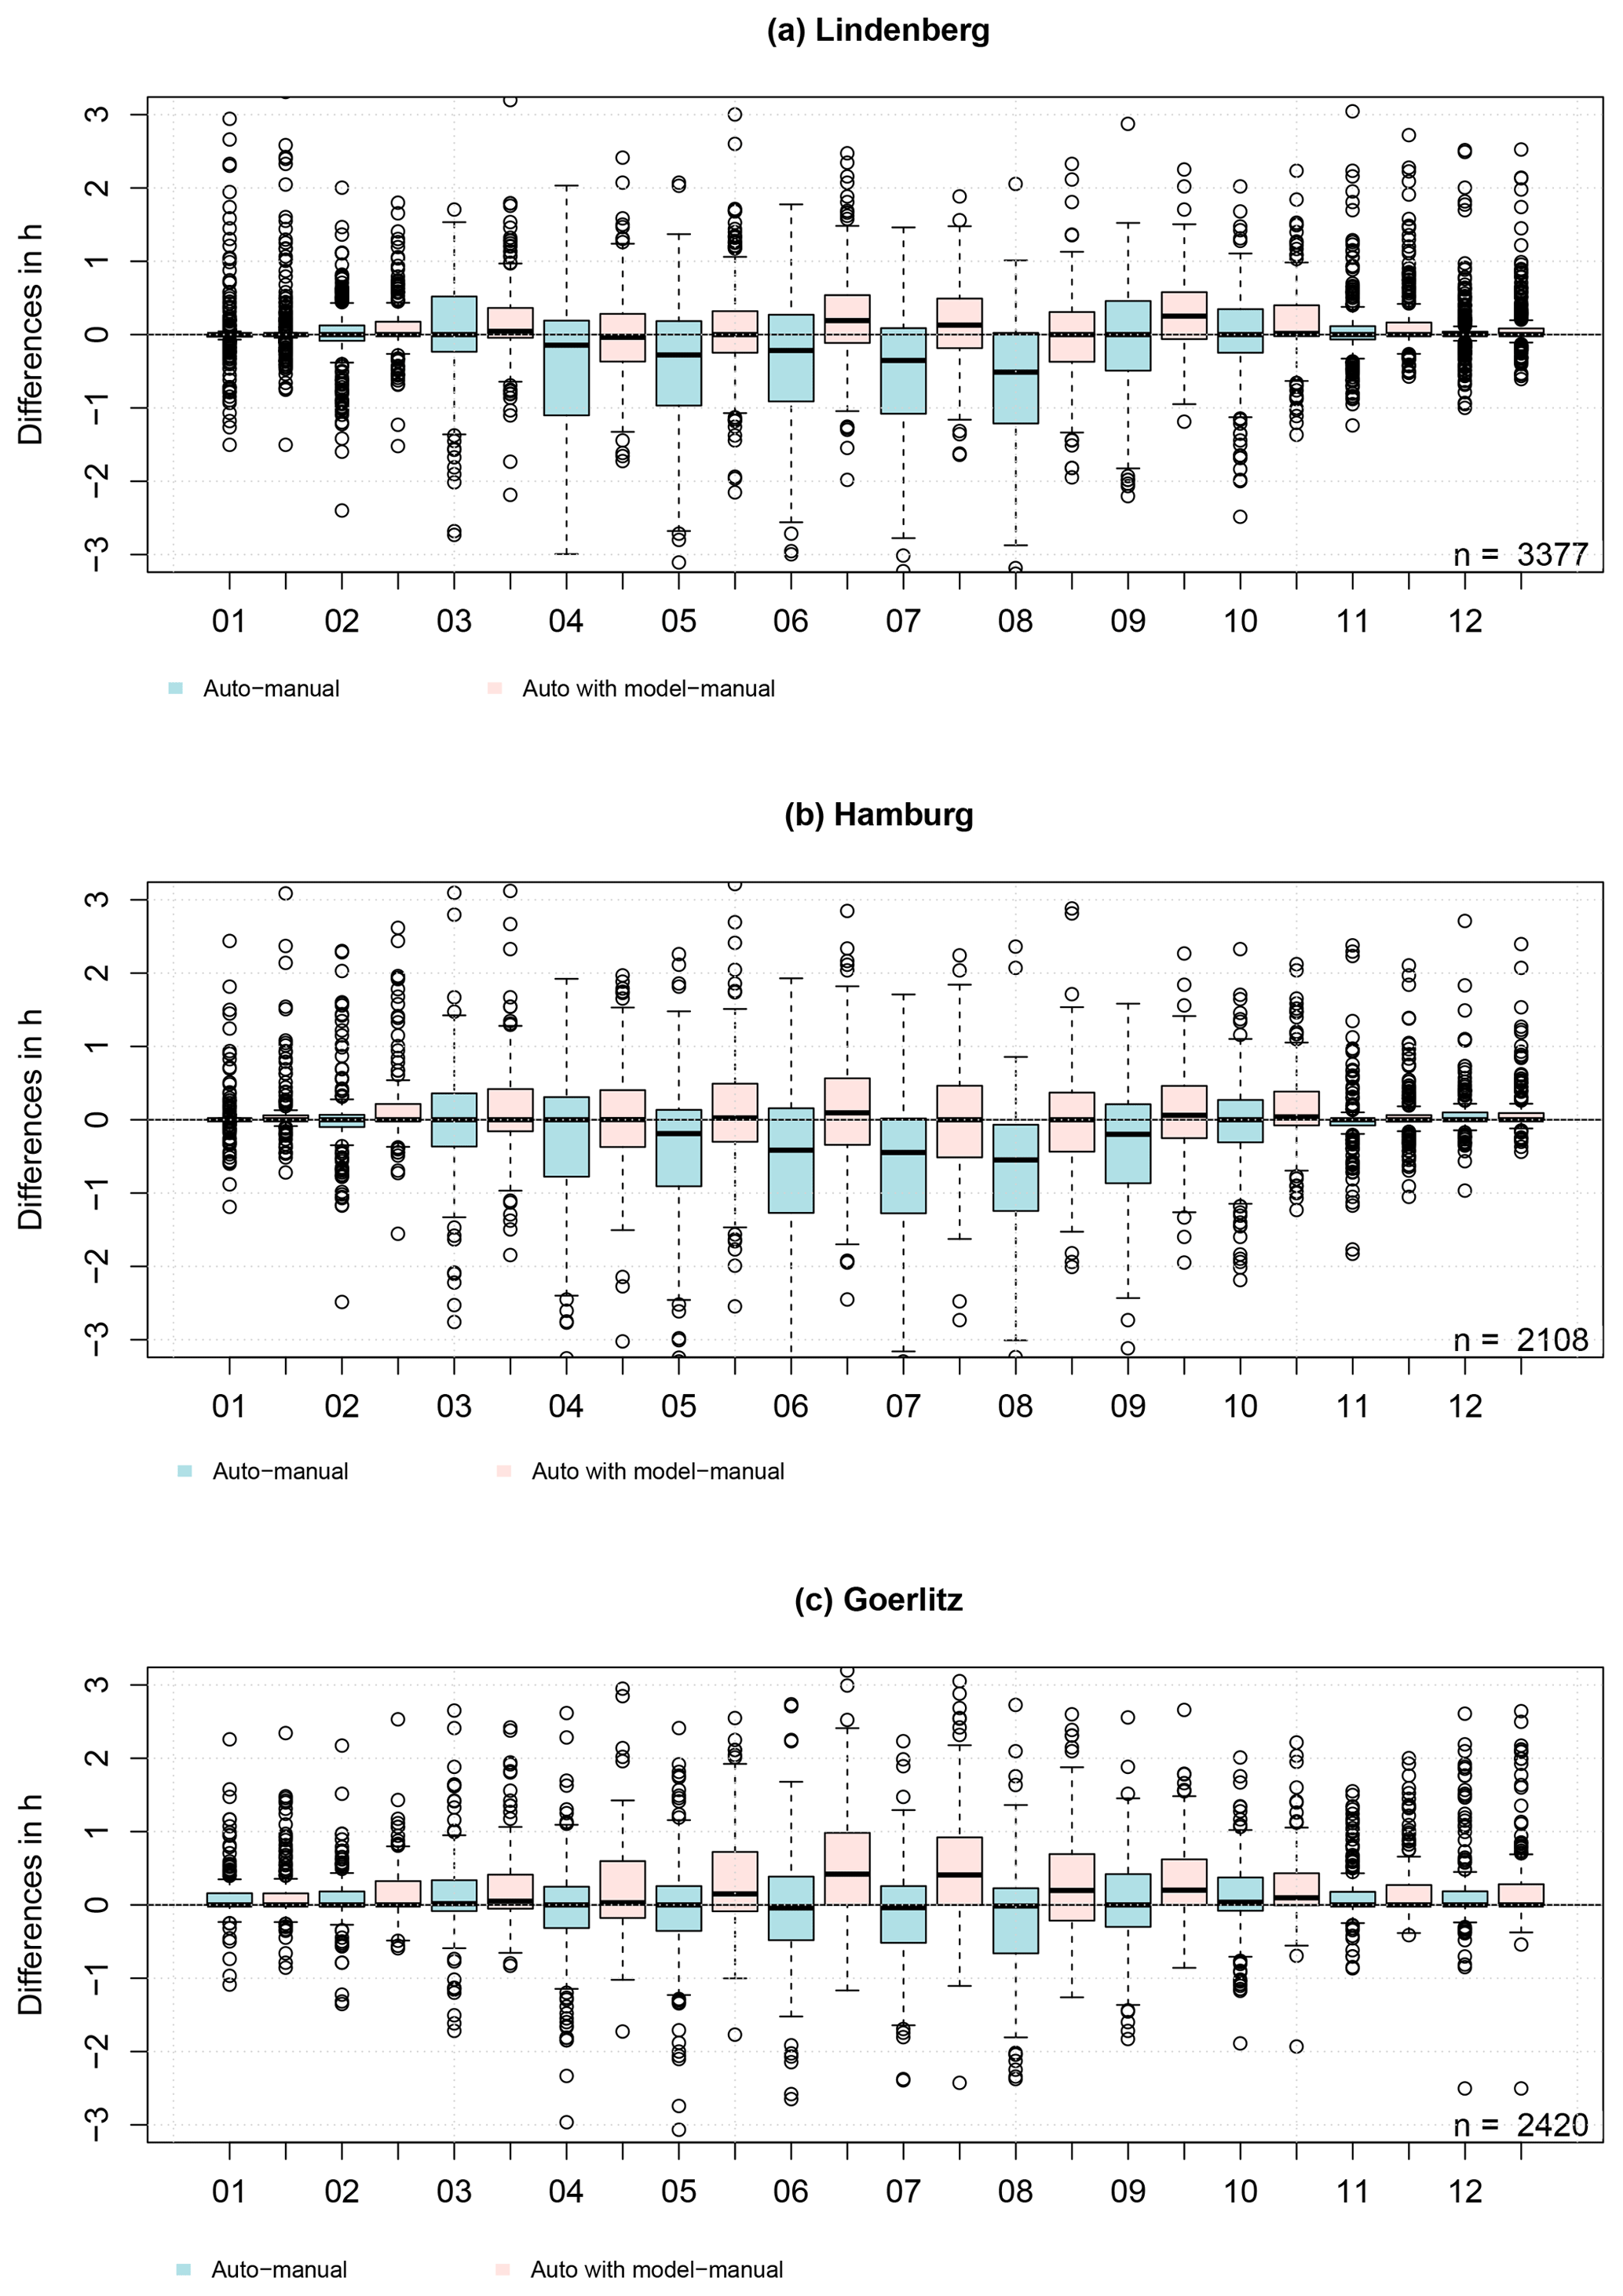
Figure 8Boxplot of differences between automatic and manual measurements in hours for every month for the station Lindenberg (a), Hamburg (b) and Görlitz (c). Blue boxplots: raw data is used; pink boxplots:adjusted data is used.
In summary, the differences between adjusted automatic and manual daily sunshine duration have a mean close to zero and a smaller standard deviation comparing to raw data (Fig. 9). With this approach automatic measurements can be adjusted and are more consistent to manual observations.
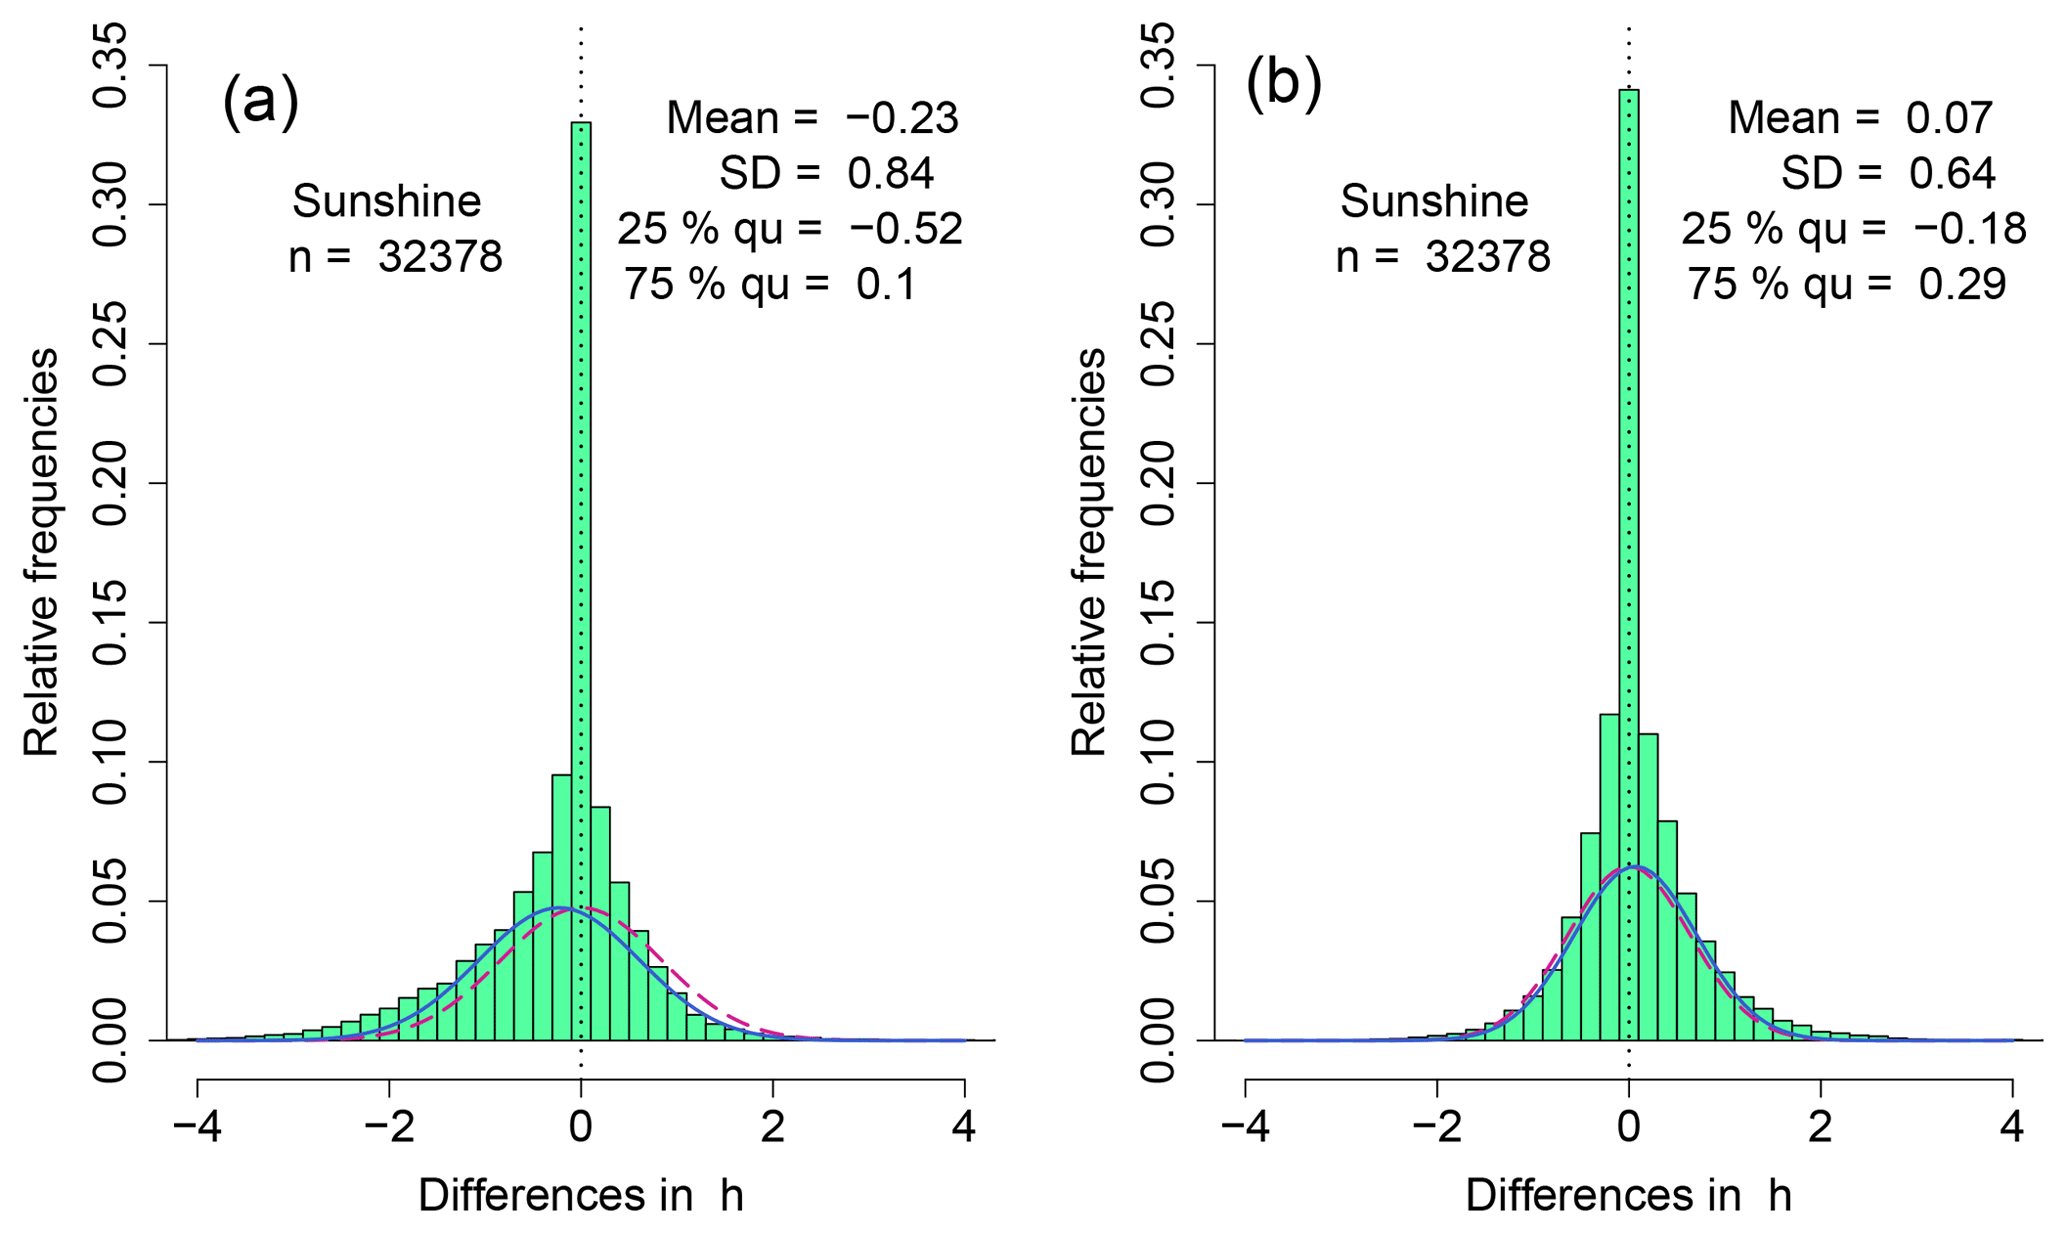
Figure 9Differences of daily sunshine duration (automatic minus manual observations) in hours. The blue line is the normal distribution used for the statistic of the differences; the pink line is a normal distribution with a mean of zero and the standard deviation according to the statistic of the differences. (a) raw data is used as shown in Fig. 1; (b) adjusted automatic measurements are used.
In this section, the automatic measurements at German climate reference stations are adjusted and the trends of the long time series are compared to the trends of the time series without adjustments. Using the adjusted data, the trends are larger (see Fig. 10). In Hamburg the sign turns from negative to positive. In the last decades, positive anomalies are dominant.
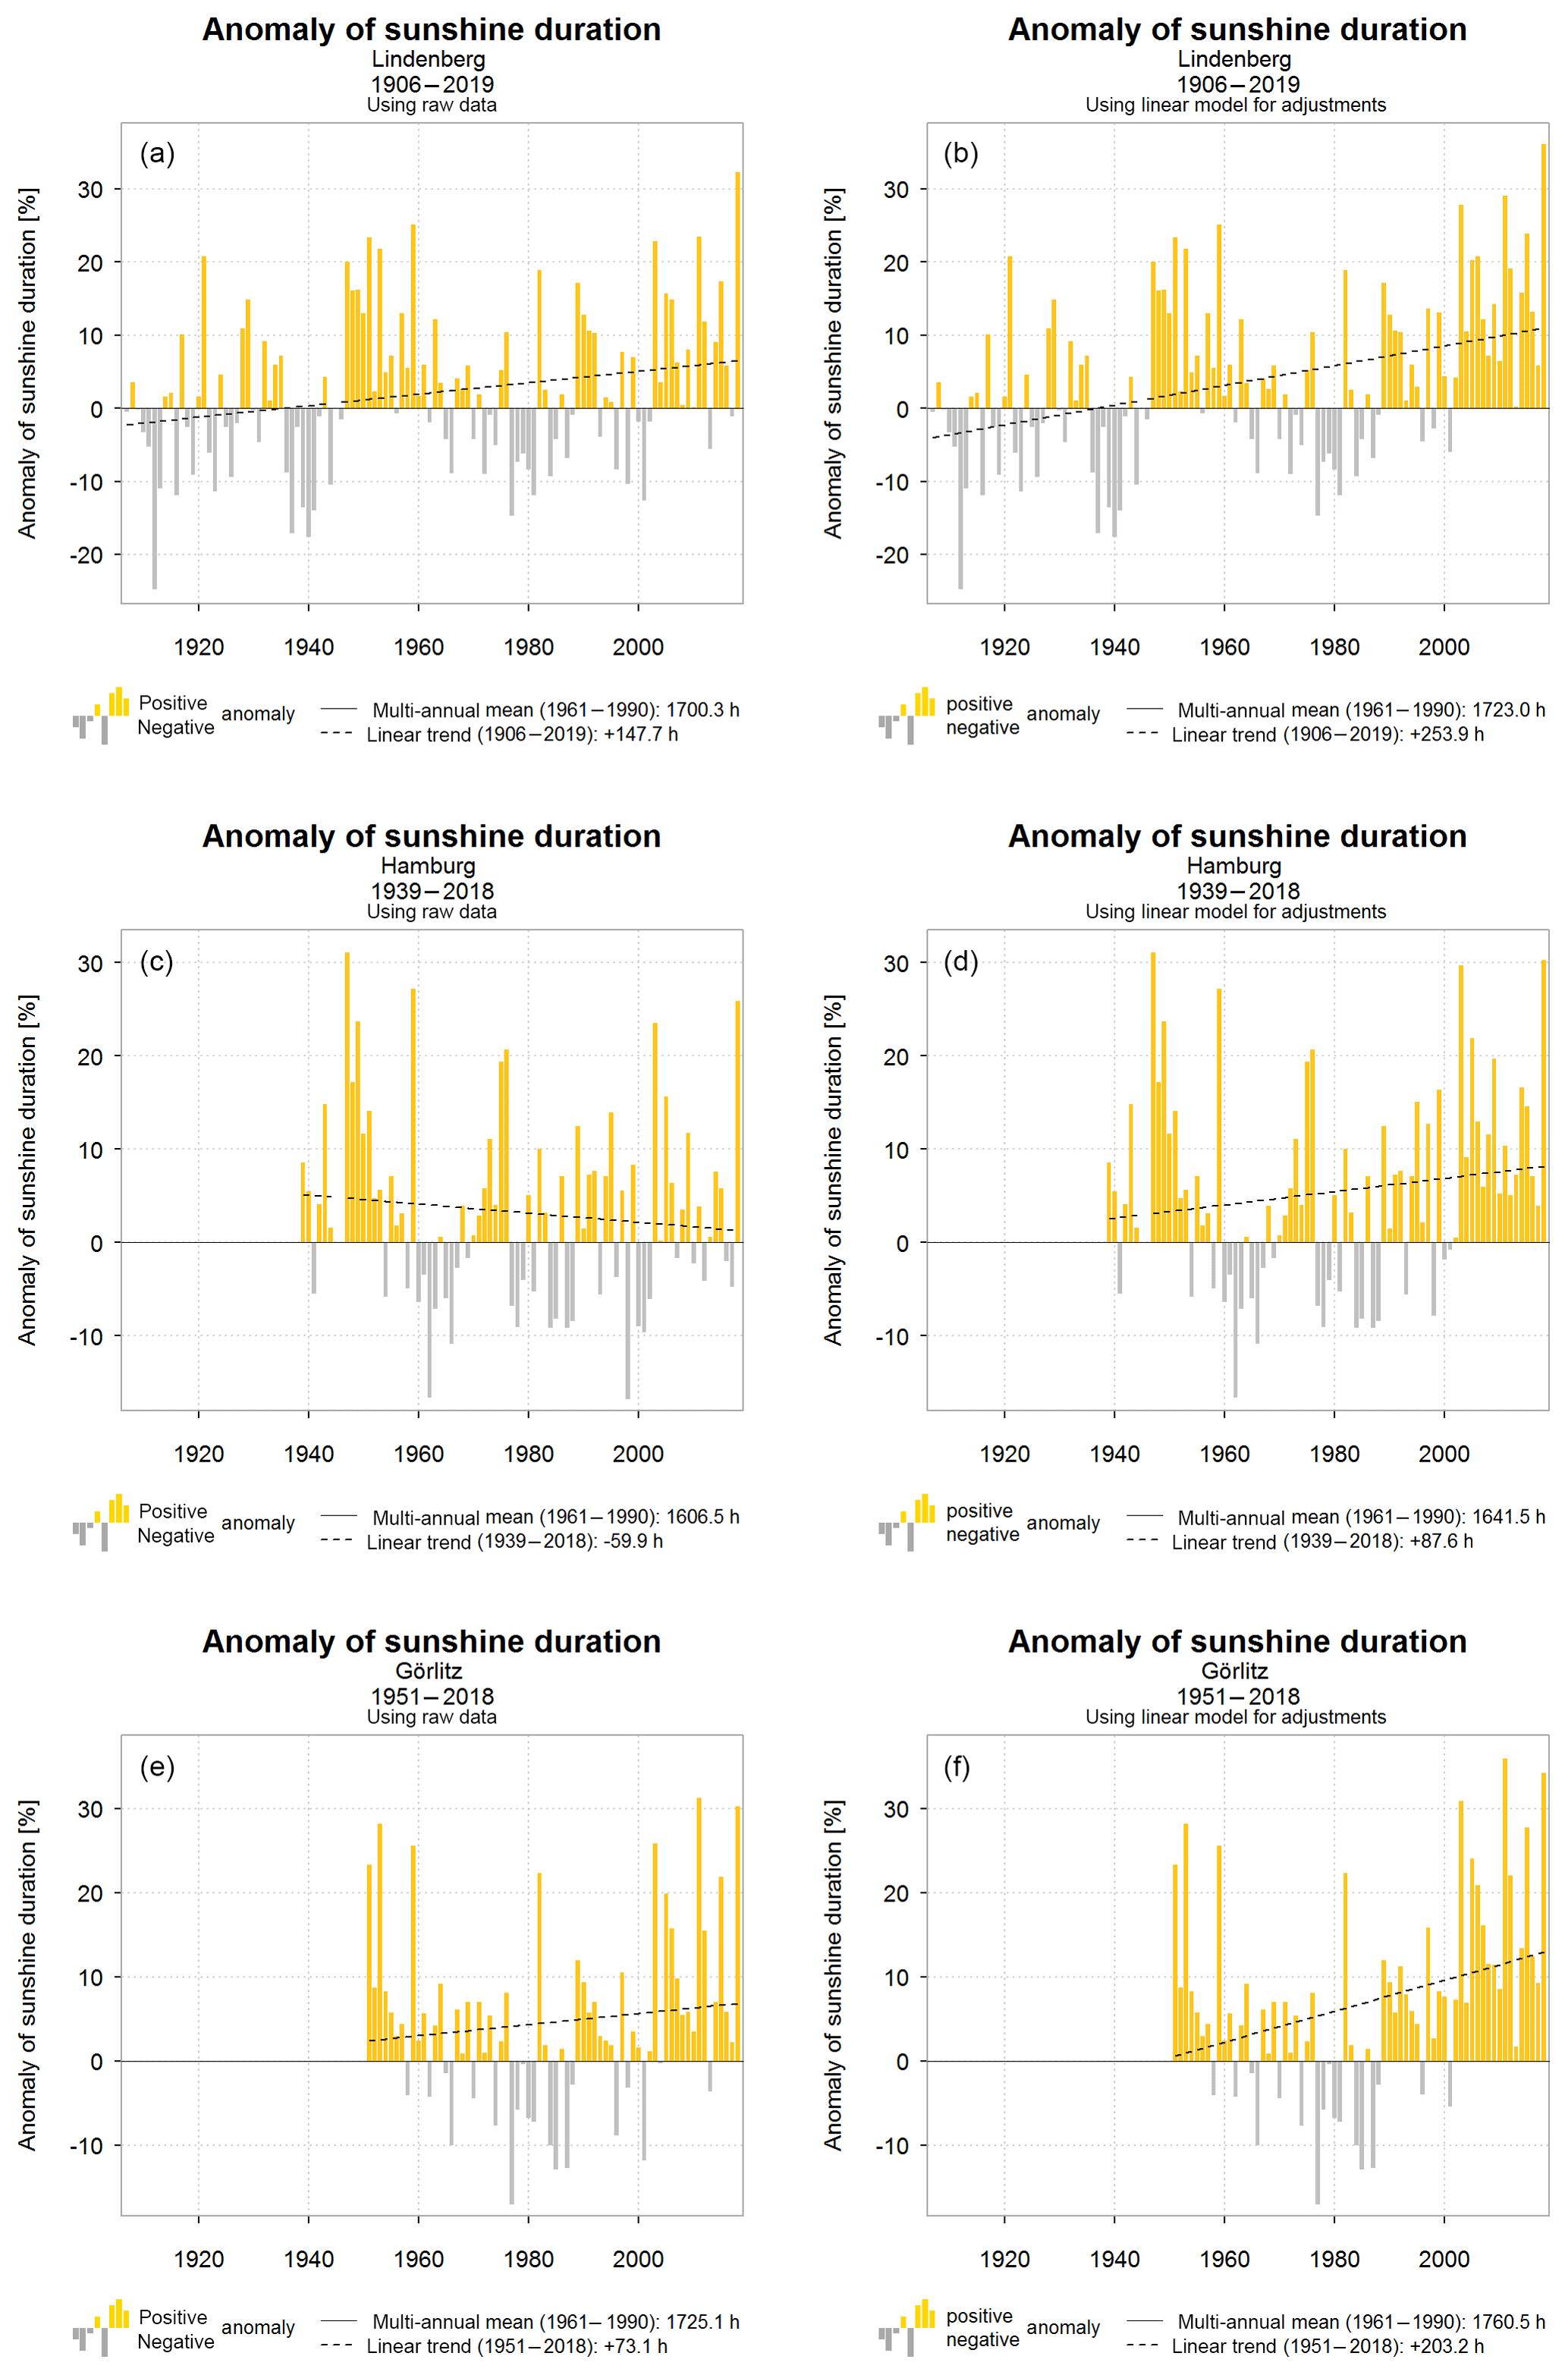
Figure 10Anomaly of sunshine duration using raw data (a, c, e) and using the linear regression model to adjust the automatic measurements (b, d, f).
This increase in annual sunshine duration can be related to the “brightening” effect of solar radiation. In long-term measurements of solar radiation a “dimming” period from the 1950s to 1980s was identified with some regional variation (Stanhill, 2005) followed by a “brightening” afterwards (Wild et al., 2005). These trends are also present in satellite data (Pinker et al., 2005). The most common hypothesis is that the “brightening” was caused by a reduction of anthropogenic aerosols (Streets et al., 2006; Power, 2003). Sanchez-Lorenzo et al. (2008) analyzed sunshine duration time series over Europe from 1938–2004. In their study, the changepoint between a period of decreasing sunshine duration (with a beginning around the 1950s) and increasing sunshine duration is detected around the 1980s.
The transition from a manual to an automatic measurement device can have an impact on the homogeneity of long time series. In this study, manual and automatic measurements of daily sunshine duration are compared. During summer the differences of the two measurement systems can reach up to 4 h per day, during winter the differences are much smaller. The mean difference is −0.23 h, i.e. the manual measurements are larger than the automatic. The main reason is the overestimation of daily sunshine duration during periods of frequent alternations between sunny and cloudy conditions. The manual instrument tends to an “overburning”, resulting in an overestimation. A linear regression model was developed and applied to adjust the automatic measurements. The predictors are the automatic measurements, the daily number of changes between sunny and cloudy conditions and the day length. After adjusting the automatic measurements, the annual cycle in the differences is strongly reduced, the mean differences are close to zero (0.07 h) and the standard deviation of the differences is smaller (0.64 h).
The disadvantage of this method is, that only automatic measurements can be adjusted. To estimate the daily number of changes between sunny and cloudy periods, the automatic measurements with a higher temporal resolution (ten minutes) are used. Each change in consecutive values represents a change in the sunshine condition. This parameter is required for the model to adjust the data. Therefore only automatic measurements can be adjusted. To estimate the daily number of changes between sunny and cloudy conditions a higher temporal resolutions than the manual (daily) data is necessary. With this model, the “overburning effect” is added to the automatic measurements so that they are more consistent to the manual observations.
For trend analysis long and homogeneous data sets are necessary. Adjustments, as described in this study, can help to ensure the homogeneity of long series. Raw data without adjustments are recommended for case studies on short time periods from days to seasons. The raw automatic measurements are more accurate than adjusted data if there is no change in the measurement technology.
German station data are available via: Climate Data Center – Open Data Server: https://opendata.dwd.de/climate_environment/CDC/observations_germany (Climate Data Center, 2019) or DWD's interactive Climate Data Center portal (see Kaspar et al., 2019).
LH wrote the first draft of the article. The final version was completed by LH, KF, FI, and FK.
The authors declare that they have no conflict of interest.
This article is part of the special issue “18th EMS Annual Meeting: European Conference for Applied Meteorology and Climatology 2018”. It is a result of the EMS Annual Meeting: European Conference for Applied Meteorology and Climatology 2018, Budapest, Hungary, 3–7 September 2018.
We thank the editor and two referees for their helpful comments.
This research was supported by the Deutscher Wetterdienst research program “Innovation in Applied Research and Development” (IAFE).
This paper was edited by Dan Hollis and reviewed by Timothy Legg and one anonymous referee.
Becker, R., Chambers, J., and Wilks, A.: The New S Language. Wadsworth & Brooks/Cole, Computer Science Series, Pacific Grove, CA, 1988. a
Best, D. and Roberts, D.: Algorithm AS 89: the upper tail probabilities of Spearman's rho, J. Roy. Stat. Soc. C-Appl., 24, 377–379, 1975. a
Bider, M.: Über die Genauigkeit der Registrierungen des Sonnenscheinautographen Campbell-Stokes, Arch. Meteor. Geophy. B, 9, 199–230, 1958. a
Brázdil, R., Flocas, A., and Sahsamanoglou, H.: Fluctuation of sunshine duration in central and South-Eastern Europe, Int. J. Climatol., 14, 1017–1034, 1994. a
Cerveny, R. S. and Balling Jr., R. C.: Inhomogeneities in the long-term United States' sunshine record, J. Climate, 3, 1045–1048, 1990. a
Climate Data Center: Open Data Server, available at: https://opendata.dwd.de/climate_environment/CDC/observations_germany, last access: 19 June 2019. a, b
Hollander, M. and Wolfe, D. A.: Nonparametric statistical methods, Wiley New York, NY, USA, 1973. a
Kaspar, F., Hannak, L., and Schreiber, K.-J.: Climate reference stations in Germany: Status, parallel measurements and homogeneity of temperature time series, Adv. Sci. Res., 13, 163–171, https://doi.org/10.5194/asr-13-163-2016, 2016. a, b
Kaspar, F., Kratzenstein, F., and Kaiser-Weiss, A. K.: Interactive open access to climate observations from Germany, Adv. Sci. Res., 16, 75-83, https://doi.org/10.5194/asr-16-75-2019, 2019. a
Kendall, M. G.: A new measure of rank correlation, Biometrika, 30, 81–93, 1938. a
Kendall, M. G.: The treatment of ties in ranking problems, Biometrika, 33, 239–251, 1945. a
Kerr, A. and Tabony, R.: Comparison of sunshine recorded by Campbell–Stokes and automatic sensors, Weather, 59, 90–95, 2004. a, b
Legg, T.: Comparison of daily sunshine duration recorded by Campbell–Stokes and Kipp and Zonen sensors, Weather, 69, 264–267, 2014. a, b
Martinez-Lozano, J., Tena, F., Onrubia, J., and De La Rubia, J.: The historical evolution of the Ångström formula and its modifications: review and bibliography, Agr. Forest Meteorol., 33, 109–128, 1984. a
Matuszko, D.: A comparison of sunshine duration records from the Campbell-Stokes sunshine recorder and CSD3 sunshine duration sensor, Theor. Appl. Climatol., 119, 401–406, 2015. a
Pinker, R., Zhang, B., and Dutton, E.: Do satellites detect trends in surface solar radiation?, Science, 308, 850–854, 2005. a
Power, H.: Trends in solar radiation over Germany and an assessment of the role of aerosols and sunshine duration, Theor. Appl. Climatol., 76, 47–63, 2003. a
Sanchez-Lorenzo, A., Calbó, J., and Martin-Vide, J.: Spatial and temporal trends in sunshine duration over Western Europe (1938–2004), J. Climate, 21, 6089–6098, 2008. a
Sanchez-Lorenzo, A., Calbó, J., Wild, M., Azorin-Molina, C., and Sanchez-Romero, A.: New insights into the history of the Campbell-Stokes sunshine recorder, Weather, 68, 327–331, 2013. a, b
Sanchez-Romero, A., González, J. A., Calbó, J., and Sanchez-Lorenzo, A.: Using digital image processing to characterize the Campbell–Stokes sunshine recorder and to derive high-temporal resolution direct solar irradiance, Atmos. Meas. Tech., 8, 183–194, https://doi.org/10.5194/amt-8-183-2015, 2015. a
Sonntag, D. and Behrens, K.: Ermittlung der Sonnenscheindauer aus pyranometrisch gemessenen Bestrahlungsstärken der Global- und Himmelsstrahlung), Berichte des Deutschen Wetterdienstes, 181, 1992. a
Stanhill, G.: Through a glass brightly: Some new light on the Campbell–Stokes sunshine recorder, Weather, 58, 3–11, 2003. a, b
Stanhill, G.: Global dimming: A new aspect of climate change, Weather, 60, 11–14, 2005. a
Streets, D. G., Wu, Y., and Chin, M.: Two-decadal aerosol trends as a likely explanation of the global dimming/brightening transition, Geophys. Res. Lett., 33, L15806, https://doi.org/10.1029/2006GL026471, 2006. a
Wild, M., Gilgen, H., Roesch, A., Ohmura, A., Long, C. N., Dutton, E. G., Forgan, B., Kallis, A., Russak, V., and Tsvetkov, A.: From dimming to brightening: Decadal changes in solar radiation at Earth's surface, Science, 308, 847–850, 2005. a