 | 30 Oct 2019
User tailored results of a regional climate model ensemble to plan adaption to the changing climate in Germany
Heike Huebener
Klaus Keuler
Christoph Menz
Susanne Pfeifer
Hans Ramthun
Arne Spekat
Christian Steger
Claas Teichmann
Kirsten Warrach-Sagi
In the German regional climate modeling project ReKliEs-De the existing EURO-CORDEX simulations have been systematically complemented by new simulations to derive more robust ranges of possible future climate change. The focus of the project lay on user tailored results, which are required for the planning of measures to adapt to the changing climate. Changes in temperature and precipitation indices are calculated from a multi model ensemble for the end of the 21st century. The results for the mitigation scenario RCP2.6 are compared to the results of the “business as usual” scenario RCP8.5. Averaged over Germany the increase of mean annual temperature and of the number of summer days will be around 3 times higher for RCP8.5 than for RCP2.6. In summer, the increase of dry days could be twice as high in RCP8.5 compared to RCP2.6.
- Article
(1176 KB) - Full-text XML
- BibTeX
- EndNote


High-resolution climate information from a multi model ensemble is required for the development and the planning of measures to adapt to changing climate (e.g. German Adaptation Strategy; Die Bundesregierung, 2008). Assuming different greenhouse gas emission or concentration scenarios, a multi model ensemble and multi downscaling methods are essential to achieve scientifically robust information on possible ranges of future climate change (Giorgi and Gutowski, 2015; Hawkins and Sutton, 2009), which can then be used for climate impact research and as background information for policy and economy.
To achieve this, a set of dynamical and statistical downscaling experiments has been added to the EURO-CORDEX ensemble (Jacob et al., 2013; https://euro-cordex.net/, last access: 22 October 2019) by the German research project ReKliEs-De (Regional Climate change Ensemble simulations for Germany, Hübener et al., 2017a, c). ReKliEs-De contributed with 16 simulations to the EURO-CORDEX ensemble. Altogether 28 Simulations using RCP8.5 and 17 Simulations using RCP2.6 are analyzed from the combined EURO-CORDEX and ReKliEs-De Ensemble. This particular ensemble of RCM simulations has been made publically available at the Earth System Grid Federation (ESGF) in August 2018, at the time this study was finalized.
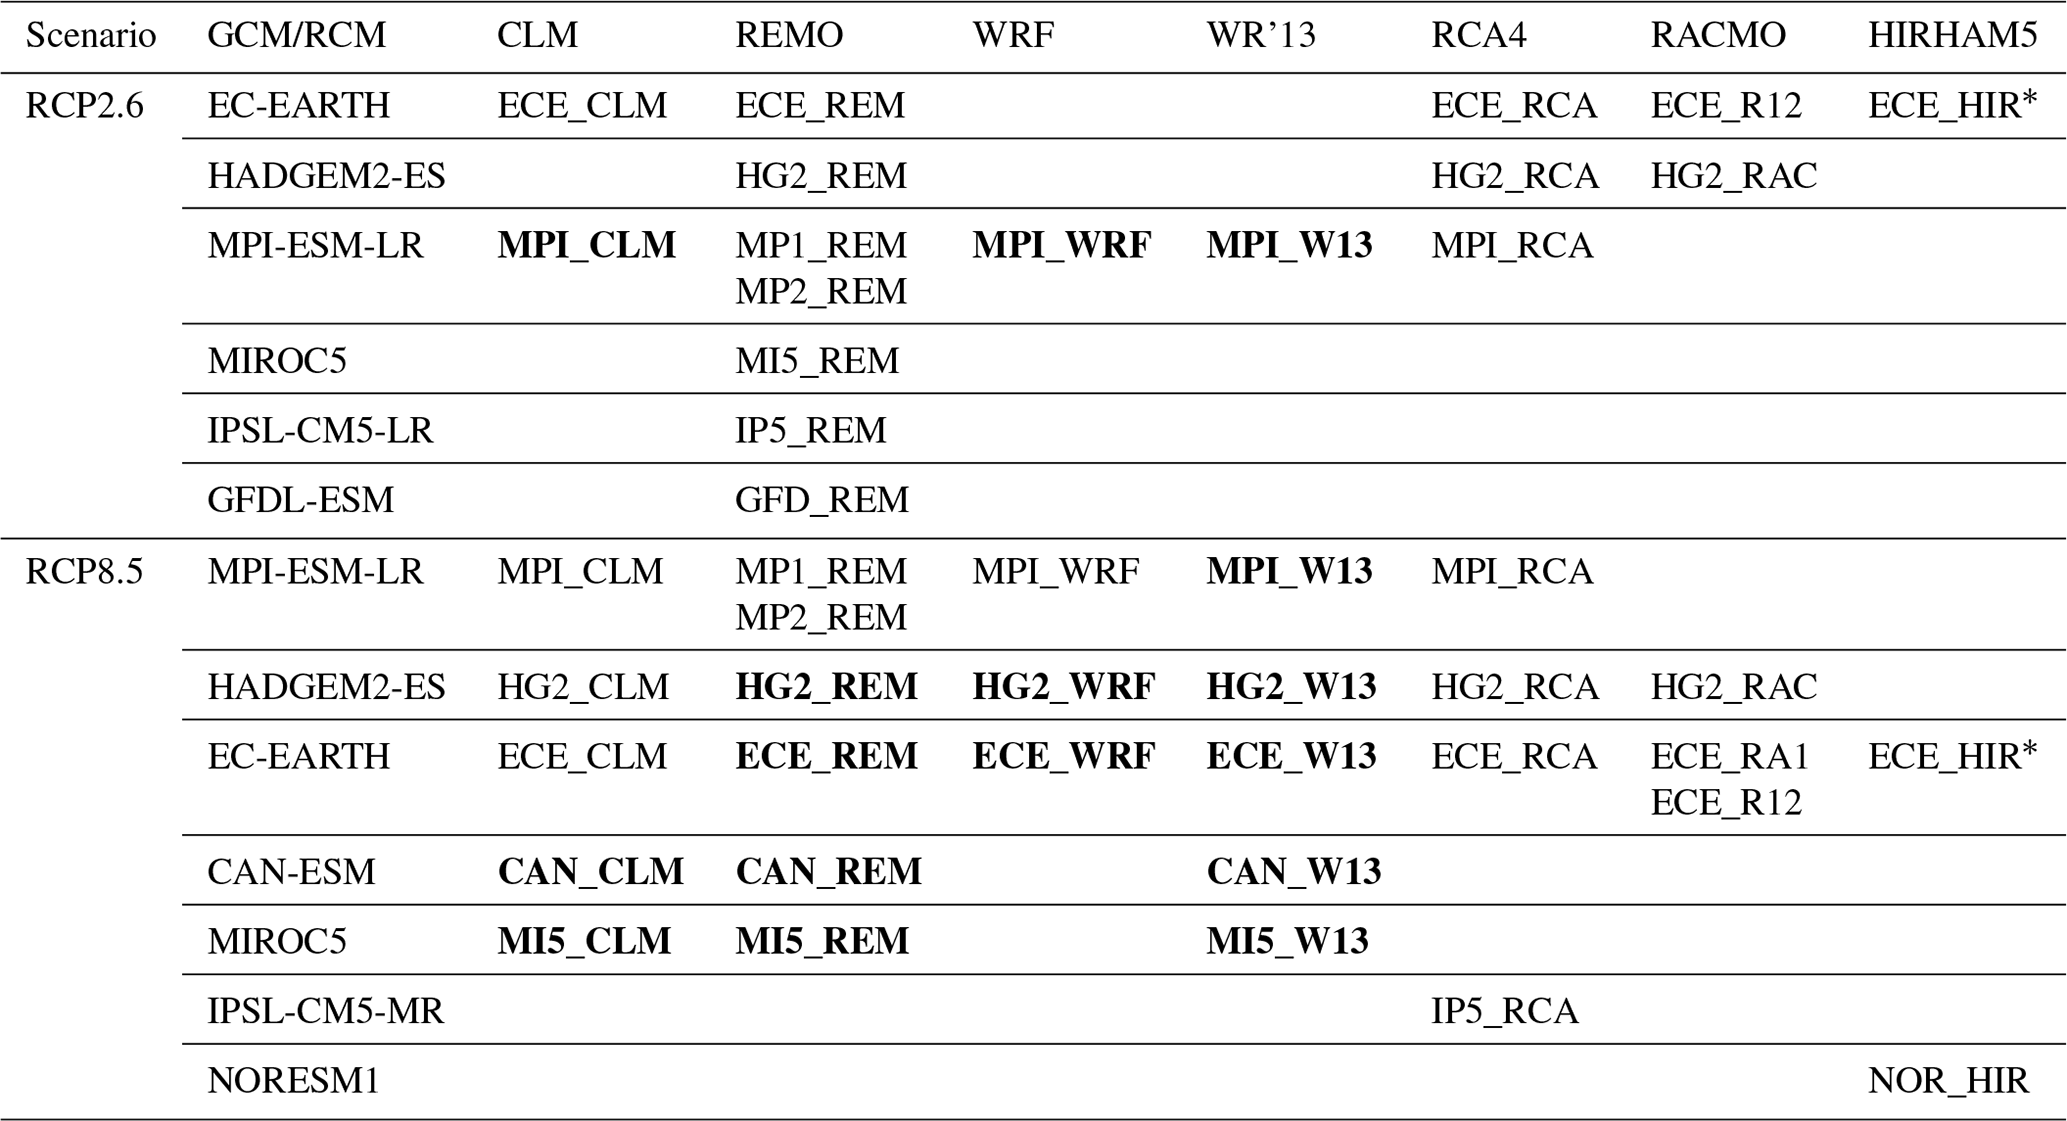
Table 1List of simulations analysed for the two scenarios and abbreviations used in the plots. Simulations performed within ReKliEs-De (bold font), which systematically complement the existing EURO-CORDEX simulation (available in August 2018). Different realisations of the GCM EC-EARTH have been used, most used realisation 12 (ECE), RACMO used realisation 12 (ECE_R12) and 1 (ECE_RA1), HIRHAM used realisation 3 (ECE_HIR∗). REMO used realisation 1 and 2 of MPI-ESM-LR (MP1_REM, MP2_REM).
Methods
The multi model ensemble (Table 1) is a combination of seven global climate models (GCM) (Cattiaux et al., 2013) and eight regional climate models (RCM). Statistical as well as dynamical methods of regional climate modelling are used. The dynamical regional climate models are CLM, HIRHAM5, REMO, RACMO, RCA, WRF. Technical details of these models and their evaluation for current climate are described by Kotlarski et al. (2014). WETTREG2013 (WR'13) (Kreienkamp et al., 2011) and STARS (Orlowsky et al., 2008) are empirical-statistical downscaling (ESD) methods. With WR'13, 10 realizations are produced for each driving GCM and each scenario. In our analysis, we calculated the indices for each of the ten realizations separately and averaged over them to obtain one value for each index, GCM and scenario. The STARS method is suitable for climates that are similar to the current climate, with which the method is trained; it provides limited information on climates that differ strongly from the current climate (e.g. Wechsung and Wechsung, 2014). Thus, we only use STARS simulations in our ensemble until mid-century.
The regional climate simulations cover the time-period 1970 to 2100. The project data are available for the complete modelling period. Selected climate variables and post-processed indices are presented at the project webpage for download. Graphics are available for the historical period (1971–2000) and two future time slices: 2021–2050 and 2071–2100. In this study, we concentrate on the climate change in the last 30 years of the 21st century to quantify the differences in mean and extreme climate quantities between the two scenarios RCP2.6 and RCP8.5, particularly considering the bandwidth of the climate change signals due to the different model performances. Results for the other time slices are available on the project webpage.
The ReKliEs-De project study domain covered Germany and the drainage basins of large rivers flowing into Germany. Extending this domain, the dynamical simulations cover the whole EURO-CORDEX domain. The statistical simulations only cover the ReKliEs-De domain. In this study, we will focus on results for Germany as an example. However, further regional analyses are available at the project webpage, e.g. assessments averaged for each large German river drainage basin.
All simulation results are provided at the ESGF in daily, monthly, seasonal and annual time resolution on the standard EURO-CORDEX grid with 0.11∘ (∼12.5 km) horizontal resolution. Since using single grid cells for analysis could lead to misinterpretations, a general recommendation is to use averages over several grid cells. While this smooths the simulated distributions, it gives more reliable results. Suitable averaging methods are outside the scope of this paper. For finer resolution information, a further downscaling step, using e.g. urban models, would improve these results (Daniel et al., 2019).
Some of the groups can additionally provide hourly data. Users requiring hourly data should therefor contact the modelling groups directly. However, as with the spatial resolution, the temporal averaging to daily or monthly data improves the reliability of the results.
An assessment of data and information needs of users from all sectors was undertaken during an early project stage (Bülow et al., 2016) and adjusted at the midterm workshop (Huebener et al., 2017b), which formed the basis of the user tailoring of the project results. The users of the project results that were present at the midterm workshop are mainly hydrological modellers, forest researchers, viticulture and agricultural researchers, political advisors at federal states (federal and state environmental agencies, federal forest agencies, geological services, etc.) and city planners for water infrastructure. One outcome of the ReKliEs-de project is a user-guide supporting the users in interpreting the climate model ensemble results (Hübener et al., 2017c). The assessment and the user workshop further revealed a great demand for climate indices for Germany. Therefore, 24 climate indices (defined in Sillmann et al., 2013a, b) have been selected, calculated, analysed, and provided as graphics at the ReKliEs-De project webpage. The post-processed indices are provided at the same spatial and temporal resolution as the original model output data, i.e. for 12.5 km grid-boxes.
The users need free access to the data of climate simulations and the climate indices, therefore both are made available for downloading from ESGF and the project webpage. When asked at the project workshop for their preference of graphical preparation, several users preferred histograms (see example for precipitation change in Fig. 5).
In many cases, impact modellers do not have the computer facilities to run their impact model using the whole ensemble of regional climate models as boundary forcing. Therefore, in ReKliEs-De a test was run to determine the necessary ensemble size to represent the full bandwidth of results by randomly picking simulations. The results differed for the variables: fewer simulations were sufficient to cover the mean temperature change signal than were needed to cover the bandwidth of precipitation and even more for extreme events like heat days. The method is described in chap. 5 in Hübener et al. (2017c). Another method has been developed by Dalelane et al. (2018). A so-called “core ensemble” using the method by Dalelane et al. (2018), was agreed upon by a group of users from German environmental agencies; it is documented at the German Weather Service web page (German Weather Service, 2019).
The mean annual temperature and precipitation signals are averaged over Germany for each single RCM projection. The climate change signal is calculated as difference between the time-periods 2071–2100 and 1971–2000. Figure 1 reveals a temperature increase for all simulation for both RCPs. For RCP2.6, the bandwidth of temperature change is +0.5 to +2 K. It is larger for RCP8.5 (+2.8 to +5.2 K). The mean annual precipitation change lies between −10 % to +8 % for RCP2.6 and between −10 % to +18 % for RCP8.5 (Table 2). Figure 1 shows, that simulations driven by the same GCM (as indicated by the same colour) display similar mean temperature change signals (e.g. simulations driven by the GCM MPI-ESM-LR in the red symbols show smaller warming than simulations driven by the GCM HadGEM2-ES in the yellow symbols). This implies that the lateral forcing of the GCM seems to have a large impact on the mean temperature evolution within the RCM domain. However, precipitation changes seem to be stronger tied to the RCM method used for downscaling, as indicated by the different symbols (e.g. WR'13 simulations displayed as circles show on average small changes or even precipitation reduction while REMO simulations displayed as top pointing triangles show on average precipitation increases). This implies that the methods and parameterizations used by the different RCMs are a dominating factor in the precipitation response.
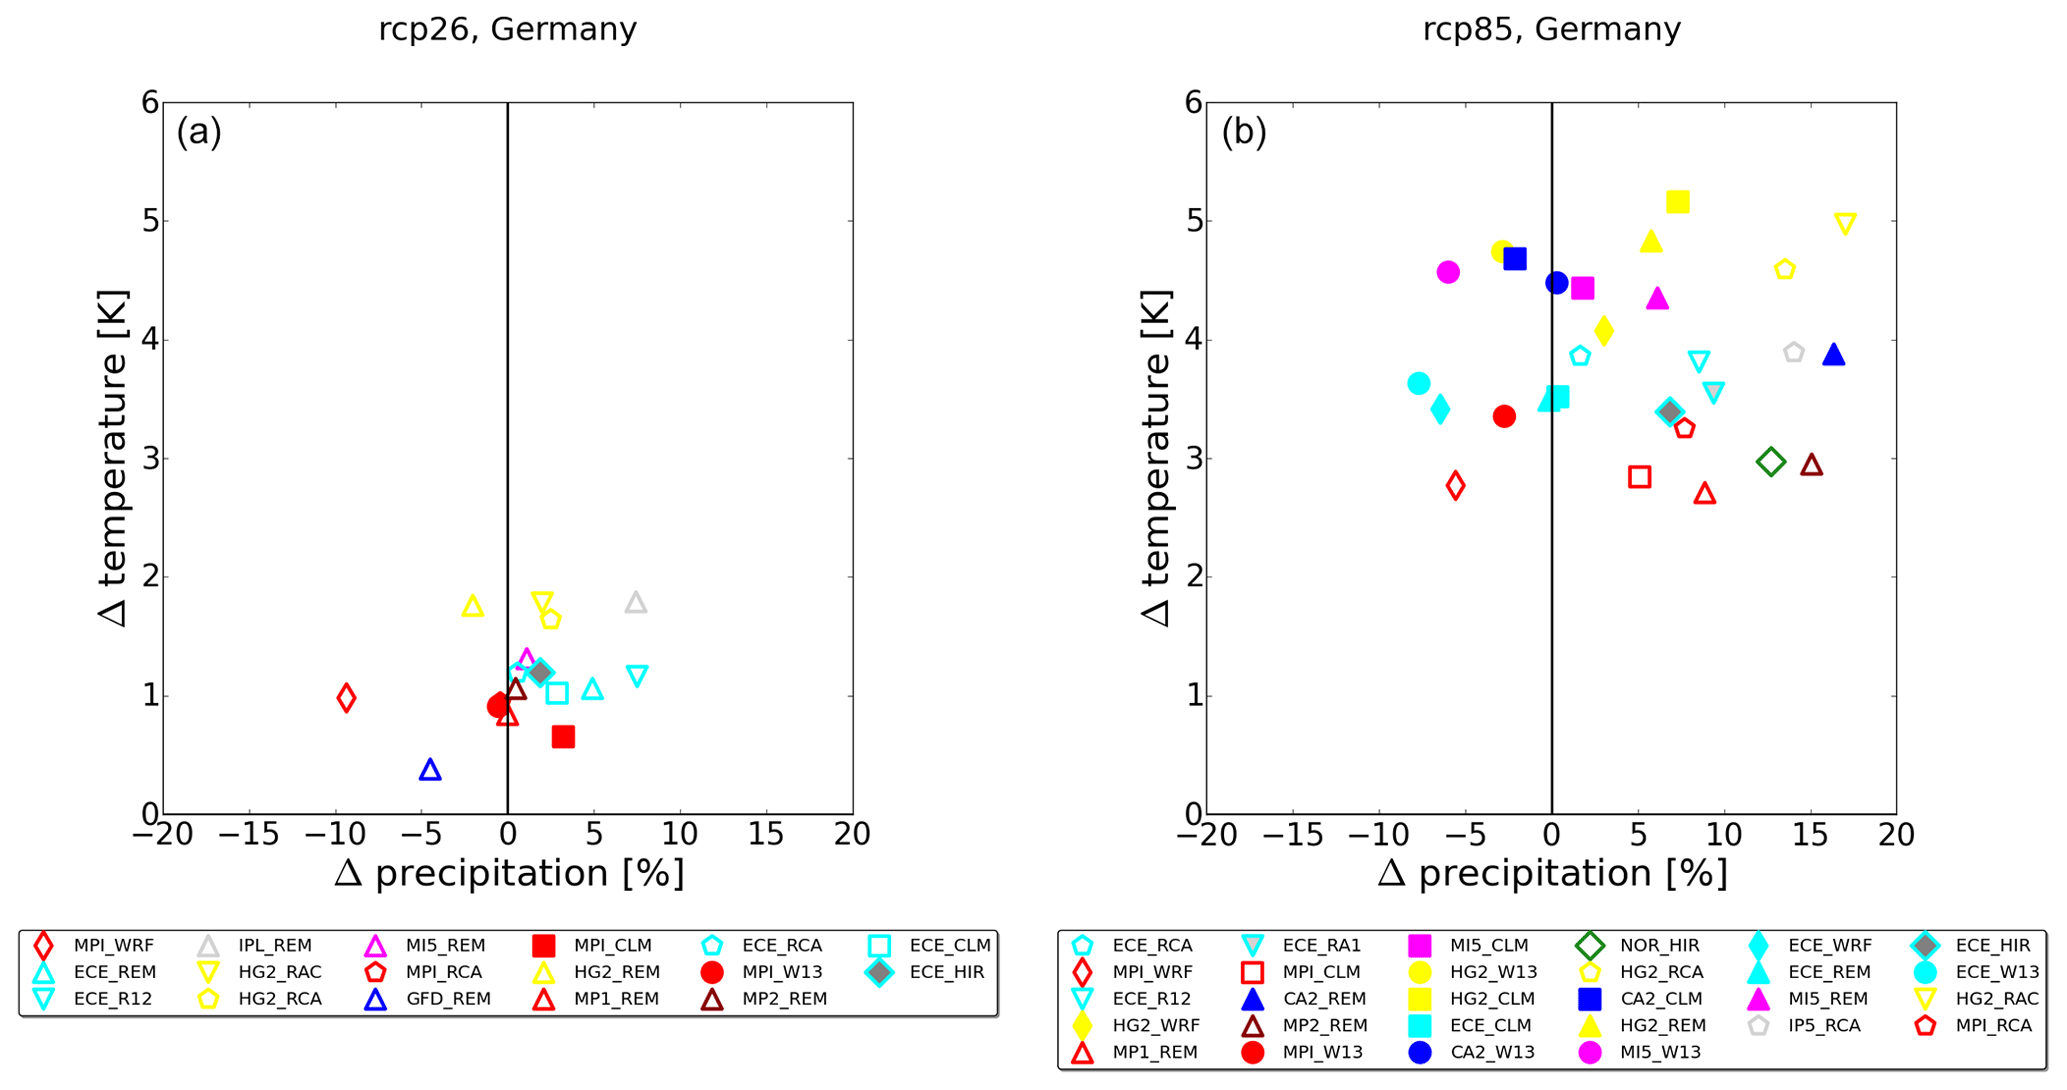
Figure 1The mean annual change between 2071–2100 and 1971–2000 for temperature and precipitation of each model averaged over Germany (RCP2.6: a, RCP8.5: b). The colour indicates the forcing GCM and each RCM has its specific symbol.
Table 2The range of change for selected climate indices for RCP2.6 and RCP8.5 for Germany. Note that ensemble size and ensemble members differ between RCP2.6 and RCP8.5 ensembles (see Table 1).
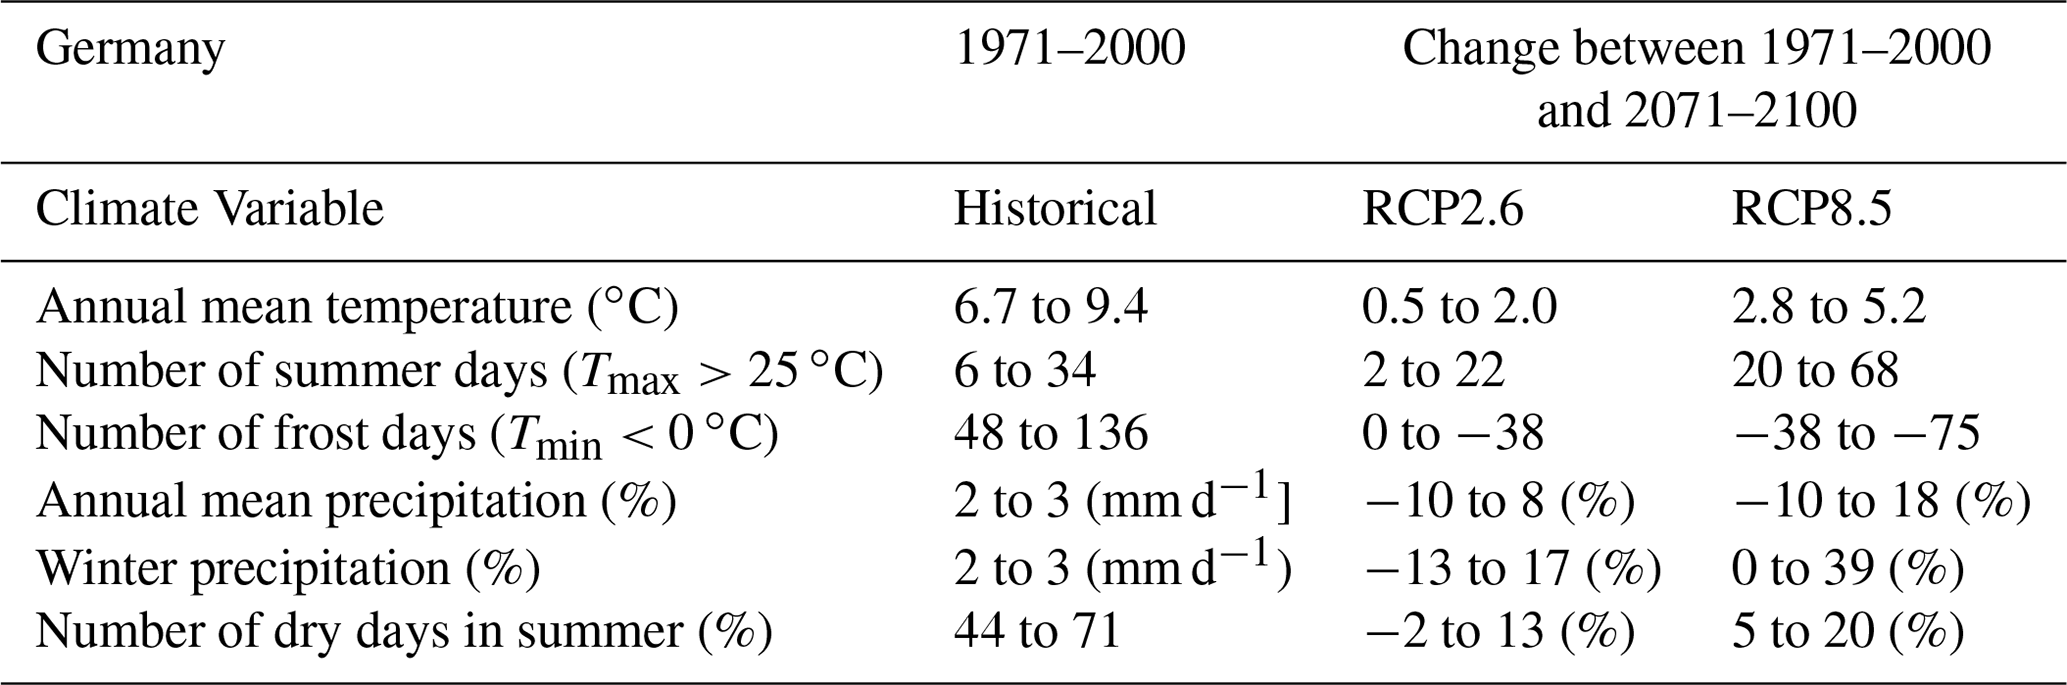
Figure 2 illustrates the horizontal distribution of the median of the RCP8.5 ensemble for annual mean temperature and mean winter as well as summer precipitation for the historical period 1971–2000. The median of their future change in 2071–2000 is displayed for the RCP2.6 and RC.8.5 ensemble. The median is calculated for each grid box. For the RCP2.6 ensemble, the horizontal distribution of the median for annual mean temperature change in 2071–2000 compared to 1971–2000 is quite homogeneous, with 1.5 K and slightly higher values in the east, while it is around 3 K for the RCP8.5. The median of the precipitation change is more heterogeneous. The median of the RCP2.6 ensemble shows a decrease in southwest Germany between −10 % and −20 % in summer and winter and only little changes elsewhere. The median of the precipitation change of the RCP8.5 depicts a precipitation increase in winter between 10 % and 40 % and a precipitation decrease in summer between −20 % and −30 % in most of Germany.
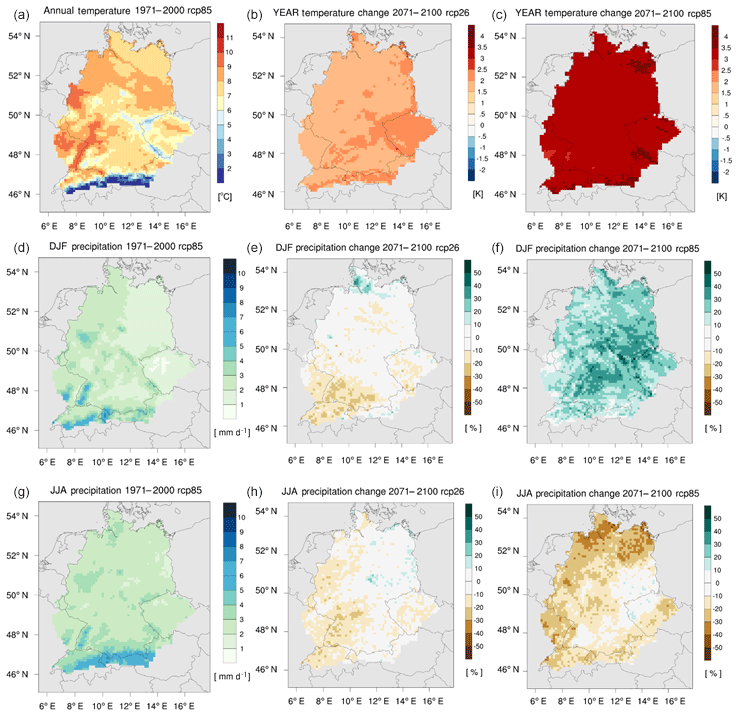
Figure 2The first column (a, d, g) shows the median of the RCP8.5 ensemble for the time period 1971–2000 and from top to bottom for mean annual temperature (∘C, a–c), precipitation for winter (DJF, d–f) and summer (JJA, mm d−1). The second column (b, e, h) depicts the median of the difference between 2071–2100 and the control period 1971–2000 for the ensemble of RCP2.6 and the third column (c, f, i) for RCP8.5. The median is calculated for each single grid box of the ensemble of change per simulation. The median for the control period 1971–2000 of the RCP2.6 ensemble exhibits only small differences when compared to the ensemble of RCP8.5. Since ensemble size and members differ, we refrain from analyzing the differences in detail.
2.1 Temperature indices
The change in frost days ( ∘C) and summer days ( ∘C) is depicted as 30-year “running mean” for 1986–2085 relative to the mean of 1971–2000 in Figs. 3 and 4. Again, the different driving GCMs can be inferred from the colour of the lines, while the RCMs used for downscaling are indicated by the line types.
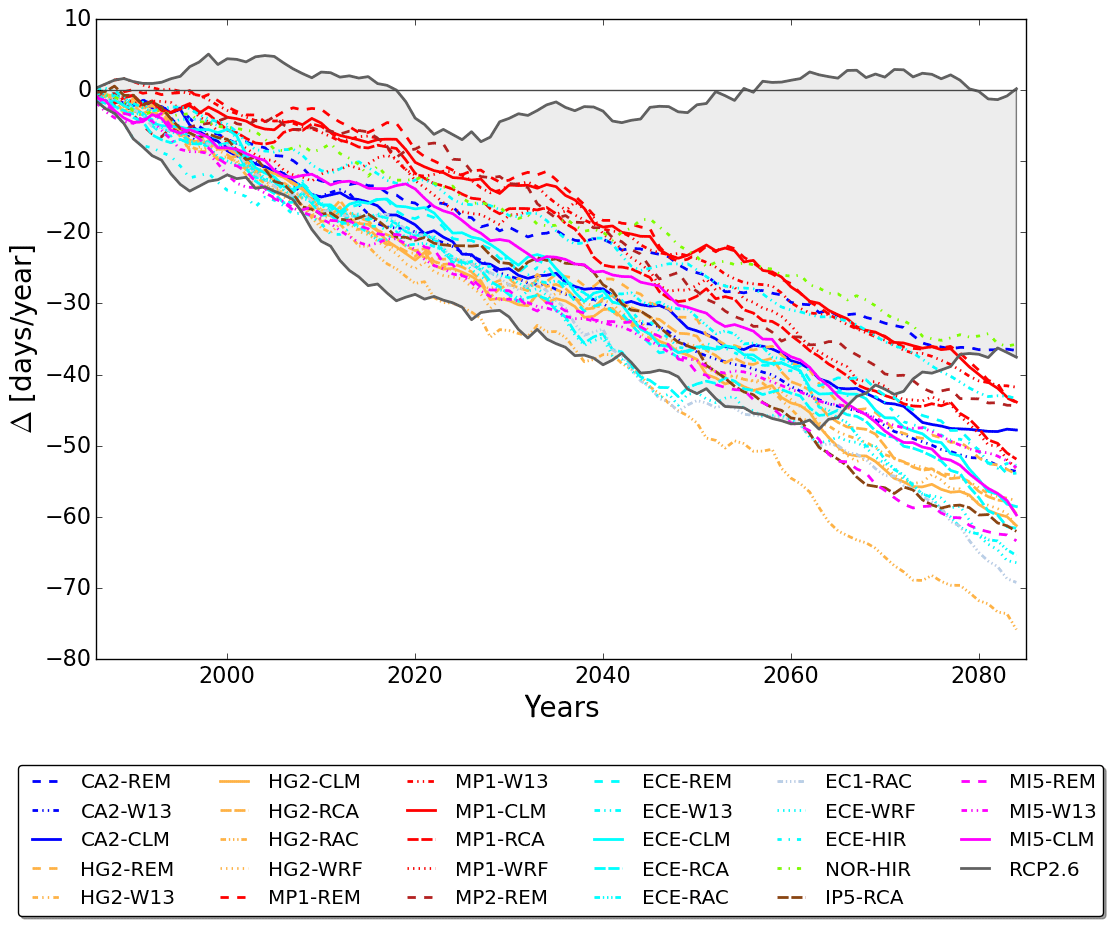
Figure 3Change in number of frost days ( ∘C): The 30-year “running mean” 1986–2085 minus 1971–2000. The bandwidth between minimum and maximum change of the number of frost days is shown for RCP2.6 simulations in grey shading, the coloured lines show the changes calculated by simulations using RCP8.5.

Figure 4Change in number of summer days ( ∘C): The 30-year “running mean” 1986–2085 minus 1971–2000. The bandwidth between minimum and maximum change of the number of summer days is shown for RCP2.6 simulations in grey shading, the coloured lines show the changes calculated by simulations using RCP8.5.
All simulations show a decrease in frost days (Fig. 3). While until mid-century, the bandwidth of the two scenarios overlap, at the end of the century the reductions are considerably stronger for RCP8.5 (−38 to −75 d) than for RCP2.6 (0 to −38 d).
All simulations show an increase in summer days (Fig. 4). In this case, the bandwidth simulated for the two scenarios diverges earlier: some simulations show strong increases in the number of summer days from the start of the simulation in RCP8.5, while for RCP2.6 some simulations show only small change during this time. The bandwidth at the end of the century lies between +2 and +22 d for RCP2.6 and between +20 and +68 d in RCP8.5. The bandwidth of the change of summer days in RCP2.6 seems to stabilize from the mid-century onwards, whereas it continues to increase with time in the RCP8.5 scenario.
Figures 3 and 4 additionally show that change signals in selected threshold exceedances (like frost days or summer days) may not display the exact same characteristics as mean values: the distribution of the GCMs is less obvious than in Fig. 1. Furthermore, WR'13 seems to simulate the strongest reductions in frost days as well as (some of) the strongest increases in summer days. This shows, that when considering extremes or threshold exceedances, different downscaling methods can significantly impact the simulation results not only for precipitation (as shown in Fig. 1), but also for temperature indices.
2.2 Precipitation indices
The annual mean precipitation change signal (Fig. 1) is small in both scenarios and shows no clear trend in direction (increase or decrease). Looking at the seasonal winter (December, January, February) precipitation change in 2070–2099 compared to 1971–2000 averaged over Germany (Fig. 5), we identify a clear change signal for RCP8.5: all simulations (except one) show a precipitation increase between +0 % to +39 %, which is significant (darker blue) for most simulations. The changes for RCP2.6 are smaller and point in both directions with values ranging between −13 % to +17 %.
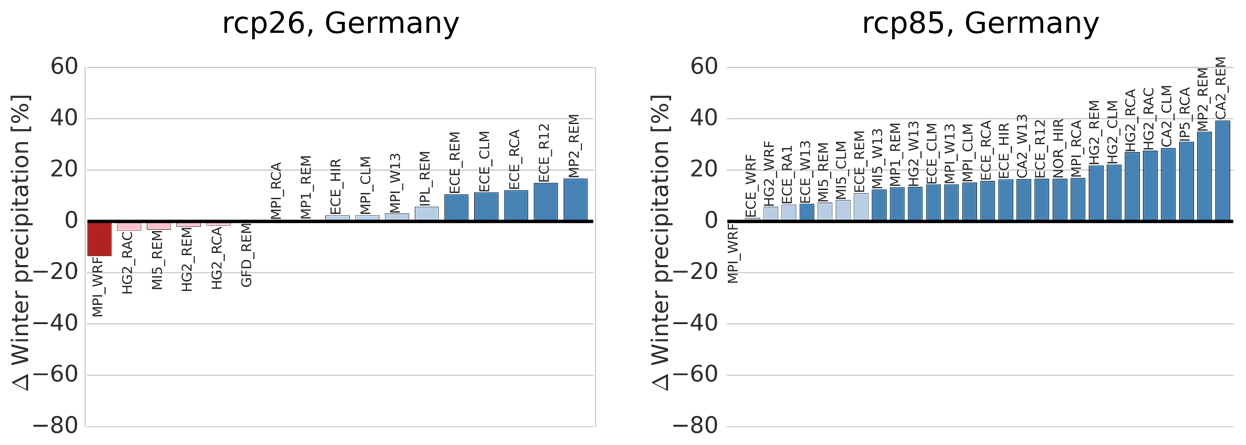
Figure 5The mean winter precipitation change between 2070–2099 and 1971–2000 averaged over Germany. Precipitation increase in blue and significant increase is dark blue. Precipitation decrease in red and significant decrease is dark red. The Mann-Whitney-U Test is used to test the significance.
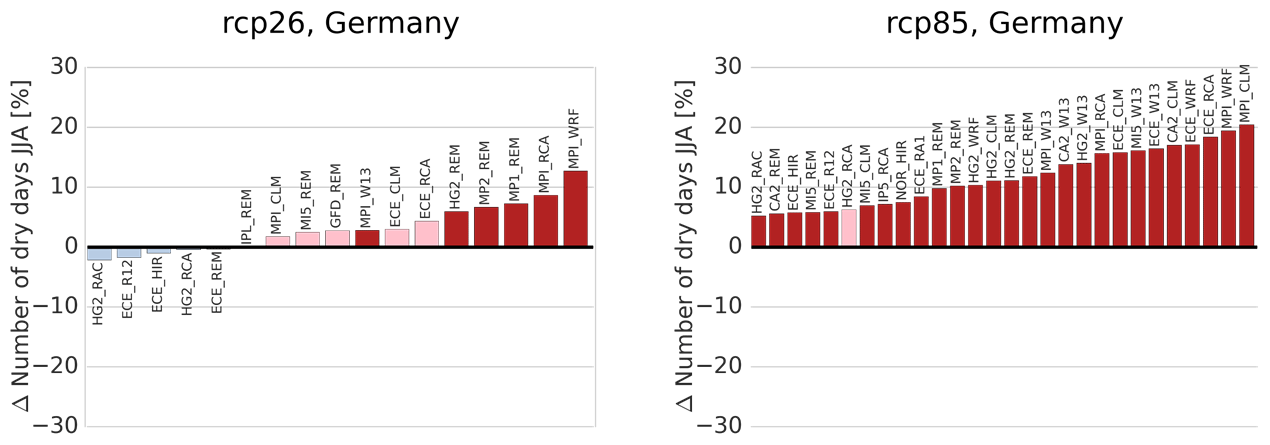
Figure 6The mean change in dry days during summer between 2070–2099 and 1971–2000 averaged over Germany. Increase in dry days in red and significant increase is dark red. Decrease is blue. The Mann-Whitney-U Test is used to test the significance.
Figure 6 shows the simulated change signals in the number of dry days (daily precipitation sum <1 mm d−1) during summer (June, July, August). In RCP8.5 the change signals are positive in all simulations (+5 % to +20 %), which means on average an increase of a few dry days up to a month per summer. All simulations except one show a robust increase. No clear change signal can be detected for RCP2.6. Here the changes are smaller and point in both directions with values ranging between −2 % to +12 % (Fig. 6).
The project ReKliEs-De provides a dataset for adaptation planning for Germany and the catchments of large rivers draining into Germany. The dataset is unique in that it comprises a very large number of very high-resolution simulations for the highest and lowest RCP-scenarios. In addition to providing the direct model output, large efforts were dedicated to post-processing the data and a number of climatic indices for direct use by impact researchers. The extensiveness of the database and the user-oriented post-processing make it an easy-to-use information pool for policy advisory and adaptation planning.
The analysis of these data show that if we carry on with “business as usual” (represented by RCP8.5), the increase of mean annual temperature and of the number of summer days averaged over Germany will be around 3 times higher than in the mitigation scenario (represented by RCP2.6) at the end of the 21st century. This information could be relevant for policy advisory and/or adaptation planning, particularly in cities, where the urban heat island effect will further increase the warming. The ReKliEs-De simulations show only small urban heat island effects in the daily temperature and humidity fields due to the resolution of 12 km.
On the other hand, the decrease of frost days would be at least twice as strong in the “business as usual” scenario compared to the mitigation scenario. This information could be relevant e.g. for the forestry sector, where frost days are needed to haul wood without compacting the soil, for increases in the risk of vector-borne diseases and parasite infestation in agriculture, which are more likely in the absence of frost days, or for road maintenance.
When focusing on precipitation, we confirm earlier findings of mean winter precipitation increase, particularly for the “business as usual” scenario. In the “mitigation” scenario, precipitation changes in winter are small and mostly not significant. For summer, the increase in the number of dry days could be twice as high in the “business as usual” scenario compared to the “mitigation” scenario. In conjunction with the rising summer temperatures, this information could be relevant for urban green space planning, agriculture and forestry or for water management in general.
For temperature as well as for precipitation changes, the results show that average (annual or seasonal) change signals do not exactly scale with changes in extremes or in threshold exceedance indices. It is therefore important to provide not only raw model data output to the users but also post-processed indices of relevance for the respective sector of decision-making or adaptation planning.
To prepare for the changing climate, decision makers have to consider the range between minimum and maximum change in their strategy. For some users, the information on the range of possible mean precipitation decrease to increase in the future might be useless. In these cases, individually adapted indices could help to narrow the uncertainty of future precipitation change. For example, if the supply of drinking water for a community relies on winter precipitation above a certain threshold in a particular drainage basin, this index could be defined and calculated for the ensemble of climate projections. The same could be done for a question depending on any climate variable (e.g. temperature) or a combination of climate variables.
It is important to keep in mind that these results (Table 2) are valid for this specific set of simulations. There is still an uncertainty in the range of change (McSweeney et al., 2012, 2015), because it could enlarge by adding more simulations. New simulations are continuously becoming available and the findings of this study can therefore be improved and updated in the future.
The EURO-CORDEX data is documented on the web page https://euro-cordex.net/ (last access: 22 October 2019), the ReKliEs-De data is documented (in German) on the web page http://reklies.hlnug.de/home.html (last access: 22 October 2019). All simulations used in this paper are available at the Earth System Grid Federation (ESGF) e.g. https://esgf-data.dkrz.de/projects/esgf-dkrz/ (last access: 22 October 2019). Post-processed climate indices, calculated within ReKliEs-De and their plots are available at: https://swift.dkrz.de/v1/dkrz_a88e3fa5289d4987b4d3b1530c9feb13/ReKliEs-De/Internet-ReKliEs-De/startseite.html (last access: 22 October 2019). Data averaged over Germany for the plots: https://doi.org/10.6084/m9.figshare.7599749, https://doi.org/10.6084/m9.figshare.7599746, https://doi.org/10.6084/m9.figshare.7599809, https://doi.org/10.6084/m9.figshare.7599821, https://doi.org/10.6084/m9.figshare.7599830 and data of the median: https://doi.org/10.6084/m9.figshare.9730163.v1 (Bülow, 2019a, b, c, d, e, f).
KB prepared the manuscript with major contributions of HH, further contributions of KK, CT. KB and CT performed the REMO Simulations, KK and CS performed the CLM Simulations, KWS performed the WRF Simulation, AS performed the WETTREG Simulations. KB, KK, CM, CS calculated the climate indices. KB and SP performed the precipitations analysis. HR contributed by storing and providing the simulation results on the project webpage and ESGF. All authors contributed to the project results.
The authors declare that they have no conflict of interest.
This article is part of the special issue “18th EMS Annual Meeting: European Conference for Applied Meteorology and Climatology 2018”. It is a result of the EMS Annual Meeting: European Conference for Applied Meteorology and Climatology 2018, Budapest, Hungary, 3–7 September 2018.
The authors wish to thank the German Federal Ministry of Education and Research, which funded the ReKliEs-De project under the grant no. 01LK1401. We thank the EURO-CORDEX consortium and the climate modelling groups for producing and making their model output available.
This research has been supported by the German Federal Ministry of Education and Research (grant no. 01LK1401).
The article processing charges for this open-access
publication were covered by a Research
Centre of the Helmholtz Association.
This paper was edited by Andreas Fischer and reviewed by Frank Baese and two anonymous referees.
Bülow, K.: Winter Precipitation, figshare, https://doi.org/10.6084/m9.figshare.7599749, 2019a.
Bülow, K.: Dry days, figshare, https://doi.org/10.6084/m9.figshare.7599746, 2019b.
Bülow, K.: Scatter plots, figshare, https://doi.org/10.6084/m9.figshare.7599809, 2019c.
Bülow, K.: Frostdays, figshare, https://doi.org/10.6084/m9.figshare.7599821, 2019d.
Bülow, K.: Summerdays, figshare, https://doi.org/10.6084/m9.figshare.7599830, 2019e.
Bülow, K.: Median of temperature and precipitation, figshare, https://doi.org/10.6084/m9.figshare.9730163.v1, 2019f.
Bülow, K., Hänsler, A., and Jacob, D.: Feststellung der Nutzerbedarfe, Bericht zu Arbeitspaket 2, available at: http://reklies.hlnug.de/fileadmin/tmpl/reklies/dokumente/arbeitspakete/ReKliEs-Bericht-AP2.pdf (last access: 22 October 2019), 2016.
Cattiaux, J. Douville, H., and Peings, Y.: European temperatures in CMIP5: origins of present-day biases and future uncertainties, Clim. Dynam., 41, 2889–2907, https://doi.org/10.1007/s00382-013-1731-y, 2013.
Dalelane, C., Früh, B., Steger, C., and Walter, A.: A pragmatic approach to build a reduced regional climate projection ensemble for Germany using the EURO-CORDEX 8.5 ensemble, J. Appl. Meteorol. Clim., 57, 477–491, https://doi.org/10.1175/JAMC-D-17-0141.1, 2018.
Daniel, M., Lemonsu, A., Déqué, M., Somot, S., Alias, A., and Masson, V.: Benefits of explicit urban parameterization in regional climate modeling to study climate and city interactions, Clim. Dynam., 52, 2745–2764, https://doi.org/10.1007/s00382-018-4289-x, 2019.
Die Bundesregierung: Deutsche Anpassungsstrategie an den Klimawandel, available at: https://www.bmu.de/fileadmin/bmu-import/files/pdfs/allgemein/application/pdf/das_gesamt_bf.pdf (last access: 22 October 2019), 2008 (in German).
German Weather Service: https://www.dwd.de/DE/klimaumwelt/klimaforschung/klimaprojektionen/fuer_deutschland/liste-klimaprojektionen.html?nn=581868, last access: 27 August 2019.
Giorgi, F. and Gutowski, W. J.: Regional Dynamical Downscaling and the Cordex Initiative, Annu. Rev. Env. Resour., 40, 467–490, https://doi.org/10.1146/annurev-environ-102014-021217, 2015.
Hawkins, E. and Sutton, R.: The Potential to Narrow Uncertainty in Regional Climate Predictions, B. Am. Meteorol. Soc., 90, 1095–1108, https://doi.org/10.1175/2009bams2607.1, 2009.
Hübener, H., Bülow, K., Fooken, C., Früh, B., Hoffmann, P., Höpp, S., Keuler, K., Menz, C., Mohr, V., K.Radtke, Ramthun, H., Spekat, A., Steger, C., Toussaint, F., Warrach-Sagi, K., and Woldt, M.: ReKliEs-De Ergebnisbericht, Tech. rep., Hessian Agency for Nature, Environment and Geology (HLNUG), available at: http://reklies.hlnug.de/fileadmin/tmpl/reklies/dokumente/ReKliEs-De-Ergebnisbericht.pdf (last access: 22 October 2019), 2017a (in German).
Huebener, H., Hoffmann, P., Keuler, K., Pfeifer, S., Ramthun, H., Spekat, A., Steger, C., and Warrach-Sagi, K.: Deriving user-informed climate information from climate model ensemble results, Adv. Sci. Res., 14, 261–269, https://doi.org/10.5194/asr-14-261-2017, 2017b.
Hübener, H., Spekat, A., Bülow, K., Früh, B., Keuler, K., Menz, C., Radtke, K., Ramthun, H., Rathmann, T., Steger, C., Toussaint, F., and Warrach-Sagi, K.: ReKliEs-De Nutzerhandbuch, 107, available at: http://reklies.hlnug.de/fileadmin/tmpl/reklies/dokumente/ReKliEs-De-Nutzerhandbuch.pdf (last access: 22 October 2019), 2017c (in German).
Jacob, D., Petersen, J., Eggert, B., Alias, A., Bøssing Christensen, O., Bouwer, L., Braun, A., Colette, A., Déqué, M., Georgievski, G., Georgopoulou, E., Gobiet, A., Menut, L., Nikulin, G., Haensler, A., Hempelmann, N., Jones, C., Keuler, K., Kovats, S., Kröner, N., Kotlarski, S., Kriegsmann, A., Martin, E., van Meijgaard, E., Moseley, C., Pfeifer, S., Preuschmann, S., Radermacher, C., Radtke, K., Rechid, D., Rounsevell, M., Samuelsson, P., Somot, S., Soussana, J.-F., Teichmann, C., Valentini, R., Vautard, R., Weber, B., and Yiou, P.: EURO-CORDEX: new high-resolution climate change projections for European impact research, Reg. Environ. Change, 14, 563–578, https://doi.org/10.1007/s10113-013-0499-2, 2013.
Kotlarski, S., Keuler, K., Christensen, O. B., Colette, A., Déqué, M., Gobiet, A., Goergen, K., Jacob, D., Lüthi, D., van Meijgaard, E., Nikulin, G., Schär, C., Teichmann, C., Vautard, R., Warrach-Sagi, K., and Wulfmeyer, V.: Regional climate modeling on European scales: a joint standard evaluation of the EURO-CORDEX RCM ensemble, Geosci. Model Dev., 7, 1297–1333, https://doi.org/10.5194/gmd-7-1297-2014, 2014.
Kreienkamp, F., Spekat, A., and Enke, W.: Ergebnisse regionaler Szenarienläufe für Deutschland mit der statistischen Methode WETTREG auf der Basis der SRES Szenarios A2 und B1 modelliert mit ECHAM5/MPI-OM, Climate Service Center Hamburg, Report 2, available at: http://epub.sub.uni-hamburg.de/epub/volltexte/2013/23960/pdf/csc_report2.pdf (last access: 22 October 2019), 2011.
McSweeney, C. F., Jones, R. G., and Booth, B. B. B.: Selecting ensemble members to provide regional climate change information, J. Climate, 25, 7100–7121, https://doi.org/10.1175/JCLI-D-11-00526.1, 2012.
McSweeney, C. F., Jones, R. G., Lee, R. W., and Rowell, D. P.: Selecting CMIP5 GCMs for downscaling over multiple regions, Clim. Dynam., 44, 3237–3260, https://doi.org/10.1007/s00382-014-2418-8, 2015.
Orlowsky, B., Gerstengarbe, F. W., and Werner, P. C.: A resampling scheme for regional climate simulations and its performance compared to a dynamical RCM, Theor. Appl. Climatol., 92, 209–223, https://doi.org/10.1007/s00704-007-0352-y, 2008.
Sillmann, J., Kharin, V. V., Zhang, X., Zwiers, F. W., and Bronaugh, D.: Climate extremes indices in the CMIP5 multimodel ensemble: Part 1. Model evaluation in the present climate, J. Geophys. Res.-Atmos., 118, 1716–1733, https://doi.org/10.1002/jgrd.50203, 2013a.
Sillmann, J., Kharin, V. V., Zwiers, F. W., Zhang, X., and Bronaugh, D.: Climate extremes indices in the CMIP5 multimodel ensemble: Part 2. Future climate projections, J. Geophys. Res.-Atmos., 118, 2473–2493, https://doi.org/10.1002/jgrd.50188, 2013b.
Wechsung, F. and Wechsung, M.: Dryer years and brighter sky – the predictable simulation outcomes for Germany's warmer climate from the weather resampling model STARS, Int. J. Climatol., 35, 3691–3700, https://doi.org/10.1002/joc.4220, 2014.