 | 16 Apr 2019
A meandering polar jet caused the development of a Saharan cyclone and the transport of dust toward Greenland
Clare Eayrs
Jean-Pierre Chaboureau
Thomas Mote
David M. Holland
In this study, we identify a new mechanism by which dust aerosols travel over long distances across the eastern side of the North Atlantic Ocean toward the Arctic. The meandering polar jet was at the origin of both dust emission through cyclogenesis over Northwest Africa and poleward transport of the uplifted dust towards the Arctic, through cut-off circulation. The dust emission was associated with an intense Saharan cyclone that formed over Northwest Africa in early April 2011. The formation of the cyclone was caused by the intrusion into subtropics, of a high-latitude-upper-level trough, linked to the meandering polar jet. The trough initiated cyclogenesis over Northwest Africa after orographic blocking by the Anti-Atlas Mountains. The still meandering polar jet led to the formation of a cut-off low further south with which the Saharan dust-cyclone merged 2 d later and moved northward with the main stream. Beside satellite observations, a simulation at high resolution was performed using the prognostic-dust permitting model MesoNH. The total dust load carried during this event to areas located north of 40∘ N was estimated by the model to be 38 Tg and dust deposition was estimated to be 1.3 Tg. The Saharan dust reaching Greenland was accompanied by warm and moist air masses that caused a rise in surface temperature of about 10 ∘C for more than 3 consecutive days over the southeastern Greenland. Ice melt over this area of Greenland was detected in the brightness temperature observations.
- Article
(6676 KB) - Full-text XML
- BibTeX
- EndNote


The Arctic has warmed by more than 1 ∘C over the last century, a rate almost twice the global average (Richter-Menge et al., 2017). At the same time, the sea ice cover has decreased rapidly (Meier et al., 2014). Global climate models (GCMs) have difficulty reproducing the observed Arctic warming (Shindell and Faluvegi, 2009) and the rate of observed Arctic sea ice loss (Stroeve et al., 2006). Recent studies suggest that GCM simulations of Arctic warming can be improved by better accounting for aerosols radiative forcing (Bintanja and Krikken, 2016).
Through direct (including the surface albedo effect) and indirect forcing, aerosols in the Arctic can affect the main components of the atmosphere and cryosphere such as aerosol-induced changes in clouds, precipitation, sea-ice and land snow cover and hence play an important role in the Arctic climate system (e.g. Gutman and Reissell, 2011). Deposition of absorbing aerosols to the snowpack or ice reduces surface albedo and accelerates snow melt (Box et al., 2012; Tedesco et al., 2014; Kylling et al., 2018). An important contribution to Arctic aerosol loads comes from mineral dust and it has been suggested that dust contributes to the Arctic amplification (Lambert et al., 2013; Ryan et al., 2018). In spring, the observed concentrations of aerosols at Arctic surface stations reach their maximum (Stohl, 2006; Breider et al., 2014). This spring peak phenomenon extends to the entire Arctic and to all altitudes and it is commonly called “Arctic haze”. Dust concentrations during Arctic haze are generally an order of magnitude higher than during summer (Quinn et al., 2007). Groot Zwaaftink et al. (2016) showed that dust loads are largest in spring when remote dust originating from Africa and Asia is efficiently transported into the Arctic, whereas the contribution of local sources is more important during fall. The relative contribution of the Sahara and the Asian deserts (Taklamakan and Gobi) was evaluated by Breider et al. (2014) using two sensitivity simulations with dust emissions from these regions independently switched off. The results of this study showed that, on an annual basis, the Sahara is responsible for 65 % of the total dust load in the Arctic and that, particularly during spring, mineral dust has a dominant Saharan source. They estimated 60 % of Arctic dust in spring from the Sahara, 22 % from the Taklamakan and Gobi deserts, and 18 % from other deserts.
Although Saharan dust aerosols seem to play an important role in the functioning of the Arctic system, there have been very few comprehensive studies performed to date to establish the linkages between sources, transport and spatial distributions of Saharan mineral dust in the Arctic. The magnitude of the influence in the Arctic of the Sahara – the world's most important dust source area – is still to be evaluated. For Saharan dust emission, numerous atmospheric processes on synoptic, regional and local scales provide the meteorological conditions throughout the year suitable for dust mobilization over areas rich in erodible material. In late winter and spring time, heavy dust storms over North Africa, have been reported to be associated with Saharan cyclones (Westphal et al., 1985; Schepanski et al., 2009; Bou Karam et al., 2010). The development of these depressions, mostly in the lee of the Atlas Mountains, is favored by the strengthening of the meridional temperature gradient over northern Africa at this time of the year (e.g. Bou Karam et al., 2010). About 25 % of the total dust emissions in spring over North Africa are due to the occurrence of Saharan cyclones (e.g. Fiedler et al., 2014). The majority of these cyclones moves eastward following the coast line of the African continent. This trajectory is mainly favored by the presence of the subtropical jet at about 7 km in altitude over Africa during this period of the year (see Bou Karam et al., 2010 for more details). More importantly, Bou Karam et al. (2010) have estimated the load of dust emitted by a single Saharan cyclone to range between 2 to 8 Tg per day.
Despite their effective role in dust emission and transport over long distance, no attention has been given to Saharan cyclones that propagate poleward. In this study, we document an extreme case of dust emission by a Saharan cyclone that occurred over Morocco on 4 April 2011 and moved poleward, transporting heavy dust plumes over the Iberian Peninsula, the northern Atlantic Ocean toward Ireland and Greenland.
Observations at high spatio-temporal resolution from the Spinning Enhanced Visible and Infrared Imager (SEVIRI; EUMETSAT, 2018) on board the Meteosat Second Generation (MSG-SEVIRI) geostationary satellite are used in this study in order to characterize qualitatively the dust activity over North Africa associated with the Saharan cyclone and the transport towards the Arctic. The MODIS Aqua Aerosol Product (MOD04, Hsu et al., 2013; Levy et al., 2015) is used to acquire the daily aerosols optical depth at 13:30 UTC associated with the cyclone. The ice melt over Greenland is inspected using the 25 km resolution AMSR-E Brightness temperature (TB) product at 36 GHz horizontal polarization for the night path (around 01:00 UTC) on board the AQUA satellite (Brodzik et al., 2016).
Synoptic-scale meteorological conditions during the event under scrutiny as well as the characteristics of the cyclone were studied using 6-hourly European Centre for Medium-range Weather Forecasts (ECMWF, 2018) ReAnalyses ERA5, having a spatial resolution of 31 km globally and 137 levels to 0.01 hPa on the vertical. The simulation was performed using the Meso-NH (version 5-3-0) atmospheric model (Lac et al., 2018), a non-hydrostatic mesoscale atmospheric model with an on-line dust emission and transport module (Grini et al., 2006). The model was run during 6 d from 3 April at 00:00 UTC to 10 April 2011 at 00:00 UTC over a domain of 4608×7680 km2 using a 24 km horizontal grid spacing covering North Africa, Western Europe and the Northern Atlantic Ocean. In the vertical, 72 levels were used with 35 of them within the planetary boundary layer (i.e. below 2 km). The lowermost level is at 10 m above the ground, while the highest level is at 28 km above the ground. The initial and boundary conditions are provided by ECMWF.
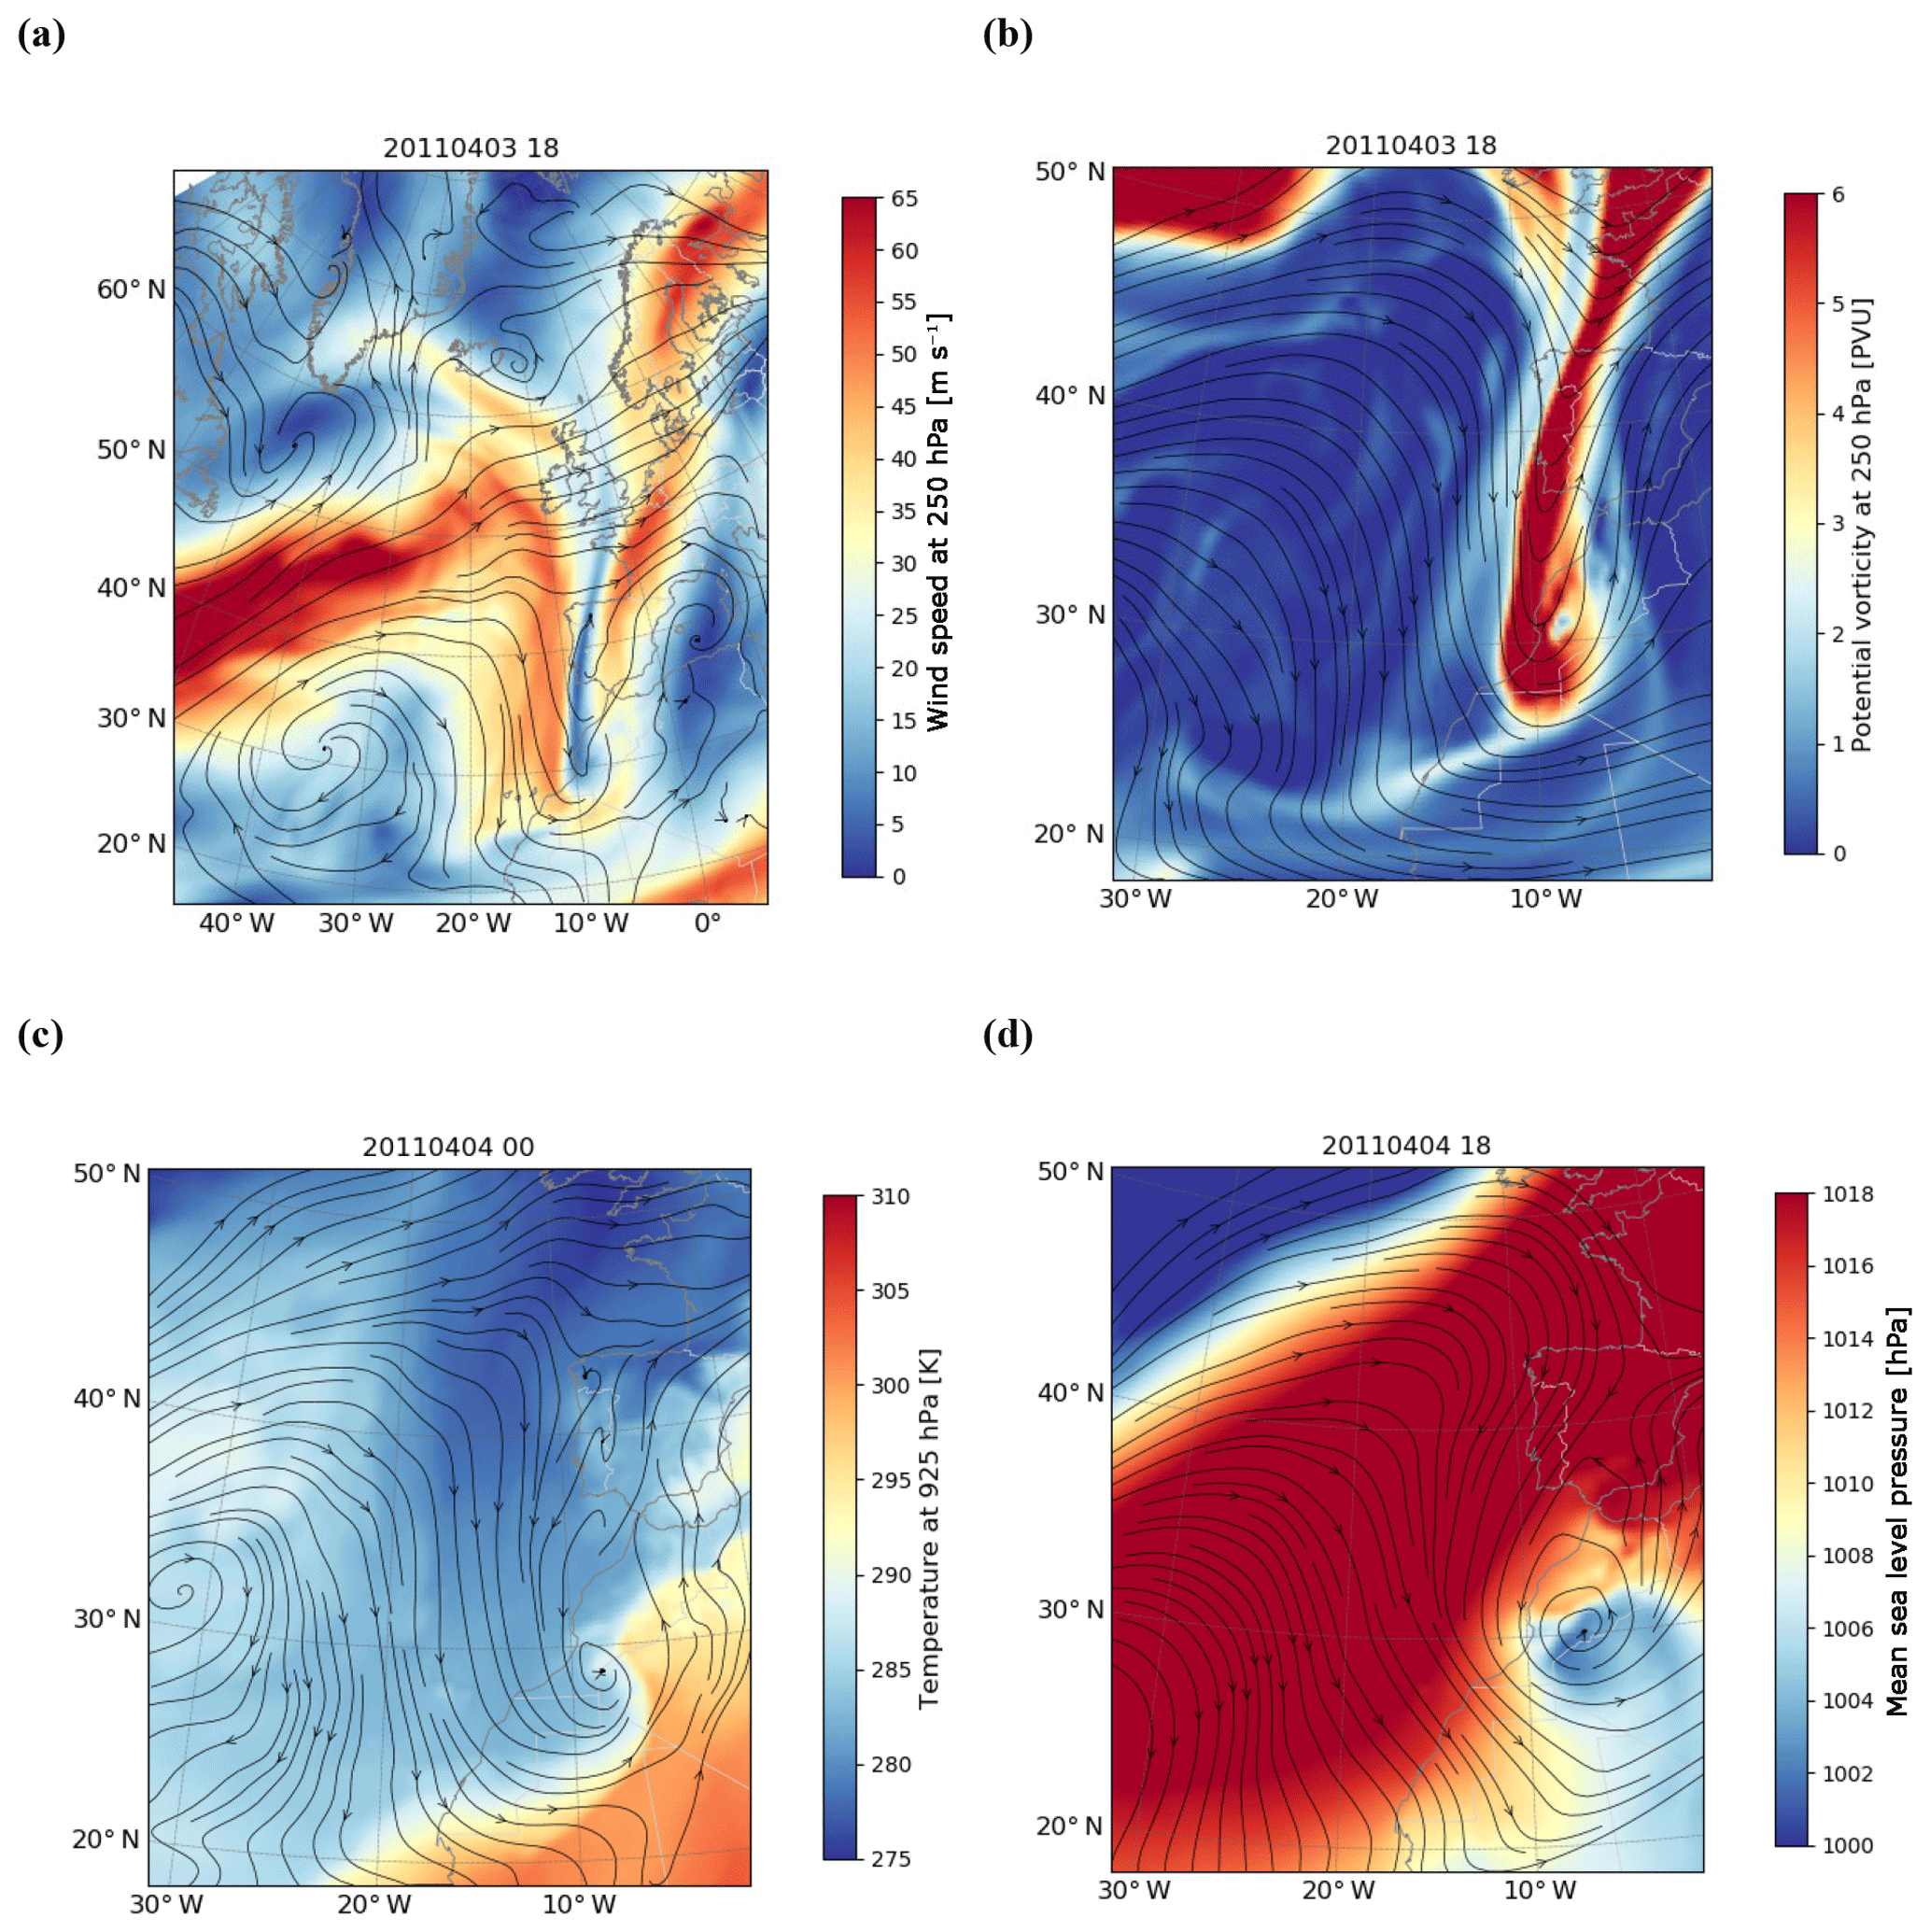
Figure 1ECMWF ERA5 reanalyzes at 250 hPa on 3 April at 18:00 UTC of Wind Speed (a) and Potential Vorticity (b). (c) ERA5 reanalyses for temperature at 925 hPa on 4 April 2011 at 00:00 UTC. (d) ERA5 MSLP on 4 April 2011 at 18:00 UTC. ERA5 wind direction at 700 hPa is superimposed on all the figures by the black streamlines.
North African cyclogenesis results from the combination of three factors. In addition to the orographic blocking, interactions between the upper-level troposphere and the low-level baroclinity offer the optimal conditions to trigger the growth of the Saharan lows (e.g., Thorncroft and Flocas, 1997). The situation at the upper levels of the troposphere (i.e. 250 hPa) before the initiation of the cyclogenesis (i.e. before 3 April at 00:18 UTC) is characterized by a polar jet stream (PJS) standing out clearly between 27 and 40∘ N with strong southwesterly winds exceeding 60 m s−1 and a meandering shape (Fig. 1a) associated with the intrusion of an upper level trough near 10 W from high latitudes. The upper-level front was associated with high values of potential vorticity exceeding 5 PVU over 100 km in width (Fig. 1b). The high-latitude-upper-level trough became narrower with time, moved eastward and penetrated as south as 27∘ N at 10∘ W reaching the western flank of the Anti-Atlas Mountains in Morocco (Fig. 1a and b). A broad baroclinic zone characterized by a strong temperature gradient of about 10 K over 1∘ in longitude is present along the Atlantic coastline in Morocco (Fig. 1c). The well-marked southwest-northeast oriented temperature gradient seen in the low levels of the atmosphere (i.e. 950 hPa, Fig. 1c) satisfies the necessary conditions for baroclinic instability (e.g. Thorncroft and Flocas, 1997); an important precursor for Saharan cyclogenesis (e.g. Alpert and Ziv, 1989). The gradient in surface temperature was characterized by a maximum of temperature (305 K) located over the continent associated with daytime surface heating and a minimum of temperature (285 K) located over the eastern Atlantic (Fig. 1c). These optimal conditions for Saharan cyclogenesis triggered a Saharan low on 4 April 2011 at 00:00 UTC in the lee of the Anti-Atlas Mountains close to 27∘ N/9∘ W (Fig. 1d). The cyclone developed at low levels within the region of strong baroclinity (Fig. 1c) and in the presence of the upper level trough (Fig. 1b and d) perturbed by the orography.
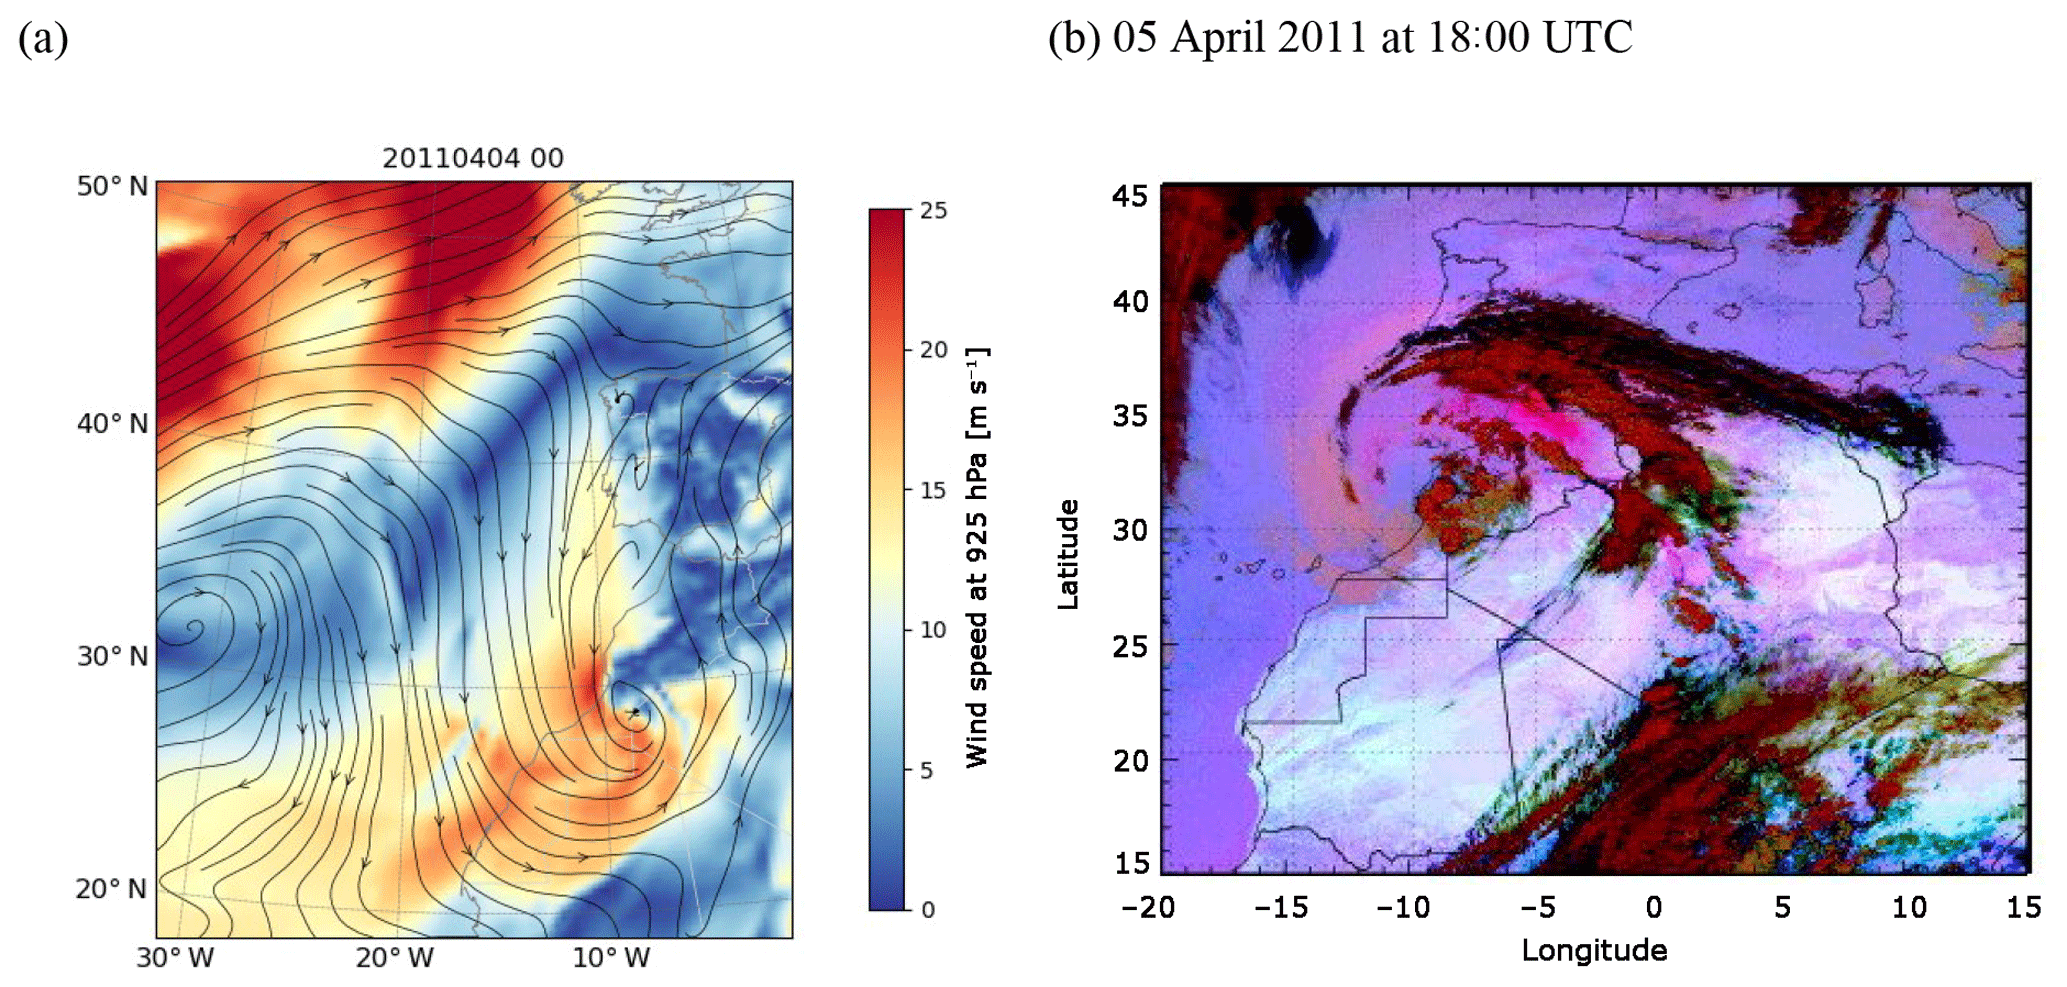
Figure 2(a) ECMWF ERA5 reanalyses of wind speed at 925 hPa (colors) and wind direction at 700 hPa (streamlines) on 4 April 2011 at 00:00 UTC. (b) SEVIRI-derived false color images over North Africa, showing dust (pink), clouds (brown/red) and differences in surface emissivity retrieved in absence of dust or clouds (light blue/blue) on 5 April 2011 at 18:00 UTC.
The Saharan depression was centered at 9∘ W and 27∘ N then it migrated westward and northward (Fig. 2a and b) and dissipated over the eastern Atlantic off the Iberian coast on 6 April when it merged with the main stream as will be discussed in Sect. 5. The center of low pressure associated with the cyclone deepened with time and on the evening of 4 April the surface pressure anomaly at its center reached 12 hPa (Fig. 1d), and the potential vorticity exceeded 6 PVU on 5 April at 12:00 UTC (not shown).The cyclone was characterized by a warm front east of the low typified at the surface by temperatures higher than 300 K, and a sharp cold front characterized by surface temperatures less than 290 K (not shown). The strongest winds are located in the regions of strong temperature gradient (Fig. 2a) and they exceeded 20 m s−1. The cyclone provided a dynamical forcing that led to a major dust storm over North Africa as recorded by SEVIRI satellite. The dust was transported all around the cyclone (pink colors, Fig. 2b) leaving a clear eye at its center and was accompanied by a thick high-level cloud band along the northern edge of the cyclone (dark red colors, Fig. 2b). On the vertical, slanted dust layers reaching 6 km in altitude were observed in the CALIPSO satellite observations during this event (not shown). The cyclone provided the necessary dynamical lofting of the dust to high altitudes making it subject to long range transport. The dust cloud continued to spread both northward and westward. It was seen to cover most of Western Europe and eastern North Atlantic on 7 and 8 April 2011 (not shown). The part of the dust cloud located over the ocean was also pushed northward. It passed over Ireland on 8 April at 21:00 UTC, where a layer of dust located between 2 and 3 km was detected in the lidar measurements at the Cork Raman Lidar station in southern Ireland (51.8933∘ N, −8.4942∘ E, 75 m, not shown), and it reached Greenland the day after as inferred by the model simulation (since Greenland is outside the coverage area of SEVIRI) which will be discussed in Sect. 5.
We showed in the previous section that the first trough, emanating from the meandering polar jet, had favored the formation of the Saharan cyclone and associated dust emission. In this section, we will show how a second shortwave trough of the still meandering polar jet stream is driving the poleward transport of dust. It is known that when the polar jet stream slows it meanders in a waveform pattern that allows the extension of low pressure lobes and cold fronts much further to the south. The intrusion of low pressure lobes to mid-latitudes can develop and finally detach from the polar jet in a “drop” of cold air via a process called cut-off. These low pressure lobes can become stationary for few days and block the normal circulation of the atmosphere before merging again with the main jet stream.
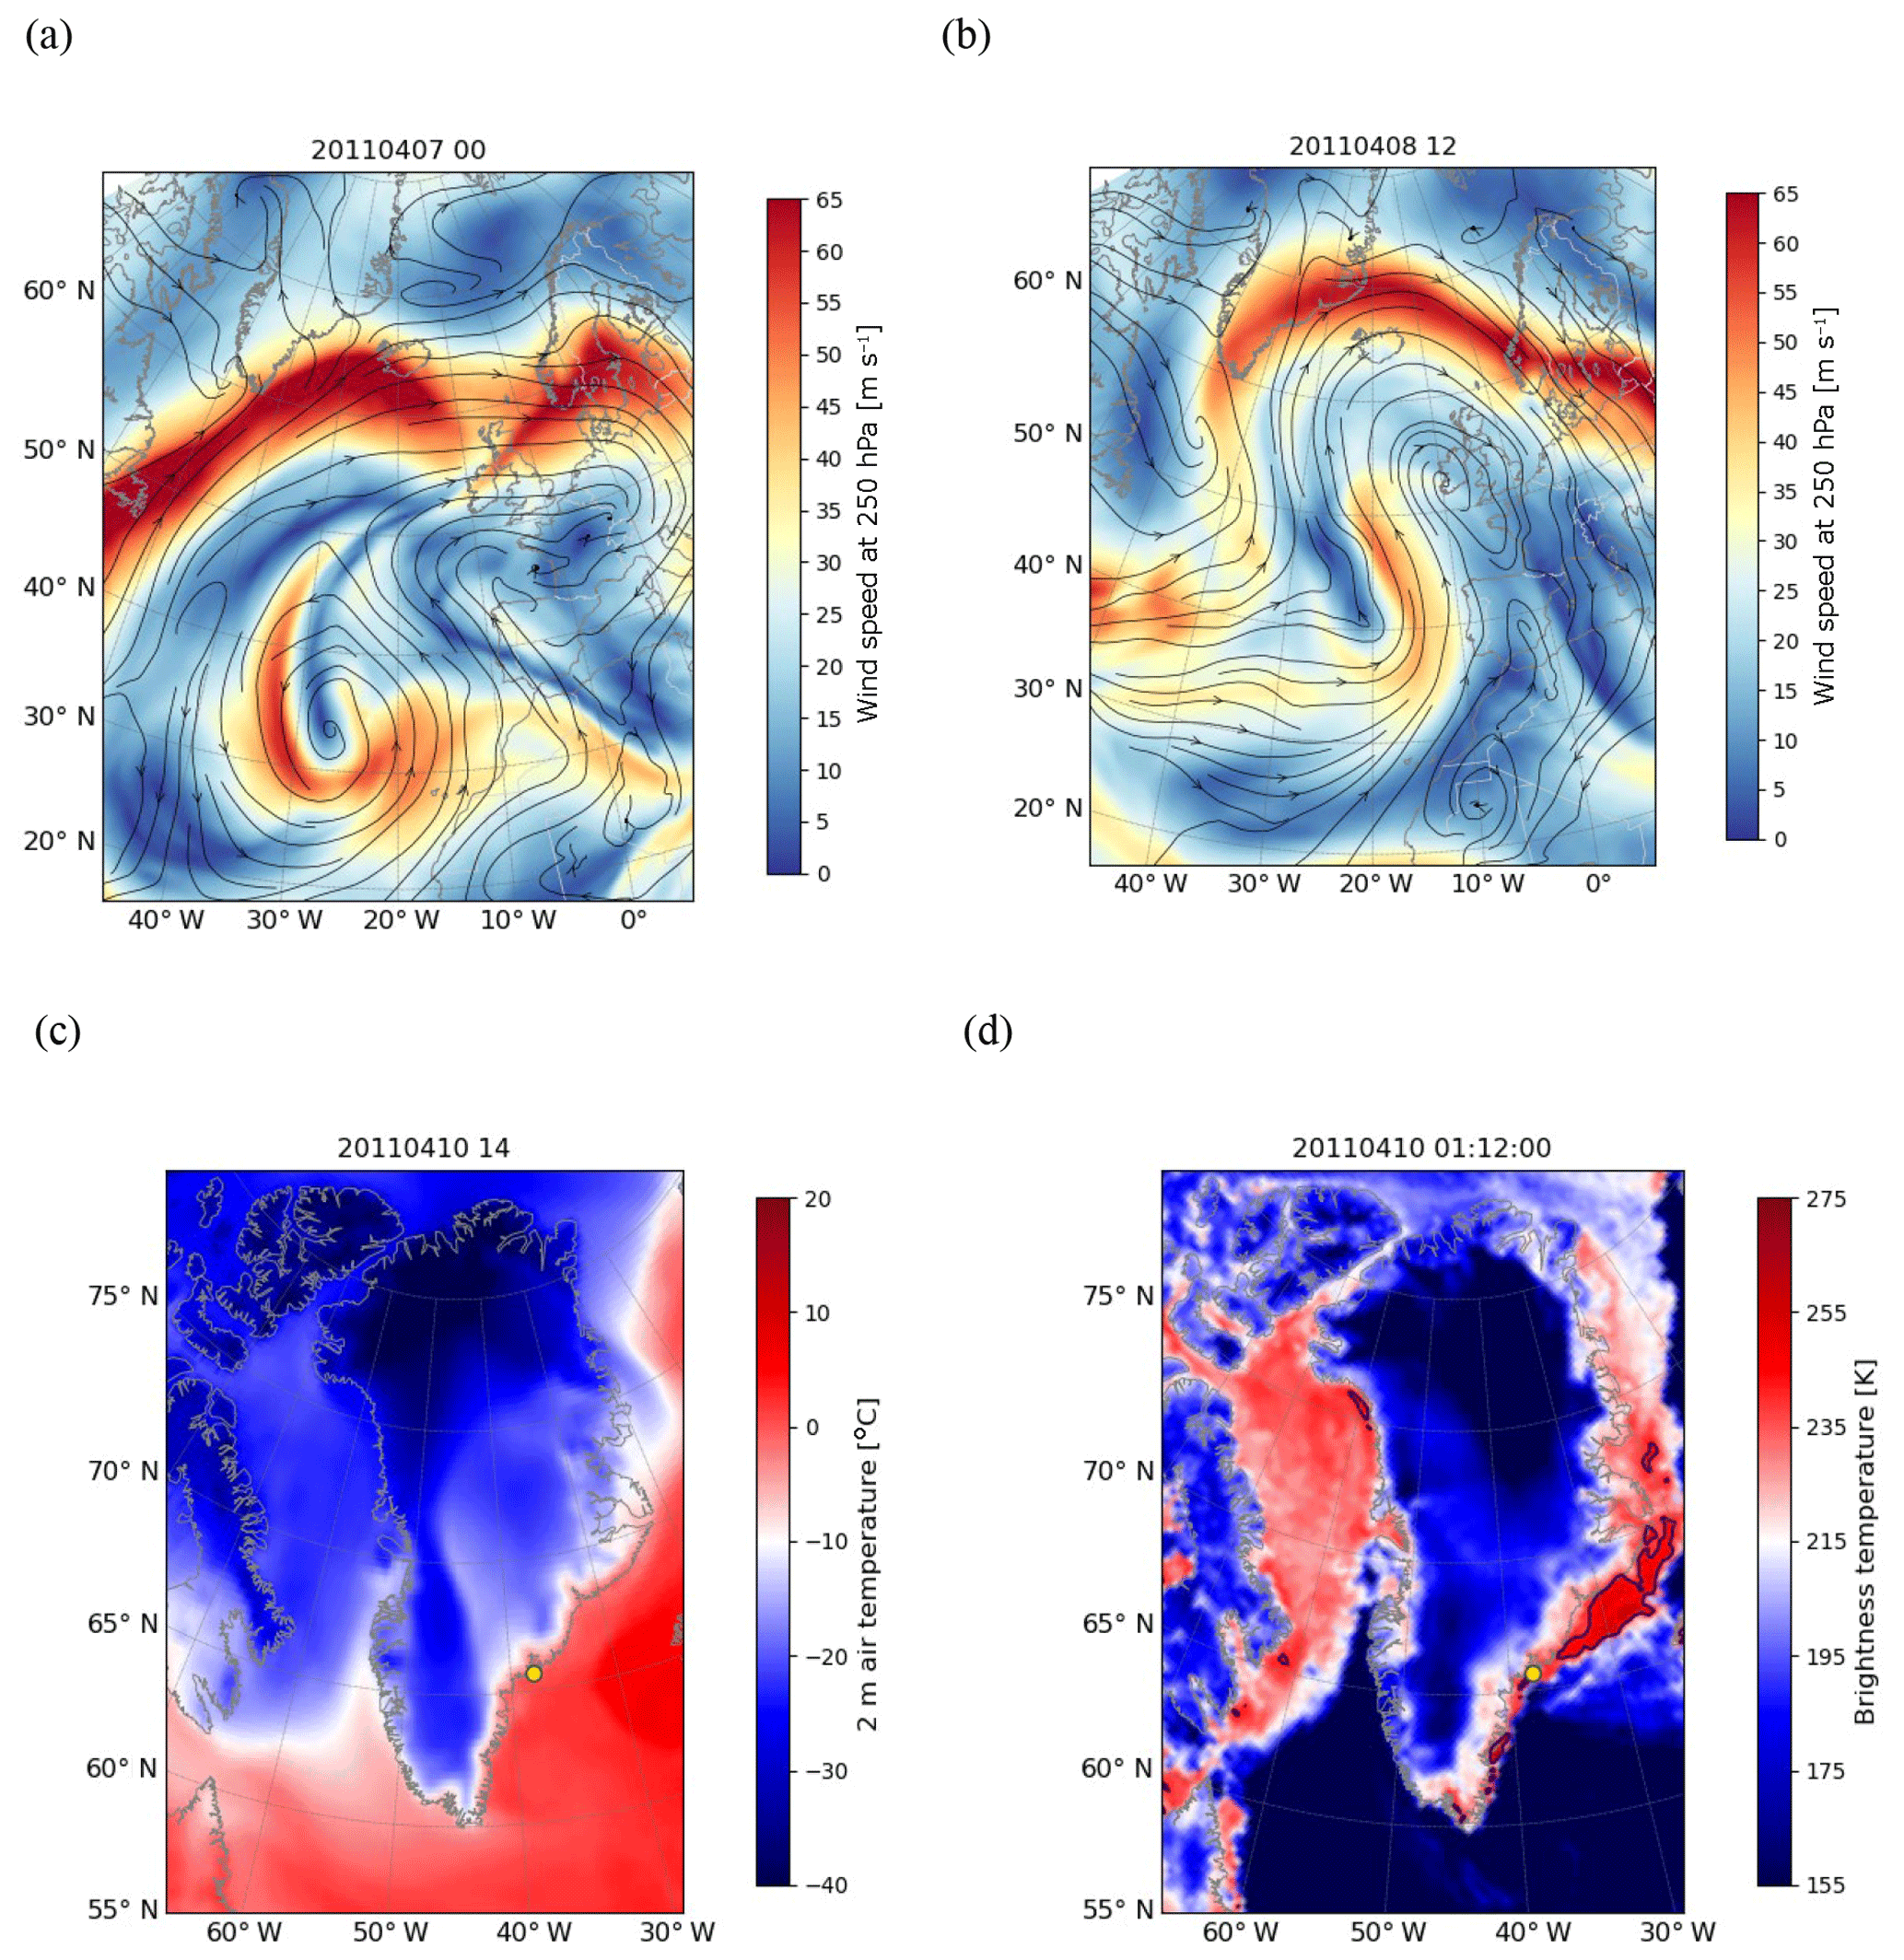
Figure 3ECMWF ERA5 reanalyses of Wind Speed at 250 hPa (colors) and wind direction at 700 hPa (streamlines) on (a) 7 April at 00:00 UTC and (b) 8 April 2011 at 12:00 UTC. 2 m air temperature from ERA5 reanalysis on 10 April 2011 at 14:00 UTC (c) and AMSR-E brightness temperature at 36 GHz horizontal polarization for the night path (around 01:00 UTC) on 10 April 2011 (d). The yellow circle represents the position of the MIT PROMICE station and the black contour represents the threshold of 248 K set for ice melt detection in the AMSR-E data over Greenland.
Figure 3 shows respectively a shortwave trough of the polar jet stream developing on 6 April 2011 then finally detaching a cut-off low on 7 April 2011 (Fig. 3a). When the cut-off occurred on 7 April, the dust cyclone created 2 d earlier by the first polar jet's meander, had reached the coast of France and was blocked in this location by the downstream ridge. The two features are seen as a high and a low side by side in the geopotential height field at 500 hPa as well as in the streamlines field at 700 hPa (not shown). The following day the dust cyclone and the lobe of low pressure merged together (Fig. 3b) and then merged with the main jet stream. The polar jet stream is now carrying the dust northward during the following few days. The consecutive shortwave troughs of the polar jet stream, not only generated the dust storm over Africa but also favored its transport far north.
The dust cloud that reached Greenland was associated with an AOD of about 0.5 (not shown, see Francis et al., 2018). By the end of the episode, the model run estimated a total dust load of 38.35 Tg carried to areas located north of 40∘ N, and dust deposition was estimated at Tg to the north of 40∘ N (not shown, see Francis et al., 2018). The air masses over Greenland associated with this event had three main characteristics; they were loaded with dust, warm, and humid. An increase by 10 ∘C in surface air temperature over 3 d associated with the arrival of the dusty-warm-moist air masses from mid-latitudes to the southeastern parts of Greenland can be seen in the ERA5 fields of 2 m air temperature for the 9–11 period (e.g. Fig. 3c).
Ice melt during the same period was detected over southeast Greenland from both ground based and satellite measurements of brightness temperature (TB). By checking the recorded TB values at the MIT PROMICE station in east Greenland (65.692∘ N 37.83∘ W near Tasiilaq, i.e. yellow circle in Fig. 3) ice melt was seen to occur on 10 April 2011 when the 36H GHz TB reached 242.7 K, which exceeded the melt threshold around this location equal to 239.6 K (e.g. Mote, 2007).
Satellite observations of brightness temperature over Greenland acquired from the AMSR-E satellite for the period 9–11 April 2011 indicated that the TB of the ice cover over southeast Greenland increased by more than 20 K on the days of 9 and 10 April coinciding with the arrival of the warm air masses from mid-latitudes loaded with dust. The TB data at 36 GHz horizontal polarization for the night path (around 01:00 UTC) of AMSR-E shows values between 235 and 257 K over the coastal areas during the period of interest i.e. 9–11 April 2011. The TB values exceeded 248 K (e.g. Fig. 3d) which is the threshold corresponding to the presence of melted ice in the 36H GHz TB AMSR-E data over Greenland (e.g. Apgar et al., 2007).
Such short episodes of increase in temperature and transport of water vapor towards Greenland in spring (e.g. Mattingly et al., 2018) are associated with punctual ice melt and could set favorable preconditions for an early ice melt onset in the Arctic where the onset of ice melt has been occurring earlier in the year over the last few decades (e.g. Stroeve et al., 2006). However, it is difficult to distinguish between the increase in temperature due to the dust radiative impact and the one due to warm air coming from mid-latitudes. For that, one should run simulation with and without dust and compare the increase of surface temperature in both simulation. This exercise is beyond the scope of this study.
This study highlights the role that the polar jet and associated atmospheric circulation plays in the transport of mineral dust from the Sahara desert to the Arctic across eastern side of the North Atlantic Ocean. The poleward transport of dust following this newly identified path was caused by a meandering polar jet stream that was at the origin of both dust emission (through cyclogenesis over Northwest Africa) and poleward transport of the uplifted dust toward the Arctic (through circulation related to cut-off low formation). The polar jet stream has been identified as the main driver for such events leading to the transport of large amount of dust to high-latitudes. If the polar jet is set to slow more frequently due to the changes in the Arctic climate system and to the Arctic Amplification, such events are expected to become more frequent.
In this study, we identify a new mechanism by which the dust travels over long distances across the eastern side of the North Atlantic Ocean toward the Arctic. This path is to be added to the two known paths mentioned in previous studies i.e. through transport across Northern Europe and across the Atlantic Ocean around the Bermuda High (e.g. Rodríguez et al., 2012; VanCuren et al., 2012). Moreover, this path may be the most effective one in terms of dust load import into the Arctic given the fact that it is the shortest and most direct path. This configuration allows large amount of the uplifted dust in source area, to reach the Arctic before deposition.
Francis and Vavrus (2012) explained how the Arctic Amplification under projected climate change can result in a slowed meandering jet stream with more cut-off and warm ridges. In this study, we demonstrated that such atmospheric circulation constitutes a favorable set for the transport of dust, warm and moist air masses from subtropics and mid-latitudes to the Arctic where approximately half of the warming is being attributed to increased moisture and heat fluxes transported to the region (McGuire et al., 2006). The link of Saharan dust transport to the Arctic heat dome and ice melt events need also to be investigated.
The European Centre for Medium-Range Weather Forecasts (ECMWF) ERA5 reanalyses used in this study are available here: https://www.ecmwf.int/en/forecasts/datasets/archive-datasets/reanalysis-datasets/era5 (ECMWF, 2018). The SEVIRI data are available on EUMETSAT data center: https://www.eumetsat.int/website/home/Data/DataDelivery/OnlineDataAccess/index.html (EUMETSAT, 2018).
The authors declare that they have no conflict of interest.
This article is part of the special issue “18th EMS Annual Meeting: European Conference for Applied Meteorology and Climatology 2018”. It is a result of the EMS Annual Meeting: European Conference for Applied Meteorology and Climatology 2018, Budapest, Hungary, 3–7 September 2018.
This research was supported by the NYU Abu Dhabi Research Institute (G1204) in the UAE. We wish to thank the editor and the two reviewers for their efforts.
This paper was edited by Renato R. Colucci and reviewed by Arianna Peron and one anonymous referee.
Alpert, P. and Ziv, B.: The Sharav cyclone – observations and some theoretical considerations, J. Geophys. Res., 94, 18495–18514, 1989.
Apgar, D. J., Ramage, J. M., McKenney, R. A., and Maltais, P.: AMSR-E algorithm for snowmelt onset detection in sub-arctic heterogeneous terrain, Hydrol. Process. 21, 1587–1596, 2007.
Bintanja, R. and Krikken, F.: Magnitude and pattern of Arctic warming governed by the seasonality of radiative forcing, Sci. Rep.-UK, 6, 38287, https://doi.org/10.1038/srep38287, 2016.
Breider, T. J., Mickley, L. J., Jacob, D. J., Wang, Q., Fisher, J. A., Chang, R. Y.-W., and Alexander, B.: Annual distributions and sources of Arctic aerosol components, aerosol optical depth, and aerosol absorption, J. Geophys. Res.-Atmos., 119, 4107–4124, https://doi.org/10.1002/2013JD020996, 2014.
Brodzik, M. J., Long, D. G., Hardman, M. A., Paget, A. and Armstrong, R.: MEaSUREs Calibrated Enhanced-Resolution Passive Microwave Daily EASE-Grid 2.0 Brightness Temperature ESDR, Version 1, [AMSRE], Boulder, Colorado USA. NASA National Snow and Ice Data Center Distributed Active Archive Center, https://doi.org/10.5067/MEASURES/CRYOSPHERE/NSIDC-0630.001, 2016.
Bou Karam, D., Flamant, C., Cuesta, J., Pelon, J., and Williams, E.: Dust emission and transport associated with a Saharan depression: The February 2007 case, J. Geophys. Res., 2009JD012390, https://doi.org/10.1029/2009JD012390, 2010.
Box, J. E., Fettweis, X., Stroeve, J. C., Tedesco, M., Hall, D. K., and Steffen, K.: Greenland ice sheet albedo feedback: thermodynamics and atmospheric drivers, The Cryosphere, 6, 821–839, https://doi.org/10.5194/tc-6-821-2012, 2012.
ECMWF: ERA5, Polar Jet, last access: 20 September 2018.
EUMETSAT: SEVIRI, Dust, Last access: 20 September 2018.
Fiedler, S., Schepanski, K., Knippertz, P., Heinold, B., and Tegen, I.: How important are atmospheric depressions and mobile cyclones for emitting mineral dust aerosol in North Africa?, Atmos. Chem. Phys., 14, 8983–9000, https://doi.org/10.5194/acp-14-8983-2014, 2014.
Francis, D., Eayrs, C., Chaboureau, J.-P., Mote, T., and Holland, D.: Polar jet associated circulation triggered a Saharan cyclone and derived the poleward transport of the African dust generated by the cyclone, J. Geophys. Res.-Atmos., 123, 11899–11917, https://doi.org/10.1029/2018JD029095, 2018.
Francis, J. A. and Vavrus, S. J.: Evidence linking Arctic amplification to extreme weather in mid-latitudes, Geophys. Res. Lett., 39, L06801, https://doi.org/10.1029/2012GL051000, 2012.
Grini, A., Tulet, P., and Gomes, L.: Dusty weather forecasts using the MesoNH mesoscale atmospheric model, J. Geophys. Res., 111, D19205, https://doi.org/10.1029/2005JD007007, 2006.
Groot Zwaaftink, C. D., Grythe, H., Skov, H., and Stohl, A.: Substantial contribution of northern high-latitude sources to mineral dust in the Arctic, J. Geophys. Res.-Atmos., 121, 13678–13697, https://doi.org/10.1002/2016JD025482, 2016.
Gutman, G. and Reissell, A. (Eds.): Eurasian Arcitic Land Cover and Land Use in a Changing Climate, Springer, Earth Sciences, 306 pp., 2011.
Hsu, N. C., Jeong, M.-J., Bettenhausen, C., Sayer, A. M., Hansell, R., Seftor, C. S., Huang, J., and Tsay, S.-C.: Enhanced Deep Blue aerosol retrieval algorithm: The second generation, J. Geophys. Res.-Atmos., 118, 9296–9315, https://doi.org/10.1002/jgrd.50712, 2013.
Kylling, A., Groot Zwaaftink, C. D., and Stohl, A.: Mineral Dust Instantaneous Radiative Forcing in the Arctic, Geophys. Res. Lett., 45, 4290–4298, https://doi.org/10.1029/2018GL077346, 2018.
Lac, C., Chaboureau, J.-P., Masson, V., Pinty, J.-P., Tulet, P., Escobar, J., Leriche, M., Barthe, C., Aouizerats, B., Augros, C., Aumond, P., Auguste, F., Bechtold, P., Berthet, S., Bielli, S., Bosseur, F., Caumont, O., Cohard, J.-M., Colin, J., Couvreux, F., Cuxart, J., Delautier, G., Dauhut, T., Ducrocq, V., Filippi, J.-B., Gazen, D., Geoffroy, O., Gheusi, F., Honnert, R., Lafore, J.-P., Lebeaupin Brossier, C., Libois, Q., Lunet, T., Mari, C., Maric, T., Mascart, P., Mogé, M., Molinié, G., Nuissier, O., Pantillon, F., Peyrillé, P., Pergaud, J., Perraud, E., Pianezze, J., Redelsperger, J.-L., Ricard, D., Richard, E., Riette, S., Rodier, Q., Schoetter, R., Seyfried, L., Stein, J., Suhre, K., Taufour, M., Thouron, O., Turner, S., Verrelle, A., Vié, B., Visentin, F., Vionnet, V., and Wautelet, P.: Overview of the Meso-NH model version 5.4 and its applications, Geosci. Model Dev., 11, 1929–1969, https://doi.org/10.5194/gmd-11-1929-2018, 2018.
Lambert, F., Kug, J. S., Park, R. J., Mahowald, N., Winckler, G., Abe-Ouchi, A., and Lee, J. H.: The role of mineral-dust aerosols in polar temperature amplification, Nat. Clim. Change, 3, 487–491, https://doi.org/10.1038/nclimate1785, 2013.
Levy, R., Hsu, C., et al.: MODIS Atmosphere L2 Aerosol Product. NASA MODIS Adaptive Processing System, Goddard Space Flight Center, USA, https://doi.org/10.5067/MODIS/MYD04_L2.006, 2015.
Mattingly, K. S., Mote, T. L., and Fettweis, X.: Atmospheric river impacts on Greenland Ice Sheet surface mass balance, J. Geophys. Res.-Atmos., 123, 8538–8560, https://doi.org/10.1029/2018JD028714, 2018.
McGuire, A. D., Chapin, F. S., Walsh, J. E., and Wirth, C.: Integrated regional changes in arctic climate feedbacks: implications for the global climate system, Annu. Rev. Env. Resour., 31. 61–91, 2006.
Meier, W. N., Hovelsrud, G., van Oort, B., Key, J., Kovacs, K., Michel, C., Granskog, M., Gerland, S., Perovich, D., Makshtas, A. P., and Reist, J.: Arctic sea ice in transformation: A review of recent observed changes and impacts on biology and human activity, Rev. Geophys., 52, 185–217, https://doi.org/10.1002/2013RG000431, 2014
Mote, L. T.: Greenland surface melt trends 1973–2007: Evidence of a large increase in 2007, Geophys. Res. Lett., 34, https://doi.org/10.1029/2007GL031976, 2007.
Quinn, P. K., Shaw, G., Andrews, E., Dutton, E. G., Ruoho-Airola, T., and Gong, S. L.: Arctic haze: Current trends and knowledge gaps, Tellus B, 59, 99–114, https://doi.org/10.1111/j.1600-0889.2006.00238.x, 2007.
Richter-Menge, J., Jeffries, M. O., and Osborne, E., Eds.: The Arctic, in “State of the Climate in 2016”, B. Am. Meteorol. Soc., 98, S93–S128, https://doi.org/10.1175/2017BAMSStateoftheClimate.1, 2017.
Rodríguez, E., Toledano, C., Cachorro, V. E., Ortiz, P., Stebel, K., Berjón, A., Blindheim, S., Gausa, M., and de Frutos, A. M.: Aerosol characterization at the sub-Arctic site Andenes (69∘ N, 16∘ E), by the analysis of columnar optical properties, Q. J. Roy. Meteor. Soc., 138, 471–482, https://doi.org/10.1002/qj.921, 2012.
Ryan, C. J., Hubbard, A., Stibal, M., Irvine-Fynn, T. D., Cook, J., Smith, L. C., Cameron, K., and Box, J.: Dark zone of the Greenland Ice Sheet controlled by distributed biologically-active impurities, Nat. Commun., 9, 1065, https://doi.org/10.1038/s41467-018-03353-2, 2018.
Schepanski, K., Tegen, I., Todd, M. C., Heinold, B., Bönisch, G., Laurent, B., and Macke, A.: Meteorological processes forcing Saharan dust emission inferred from MSG-SEVIRI observations of sub-daily dust source activation, J. Geophys. Res., 114, D10201, https://doi.org/10.1029/2008JD010325, 2009.
Shindell, D. and Faluvegi, G.,: Climate response to regional radiative forcing during the twentieth century, Nat. Geosci., 2, 294–300, https://doi.org/10.1038/ngeo473, 2009.
Stroeve, J. C., Markus, T., and Meier, W. N.: Recent changes in the Arctic melt season, Ann. Glaciol., 44, 367–374, 2006.
Stohl, A.: Characteristics of atmospheric transport into the Arctic troposphere, J. Geophys. Res., 111, D11306, https://doi.org/10.1029/2005JD006888, 2006.
Tedesco, M., Box, J. E., Cappelen, J., Fettweis, X., Mote, T., Rennermalm, A. K., van de Wal, R. S. W., and Wahr, J.: Greenland Ice Sheet in [2013 NOAA Arctic Report Card], NOAA, 2014.
Thorncroft, C. D. and Flocas, H. A.: A case study of Saharan cyclogenesis, Mon. Weather Rev., 125, 1147–1165, 1997.
VanCuren, R. A., Cahill, T., Burkhart, J., Barnes, D., Zhao, Y., Perry, K., Cliff, S., and McConnell, J.: Aerosols and their sources at Summit Greenland – First results of continuous size- and time-resolved sampling, Atmos. Environ., 52, 82–97, https://doi.org/10.1016/j.atmosenv.2011.10.047, 2012.
Westphal, D. L., Toon, O. B., and Carlson, T. N.: A Numerical Investigation of Saharan Dust Storms, PhD Thesis, Penn. State UnivUniversity, University Park, 1985.
- Abstract
- Introduction
- Data sources: ppace-borne observations, reanalysis and model simulation
- The meteorological conditions at synoptic scale leading to cyclogenesis
- Cyclone formation and dust storm
- Mechanism by which the dust was transported poleward
- The impact on Greenland ice
- Summary
- Data availability
- Competing interests
- Special issue statement
- Acknowledgements
- Review statement
- References