 | 28 May 2019
Interactive open access to climate observations from Germany
Frank Kratzenstein
Andrea K. Kaiser-Weiss
During recent years, Germany's national meteorological service (Deutscher Wetterdienst, DWD) has significantly expanded the open access to its climate observations. A first step was a simple FTP-site with the possibility for downloading archives with various categories of data, e.g. national and international station-based meteorological data, derived parameters, gridded products and special categories as e.g. phenological data. The data are based on the observing systems of DWD for Germany as well as international activities of DWD. To improve the interactive and user-friendly access to the data, a new portal has been developed. The portal serves a variety of user requirements that result from the broad range of applications of DWD's climate data. Here we provide an overview of the new climate data portal of DWD. It is based on a systematic implementation of OGC-based technologies. It allows easy graphical access to the station data, but also supports access via technical interfaces, esp. Web-Map- and Web-Feature-Services.
- Article
(3493 KB) - Full-text XML
- BibTeX
- EndNote


Germany's national meteorological service (Deutscher Wetterdienst, DWD) is responsible for provision of meteorological and climatological services for the general public and a wide range of customers. The official duties are defined in the “Act on the German Meteorological Service” (Gesetz über den Deutschen Wetterdienst; https://www.gesetze-im-internet.de/dwdg/, last access: 17 May 2019). The tasks include warning of the public in case of severe weather events or the continuous monitoring of the atmosphere. The act explicitly mentions (a) the operation of the measurement and observation systems necessary to carry out the legal tasks as part of the German infrastructure for geospatial information, and (b) the provision, archiving, documentation and delivery of meteorological and climatological geospatial data and services. With the last change in 2017, an open data policy was implemented. To fulfill task (b) DWD operates the national climate data archive and uses the national observations to provide regular statements on climate in Germany (Kaspar et al., 2013). The national climate data archive also includes the observations of predecessor organizations (see Kaspar and Mächel, 2017). DWD started to expand its selection of publicly available climate data sets in 2014, but especially with the new act a further expansion was started in 2017, which also included further high-resolution observations. The first step was the provision of selected datasets on an FTP-server. The server allows direct download of archives with various categories of data, e.g. national and international station-based meteorological data, derived parameters, gridded products and special categories as e.g. phenological data (Kaspar et al., 2014).
However, several user requirements were not fulfilled with that approach, e.g. systematic search options were missing or standards for geospatial data exchange were not systematically used. Therefore a development of a new data portal was started to address several of these user requirements. The first focus was on station observations from Germany. In the following sections we will provide background information on these observations (Sect. 2), describe the user requirements for data access (Sect. 3) and explain and illustrate the implementation.
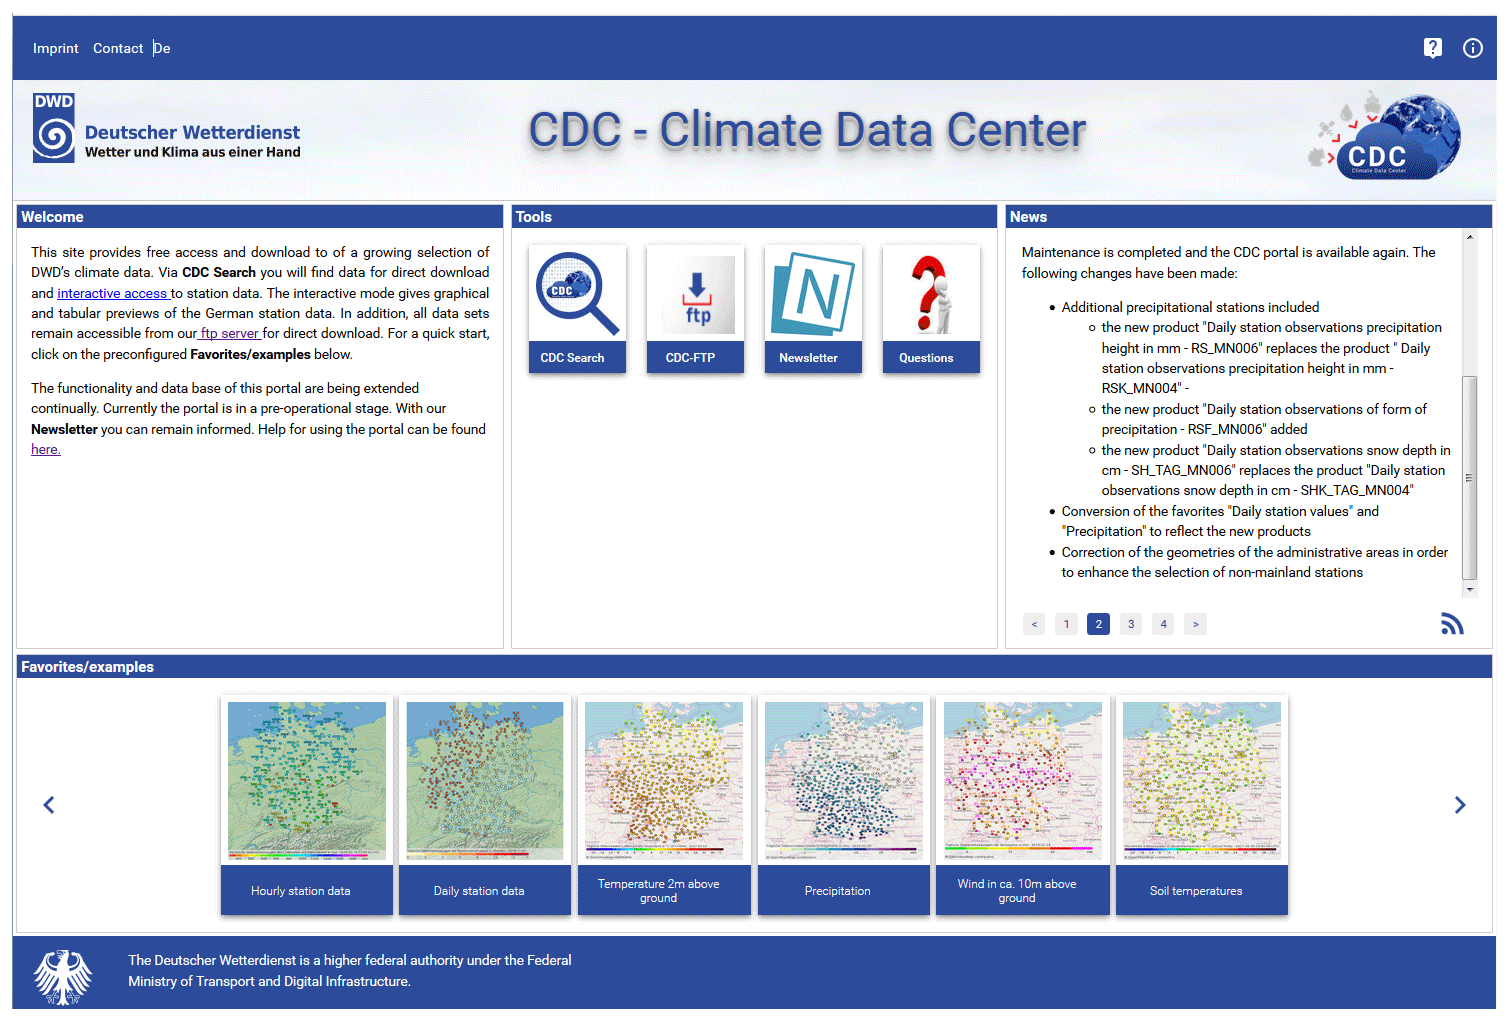
Figure 1Homepage of the interactive Climate Data Center portal (Source: Deutscher Wetterdienst).
DWD operates networks of weather stations that provide time series of near-surface meteorological observations. The density of the networks depends on the parameters, e.g. precipitation is observed with the highest station density. The length of the time series is related to the historical development of the observation networks. Some series extend back into the 18th century, e.g. observations from the meteorological observatory Hohenpeißenberg started in 1781. Several changes occurred during the operation of these networks that might have an impact on the time series, e.g. relocation of stations, changes in the instructions (e.g. observation time) or the instrumentation (e.g. transition from manual to automatic observations, see for example Kaspar et al., 2016). It is therefore important to provide the time series with detailed metadata. Today, at automatic weather stations, observations are taken with high temporal resolution and transferred to the central data bases of DWD. Several steps of quality-control routines are applied to the data. Therefore, data might change with delay. Some historic data are not yet available in digital form. Therefore DWD is still working on the digitization of historic time series (Kaspar et al., 2015) and additional historic data are continuously added to the digital archive.
The data are used for a wide-range of applications that lead to a variety of requirements on data provision. On the one hand, some users are interest to get access to the data as quick as possible after the time of observation; other users are interested in long-time series with well documented quality. In the context of climate research also reproducibility of scientific analysis is an important requirement.
Based on these requirements, the data provision on the FTP-server was implemented as follows: the full time series are extracted from the internal data base once a year. In addition to that, daily updates containing approx. the last 500 days of data are provided. This makes sure that users have access to the improvements achieved by the quality control procedures. The data are provided in zip-archives which also include additional meta-data on station history and instrumentation.
However, after that first step, additional requirements have been discussed (see bullet points in the next section) and as a consequence a new data portal has been developed. The first priority was on improved access to German station data, but an expansion to other data categories is ongoing.

Figure 2Screenshot of the search page. The left part shows the facet-based selection area that allows narrowing the search results. The right part shows the search results. In this example four data access methods are available: Interactive access, download from an FTP-server, WMS and WFS (Source: Deutscher Wetterdienst).
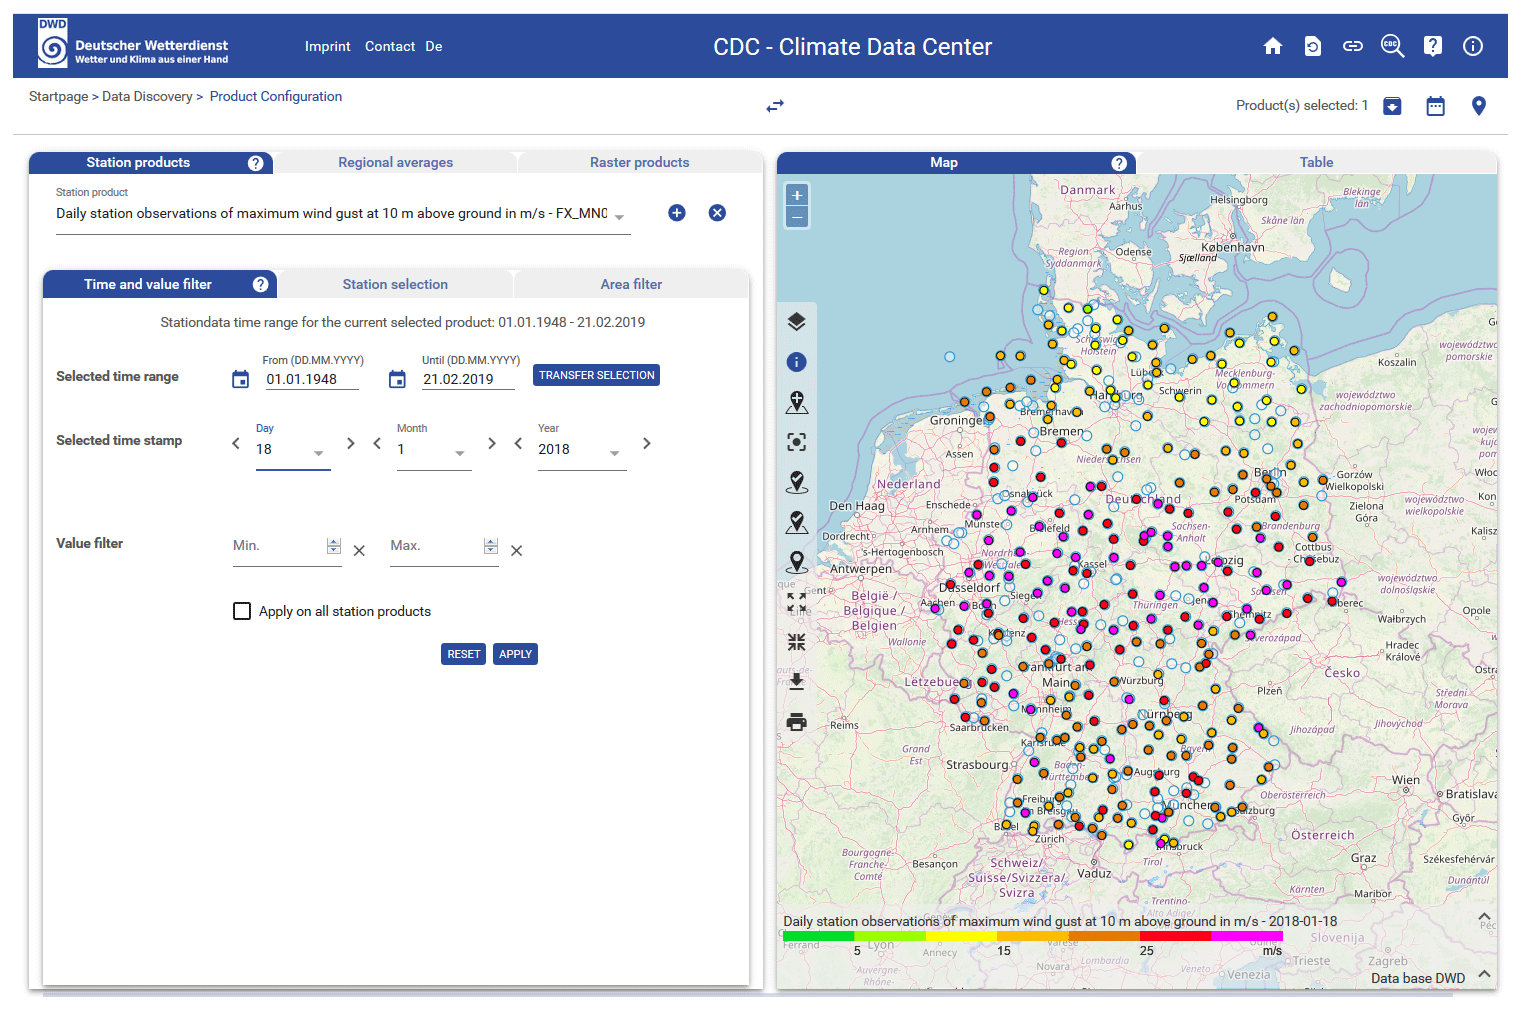
Figure 3Interactive components of the portal with configuration area (left part) and map display area (right part). The example shows daily maximum wind gusts of 18 January 2018 (Cyclone Frederike) (Source: Deutscher Wetterdienst).

Figure 4The station Offenbach-Wetterpark shown at a high zoom-level. The combination with additional maps (here: OpenStreetMap, © OpenStreetMap-contributors, CC BY-SA 2.0) provides detailed information on the station surrounding.
Because of the wide spectrum of users and applications, the requirements for features of the data access are manifold:
-
The German meteorological service DWD is an agency of the German Federal government and therefore DWD should contribute to the German geospatial data infrastructure (Geodateninfrastuktur Deutschland: GDI-DE), thereby following guidelines of INSPIRE (INfrastructure for SPatial InfoRmation in Europe, see: https://inspire.ec.europa.eu/, last access: 17 May 2019) and the Open Geospatial Consortium (OGC), an international organization committed to developing quality open standards for geospatial content and services (see: http://www.opengeospatial.org/, last access: 17 May 2019). The general concept of a web-service based approach is to make information accessible over well-defined internet protocols that are independent of platforms and programming languages in order to simplify the development of applications. For a detailed and critical discussion see for example Josuttis (2007).
-
However, in addition to these general standards for geo-related metadata, also the standards of the meteorological community as defined by WMO are relevant (esp. WIGOS, see below). Metadata are relevant at two levels: (1) for the description of the data collections, as e.g. “daily temperature observations for Germany”, but (2) also for the detailed provision of supplementary information to the time series, as e.g. station history, instrumentation, observing instructions, etc. The first category is relevant to support the user in finding an appropriate data collection for his application, the second category is mainly needed by the user when working with the data, i.e. for understanding the detailed background of the time series. The WIGOS (WMO Integrated Global Observing System) metadata standard supports the second category. Its intention is to “describe the observed variable, the conditions under which it was observed, how it was measured, and how the data have been processed, in order to provide users with confidence that the data are appropriate for their application” (World Meteorological Organization, 2017).
-
The variety of meteorological parameters, their observing systems, their different temporal and spatial resolution and extend or the different access methods leads to the situation that it is not easy for users to identify the dataset that fits best to their intended application.
-
Different applications also lead to wide range of requirements concerning the total amount of data the individual user needs to access. Examples are (a) users who want to analyze the complete datasets in high temporal resolution, e.g. for research on extreme events, or (b) users who are just interested in looking up a single value or (c) getting a visualization for a selected point in time or (d) getting a formatted version of selected data for printing.
-
A frequently requested feature was support for identifying stations close to a selected location, eventually combined with certain additional criteria, e.g. a defined length of the observation period.
-
Also the requirements on timeliness vary considerably, e.g. from a one-time access of the historic time series to recurring near-real time access.
This set of user requirements has been evaluated and the following conclusions have been drawn for the implementation of the data portal:
-
The implementation should be based on standardized and interoperable OGC-standards wherever possible and the interfaces should also be directly accessible to users.
-
A search mechanism should be available that allows to identify the most appropriate dataset through selection of the relevant facets of the individual requirements (e.g. parameter, resolution, and timeliness).
-
It should be possible for the data provider to continuously integrate additional datasets into this structure.
-
The system should allow a preview on the datasets combined with the possibility to directly access individual observations.
-
It should also allow to easily access the station-related metadata.
-
It should be possible to select stations based on various geographic attributes (e.g. distance, administrative units, river basins).
-
It should provide a possibility for formatted printing of selected stations. It should be possible to download packages of station data that have been combined based on various user-defined criteria (e.g. time span, region).
-
It should be possible to use the defined selection also for recurring downloads.
The new data portal of DWD's Climate Data Center is available at: https://cdc.dwd.de/portal (last access: 17 May 2019). Figure 1 shows a screenshot of the homepage. From that point users are guided to the data in different ways. Via a search function they can identify data for direct download and interactive access to station data. The interactive access mode provides graphical and tabular previews of the German station data. Generally users identify the parameters within the search page and then switch to the interactive mode from there. For frequently used parameters some directly preconfigured examples (e.g. hourly and daily station data) are available directly at the homepage, which bring the users directly to the interactive mode.

Figure 5Interactive component with one station selected in the map display area (Source: Deutscher Wetterdienst).
The search mode (see example screenshot in Fig. 2) is a “faceted search”, i.e. it allows the users to narrow down search results by applying multiple filters based on faceted classification of the items (Tunkelang, 2009). A faceted classification system classifies each element along multiple dimensions, called facets. Examples for such facets in case of our climate data are: data source, parameter class, parameter, statistical processing, temporal resolution, vertical resolution, geographical region, unit, maintenance frequency or access method. This facet-based approach allows the continuous integration of additional datasets without general modifications of the search structure. The search tools are implemented based on the open source full-text search and analytics engine “ElasticSearch” (https://www.elastic.co/products/elasticsearch, last access: 17 May 2019).
The search results contain a short abstract of the datasets together with links to the access points and more detailed documentation. Generally a dataset description in PDF (portable document format) is available. This PDF-document is generated from the internally stored metadata. Based on the same information, metadata can also be accessed in INSPIRE-compliant XML-format. The metadata-documents can also be used to provide information to other catalogues. The search results also show which access methods are available. Depending on the dataset two general options are available: Direct download via an OpenData-FTP-server or via interactive access. The interactive component of the portal is based on the WMS of the OGC. Therefore, if interactive access is available, users can also directly access the data via WMS or WFS. The information required to use these services is also displayed as part of the search results.
The implementation of the OGC-compliant data access is based on the server software “GeoServer”. GeoServer is an open-source server written in Java that allows sharing geospatial data based on the interoperability standards of the OGC. It functions as the reference implementation of the Open Geospatial Consortium “Web Feature Service” standard, and also implements the Web Map Service and Web Coverage Service. Address of the server is: https://cdc.dwd.de/geoserver (last access: 17 May 2019). Data can be directly accessed via a variety of formats within the WMS-/WFS-standards.

Figure 6Excerpt from the detailed metadata of one station (Helgoland) (Source: Deutscher Wetterdienst).
The interactive component consists of a configuration area and a map display area (Fig. 3). The map display area allows visualizing a selected time step of the dataset. Different background maps can be selected. This also allows users to zoom to a very detailed level and thereby get precise information on the station location and surrounding (Fig. 4). Individual stations can be selected, which will directly display the observed value of the active date (Fig. 5) and provide a link to detailed station metadata (see Fig. 6). Users can configure the map and download it in PNG-format (Portable Network Graphics) for further reuse. The configuration area allows users to select date and time, restrict the map display to data above/below thresholds, or to select stations based on various criteria, e.g. station height, or geographic features like administrative units, river basins, natural area (Fig. 7). Based on these selections, users can configure a download package. Depending on the total size, the data can be downloaded directly or the user will be notified by email when the package is ready for download. The package contains the data of the selected stations, together with metadata and dataset descriptions.
Users can switch from the graphical map display to a tabular display of the selected data. Here it is also possible for users to download a formatted document with the data (in PDF), which also includes the descriptions of the datasets and the map.
Many users might want to use the same configuration (e.g. selected stations and parameters) for similar downloads in the future. It is therefore possible to store a bookmark that will restore the same configuration when users are accessing it. The bookmark can also be used to provide the configuration to other users.

DWD currently implements several options to provide open access to German climate data. One component is a new interactive web portal based on OGC-compliant web services. As DWD's climate data are used in a wide variety of applications, a broad range of user requirements were identified. The current version of the portal provides several features for handling station data. Further options for gridded data are also aspired, but for the implementation of interactive access to these high-volume datasets new data base solutions have to be explored.
German station data are interactively available via: Climate Data Center: https://cdc.dwd.de/portal (Climate Data Center, 2019a). They are available for direct download: Climate Data Center – Open Data Server: https://opendata.dwd.de/climate_environment/CDC (Climate Data Center, 2019b) and are also accessible based on OGC-standards at: Climate Data Center – GeoServer: https://cdc.dwd.de/geoserver/ (Climate Data Center, 2019c). The data are freely available for unrestricted use according the German GeoNutzV (http://www.gesetze-im-internet.de/geonutzv/, Bundesministerium der Justiz und für Verbraucherschutz, 2019). Datasets used in the figures are part of the following collections: “DWD Climate Data Center (CDC): Recent daily station observations (temperature, pressure, precipitation, sunshine duration, etc.) for Germany, 2019” and “DWD Climate Data Center (CDC): Recent hourly station observations of precipitation for Germany, 2019”.
FKa wrote the manuscript with input from all authors.
The authors declare that they have no conflict of interest.
This article is part of the special issue “18th EMS Annual Meeting: European Conference for Applied Meteorology and Climatology 2018”. It is a result of the EMS Annual Meeting: European Conference for Applied Meteorology and Climatology 2018, Budapest, Hungary, 3–7 September 2018.
We would like to thank all members of our National Climate Data Center for their continued efforts to build a quality-controlled database. We thank Dirk Fuchs and Thorsten Schulz for their technical support in the development of the data portal. Two referees gave helpful comments to improve the manuscript.
This paper was edited by Renate Hagedorn and reviewed by Johannes Melles and one anonymous referee.
Bundesministerium der Justiz und für Verbraucherschutz: Verordnung zur Festlegung der Nutzungsbestimmungen für die Bereitstellung von Geodaten des Bundes, available at: http://www.gesetze-im-internet.de/geonutzv/, last access: 17 May 2019.
Climate Data Center: https://cdc.dwd.de/portal, last access: 17 May 2019a.
Climate Data Center: Open Data Server, available at: https://opendata.dwd.de/climate_environment/CDC, last access: 17 May 2019b.
Climate Data Center: GeoServer, available at: https://cdc.dwd.de/geoserver/, last access: 17 May 2019c.
Josuttis, N. M.: SOA in Practice – The Art of Distributed System Design, O'Reilly, Sebastopol, 342 pp., 2007.
Kaspar, F. and Mächel, H.: Beobachtung von Klima und Klimawandel in Mitteleuropa und Deutschland, in: Klimawandel in Deutschland – Entwicklung, Folgen, Risiken und Perspektiven, edited by: Brasseur, G. P., Jacob, D., and Schuck-Zöller, S., Springer, Berlin, Heidelberg, 17–26, https://doi.org/10.1007/978-3-662-50397-3_3, 2017.
Kaspar, F., Müller-Westermeier, G., Penda, E., Mächel, H., Zimmermann, K., Kaiser-Weiss, A., and Deutschländer, T.: Monitoring of climate change in Germany – data, products and services of Germany's National Climate Data Centre, Adv. Sci. Res., 10, 99–106, https://doi.org/10.5194/asr-10-99-2013, 2013.
Kaspar, F., Zimmermann, K., and Polte-Rudolf, C.: An overview of the phenological observation network and the phenological database of Germany's national meteorological service (Deutscher Wetterdienst), Adv. Sci. Res., 11, 93–99, https://doi.org/10.5194/asr-11-93-2014, 2014.
Kaspar, F., Tinz, B., Mächel, H., and Gates, L.: Data rescue of national and international meteorological observations at Deutscher Wetterdienst, Adv. Sci. Res., 12, 57–61, https://doi.org/10.5194/asr-12-57-2015, 2015.
Kaspar, F., Hannak, L., and Schreiber, K.-J.: Climate reference stations in Germany: Status, parallel measurements and homogeneity of temperature time series, Adv. Sci. Res., 13, 163–171, https://doi.org/10.5194/asr-13-163-2016, 2016.
Tunkelang, D.: Faceted Search. Synthesis Lectures on Information Concepts, Retrieval, and Services, Morgan and Claypool Publishers, San Rafael, 80 pp., https://doi.org/10.2200/S00190ED1V01Y200904ICR005, 2009.
World Meteorological Organization: WIGOS Metadata Standard – 2017 edition, WMO-No. 1192, Geneva, 2017.
- Abstract
- Introduction and background
- Overview of German station based observations
- Motivation and user requirements for the new data portal
- Implementation
- Summary and conclusions
- Data availability
- Author contributions
- Competing interests
- Special issue statement
- Acknowledgements
- Review statement
- References