Articles | Volume 17
https://doi.org/10.5194/asr-17-105-2020
22 Jun 2020
 | 22 Jun 2020

Wind: generating power and cooling the power lines

Marko Kaasik and Sander Mirme
Abstract

The electric power that can be transmitted via high-voltage transmission lines is limited by the Joule heating of the conductors. In the case of coastal wind farms, the wind that produces power simultaneously contributes to the cooling of high-voltage overhead conductors. Ideally this would allow for increased power transmission or decreased dimensions and cost of the conductor wires. In this study we investigate how well the wind speed in coastal wind farms is correlated with wind along a 75 km long 330 kW power line towards inland. It is found that correlations between wind speed in coastal wind farms at turbine height and conductor-level (10 m) are remarkably lower (R=0.39–0.64) than between wind farms at distances up to 100 km from each other (R=0.76–0.97). Dense mixed forest surrounding the power line reduces both local wind speed and the correlations with coastal higher-level wind, thus making the cooling effect less reliable.

Dates
1 Introduction

Since country's rapid industrialization under Soviet rule, which took place in 1950's and 1960's, most of electric energy in Estonia is produced from oil shale, a fossil fuel mined in the small area in north-eastern part of the country. The thermal power plants (total nominal capacity about 2 GW) located nearby, produce still more than 80 % of country's electric energy (Holmgren et al., 2019). However, an increasing amount of electric energy is produced in wind farms in the coastal zone. Due to best wind conditions, numerous wind farms are located at the western coast and islands of Estonia, roughly 300–400 km away from the oil-shale mining and energy production region. Thus, the existing network of high-voltage transmission lines, which connect the thermal power plants with industrial centres and most populous cities, poses a challenge to development of wind farms in the west of Estonia, where power lines have been designed for supply of existing villages and small towns only.

Obviously, big investments into transmission lines are needed in next decades, to facilitate the transition of Estonia to renewables, in which the coastal and open sea wind farms are expected to dominate. One of the main constraints to the electrical power to be transmitted through a line is the Joule heating of conductor due to its resistance, which can in worst case result in too big and potentially irreversible deformation of the conductor. Thus, permissible limits for heat-up of conductor must be strictly followed.

https://asr.copernicus.org/articles/17/105/2020/asr-17-105-2020-f01

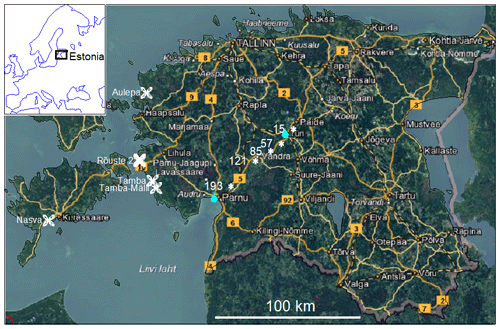
Figure 1Coastal wind farms (white turbine images with site names), and wind measurement site at power line (withe asterisks with pole numbers indicated) in the map of Estonia. The meteorological observation stations Pärnu (costal) and Türi (inlnd) are indicted with light-blue drops. Base map: Land Board of Republic of Estonia (https://xgis.maaamet.ee/xgis2/page/app/maainfo, last access: 19 June 2020).

Stronger winds, however, increase the power output of the wind farms and on the other hand, are expected to improve the heat dissipation of power lines, thus enabling more power to be transmitted. According to Morgan (1982) the convective heat loss of a power line per unit length Pc is calculated as

(1) P c = λ f T s - T a N u

where λf is thermal conductivity of air, Ts and Ta are the temperatures of conductor surface and ambient air, respectively, and Nu is the Nusselt number. In case of wind-forced convective cooling the Nusselt number expresses through Reynolds number Re as

(2) N u = B 1 ( R e ) n

where coefficient B1 varies from 0.02 to 0.8, depending on Re and power index n=0.28 to 0.80, depending on surface properties of conductor. As Re depends linearly on wind speed, the Nusselt number (Eq. 2) and thus, the 
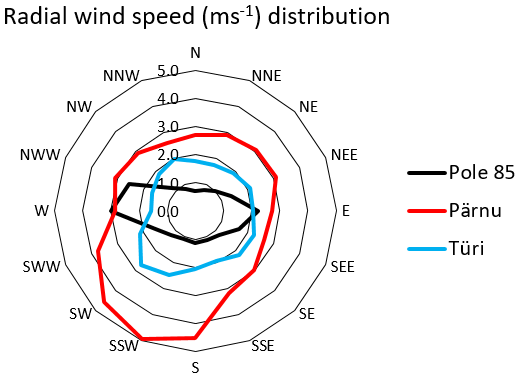
convective heat loss (Eq. 1) varies several orders of magnitude in non-extreme wind speed range of 0.5 to 5 m s−1 at typical conductor 
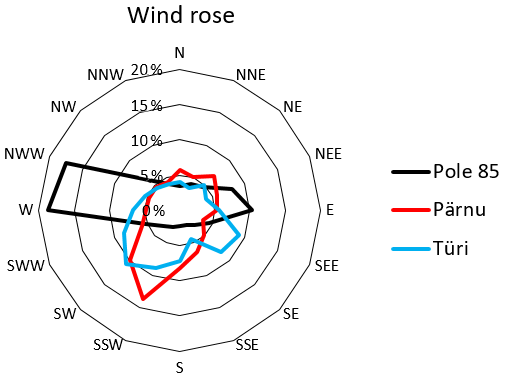
height 10 m above the surface. The wind direction is another important parameter for cooling, as heat loss is about twice larger in case of wind perpendicular to the conductor, than when blowing along it. In still condition (wind weaker than 0.5 m s−1) the convective heat loss is determined by turbulence. Thus, wind is an important factor, determining the transmission capacity of a power line.

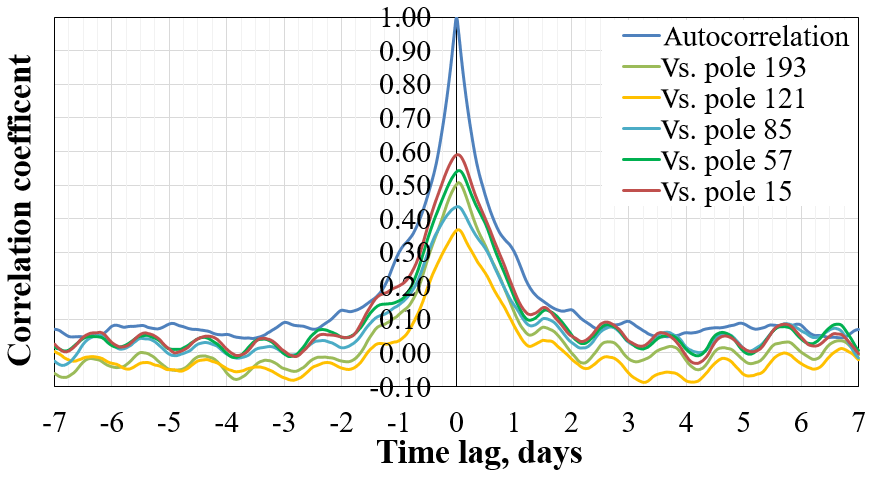
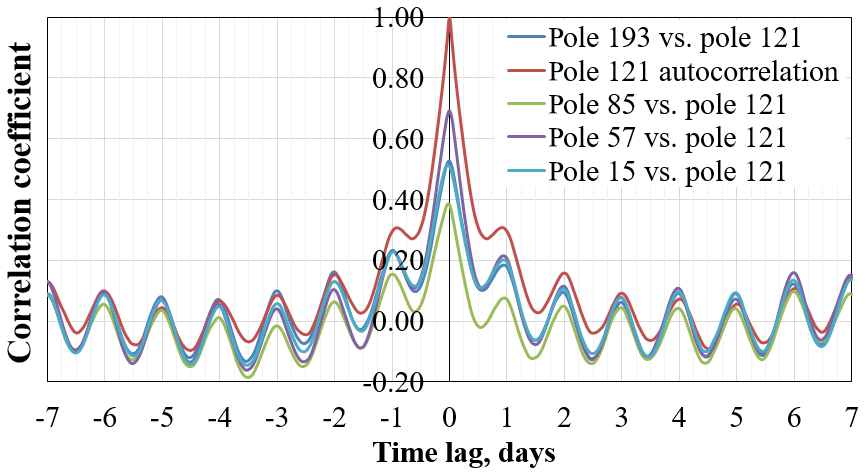
The aim of this study is to clarify, how well the wind speed along a power line from coast to inland is correlated with wind generating power at coastal area and how frequent are the unfavourable conditions, when despite strong wind generating power at coastal zone, the inland wind is rather weak, thus conditioning the dangerous heating of transmission line. This knowledge helps to dimension the power lines optimally, considering both the building costs and profit losses due to possible limiting of power production in unfavourable wind conditions.

2 Measurement method

2-dimensional sonic anemometers Vaisala WMT 700 were installed in five poles of a 330 kV transmission line at average height of conductor wires (10 m), at distances 15–75 km from seafront (see Figs. 1 and 2). The poles were selected to represent the worst heat dissipation (lowest wind) conditions. Thus, poles, except number 15, are located closer than 50 m to dense, 20–30 m high coniferous forest. The equipment was powered by specially installed solar panels in line poles, as no solution was found to use high-voltage power for 24 V (12 W) supply. Measurements were carried out through 18 consecutive months, from 9 December 2017 to 12 June 2019.

https://asr.copernicus.org/articles/17/105/2020/asr-17-105-2020-f02

Figure 2Installation of sonic anemometers in power line poles and Vaisala WMT 700 sensor head zoomed.

Download

Output was recorded at one-second time step and averaged for 5 min intervals, to compare with wind speed measurements in coastal wind farms. Simultaneous 5 min wind speed and direction data from turbine heights from 6 coastal wind farms were supplied by Elering AS, the national power line network company of Estonia. Locations of wind farms are indicated in Fig. 1 (close locations of Rõuste and Rõuste 2 farms are not resolved).

3 Results and discussion

3.1 Wind speeds: line poles vs. wind farms

Average wind speeds and standard deviations measured in line poles, in comparison with two observation stations, Pärnu (costal) and Türi (inland) of Estonian national weather service near the power line are presented in Table 1. The statistics of average wind speed of 6 coastal wind farms (see Fig. 1) are shown as well. The correlation coefficients are shown for each line pole station with simultaneous 5 min wind speed averaged for 6 coastal stations. As weather observation stations give hourly averages only, the correlations with these are not shown. Correlations between wind speeds measured in six coastal wind farms are rather high, varying from 0.76 to 0.97, thus taking average speed of wind farms for easier comparison is justified. Correlations between wind speeds measured in poles are 0.35–0.67, i.e. in the same order with correlation pole – wind farms correlations. Correlations shown in Table 1 correspond roughly to correlations found between wind power generation capacities at distances of 400–800 km in Europe-wide study, whereas correlations found between coastal wind farms correspond well to expected values at distances up to 100 km (Malvaldi et al., 2017).

Table 1Averages and standard deviations of wind speeds through the observation period. Linear correlation coefficients are given only for 5 min averages, not for weather station (hourly) data.

Download Print Version | Download XLSX

As expected, the winds measured in poles in forested area vary a lot and are weaker than in both weather stations Pärnu and Türi, which are located in open landscape according to observation standard. In pole 15 (on the top of hill in a half-open site) the winds are even stronger than in nearby Türi weather station. It is remarkable that in pole 15 the wind speed correlates better with coastal wind farms than in any of poles located closer to the sea, indicating that microclimate affects a lot the wind regime in forested areas. Indeed, the wind rose (Fig. 3) and radial wind speed distribution (Fig. 4) in pole 85 (hilly, forested landscape) show heavy directional distortions in respect to standard observations.

https://asr.copernicus.org/articles/17/105/2020/asr-17-105-2020-f03

Figure 3Wind rose in pole 85 compared to hourly weather observation data from Pärnu and Türi weather stations.

Download

https://asr.copernicus.org/articles/17/105/2020/asr-17-105-2020-f04

Figure 4Directional wind speed distribution in pole 85 compared to hourly weather observation data from Pärnu and Türi weather stations.

Download

3.2 Cross-correlations

Cross-correlation and autocorrelation functions are used for more insight into propagation and periodicity of wind pattern.

Cross-correlations of wind speeds in line poles and in central wind farm Rõuste 2 in first 6 h are much lower than its autocorrelation (Fig. 5). It was found that cross-correlations between Rõuste 2 and poles are almost constant during a few first hours and maximal cross-correlation is not instantaneous, but delayed by about 2 h, when moving from the coastal to inland sites. Rather similar relaxation of cross-correlation curves (however, without oscillations) have been found between Ireland and Great Britain, at distances of several hundreds of kilometers from each other (Malvaldi et al., 2017).

https://asr.copernicus.org/articles/17/105/2020/asr-17-105-2020-f05

Figure 5Autocorrelation of wind speed in Rõuste 2 wind farm and cross-correlations of Rõuste 2 vs. line pole stations in one-week time scale.

Download

In scale of several days, the cross-correlations between wind speeds in poles and Rõuste 2 wind farm oscillate remarkably in nearly opposite phase with diurnal cycle. This phenomenon is not fully understood, but may be attributed to the sea-land breeze cycle. On the other hand, cross-correlations between wind speeds in different poles oscillate in diurnal cycle, which is not shifted (Fig. 6) – a phenomenon widely known (e.g. Filik and Filik, 2017). No remarkable differences between autocorrelation and cross-correlation functions exist in second and later days. Thus, the general features of continental surface layer seem to dominate over site-specific conditions in locations of poles.

https://asr.copernicus.org/articles/17/105/2020/asr-17-105-2020-f06

Figure 6Autocorrelation of wind speed in line pole 121 and its cross-correlations with wind speeds in other line pole stations.

Download

No remarkable oscillations are found in autocorrelation and cross-correlations of wind speeds in coastal farms – likely the large-scale wind patterns are dominating over diurnally variable conditions.

It was found that extremely poor heat dissipation conditions occur sometimes, in specific weather pattern: hot and low-wind summertime anticyclone staying at continental area of north-eastern Europe and cyclone approaching slowly from Baltic sea, thus causing strong wind at coast and islands. Such a situation lasts usually for 12–24 h, in extreme cases up to three days.

4 Conclusions

The power line cooling effect of wind along the inland power line is remarkably correlated with power-generating coastal wind, but occasionally emerging unfavourable weather patterns must be considered in designing and operating the power lines. Dense mixed forest surrounding the power line reduces both local wind speed and the correlations with coastal higher-level wind, thus making the cooling effect less reliable.

Data availability

Data are available on request. Contact: Sander Mirme (sander.mirme@ut.ee).

Author contributions

MK authored the basic idea of research, processed the data and wrote most of this article. SM designed the experimental setup, data transfer and storage.

Competing interests

The authors declare that they have no conflict of interest.

Special issue statement

This article is part of the special issue “19th EMS Annual Meeting: European Conference for Applied Meteorology and Climatology 2019”. It is a result of the EMS Annual Meeting: European Conference for Applied Meteorology and Climatology 2019, Lyngby, Denmark, 9–13 September 2019.

Acknowledgements

Authors thank Priit Somelar for technical assistance.

Financial support

This research is funded by Elering AS, the Estonian national high voltage transmission network company (grant no. LLTFY17379).

Review statement

This paper was edited by Sven-Erik Gryning and reviewed by two anonymous referees.

References

Filik, T. and Filik, Ü. B.: Very short term wind speed forecasting using multivariable dense data with WLS-Marma Model, Energ. Proced., 107, 259–263, https://doi.org/10.1016/j.egypro.2016.12.145, 2017. 

Holmgren, S., Pever, M., and Fischer, K.: Constructing low-carbon futures? Competing storylines in the Estonian energy sector's translation of EU energy goals, Energ. Policy, 135, 111063, https://doi.org/10.1016/j.enpol.2019.111063, 2019. 

Malvaldi, A., Weiss, S., Infield, D., Browell, J., Leahy, P., and Foley, A. M.: A spatial and temporal correlation analysis of aggregate wind power in an ideally interconnected Europe, Wind Energy, 20, 1315–1329, https://doi.org/10.1002/we.2095, 2017. 

Morgan, V. T.: The thermal rating of overhead-line conductors. Part I. The steady-state thermal model, Elect. Power Syst. Res., 5, 119–139, https://doi.org/10.1016/0378-7796(82)90033-5, 1982. 

Download
Short summary
In the case of coastal wind farms, the wind that produces power simultaneously contributes to the cooling of high-voltage overhead conductors. Ideally this would allow for increased power transmission or decreased dimensions and cost of the conductor wires. In this study we investigate how well the wind speed in coastal wind farms is correlated with wind along a 75 km long 330 kW power line towards inland.