 | 14 Jul 2020
Performance of CAMS Radiation Service and HelioClim-3 databases of solar radiation at surface: evaluating the spatial variation in Germany
Mathilde Marchand
Yves-Marie Saint-Drenan
Laurent Saboret
Etienne Wey
Lucien Wald
The present work deals with the spatial consistency of two well-known databases of solar radiation received at ground level: the CAMS Radiation Service database version 3.2, abbreviated as CAMS-Rad and the HelioClim-3 database version 5, abbreviated as HC3v5. Both databases are derived from satellite images. They are validated against 10 min means of irradiance for the period 2010–2018 recorded in a network of 26 ground stations in Germany operated by the Deutscher Wetterdienst (DWD). For the CAMS-Rad database, the correlation coefficient between ground measurements and estimates ranges between 0.83 and 0.92 for all sky conditions. The bias ranges from −41 and 32 W m−2 (−11 % and 10 % of the mean irradiance). The standard deviation ranges between 89 and 129 W m−2 (25 % and 39 %). For the HC3v5 database, the correlation coefficient ranges between 0.90 and 0.95. The bias and the standard deviation are comprised between −22 and 16 W m−2 (−6 % and 5 %), and between respectively 70 and 104 W m−2 (20 % and 31 %). For the CAMS Rad database, overestimation is observed in the South, and underestimation in the North with a faint tendency of the bias to increase from East to West. For the HC3v5 database, the bias is fairly homogeneous across Germany. For both databases, there is no noticeable spatial trend in the standard deviation.
- Article
(355 KB) - Full-text XML
- BibTeX
- EndNote


The density of power received from the sun on a horizontal surface at ground level per unit surface is called the surface solar (or shortwave) downward irradiance and is abbreviated as E. It is an essential variable in many fields such as renewable energy (Ranchin et al., 2020), architecture (Leloux et al., 2012; Rotar and Badescu, 2011), weather and climate (Abdel Wahab et al., 2009; Bojinski et al., 2014; Blanc et al., 2011; Müller et al., 2015), ocean (Bell et al., 2009), agriculture (Bois et al., 2008; Roerink et al., 2012), forestry (Colombo et al., 2009), ecology (Wagner et al., 2012), or human health (Juzeniene et al., 2011).
An obvious means of estimating E is by using ground-based instruments, and especially thermopile-based pyranometers. However, careful maintenance and regular calibration are required to have accurate measurements. There are a limited number of such high-quality devices. They can thus not address the need to assess E at any place and at any time. Other means of estimating E are exploited to compensate the lack of this type of instrument. Global meteorological reanalyses exist that go back several decades in time such as ERA-Interim, ERA5, MERRA, and MERRA-2 (Hersbach and Dee, 2016; Rienecker et al., 2011; Molod et al., 2015). However, several works have shown that the estimates of E from these reanalyses have significantly lower accuracy than those from satellite-based databases (Bengulescu et al., 2017; Boilley and Wald, 2015; Jones et al., 2017; Trolliet et al., 2018; Zhang et al., 2016). In particular, these authors have reported that reanalyses often exhibit cloudy conditions when the actual conditions are cloud-free and vice versa.
Satellite images are less prone to this kind of error since they are based on a direct observation of the cloud coverage. They have been successfully used in the past decades (Amillo et al., 2014; Janjai et al., 2009, 2011; Lefèvre et al., 2014; Müller et al., 2015). Several databases have been constructed from images acquired by the Meteosat series of satellites. They offer synoptic views of Europe, Africa and the Atlantic Ocean since 1983 with a spatial resolution of approximately 3 km at nadir and a temporal frequency of 30 min for the first generation of Meteosat satellites and 15 min for the second generation. This article deals with two of these satellite-derived databases of E: the CAMS Radiation Service, abbreviated as CAMS-Rad and part of the Copernicus Atmosphere Monitoring Service (CAMS), and the HelioClim-3 version 5, abbreviated as HC3v5. Both databases are available online (http://www.soda-pro.com, last access: 29 June 2020) and are used by several hundred academics and engineers each year (Thomas et al., 2016a). Many validations have been performed and are still being performed to supply users with the most complete knowledge of the accuracy of each database. For example, validation is performed every quarter that compares ground-based measurements made at several stations in Europe, Africa and South America to E estimated by the CAMS Radiation Service. A report is published and made available on-line at https://atmosphere.copernicus.eu/supplementary-services (last access: 1 May 2020). Joint validations of the two databases have also been performed for various climates in Europe (Thomas et al., 2016b) and for more specific geographical regions, such as the tropical Atlantic Ocean (Trolliet et al., 2018), Brazil (Thomas et al., 2016a), Egypt (Eissa et al., 2015), Iraq (Ameen et al., 2018), Morocco (Marchand et al., 2018), Oman (Marchand et al., 2017), and The Netherlands (Marchand et al., 2019). The present work adds to the continuous documentation of these two databases and demonstrates that both databases capture the temporal and spatial variability of E and are reliable sources of solar radiation data. This study focuses on the verification of the spatial consistency of both databases using a network of measuring stations in Germany. With an installed capacity of 47.5 GW, Germany is one of Europe's largest users of solar energy and there is a local need to better know the performances of solar plants according to their location. This article addresses the question of how the accuracy of the satellite-derived estimates varies across Germany. The use of a dense network of measuring stations offers a cartographic approach to better understand the spatial structure of errors and then provide explications of error sources.
The stations and their measurements are described in Sect. 2. CAMS-Rad and HC3v5 are described in Section 3. Results are presented in Sect. 4 and discussed in Sect. 5. Section 6 “Conclusions and perspectives” concludes the article.
Germany's national meteorological service, the Deutscher Wetterdienst (DWD), operates a dense network of stations measuring global and diffuse irradiance on a horizontal surface across Germany. The measurements are publicly available on ftp://opendata.dwd.de/climate_environment/CDC/ (last access: 25 November 2019). We have downloaded the 10 min averages of global irradiance, noted E hereafter, for the period 2010–2018 (nine years).
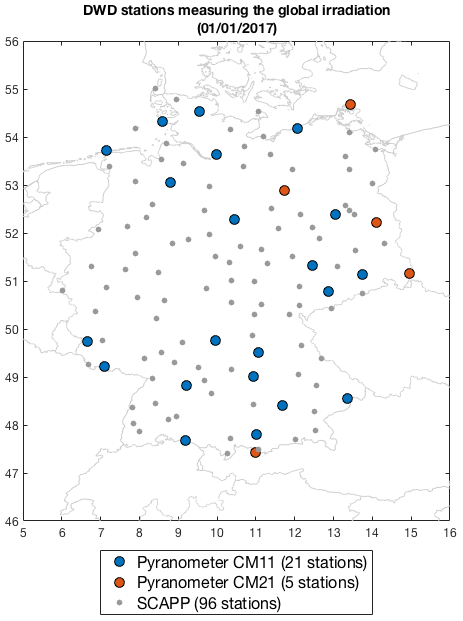
Figure 1Map of the DWD stations measuring the global radiation valid on 1 January 2017.
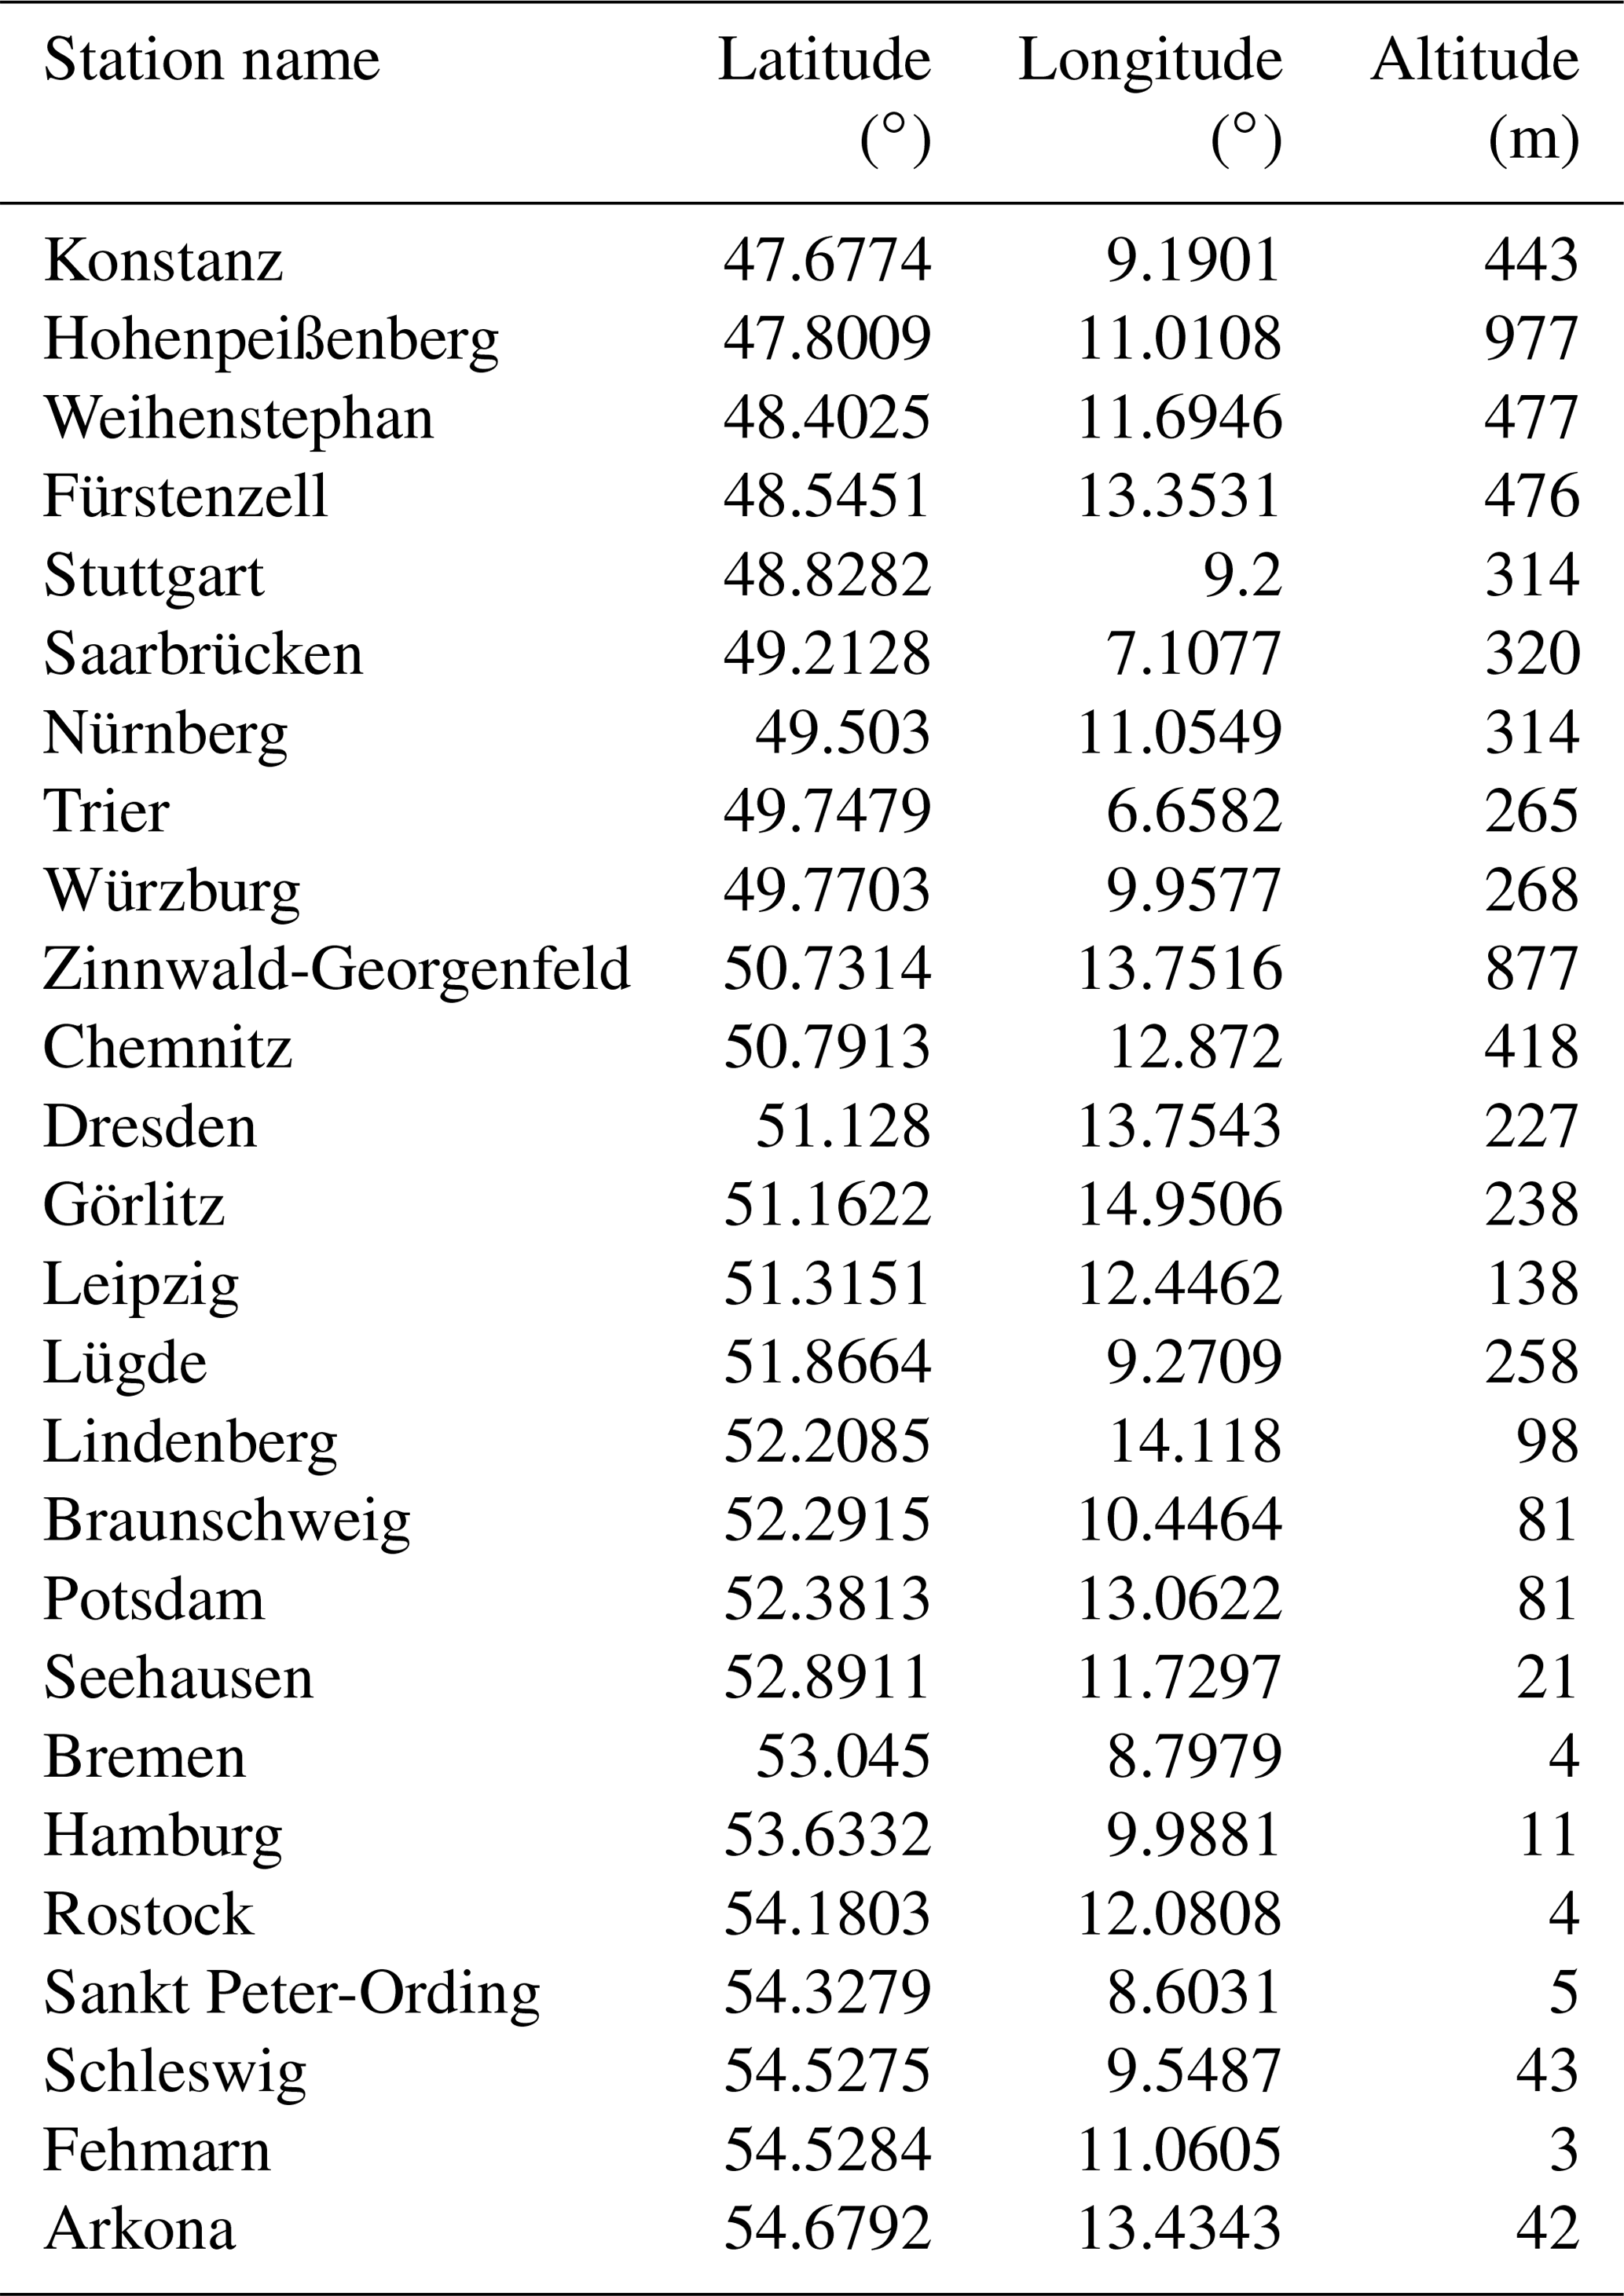
Figure 1 exhibits a map of the 122 stations measuring global radiation, as of 1 January 2017. Blue dots represent the Kipp and Zonen CM-11 pyranometers (21 stations), red dots represent the Kipp and Zonen CM-21 pyranometers (5 stations), and grey dots represent the SCAnning Pyrheliometer/Pyranometer (SCAPP) (96 stations). Behrens and Grewethe (2005) have performed a comparison of SCAPP measurements against those from a high quality CM-22 pyranometer at Lindenberg (Germany). They concluded that the measurements from the SCAPP instruments are frequently too low compared to pyranometers when E is less than 75 W m−2. Accordingly, we have chosen to use only the 26 stations equipped with CM-11 and CM-21 pyranometers. The stations from North to South are: Arkona, Fehmarn, Schleswig, Sankt Peter-Ording, Rostock, Hamburg, Bremen, Seehausen, Potsdam, Braunschweig, Lindenberg, Lüdge, Leipzig, Görlitz, Dresden, Chemnitz, Zinnwald-Georgenfeld, Würzburg, Trier, Nürnberg, Saarbrücken, Stuttgart, Fürstenzell, Weihenstephan, Hohenpeissenberg, and Konstanz. The elevation of the stations ranges between 3 m for Fehmarn and 977 m for Hohenpeissenberg. Geographical coordinates and elevations are given in Table 1.
Germany has three different climates according to the Köppen-Geiger climate classification by Peel et al. (2007):
-
Cfb for the western part: a temperate climate, without a dry season and warm summer;
-
Dfb for the eastern part: a cold climate without a dry season and warm summer;
-
Dfc for a few zones: a cold climate without a dry season and cold summer.
Time series of E were quality-checked following the procedure in Korany et al. (2016). The automatic procedure checks whether the measurements exceed physically possible and extremely rare limits and flags suspicious or erroneous measurements. Then, a visual check is performed on the results to flag other outliers and data are eventually stored with their flags for subsequent analysis. Only non-suspicious data were retained in this work. In addition, we have put one more constraint on measurements. Since the lowest values can be noise and are therefore insignificant in a validation process, any measurement should be greater than a minimum significant value. If it is not, the measurement is removed from the dataset. The threshold was selected in such a way such that there is a 99.7 % chance that the actual irradiance E is significantly different from 0 and that it can be used for the comparison. It is set to 1.5 times the uncertainty of measurements of moderate quality as reported by the WMO (2018), and is equal to 75 W m−2. Figure 2 shows the average of the measurements for the period 2010–2018 at each station. The average of E obtained for the different stations ranges between 330 and 370 W m−2, with the southern stations exhibiting the greatest averages.
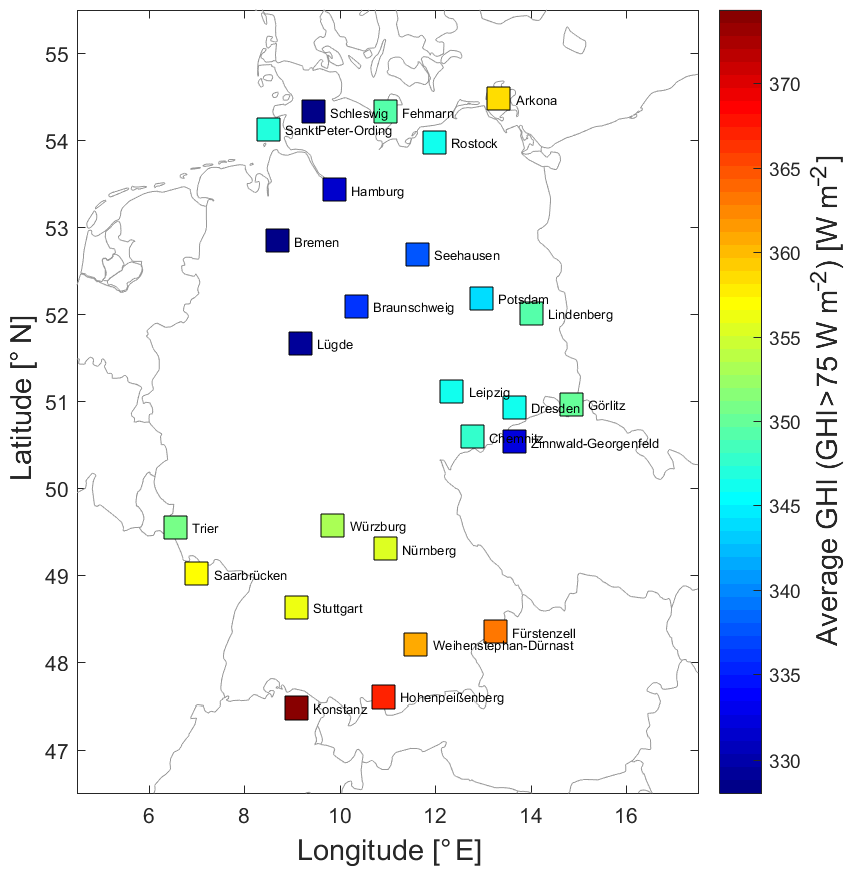
Figure 2Map of the average for the period 2010–2018 of the 10-min average of irradiance (GHI) at the 26 selected stations.
The measurements were used as a reference against satellite-derived estimates. The validation was performed for E under all sky-conditions. Differences were obtained by subtracting measurements from the satellite-derived estimates so that a positive value of the bias (mean of the differences) corresponds to an overestimation and a negative value to an underestimation. They were summarised by the bias and their standard deviation. In addition, the correlation coefficients between the measurements and the estimates were computed.
The Meteosat second generation (MSG) satellites provide synoptic views of the clouds and other phenomena over Europe, Africa and Atlantic Ocean to the meteorological community. They are operated by EUMETSAT, an international agency based in Germany. MSG has a multispectral imager SEVIRI comprising of 12 channels, enabling an accurate depiction of cloud properties. Images are acquired every 15 min, and the spatial resolution is 3 km at nadir. Both the HC3v5 and the CAMS-Rad datasets are constructed by processing images acquired by the MSG satellites since their operational inception in February 2004.
For HC3v5 the radiances of the two narrow visible bands of SEVIRI at 600 and 800 nm are combined to produce broadband radiances (Cros et al., 2006). Then, the Heliosat-2 method combined with the ESRA clear-sky model (Rigollier et al., 2000) is applied to these broadband radiances to yield estimates of the solar irradiance (see details in Rigollier et al., 2004 and Lefèvre et al., 2007). A clear-sky model is a model that estimates the solar irradiance at ground level in cloud-free conditions. The clear-sky irradiance is multiplied by a cloud index derived from the satellite images. The cloud index is computed at each instant by comparing the observed radiance to that which should be observed if the sky were cloud free; it quantifies the extinction due to the possible presence of clouds. Since its inception in February 2004, several versions of HelioClim-3 have been created to improve its performances. The most recent version is the fifth, shortened to HC3v5. The main innovation in HC3v5 is the introduction of a correction factor (Qu et al., 2014) using the very accurate CAMS McClear clear-sky model (Gschwind et al., 2019; Lefèvre et al., 2013) with inputs on aerosols, and atmospheric column content in ozone and water vapour from CAMS. HC3v5 time series of data are obtained from the SoDa web site (http://www.soda-pro.com, last access: 20 December 2019). This website is managed by both Transvalor and MINES ParisTech and is dedicated to the provision of data for different solar related applications (Gschwind et al., 2006).
The CAMS-Rad Service is based on the Heliosat-4 method (Qu et al., 2017). Unlike Heliosat-2, the Heliosat-4 method does not use the concept of cloud index. It is based on the approximation of Oumbe et al. (2014) who have shown that the global irradiance at ground level under all-sky conditions can be accurately approximated by the product of the global irradiance in clear-sky conditions, and a factor depending on the solar zenithal angle, cloud properties and ground reflective properties. This factor is termed “clear-sky index” and sometimes “cloud modification factor”. The same approximation holds for the direct component of the solar radiation. In Heliosat-4, the cloud-free irradiance is given by the McClear model with CAMS atmospheric constituents as inputs (Gschwind et al., 2019; Lefèvre et al., 2013). The SEVIRI images are routinely processed by the German Aerospace Center (DLR) using the APOLLO method (see Qu et al., 2017), yielding cloud properties that are input to Heliosat-4 to compute the clear-sky index. Other inputs are the solar zenithal angles computed by the Solar Geometry 2 algorithm (Blanc and Wald, 2012) and the dataset of Blanc et al. (2014) of the bidirectional reflectance distribution function of the ground derived from MODIS dataset. By construction, the CAMS Radiation Service runs the Heliosat-4 method on-the-fly at the request of any user. It processes the necessary information and does not create a proper database of the results. It follows that the CAMS-Rad database is a live collection of data and may be corrected a posteriori as flaws or drawbacks are discovered, yielding several versions that apply from now on back to 1 February 2004. For example, the McClear and further, the CAMS-Rad Service, benefits from successive improvements in the assessment of aerosol optical depth by CAMS (Gschwind et al., 2019). CAMS-Rad v3.2 is the most recent version.
Both methods compute the irradiance at the time of the observation of a given pixel every 15 min. By dividing the irradiance by the corresponding irradiance at the top of the atmosphere, the clearness index KT is obtained every 15 min. A linear interpolation between two successive values of KT yields a series of KT every 1 min. These 1 min values can be summed up to yield 10 min averages of clearness index KT. Then, by multiplying by the 10 min average of the irradiance at the top of atmosphere on a horizontal surface E0, the 10 min irradiance E is obtained. These operations are performed automatically by the SoDa website, from which we have obtained CAMS-Rad and HC3v5 time series of 10 min mean irradiance E for the twenty-six selected stations in Germany. These time-series also contain the 10 min irradiance at the top of atmosphere on a horizontal surface, E0.
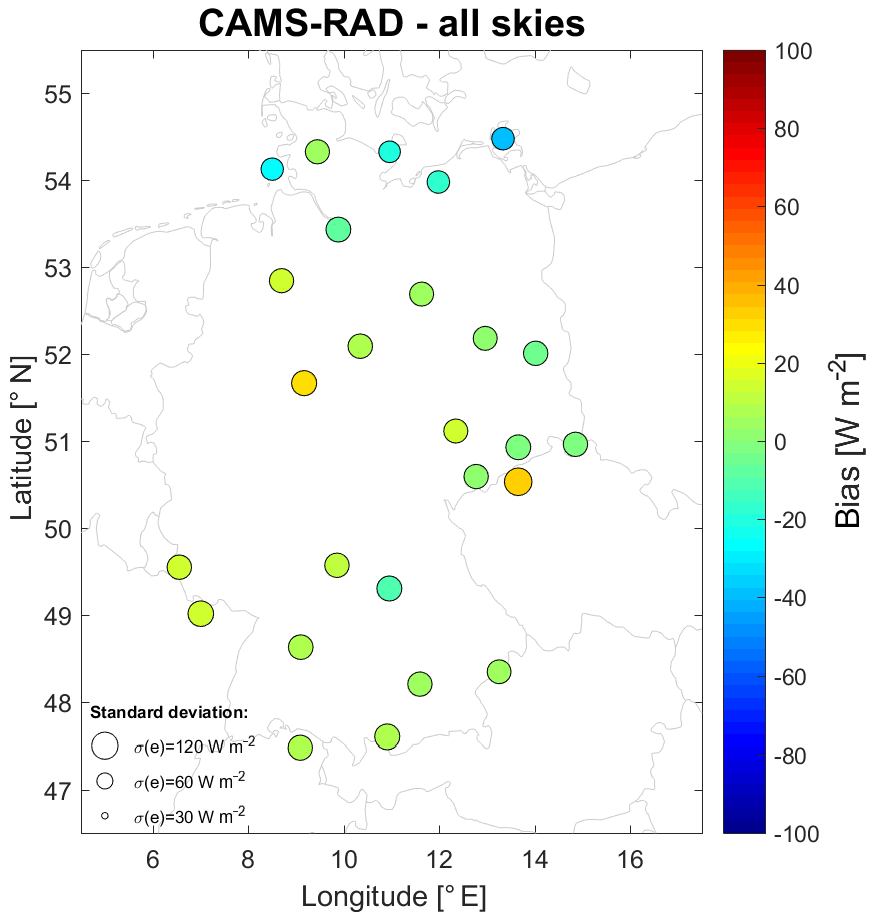
Figure 3Map of the bias (colour) and standard deviation (diameter of circle) for CAMS-Rad for all skies conditions at the 26 selected stations.
Figure 3 exhibits the bias and the standard deviation for the CAMS Rad database for all-sky conditions. The bias is coded by the colour in the circle, while the standard deviation is given by the diameter of the circle. Table 2 reports the correlation coefficients. The bias ranges between −41 and 32 W m−2 (−11 % and 10 %) with an average of 2 W m−2 (1 %). The standard deviation ranges between 89 and 129 W m−2 (25 % and 39 %) with an average of 107 W m−2 (31 %). This metric represents the scattering of the differences between ground measurements and estimates around the bias. The correlation coefficients range between 0.83 and 0.92.
Table 2Correlation coefficients for CAMS Rad and HC3v5 for all-skies, clear-sky and overcast conditions.
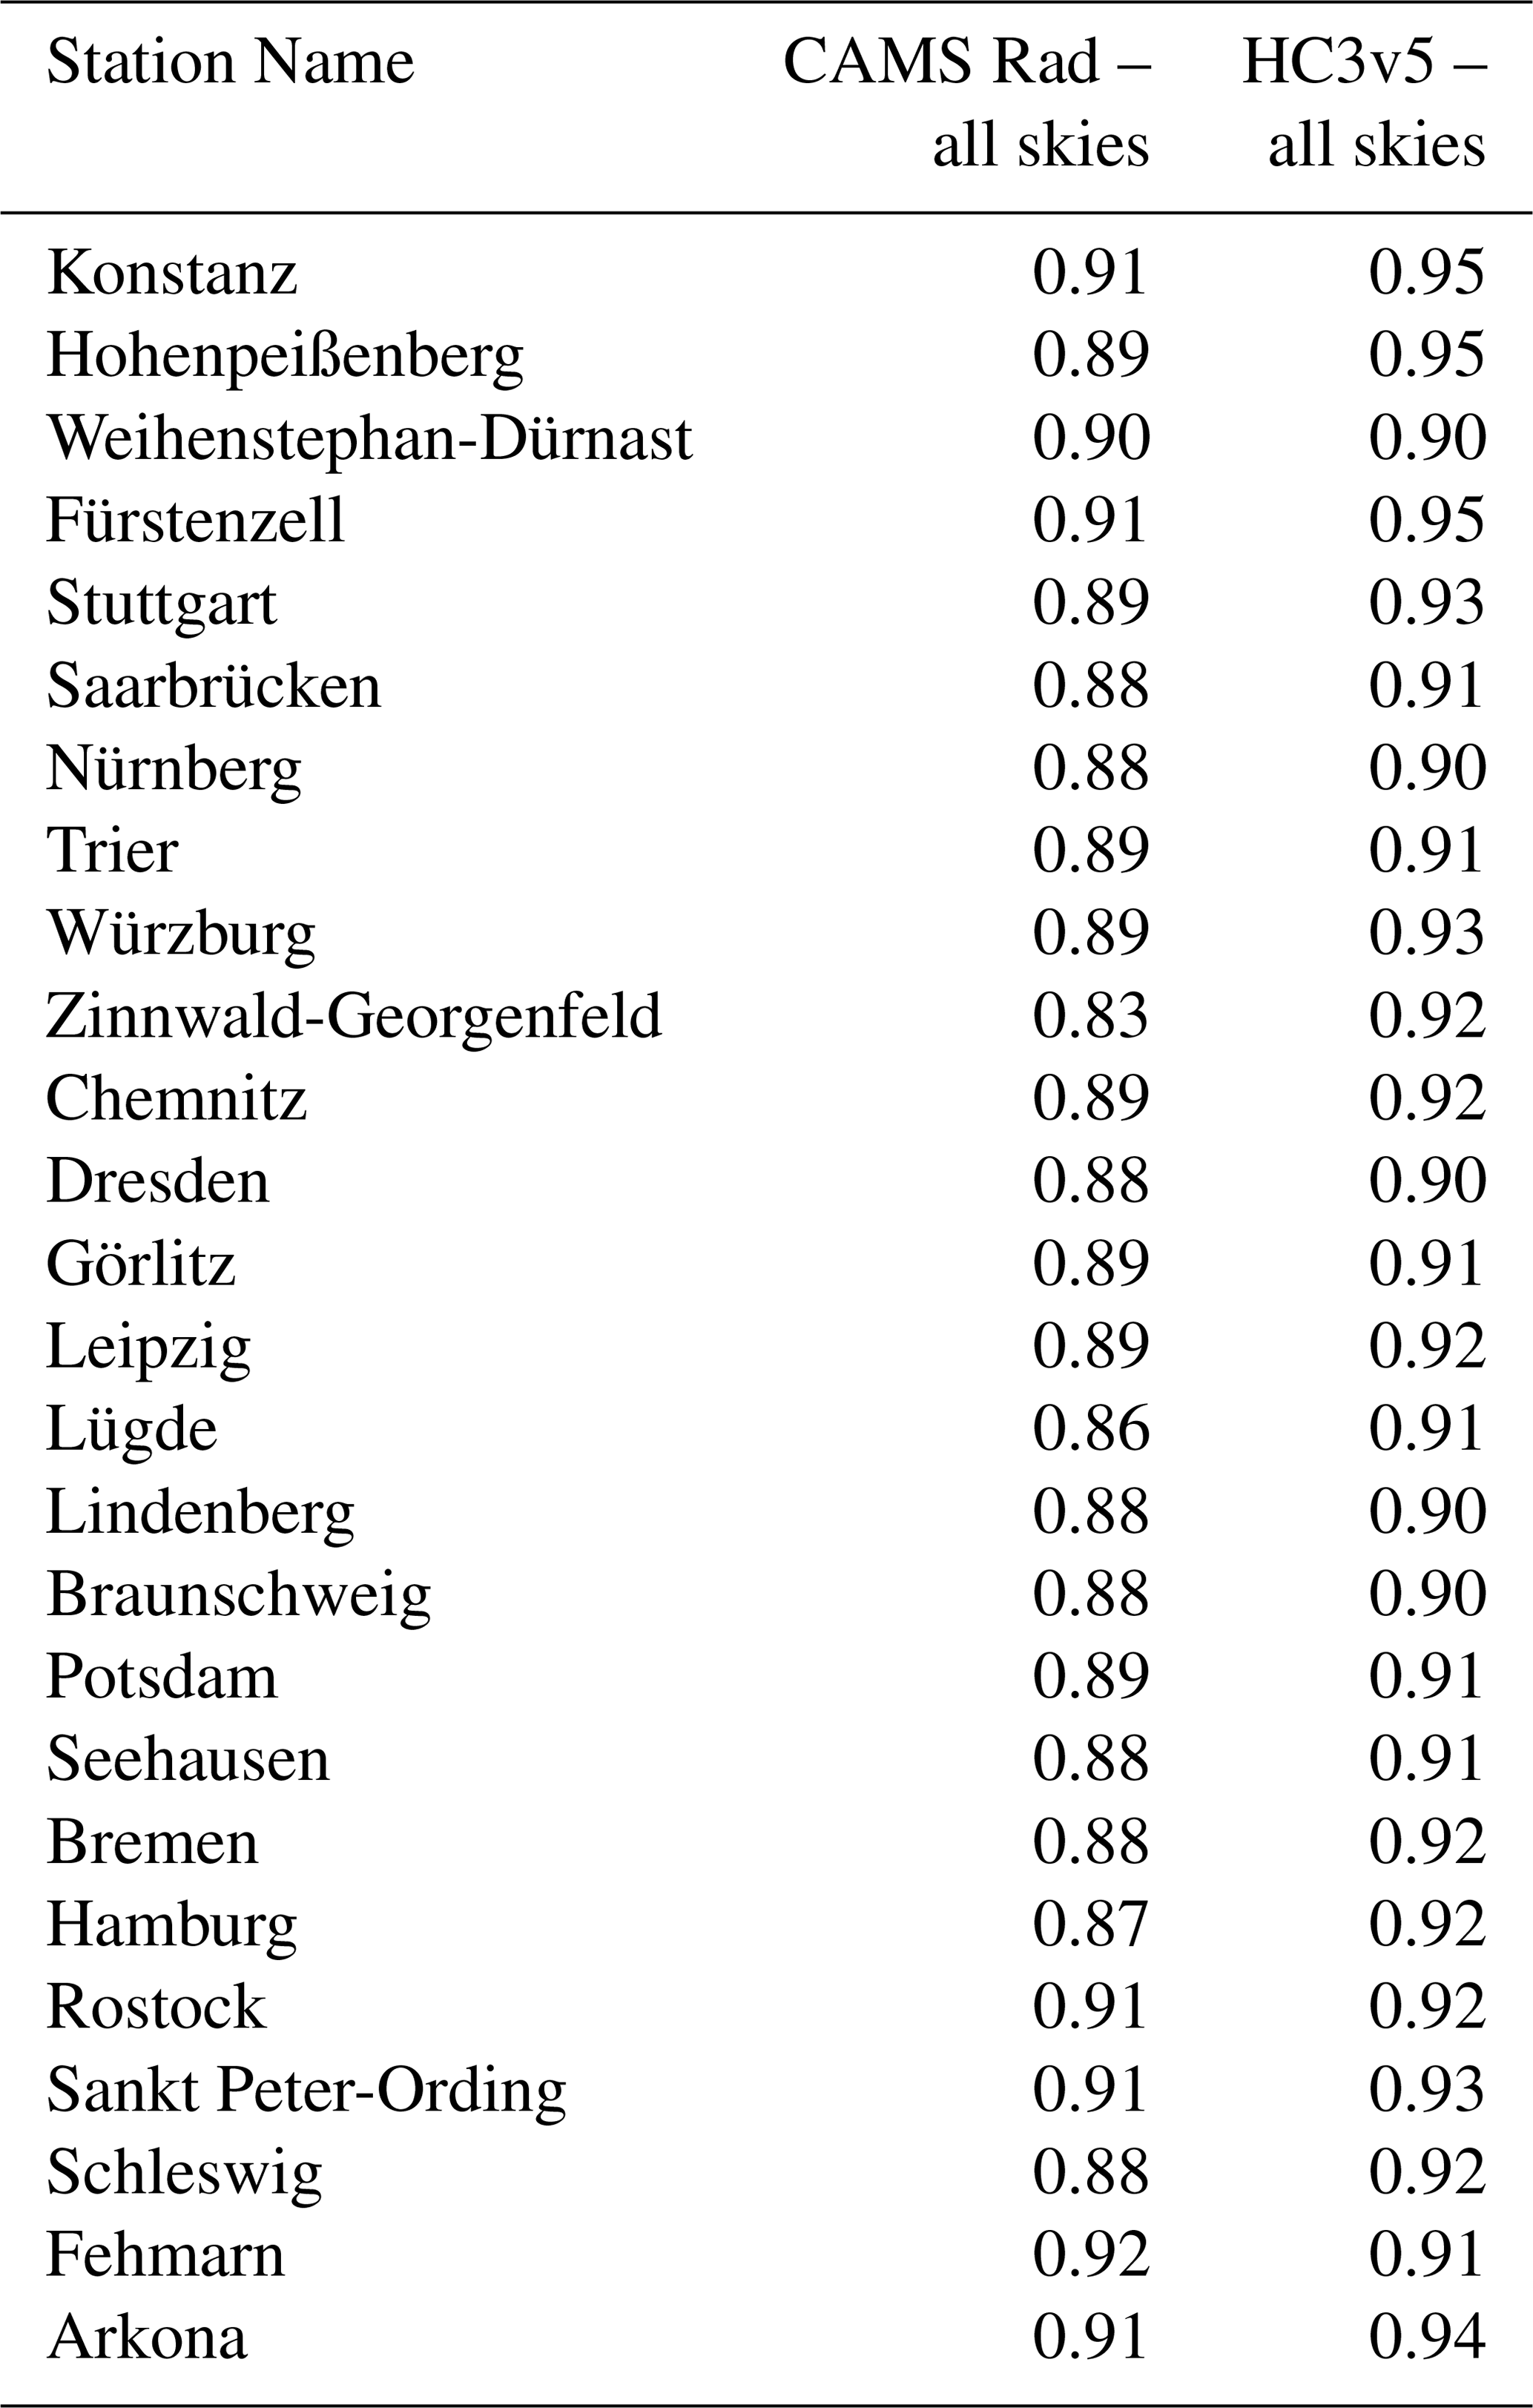
The same results were obtained for two classes of clearness index: KT > 0.7 (cloud-free and low cloudiness conditions – a high value of KT can correspond to clear skies with possible small broken clouds or thin cirrus clouds), and KT < 0.2 (overcast conditions). For cloud-free conditions, there is an underestimation at all sites. The bias ranges between −101 W m−2 (−16 % of the mean value of E for these conditions) and −55 W m−2 (−8 %). The standard deviation is much less than for all sky conditions: it ranges from 71 to 101 W m−2 for cloud free conditions, compared to 89 and 129 W m−2 for the whole dataset. The correlation coefficient is between 0.85 and 0.94. For overcast conditions, on the contrary, the bias for overcast conditions is always positive (overestimation). It ranges between 56 W m−2 (49 %) and 131 W m−2 (109 %). The standard deviation ranges from 78 to 142 W m−2, and the correlation coefficient from 0.43 to 0.56. Resulting maps and tables are not shown here for the sake of available space.
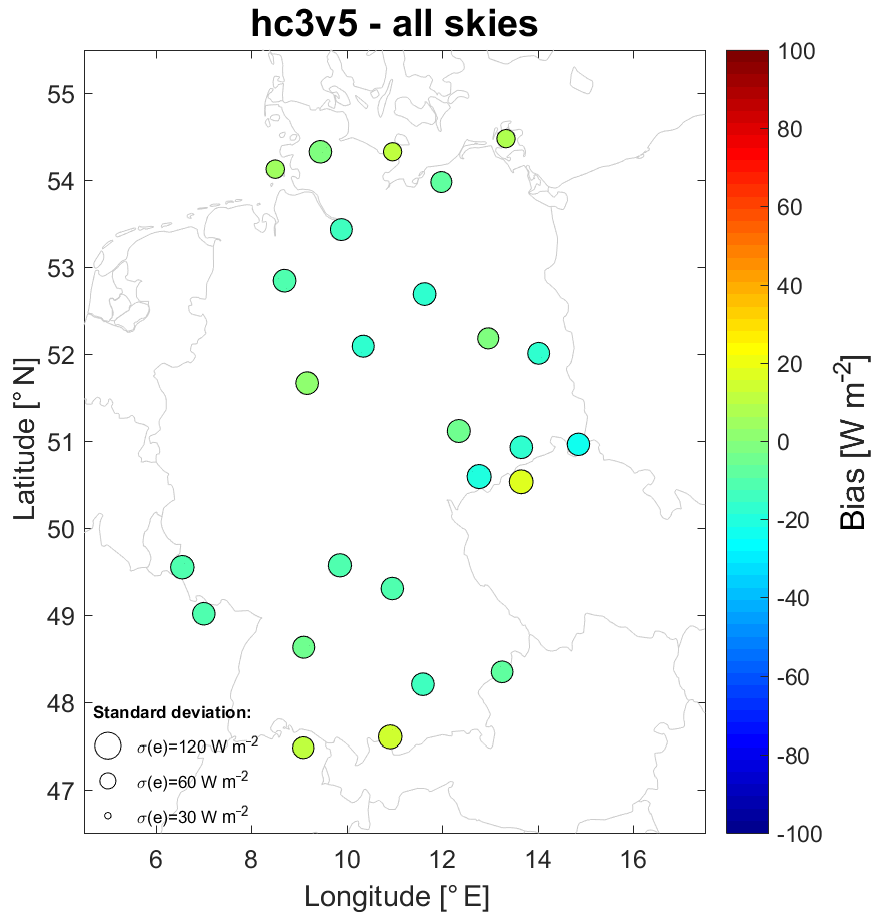
Figure 4Map of the bias (colour) and standard deviation (diameter of circle) for HC3v5 for all skies conditions at the 26 selected stations.
Figure 4 displays the bias and the standard deviation for the HC3v5 database for all-skies. The bias ranges between −22 and 16 W m−2 (−6 % and 5 %) with an average of −6 W m−2 (-2 %). The standard deviation ranges from 70 to 104 W m−2 (20 % and 39 %). The correlation coefficient is comprised between 0.90 and 0.95 (Table 2). In cloud-free and low cloudiness conditions, the bias for the HC3v5 database is negative (underestimation) at all sites like for CAMS-Rad. It ranges from −71 W m−2 (−11 %) to −14 W m−2 (−2 %). The standard deviation is between 49 and 114 W m−2, and the correlation coefficient between 0.80 and 0.96. In overcast conditions, the bias is positive (overestimation). It ranges between 14 W m−2 (12 %) and 94 W m−2 (79 %). The standard deviation ranges from 54 to 78 W m−2, and the correlation coefficient from 0.34 to 0.52.
Figure 2 shows that the 2010–2018 average of the 10 min means of irradiance across Germany has a tendency to increase from North to South and from West to East. The lowest averages of E are found in Central Germany. The main features in the spatial variations may be explained by the well-known dependence of the solar radiation with the latitude and the altitude. The stations along the northern seashore exhibit greater averages than their inland counterparts, a feature also reported for The Netherlands (Marchand et al., 2019). These differences are due to differences in cloud properties that can have a meteorological origin or can be caused by the interactions between the atmosphere and the underlying surfaces (Kostsov et al., 2018).
The bias for the CAMS-Rad database is close to 0 W m−2 on average, but shows large discrepancies across Germany (Fig. 3). E is underestimated at seashore stations: Arkona (−41 W m−2), Sankt Peter-Ording (−27 W m−2), Fehmarn (−20 W m−2) and Rostock (−18 W m−2). A low relative bias of 1 % is observed at the eastern stations: Weihenstephan-Dürnast, Fürstenzell, Chemnitz, Dresden, Görlitz, Lindenberg, Potsdam and Seehausen. As a whole, overestimation is observed in the South, and underestimation in the North. One may also note a faint tendency of the bias to increase from East to West. The spatial distribution of the bias exhibits trends that are opposite to those of the averages of E.
With the exception of Zinnwald-Georgenfeld (39 %), the relative standard deviation ranges between 20 % and 30 % approximately. There is no spatial feature visible in Fig. 3 for the standard deviation: there is no visible tendency of increase or decrease in the diameter of the cycles. Similarly, the correlation coefficient is close to 0.9, except at Zinnwald-Georgenfeld (0.83), and does not exhibit any spatial trend, though one may note a tendency to increase with increasing averages of E.
The bias for the HC3v5 database is close to −6 W m−2 on average, and is fairly homogeneous across Germany, between −22 and 16 W m−2. In Fig. 4, one may note a slight tendency for the bias to increase from East (underestimation) to West (overestimation). On the contrary, there is no spatial feature visible in Fig. 4 for standard deviation, whose relative values range between 20 % and 30 % approximately. Similarly, the correlation coefficient does not exhibit any spatial trend.
For the CAMS-Rad database, the greatest bias (32 W m−2), the greatest standard deviation (129 W m−2) and the smallest correlation coefficient (0.83) are found for the same station: Zinnwald-Georgenfeld whose elevation is 877 m. This may question the quality of this site, but one notes that there is no major difference between this site and similar ones for the HC3v5 database. It is possible that the CAMS-Rad does not correctly estimate at this site because of the surrounding environment and the altitude.
The standard deviations are greater than those reported in previous studies (Ameen et al., 2018; Eissa et al., 2015; Marchand et al., 2017, 2018, 2019; Thomas et al., 2016a, b; Trolliet et al., 2018). This is partly explained by the difference in the duration of the measurements: 10 min here, against 1 h in the other studies.
In overcast conditions, both databases overestimate irradiance. The bias, standard deviation of error and correlation coefficients do not exhibit any spatial trend according to latitude, longitude or altitude of stations.
For both databases, the results for cases where KT > 0.7 shows underestimation at all sites. One may question the quality of the McClear-v3 clear-sky model. However, several comparisons between McClear-v3 estimates and 1-min means of irradiance measured at several stations in the world show that this model provides very satisfactory results (Gschwind et al., 2019; Sun et al., 2019). We therefore suspect that the errors of CAMS-Rad and HC3v5 in clear-sky condition originate from errors in classification of clear skies by the Heliosat algorithms. This observation has been reported in previous investigations of the CAMS-Rad database (Marchand et al., 2018; Thomas et al., 2016b; Trolliet et al., 2018) and in the quarterly validation reports available on-line at https://atmosphere.copernicus.eu/supplementary-services (last access: 28 November 2019). Heliosat-4 detects clouds too often in Meteosat images while there is none, resulting in an underestimation of the irradiance. There is an additional cause of the underestimation. If the analysis of the images indicates that a pixel is fully covered by clouds, then the optical depth of the cloud is set arbitrarily to a minimal value of 0.5, even if the APOLLO method provides a smaller value. When the solar zenithal angle is large, say 75∘, the transmittance of the direct irradiance by the cloud is 0.14, while it would be 0.68 if the cloud optical depth were 0.1 instead of 0.5. This simple example shows that the exact value of the cloud optical depth plays a greater role when the sun is low above the horizon which happens often in winter in Germany, and at the beginning and end of the day. However, this is a complex issue that also involves the detection and classification of thin clouds, which is beyond the scope of this work.
For the HC3v5 database, the origin of the bias results from errors in the determination of the cloud-index that may be themselves related to errors in estimating the ground reflectance. Several previous investigations on HC3v5 have shown that the bias is small under cloud-free conditions when such conditions are frequent, such as over the equatorial part of the Atlantic Ocean (Trolliet et al., 2018), Morocco (Marchand et al., 2018), or Oman (Marchand et al., 2017). In other cases, investigations have reported similar observations to ours, i.e. a noticeable underestimation in the HC3v5 database (Thomas et al., 2016b).
We then evaluate whether CAMS-Rad and HC3v5 solar radiation estimates fulfil the definition of “moderate quality” for measurements as set up by WMO (2018). Under this quality, the relative uncertainty of E should not exceed 20 %, the uncertainty being equal to twice the standard deviation of errors. To perform this evaluation, we assume that the bias for CAMS-Rad or HC3v5 can be removed. We also assume that the ground measurements are themselves of moderate quality. The results of the comparisons include the combination of the uncertainty of measurements and the uncertainty of the estimates. This combination can be expressed in a first approximation as the quadratic sum of both uncertainties (ISO/IEC, 2009). The total uncertainty is equal to twice the standard deviations reported above. Knowing the total uncertainty and the uncertainty of estimates, the uncertainty of estimates can be calculated. It is found that the relative uncertainty of estimates is approximately respectively 60 % for the CAMS-Rad and 50 % for the HC3v5 databases. These numbers exceed the relative uncertainty set by WMO and it can be concluded that to a first approximation, the quality of CAMS-Rad and HC3v5 estimates is less than “moderate quality”. These findings agree with those reported by Marchand et al. (2019) for the Netherlands which experiences a similar climate to that of Germany. They disagree with the findings of previous studies which report that both databases meet the moderate quality for the Arabic Peninsula (Marchand et al., 2016), Morocco (Marchand et al., 2017) and tropical Atlantic Ocean (Trolliet et al., 2018). This disagreement is likely related to the higher occurrence of cloud-free days in these three regions compared to Germany and The Netherlands. The re-examination of the results of Ameen et al. (2018), Eissa et al. (2015), or Thomas et al. (2016a, b) confirms that the relative standard deviations tend to decrease as the mean clearness index increases, i.e. as the occurrence of cloud-free conditions increases.
This paper reports on a comparison of two satellite-derived radiation databases against the measurements of 26 stations in Germany. The reference dataset includes 10 min measurements of global radiation that underwent a quality control to use only non-suspicious data.
It was found that the two databases reproduce the 10 min changes in irradiance well with correlation coefficients around 0.83–0.92 for CAMS-Rad and 0.90–0.95 for HC3v5. No systematic errors could be highlighted in all sky conditions with biases ranging from −40 to 32 W m−2 for CAMS-Rad and from −22 to 16 W m−2 for HC3v5.
The spatial consistency of the uncertainties of the satellite estimates has been investigated. For the CAMS Rad database, overestimation is observed in the South, and underestimation in the North with a faint tendency of the bias to increase from East to West. For the HC3v5 database, the bias is fairly homogeneous, though one may note a slight tendency for underestimation in the East and overestimation in the West. For both databases, there is no noticeable spatial trend in the standard deviation.
In contrast, a negative bias is identified for situations with a clearness index greater than 0.7. This bias most likely stems from issues in the Heliosat algorithms because several studies showed that the performance of the clear-sky model McClear is unbiased.
Generally, this work validates the results obtained by Marchand et al. (2019) who show that the analysed satellite databases have a lower quality than a “moderate quality” standard as defined by the WMO in the case of The Netherlands. This result disagrees with previous studies because of the high occurrence of cloudy cases, for which the uncertainty of satellite based radiation estimate is worse (Marchand et al., 2019).
This study highlights the need for a further more in-depth analysis of the spatial variability of the uncertainties including different detailed factors such as the clearness index, frequency of cloudy conditions, or frequency of thin/thick clouds. This would help to understand better the causes of the spatial trend if there is any. The thin cloud case might be especially important since it might link to the issue of cloud detection and fixed minimum value of cloud optical depth. The present work confirms the need to improve the two Heliosat methods and their inputs in order to have more accurate estimations of solar radiation in cloudy situations. After several years of validation work, we have observed that our studies gather in different clusters depending on the climate of the studied region. A synthesis of previous validations would be interesting to summarize the lessons learned over the last years and better assess the dependency of the estimation accuracy with the local climate.
Measurements performed at the DWD stations are available online at the German climate data center (CDC) portal (https://opendata.dwd.de/climate_environment/CDC/observations_germany/climate/10_minutes/solar/historical/, DWD, 2020). CAMS-Rad and HC3v5 are available online at the SoDa website (http://www.soda-pro.com/web-services/radiation/cams-radiation-service, Atmospheric Monitoring Service, 2020). Time series used for this work are freely available on request (mathilde.marchand@transvalor.com).
MM and YMSD designed the study. YMSD collected the data from the DWD. YMSD and LS performed the calculations. MM set up the first draft of the paper. YMSD, LS, EW and LW contributed to the final writing and the revisions.
The authors declare that they have no conflict of interest.
This article is part of the special issue “19th EMS Annual Meeting: European Conference for Applied Meteorology and Climatology 2019”. It is a result of the EMS Annual Meeting: European Conference for Applied Meteorology and Climatology 2019, Lyngby, Denmark, 9–13 September 2019.
The authors praise the DWD for the quality of their measurements and for making them available. The research leading to these results has been partly undertaken within the Copernicus Atmosphere Monitoring Service (CAMS) of the European Union.
This paper was edited by Sven-Erik Gryning and reviewed by Zhipeng Qu and one anonymous referee.
Abdel Wahab, M., El-Metwally, M., Hassan, R., Lefèvre, M., Oumbe, A., and Wald, L.: Assessing surface solar irradiance in Northern Africa desert climate and its long-term variations from Meteosat images, Int. J. Remote Sensing, 31, 261–280, 2009.
Ameen, B., Balzter, H., Jarvis, C., Wey, E., Thomas, C., and Marchand, M.: Validation of hourly global horizontal irradiance for two satellite-derived datasets in Northeast Iraq, Remote Sens.-Basel, 10, 1651, https://doi.org/10.3390/rs10101651, 2018.
Amillo, A. G., Huld, T., and Müller, R.: A new database of global and direct solar radiation using the Eastern Meteosat satellite, models and validation, Remote Sens.-Basel, 6, 8165–8189, https://doi.org/10.3390/rs6098165, 2014.
Behrens, K. and Grewethe, R.-D.: A comparison of SCAPP radiation data with global, diffuse and direct solar radiation, available at: https://www.wmo.int/pages/prog/www/IMOP/publications/IOM-82-TECO_2005/Papers/1(08)_Germany_Behrens.pdf (last access: 1 May 2020) 2005,
Bell, M. J., Lefebvre, M., Le Traon, P. Y., Smith, N., and Wilmer-Becker, K.: GODAE, The global ocean data assimilation experiment, Oceanography, 22, 14–21, https://doi.org/10.5670/oceanog.2009.62, 2009.
Bengulescu, M., Blanc, P., Boilley, A., and Wald, L.: Do modelled or satellite-based estimates of surface solar irradiance accurately describe its temporal variability?, Adv. Sci. Res., 14, 35–48, https://doi.org/10.5194/asr-14-35-2017, 2017.
Blanc, P. and Wald, L.: The SG2 algorithm for a fast and accurate computation of the position of the Sun, Sol. Energ., 86, 3072–3083, https://doi.org/10.1016/j.solener.2012.07.018, 2012.
Blanc, P., Gschwind, B., Lefèvre, M., and Wald, L.: The HelioClim project: Surface solar irradiance data for climate applications, Remote Sens.-Basel, 3, 343–361, https://doi.org/10.3390/rs3020343, 2011.
Blanc, P., Gschwind, B., Lefèvre, M., and Wald, L.: Twelve monthly maps of ground albedo parameters derived from MODIS data sets, in: Proceedings of IGARSS 2014, 13–18 July 2014, Quebec, Canada, USBKey 3270-3272, 2014.
Boilley, A. and Wald L.: Comparison between meteorological re-analyses from ERA-Interim and MERRA and measurements of daily solar irradiation at surface, Renew. Energ., 75, 135–143, https://doi.org/10.1016/j.renene.2014.09.042, 2015.
Bois, B., Pieri, P., Van Leeuwen, C., Wald, L., Huard, F., Gaudillere, J.-P., and Saur, E.: Using remotely sensed solar radiation data for reference evapotranspiration estimation at a daily time step, Agr. Forest Meteorol., 148, 619–630, 2008.
Bojinski, S., Verstraete, M., Peterson, T. C., Richter, C., Simmons, A., and Zemp, M.: The concept of essential climate variables in support of climate research, applications, and policy, B. Am. Meteor. Soc., 95, 1431–1443, https://doi.org/10.1175/BAMS-D-13-00047.1, 2014.
Atmospheric Monitoring Service: CAMS-Rad: http://www.soda-pro.com/web-services/radiation/cams-radiation-service, last access: 29 May 2020.
Colombo, R., Busetto, L., Migliavacca, M., Meroni, M., Della Torre, C., Tagliaferri, A., Grassi, G., and Seufert, G.: Modelling carbon cycle of agro-forest ecosystems in Lombardy (Italy), Forest@, 6, 277–288, https://doi.org/10.3832/efor0593-006, 2009.
Cros, S., Albuisson, M., and Wald, L.: Simulating Meteosat-7 broadband radiances at high temporal resolution using two visible channels of Meteosat-8, Sol. Energ., 80, 361–367, https://doi.org/10.1016/j.solener.2005.01.012, 2006.
DWD: https://opendata.dwd.de/climate_environment/CDC/observations_germany/climate/10_minutes/solar/historical/, last access: 29 May 2020.
Eissa, Y., Korany, M., Aoun, Y., Boraiy, M., Abdel Wahab, M., Alfaro, S., Blanc, P., El-Metwally, M., Ghedira, H., and Wald, L.: Validation of the surface downwelling solar irradiance estimates of the HelioClim-3 database in Egypt, Remote Sens.-Basel, 7, 9269–9291, https://doi.org/10.3390/rs70709269, 2015.
Gschwind, B., Ménard, L., Albuisson, M., and Wald, L.: Converting a successful research project into a sustainable service: the case of the SoDa Web service, Environ. Modell. Softw., 21, 1555–1561, https://doi.org/10.1016/j.envsoft.2006.05.002, 2006.
Gschwind, B., Wald, L., Blanc, P., Lefèvre, M., Schroedter-Homscheidt, M., and Arola, A.: Improving the McClear model estimating the downwelling solar radiation at ground level in cloud-free conditions – McClear-v3, Meteorol. Z., 28, 147–163, https://doi.org/10.1127/metz/2019/0946, 2019.
Hersbach, H. and Dee, D.: ERA5 reanalysis is in production, ECMWF Newsletter, 147, ECMWF, Reading, United Kingdom, 2016.
ISO/IEC Guide 98-1:2009: Uncertainty of measurement – Part 1: Introduction to the expression of uncertainty in measurement, International Organization for Standardization, Geneva, Switzerland, 21 pp., 2009.
Janjai, S., Pankaew, P., and Laksanaboonsong, J.: A model for calculating hourly global solar radiation from satellite data in the tropics, Appl. Energ., 86, 1450–1457, https://doi.org/10.1016/j.apenergy.2009.02.005, 2009.
Janjai, S., Pankaew, P., Laksanaboonsong, J., and Kitichantaropas, P.: Estimation of solar radiation over Cambodia from long-term satellite data, Renew. Energ., 36, 1214–1220, https://doi.org/10.1016/j.renene.2010.09.023, 2011.
Juzeniene, A., Brekke, P., Dahlback, A., Andersson-Engels, S., Reichrath, J., Moan, K., Holick, M. F., Grant, W. B., and Moan, J.: Solar radiation and human health, Rep. Prog. Phys., 74, 066701, https://doi.org/10.1088/0034-4885/74/6/066701, 2011.
Jones, P. D., Harpham, C., Troccoli, A., Gschwind, B., Ranchin, T., Wald, L., Goodess, C. M., and Dorling, S.: Using ERA-Interim reanalysis for creating datasets of energy-relevant climate variables, Earth Syst. Sci. Data, 9, 471–495, https://doi.org/10.5194/essd-9-471-2017, 2017.
Korany, M., Boraiy, M., Eissa, Y., Aoun, Y., Abdel Wahab, M. M., Alfaro, S. C., Blanc, P., El-Metwally, M., Ghedira, H., Hungershoefer, K., and Wald, L.: A database of multi-year (2004–2010) quality-assured surface solar hourly irradiation measurements for the Egyptian territory, Earth Syst. Sci. Data, 8, 105–113, https://doi.org/10.5194/essd-8-105-2016, 2016.
Kostsov, V. S., Kniffka, A., and Ionov, D. V.: Cloud liquid water path in the sub-Arctic region of Europe as derived from ground-based and space-borne remote observations, Atmos. Meas. Tech., 11, 5439–5460, https://doi.org/10.5194/amt-11-5439-2018, 2018.
Lefèvre, M., Diabaté, L., and Wald, L.: Using reduced data sets ISCCP-B2 from the Meteosat satellites to assess surface solar irradiance, Sol. Energ., 81, 240–253, 2007.
Lefèvre, M., Oumbe, A., Blanc, P., Espinar, B., Gschwind, B., Qu, Z., Wald, L., Schroedter-Homscheidt, M., Hoyer-Klick, C., Arola, A., Benedetti, A., Kaiser, J. W., and Morcrette, J.-J.: McClear: a new model estimating downwelling solar radiation at ground level in clear-sky conditions, Atmos. Meas. Tech., 6, 2403–2418, https://doi.org/10.5194/amt-6-2403-2013, 2013.
Lefèvre, M., Blanc, P., Espinar, B., Gschwind, B., Ménard, L., Ranchin, T., Wald, L., Saboret, L., Thomas, C., and Wey, E.: The HelioClim-1 database of daily solar radiation at Earth surface: an example of the benefits of GEOSS Data-CORE, IEEE J.-STARS, 7, 1745–1753, https://doi.org/10.1109/JSTARS.2013.2283791, 2014.
Leloux, J., Narvarte, L., and Trebosc, D.: Review of the performance of residential PV systems in Belgium, Renew. Sust. Energ. Rev., 16, 178–184, https://doi.org/10.1016/j.rser.2011.07.145, 2012.
Marchand, M., Al-Azri, N., Oumbe-Ndeffotsing, A., Wey, E., and Wald, L.: Evaluating meso-scale change in performance of several databases of hourly surface irradiation in South-eastern Arabic Pensinsula, Adv. Sci. Res., 14, 7–15, https://doi.org/10.5194/asr-14-7-2017, 2017.
Marchand, M., Ghennioui, A., Wey, E., and Wald, L.: Comparison of several satellite-derived databases of surface solar radiation against ground measurement in Morocco, Adv. Sci. Res., 15, 21–29, https://doi.org/10.5194/asr-15-21-2018, 2018.
Marchand, M., Lefèvre, M., Saboret, L., Wey, E., and Wald, L.: Verifying the spatial consistency of the CAMS Radiation Service and HelioClim-3 satellite-derived databases of solar radiation using a dense network of measuring stations: the case of The Netherlands, Adv. Sci. Res., 16, 103–111, https://doi.org/10.5194/asr-16-103-2019, 2019.
Molod, A., Takacs, L., Suarez, M., and Bacmeister, J.: Development of the GEOS-5 atmospheric general circulation model: evolution from MERRA to MERRA2, Geosci. Model Dev., 8, 1339–1356, https://doi.org/10.5194/gmd-8-1339-2015, 2015.
Müller, R., Pfeifroth, U., Träger-Chatterjee, C., Trentmann, J., and Cremer, R.: Digging the METEOSAT treasure – 3 decades of solar surface radiation, Remote Sens.-Basel, 7, 8067–8101, https://doi.org/10.3390/rs70608067, 2015.
Oumbe, A., Qu, Z., Blanc, P., Lefèvre, M., Wald, L., and Cros, S.: Decoupling the effects of clear atmosphere and clouds to simplify calculations of the broadband solar irradiance at ground level, Geosci. Model Dev., 7, 1661–1669, https://doi.org/10.5194/gmd-7-1661-2014, 2014.
Peel, M. C., Finlayson, B. L., and McMahon, T. A.: Updated world map of the Köppen-Geiger climate classification, Hydrol. Earth Syst. Sci., 11, 1633–1644, https://doi.org/10.5194/hess-11-1633-2007, 2007.
Qu, Z., Gschwind, B., Lefevre, M., and Wald, L.: Improving HelioClim-3 estimates of surface solar irradiance using the McClear clear-sky model and recent advances in atmosphere composition, Atmos. Meas. Tech., 7, 3927–3933, https://doi.org/10.5194/amt-7-3927-2014, 2014.
Qu, Z., Oumbe, A., Blanc, P., Espinar, B., Gesell, G., Gschwind, B., Klüser, L., Lefèvre, M., Saboret, L., Schroedter-Homscheidt, M., and Wald L.: Fast radiative transfer parameterisation for assessing the surface solar irradiance: The Heliosat-4 method, Meteorol. Z., 26, 33–57, https://doi.org/10.1127/metz/2016/0781, 2017.
Ranchin, T., Trolliet, M., Ménard, L., and Wald, L.: Which variables are essential for renewable energies?, Int. J. Digit. Earth, 13, 253–261, https://doi.org/10.1080/17538947.2019.1679267, 2020.
Rienecker, M. M., Suarez, M. J., Gelaro, R., Todling, R., Bacmeister, J., Liu, E., Bosilovich, M. G., Schubert, S. D., Takacs, L., Kim, G. K., Bloom, S., Chen, J. Y., Collins, D., Conaty, A., da Silva, A., Gu, W., Joiner, J., Koster, R. D., Lucchesi, R., Molod, A., Owens, T., Pawson, S., Pegion, P., Redder, C. R., Reichle, R., Robertson, F. R., Ruddick, A. G., Sienkiewicz, M., and Woollen, J.: MERRA: NASA's modern-era retrospective analysis for research and applications, J. Climate, 24, 3624–3648, https://doi.org/10.1175/JCLI-D-11-00015.1, 2011.
Rigollier, C., Bauer, O., and Wald, L.: On the clear sky model of the ESRA – European Solar Radiation Atlas – with respect to the Heliosat method, Sol. Energ., 68, 33–48, https://doi.org/10.1016/S0038-092X(99)00055-9, 2000.
Rigollier, C., Lefèvre, M., and Wald, L.: The method Heliosat-2 for deriving shortwave solar radiation from satellite images, Sol. Energ., 77, 159–169, https://doi.org/10.1016/j.solener.2004.04.017, 2004.
Roerink, G. J., Bojanowski, J. S., de Wit, A. J. W., Eerens, H., Supit, I., Leo, O., and Boogaard, H. L.: Evaluation of MSG-derived global radiation estimates for application in a regional crop model, Agr. Forest Meteorol., 160, 36–47, https://doi.org/10.1016/j.agrformet.2012.02.006, 2012.
Rotar, N. and Badescu, V.: Considerations on the Implementation of the Passive House Concept in South-Eastern Europe (Romania), International Journal of Green Energy, 8, 780–794, https://doi.org/10.1080/15435075.2011.600376, 2011.
Sun, X., Bright, J., Gueymard, C., Acord, B., Wang, P., and Engerer, N.: Worldwide performance assessment of 75 global clear-sky irradiance models using principal component analysis, Renew. Sust. Energ. Rev., 111, 550–570, https://doi.org/10.1016/j.rser.2019.04.006, 2019.
Thomas, C., Saboret, L., Wey, E., Blanc, P., and Wald, L.: Validation of the new HelioClim-3 version 4 real-time and short-term forecast service using 14 BSRN stations, Adv. Sci. Res., 13, 129–136, https://doi.org/10.5194/asr-13-129-2016, 2016a.
Thomas, C., Wey, E., Blanc, P., Wald, L., and Lefèvre, M.: Validation of HelioClim-3 version 4, HelioClim-3 version 5 and MACC-RAD using 14 BSRN stations, Energy Procedia, 91, 1059–1069, https://doi.org/10.1016/j.egypro.2016.06.275, 2016b.
Trolliet, M., Walawender, J. P., Bourlès, B., Boilley, A., Trentmann, J., Blanc, P., Lefèvre, M., and Wald, L.: Downwelling surface solar irradiance in the tropical Atlantic Ocean: a comparison of re-analyses and satellite-derived data sets to PIRATA measurements, Ocean Sci., 14, 1021–1056, https://doi.org/10.5194/os-14-1021-2018, 2018.
Wagner, R., Marxsen, J., Zwick, P., and Cox, E. J.: Central European Stream Ecosystems: The Long Term Study of the Breitenbach, New York, NY, USA, Wiley, 2012.
WMO: Guide to Meteorological Instruments and Methods of Observation. WMO-No. 8, 2018 edition, Vol. 1, Measurement of Meteorological Variables, chap. 7 Measurement of Radiation, World Meteorological Organization, Geneva, Switzerland, 2018.
Zhang, X., Liang, S., Wang, G., Yao, Y., Jiang, B., and Cheng, J.: Evaluation of the reanalysis surface incident shortwave radiation products from NCEP, ECMWF, GSFC, and JMA using satellite and surface observations, Remote Sens.-Basel, 8, 225, https://doi.org/10.3390/rs8030225, 2016.
- Abstract
- Introduction
- Description of measurements used for comparison and quality control
- The HelioClim database and the CAMS Radiation Service
- Results
- Discussion
- Conclusions and perspectives
- Data availability
- Author contributions
- Competing interests
- Special issue statement
- Acknowledgements
- Review statement
- References