 | 30 Sep 2020
High resolution climate change projections for the Pyrenees region
María P. Amblar-Francés
Petra Ramos-Calzado
Jorge Sanchis-Lladó
Alfonso Hernanz-Lázaro
María C. Peral-García
Beatriz Navascués
Marta Dominguez-Alonso
María A. Pastor-Saavedra
Ernesto Rodríguez-Camino
The Pyrenees, located in the transition zone of Atlantic and Mediterranean climates, constitute a paradigmatic example of mountains undergoing rapid changes in environmental conditions, with potential impact on the availability of water resources, mainly for downstream populations. High-resolution probabilistic climate change projections for precipitation and temperature are a crucial element for stakeholders to make well-informed decisions on adaptation to new climate conditions. In this line, we have generated high–resolution climate projections for 21st century by applying two statistical downscaling methods (regression for max and min temperatures, and analogue for precipitation) over the Pyrenees region in the frame of the CLIMPY project over a new high-resolution (5 km × 5 km) observational grid using 24 climate models from CMIP5. The application of statistical downscaling to such a high resolution observational grid instead of station data partially circumvent the problems associated to the non-uniform distribution of observational in situ data. This new high resolution projections database based on statistical algorithms complements the widely used EUROCORDEX data based on dynamical downscaling and allows to identify features that are dependent on the particular downscaling method.
In our analysis, we not only focus on maximum and minimum temperatures and precipitation changes but also on changes in some relevant extreme indexes, being 1986–2005 the reference period. Although climate models predict a general increase in temperature extremes for the end of the 21st century, the exact spatial distribution of changes in temperature and much more in precipitation remains uncertain as they are strongly model dependent. Besides, for precipitation, the uncertainty associated to models can mask – depending on the zones- the signal of change. However, the large number of downscaled models and the high resolution of the used grid allow us to provide differential information at least at massif level. The impact of the RCP becomes significant for the second half of the 21st century, with changes – differentiated by massifs – of extreme temperatures and analysed associated extreme indexes for RCP8.5 at the end of the century.
- Article
(18288 KB) - Full-text XML
-
Supplement
(1543 KB) - BibTeX
- EndNote


Along the last decades, the issue of climate change has grown in importance, not only in the scientific world, but also in the political and civil society arena, escalating recently to the category of climate emergency. Year after year, climate change and related issues (as e.g., water scarcity, loss of biodiversity, increased frequency of extreme meteorological events) (Kitoh et al., 2016) appears as the top risk in terms of impact and likelihood among the global risks analyzed by the World Economic Forum (WEF, 2018, 2019, 2020). High mountain regions are especially vulnerable regions and in particular smaller glaciers around the world are projected – if no immediate and drastic reduction of greenhouse gases are achieved – to lose more than 80 % of their current ice mass by 2100 (IPCC, 2019). This will affect tourism, regional culture, and even cause issues further downstream for sectors such as agriculture (IPCC, 2019). Mediterranean European ecosystems are more vulnerable than other European ecosystems (due to, e.g., declined soil fertility and water availability and increased risk of forest fires). Therefore, the Mediterranean mountains seem to suffer a double risk for the special vulnerability of mountain regions and for the fact of being located in the Mediterranean basin, which emerges as a climate change hot spot (Nogués-Bravo et al., 2008). High-resolution downscaling is then vital to project climate extremes and their future changes by resolving fine topography reasonably well, which is key for representing local climatology and impacts of weather extremes (Kitoh et al., 2016).
Global climate models (GCMs) provide scenarios of future climate projections and aspects of climate variability and extremes that can be instrumental for impact studies and adaptation planning. Outputs provided by GCMs have a coarse resolution that is insufficient for their use by national policymakers and planners; then, downscaling techniques need to be applied to bridge the gap between GCMs and local information, providing climate projections at finer spatial scales (e.g., Takayabu et al., 2016). Nevertheless, this process exacerbates, at a local scale, uncertainties inherently found in GCMs. Hence, it is crucial for statistical downscaling methods to incorporate and quantify uncertainties, including both related to parameter shortcomings and aleatory, or observational, uncertainties. The role of downscaling in terms of uncertainties depends, of course, on the aim of the modelling exercise, but predicted changes in local climate are expected to be sensitive to the different parameterization schemes (“physics”) being used in the RCM and the driving GCMs as well as the different choices of statistical downscaling algorithms.
This study was developed in the framework of the “Characterisation of climate change and provision of information for adaptation in the Pyrenees (CLIMPY)” project (https://www.opcc-ctp.org/es/climpy, last access: 26 September 2020), a joint effort of three countries: Andorra, France, and Spain to share their climatic information. The project aims to determine the evolution and climate trends of the Pyrenees in the context of global climate change, considering as priority action the creation of a comprehensive – both observational and projected – temperature, rainfall and snow database. In this context, our objective consisted in applying two statistical downscaling methods used in previous projects by the Spanish Meteorological Agency (AEMET) to develop temperature (min-max) and precipitation projections for the 21st century with high spatial and temporal resolution necessary for hydrologic modelling and other purposes; emphasizing the novelty that we have applied statistical downscaling over a new high-resolution observational grid developed for this mountainous area that makes use of a comprehensive observations dataset specifically compiled for this project. The availability of high resolution downscaled projections over European mountainous areas is rather exceptional, except for CORDEX project (https://www.euro-cordex.net/, last access: 26 September 2020) simulations. One additional benefit in this new statistically downscaled projections is the possibility to compare with dynamically downscaled CORDEX projections.
We structure the paper in five sections. Section 2 features the study area; Sect. 3 provides details of used data and methodology (statistical downscaling); and Sect. 4 reports the results (maximum temperature, minimum temperature, precipitation and some related extremes). We end with a short discussion and relevant concluding remarks in Sect. 5.
The study area comprises the border between Spain, France and Andorra (Fig. 1). The highest elevations (>3000 m) are located on the Spanish side. The climate of the Pyrenees is influenced by its location between the Atlantic Ocean to the west and the Mediterranean Sea to the east. The altitude within the area ranges from 500 m to a maximum elevation of 3404 m a.s.l., and its extension is more than 50 000 km2. The relief is firmly split by the river network due to the disposition of the main valleys (north–south), which are perpendicular to the Pyrenean structures (west–east) (Peña and Lozano, 2004).
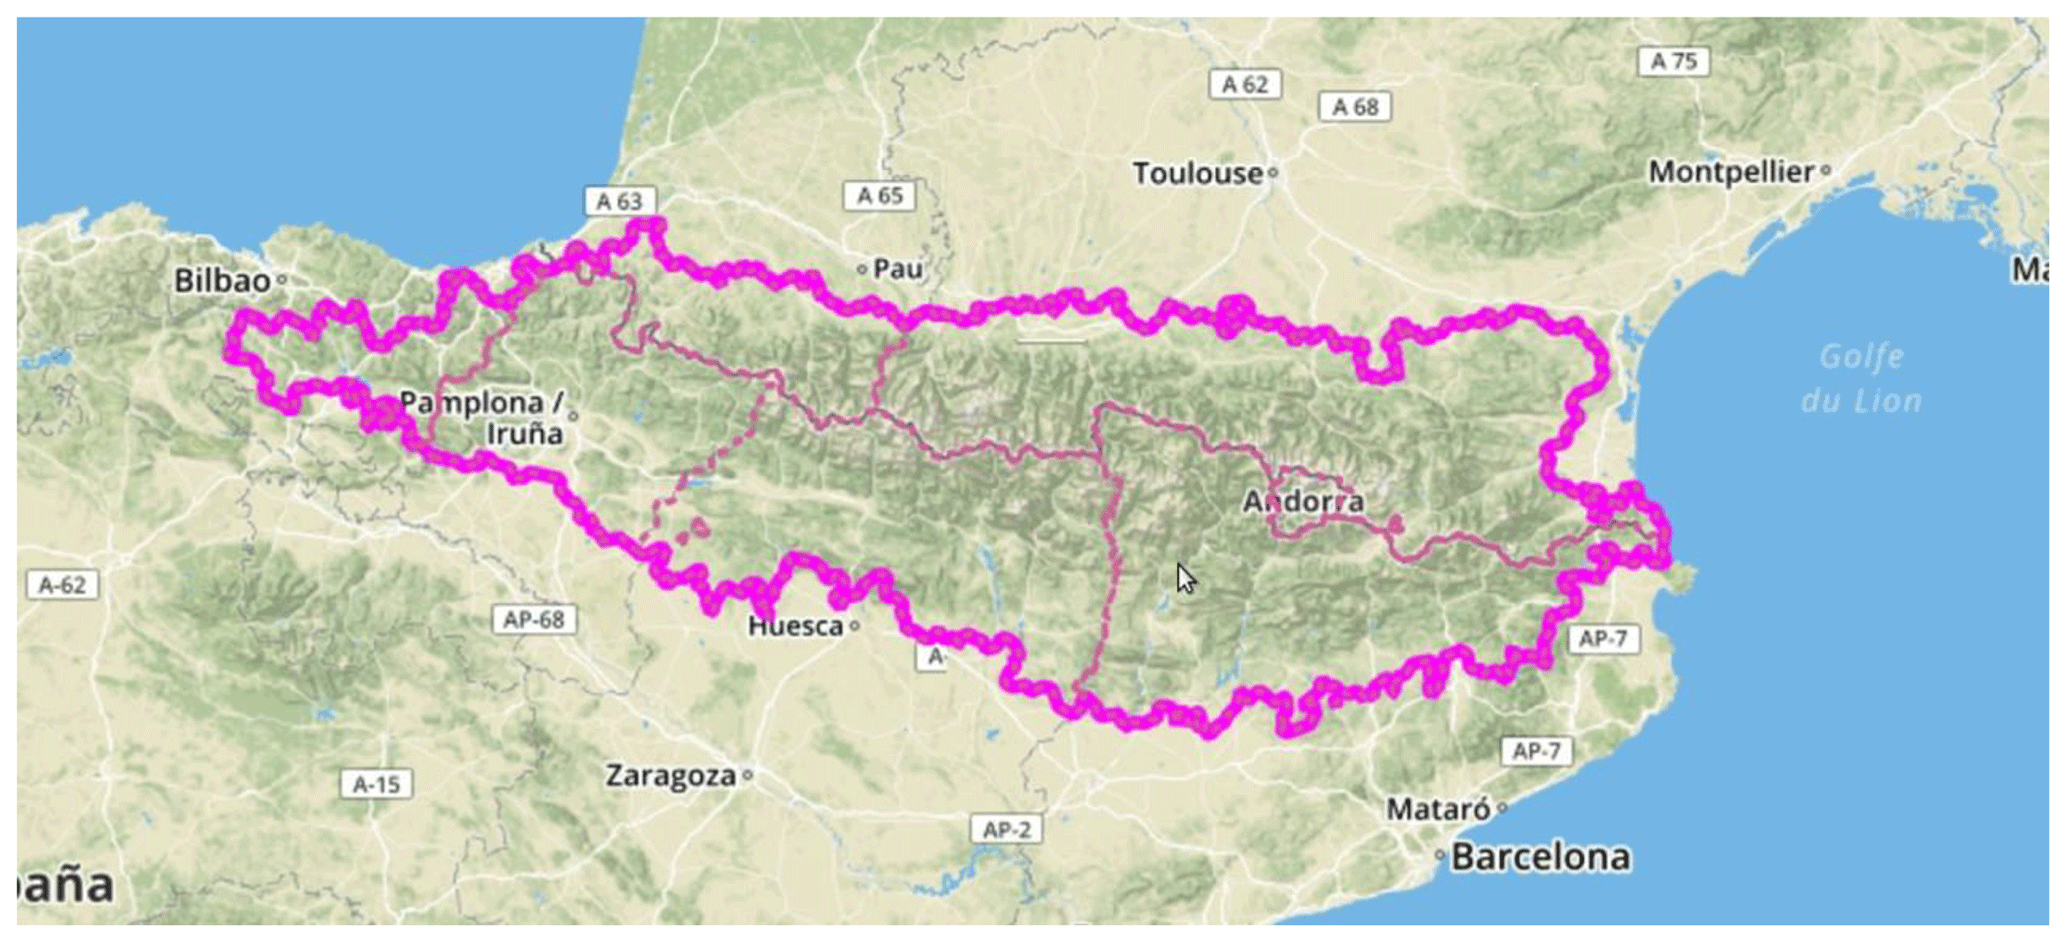
Figure 1Location of Pyrenees region (https://www.opcc-ctp.org/en/geoportal, last access: 26 September 2020).
The Central Pyrenees show a greater continental influence. Moreover, topographic heterogeneity introduces a noticeable variability to the distributions of precipitation and temperature (del Barrio et al., 1990; García-Ruiz et al., 2001). In the mountains, annual precipitation exceeds 2000 mm and sometimes reaches more than 2500 mm in the highest river basins (García-Ruiz et al., 2001). Most of the annual precipitation falls during the cold season in the western areas, and during spring and autumn in the eastern regions. This is a territory that strongly depends on climate and with a great ecological diversity with many endemic species (https://www.worldwildlife.org/biome-categories/terrestrial-ecoregions-of-the-world, last access: 26 September 2020). Of the 3500 species of plants found in this ecoregion, about 200 are endemic. Changing amount of snowfall and duration of snow cover will also affect the severity of fungal diseases. Reduced stability will decrease the protective function against natural hazards like flooding, debris flow, landslide, and rock fall, while hazardous processes itself might be both intensified or alleviated by the expected climatic changes.
In this section, we address the following issues: the two statistical downscaling techniques developed by AEMET and applied for this work, and datasets used: a new high-resolution “observational grid”, ERA-Interim reanalysis to compute relationships between predictors and predictands and finally CMIP5 models to compute downscaled climate change projections and produce an ensemble for the region.
3.1 Downscaling methods
Downscaling methods or regionalization techniques (Rummukainen, 2010) are a crucial step for providing actionable information at regional and local scales required in impact and adaptation studies. As mentioned in Gutiérrez et al. (2019), the relative merits and limitations of both dynamical and statistical downscaling approaches have been widely discussed in the literature and they are complementary in many practical applications.
In this study, we have focused on statistical downscaling methods. They have the advantage of being computationally cheap and easily adjusted to new areas. Therefore, it may appear to be an advantageous alternative for projects where the computational capacity, technical expertise or even time represent significant restrictions (Trzaska and Schnarr, 2014). Generic weakness is the high demand on available observational data along with the assumption that the link between the large-scale circulation and the local climate remains unchanged in an altered climate, which is by no means guaranteed.
Nevertheless, if the archive of meteorological events is long enough, it is reasonable to assume that a large part of future events is already represented, even those whose frequency will change under different climatic conditions (Wetterhall, 2005).
Briefly, we have applied two statistical downscaling techniques – regression and analogue – to a large ensemble of global climate projections released through the World Climate Research Programme (WCRP) Coupled Model Intercomparison project Phase 5 (CMIP5). The downscaled projections are developed over the CLIMPY region. We have selected regression for maximum and minimum temperature and analogue for precipitation. Both are categorized as Perfect Prognosis (PP) approaches (for more details, see Gutiérrez et al., 2019; Hertig et al., 2019). These methods (e.g. Benestad, 2002) rely on statistical relationships linking GCM outputs (predictors) to the local surface variables, noticeably precipitations and temperatures (predictands) over a particular domain (Maraun and Widmann, 2018). In general, these models or relationships are first trained (and tested) using reanalysis model and observed data during a representative historical period and later applied to new (e.g. future) GCM data to obtain the downscaled local predictions. We have used the predictor values on grid points.
Downscaling techniques generally require three datasets: the historical predictand values, the historical predictor values for the same period, and the predictors describing the target situation. Data for the predictors used in the calibration and validation of the statistical models come from the daily ERA-Interim reanalysis (Dee et al., 2011) for the period 1980–2005. The usefulness of a downscaling method depends on its ability to capture the effects of climate variability and change. When used for future climate studies, it is necessary to pay close attention to the selected predictors so that they contain the climate change signal (Giorgi et al., 2001). Selected predictors should be physically meaningful and reflect the processes which subsequently control variability in the climate. The selected predictors should also be those that are well represented by GCMs (Fowler et al., 2007). Appropriately selecting variables is in the equilibrium between the relevance in the physical climate reality and the accuracy with which the predictor is reproduced by the climate model (Wilby and Wigley, 2000). Also, local knowledge and expert opinion are invaluable information sources to identify the most effective set of predictors (Smid and Costa, 2018).
The regression method (Gutiérrez et al., 2019; Maraun et al., 2019; Widmann et al., 2019; Hertig et al., 2019; Soares et al., 2019; Wilby et al., 2004; Stennet-Brown et al., 2017) attempts to model the relationship between local temperatures and large-scale variables, by fitting a linear equation to daily observed data. The predictor variables have been selected from an initial subset (see TS1 in Supplementary material) by the best subset method being the fitting measure the adjusted determination coefficient. The analyses focused first on predictors considered relevant to the predictand and available in the CMIP5 database. Therefore, the subset of predictors selected will vary from one point to another, being the initial set conditioned by the available GCM outputs. The used predictor values for each location are the values in the closest grid point both for reanalysis model and climate models. See regression method evaluation over the Pyrenees region in Figs. S8–S11 and S14.
Statistical behavior of precipitation is very far from normality, thus, it is more advisable the use of analogues that perform better for precipitation spells than regression methods. As mentioned in Hertig et al. (2019), this likely relates to the fact that the variance of the analogue predictors is dominated by circulation-related variables, which constrain well precipitation, but not temperature (see Table S1 in the Supplement). Briefly, the procedure for precipitation is performed by a two-step analogue method (Petisco de Lara, 2008; Amblar-Francés et al., 2017). This method is based on two types of analogy: synoptic and local. The synoptic analogy associates a set of analogue days to the target day. The similarity of synoptic analogues has been computed by the squared Euclidean distance of typified fields of the geostrophic wind components (ug and vg) at 1000 and 500 hPa. Then, the local analogy is measured, for each target point, by comparing a set of significant predictors between the target day and each analogue. Finally, the precipitation is estimated as an average of the analogues observed precipitation, with different weights depending on the degree of analogy (combination of synoptic and local analogies). See analogues method evaluation over the Pyrenees region in Figs. S12, S13 and S15.
The analysis has first addressed the temporal evolution of the median of models. Focusing on each scenario, we have computed: (a) the mean for each model for four temporal horizons (2030, 2050, 2070 and 2090) using a 15-year time window centered on these years; then, (b) the median of the models (q50) and the 17th and 83rd percentiles (q17 and q83), and (c) the difference between percentile 83 and percentile 17 has been taken as a measure of uncertainty. Secondly, as regards the spatial analysis for the whole region, we have focused on the results centered on 2090 for the most emissive RCP8.5 scenario. We have highlighted (stippled area in the maps) the sites where the signal is larger than the uncertainty associated to the climate models, estimated as . In third place, temporal and spatial evolution of some selected maximum and minimum extreme indexes has been addressed. We have selected the median and 17th and 83rd percentiles of the values projected by models due to: (a) their robustness and (b) the independence of the tails of the distributions. In addition, the choice of the 17th and 83rd percentiles is due to their close correspondence with the probability of a normal distribution for the values of mean plus or minus a standard deviation.
3.2 Data
In recent years there has been an increasing demand for comprehensive regular high-resolution (both in time and space) gridded datasets from different sectors, including hydrology, agriculture and health. Gridded data are also of major importance for the regional adaptation of global predictions or projections using statistical downscaling methods (Maurer and Hidalgo, 2008).
However, regional analysis requires higher resolution datasets in both space and time, so that climatic differences across sub-regions can be identified and both mean and extreme climate conditions can be analyzed. In the last few years, some daily gridded products have been developed at continental-scale from dense networks of daily rain gauge data in Europe – E-OBS dataset, UERRA (Landelius et al., 2016), South America (Liebmann and Allured, 2005) or South-Asia (van den Besselaar et al., 2017) with typical resolutions ranging from 50 to 5 km.
Nevertheless, due to the inhomogeneous data coverage in different countries it is still not clear whether these continental grids can also characterize the specific extreme climate conditions of the different regions within the covered area. In part because spatial scales solved by the interpolation method are constrained by the observations density. In this respect, a local tuning of the appropriate interpolation parameters may improve the observational grid. Country-like scale grids have been already developed in the Alps (Frei and Schar, 1998), United Kingdom (Perry and Hollis, 2005) or Spain (Peral et al., 2017).
For this work the daily (maximum and minimum) temperatures and 24 h accumulated precipitation gridded data developed at AEMET for different operational purposes has been extended with additional data from France and Andorra to fully cover the Pyrenees area. This new 5 km (0.05∘ lat/lon) resolution extended grid covers now continental Spain and Southern France. The method developed is an adaptation of the HIRLAM Surface Analysis code (Rodríguez et al., 2003; Navascués et al., 2003), based on an Optimum Interpolation algorithm (Daley, 1991). It makes use of observations coming from the AEMET Climate Database and the new CLIMPY Database to correct a 5 km surface temperature climatology, obtained from the HIRLAM-AEMET Numerical Weather Prediction operational analyses, that is used as background or first guess. This climatology already presents the expected spatial patterns that are due to the orography and to the different vegetation types and land uses. In case of precipitation, a null field is used as first guess. The first guess error statistics defining the interpolation characteristics have been tuned separately for each month using the available observations. This seasonal dependence considers implicitly the different spatial scales of large scale or convective precipitation that are dominant in different seasons. Structure functions are anisotropic to allow first guess errors correlation to be dependent not only on the horizontal distance but also on the vertical displacement. In this way, topography is taken into account in the interpolation. The first guess error variance in case of precipitation is defined by a field representing the spatial variability of the precipitation variance (see Peral et al. (2017) for more details). This new extended grid, focusing on maximum temperature, shows (figure not shown), that the best fit to observations (<1 K) is reached in flat areas over France to the north of Pyrenees, and the worst fit is found in Central Pyrenees mountainous areas with a lower observation density (up to 3 K).
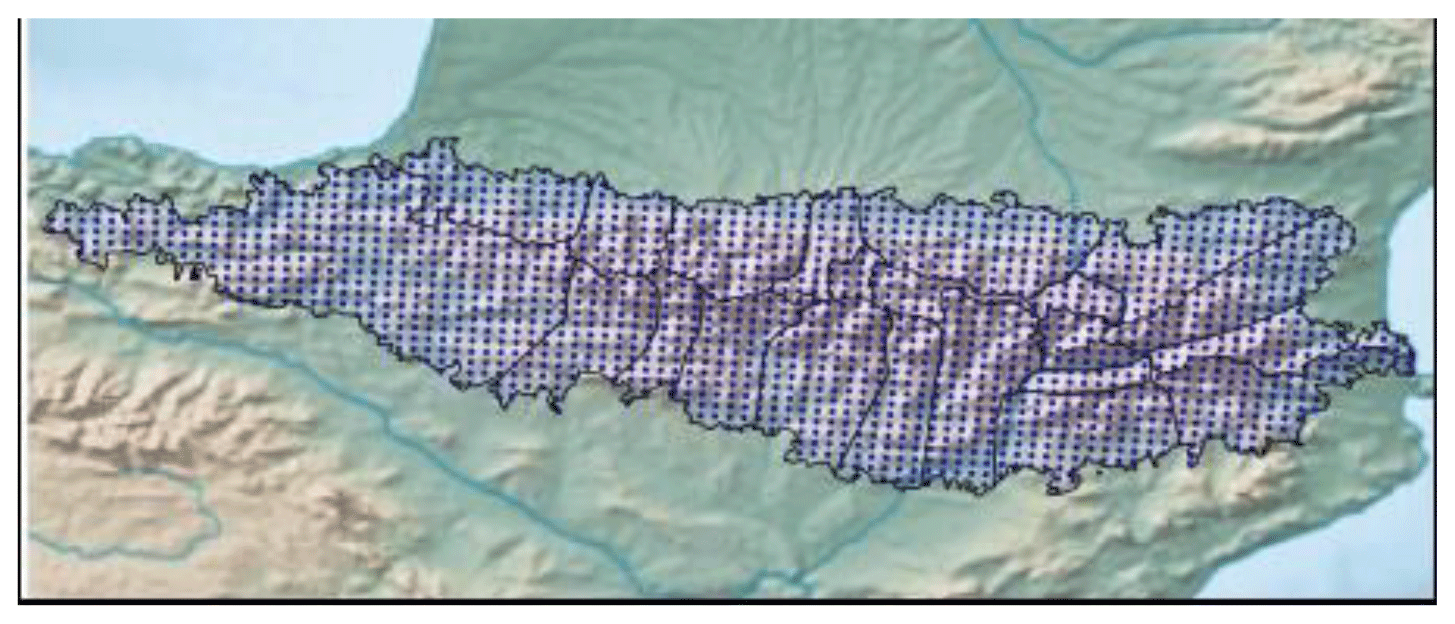
Figure 2The observational grid that encompasses 1622 points over the CLIMPY area.
From the practical point of view, this new grid encompasses 1622 points in the CLIMPY area (Fig. 2). As compared with the number of stations (338 for precipitation and 109 for temperature), it would in principle allow a better description of the higher spatial variability that temperature and precipitation may exhibit over mountain areas. The tuned structure functions for the 5 km horizontal resolution (Peral et al., 2017) in the optimal interpolation algorithm can tackle better the higher spatial variability over the Pyrenees domain. Generally, over mountainous regions – and in particular over Pyrenees – stations tend to be located in the populated valleys with lack of observations at higher altitudes. The application of statistical downscaling methods over such an observational grid (described above) at least palliates in part this lack of spatial uniformity coming from the observational network. The number of grid points over each Pyrenean Massif has been included in Table 1. At this stage, it is important to underline that this database will be used in future impact studies.

We have computed the relationships between predictors and predictands using the ERA-Interim Reanalysis dataset from the European Centre for Medium-Range Weather Forecasts (ECMWF) (Dee et al., 2011). The ERA-Interim predictors essentially represent the large-scale state of the observed atmospheric predictors and the point-scale predictands. The precise predictor variables used depend on the specific downscaling method and the chosen variable (Petisco de Lara, 2008; Amblar-Francés et al., 2017). The climate predictors of interest are selected using knowledge of physical processes as well as identifying those highly correlated with the predictand. This means that the selected predictors should be well simulated by GCMs to ensure statistically credible future projections. Hence, a statistical assumption that our predictors are related to the predictand is made. Reanalysis datasets are often used as proxies to GCMs for statistical downscaling. We are interested in maximum and minimum temperatures and precipitation.
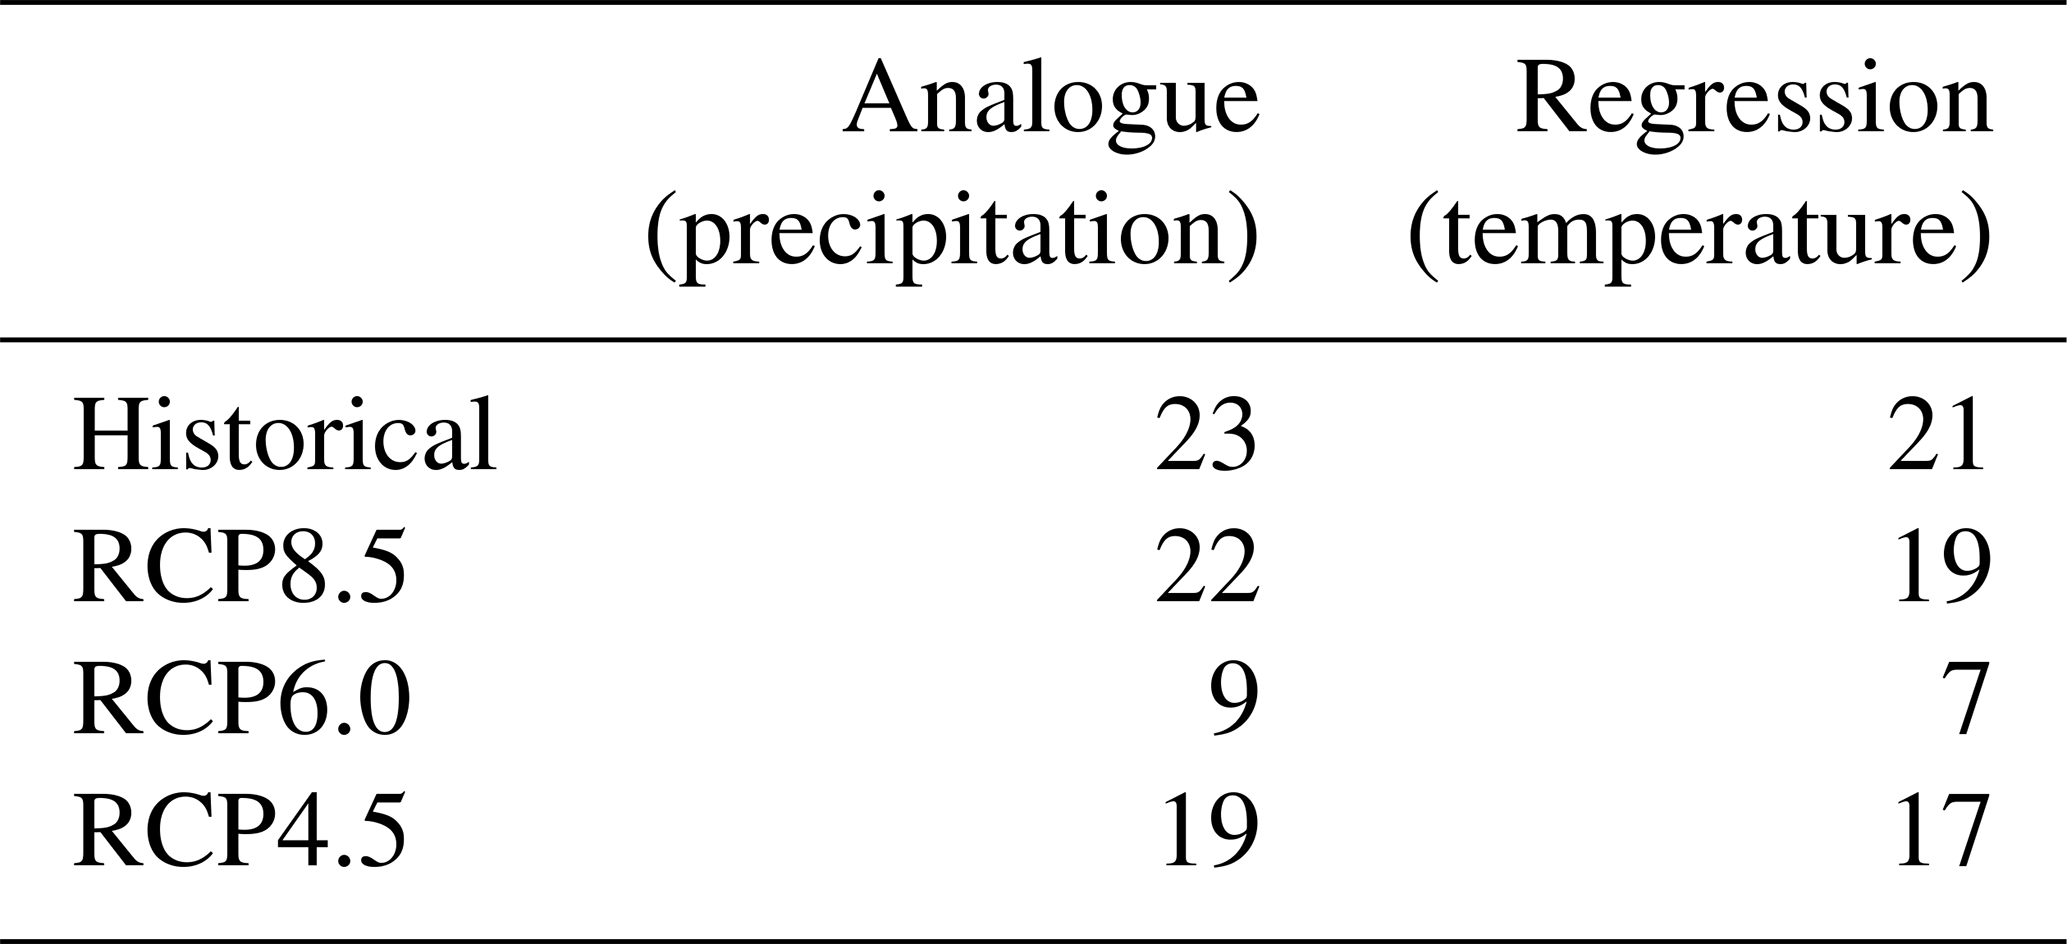
Finally, we consider 24 different GCMs from the CMIP5 (Table 2) and three Representative Concentration Pathways (RCPs). We have obtained 64 regionalized projections for temperature and 73 for precipitation (Table 3).
Table 2List of CMIP5 models used in the CLIMPY Regionalized Projections by AEMET.
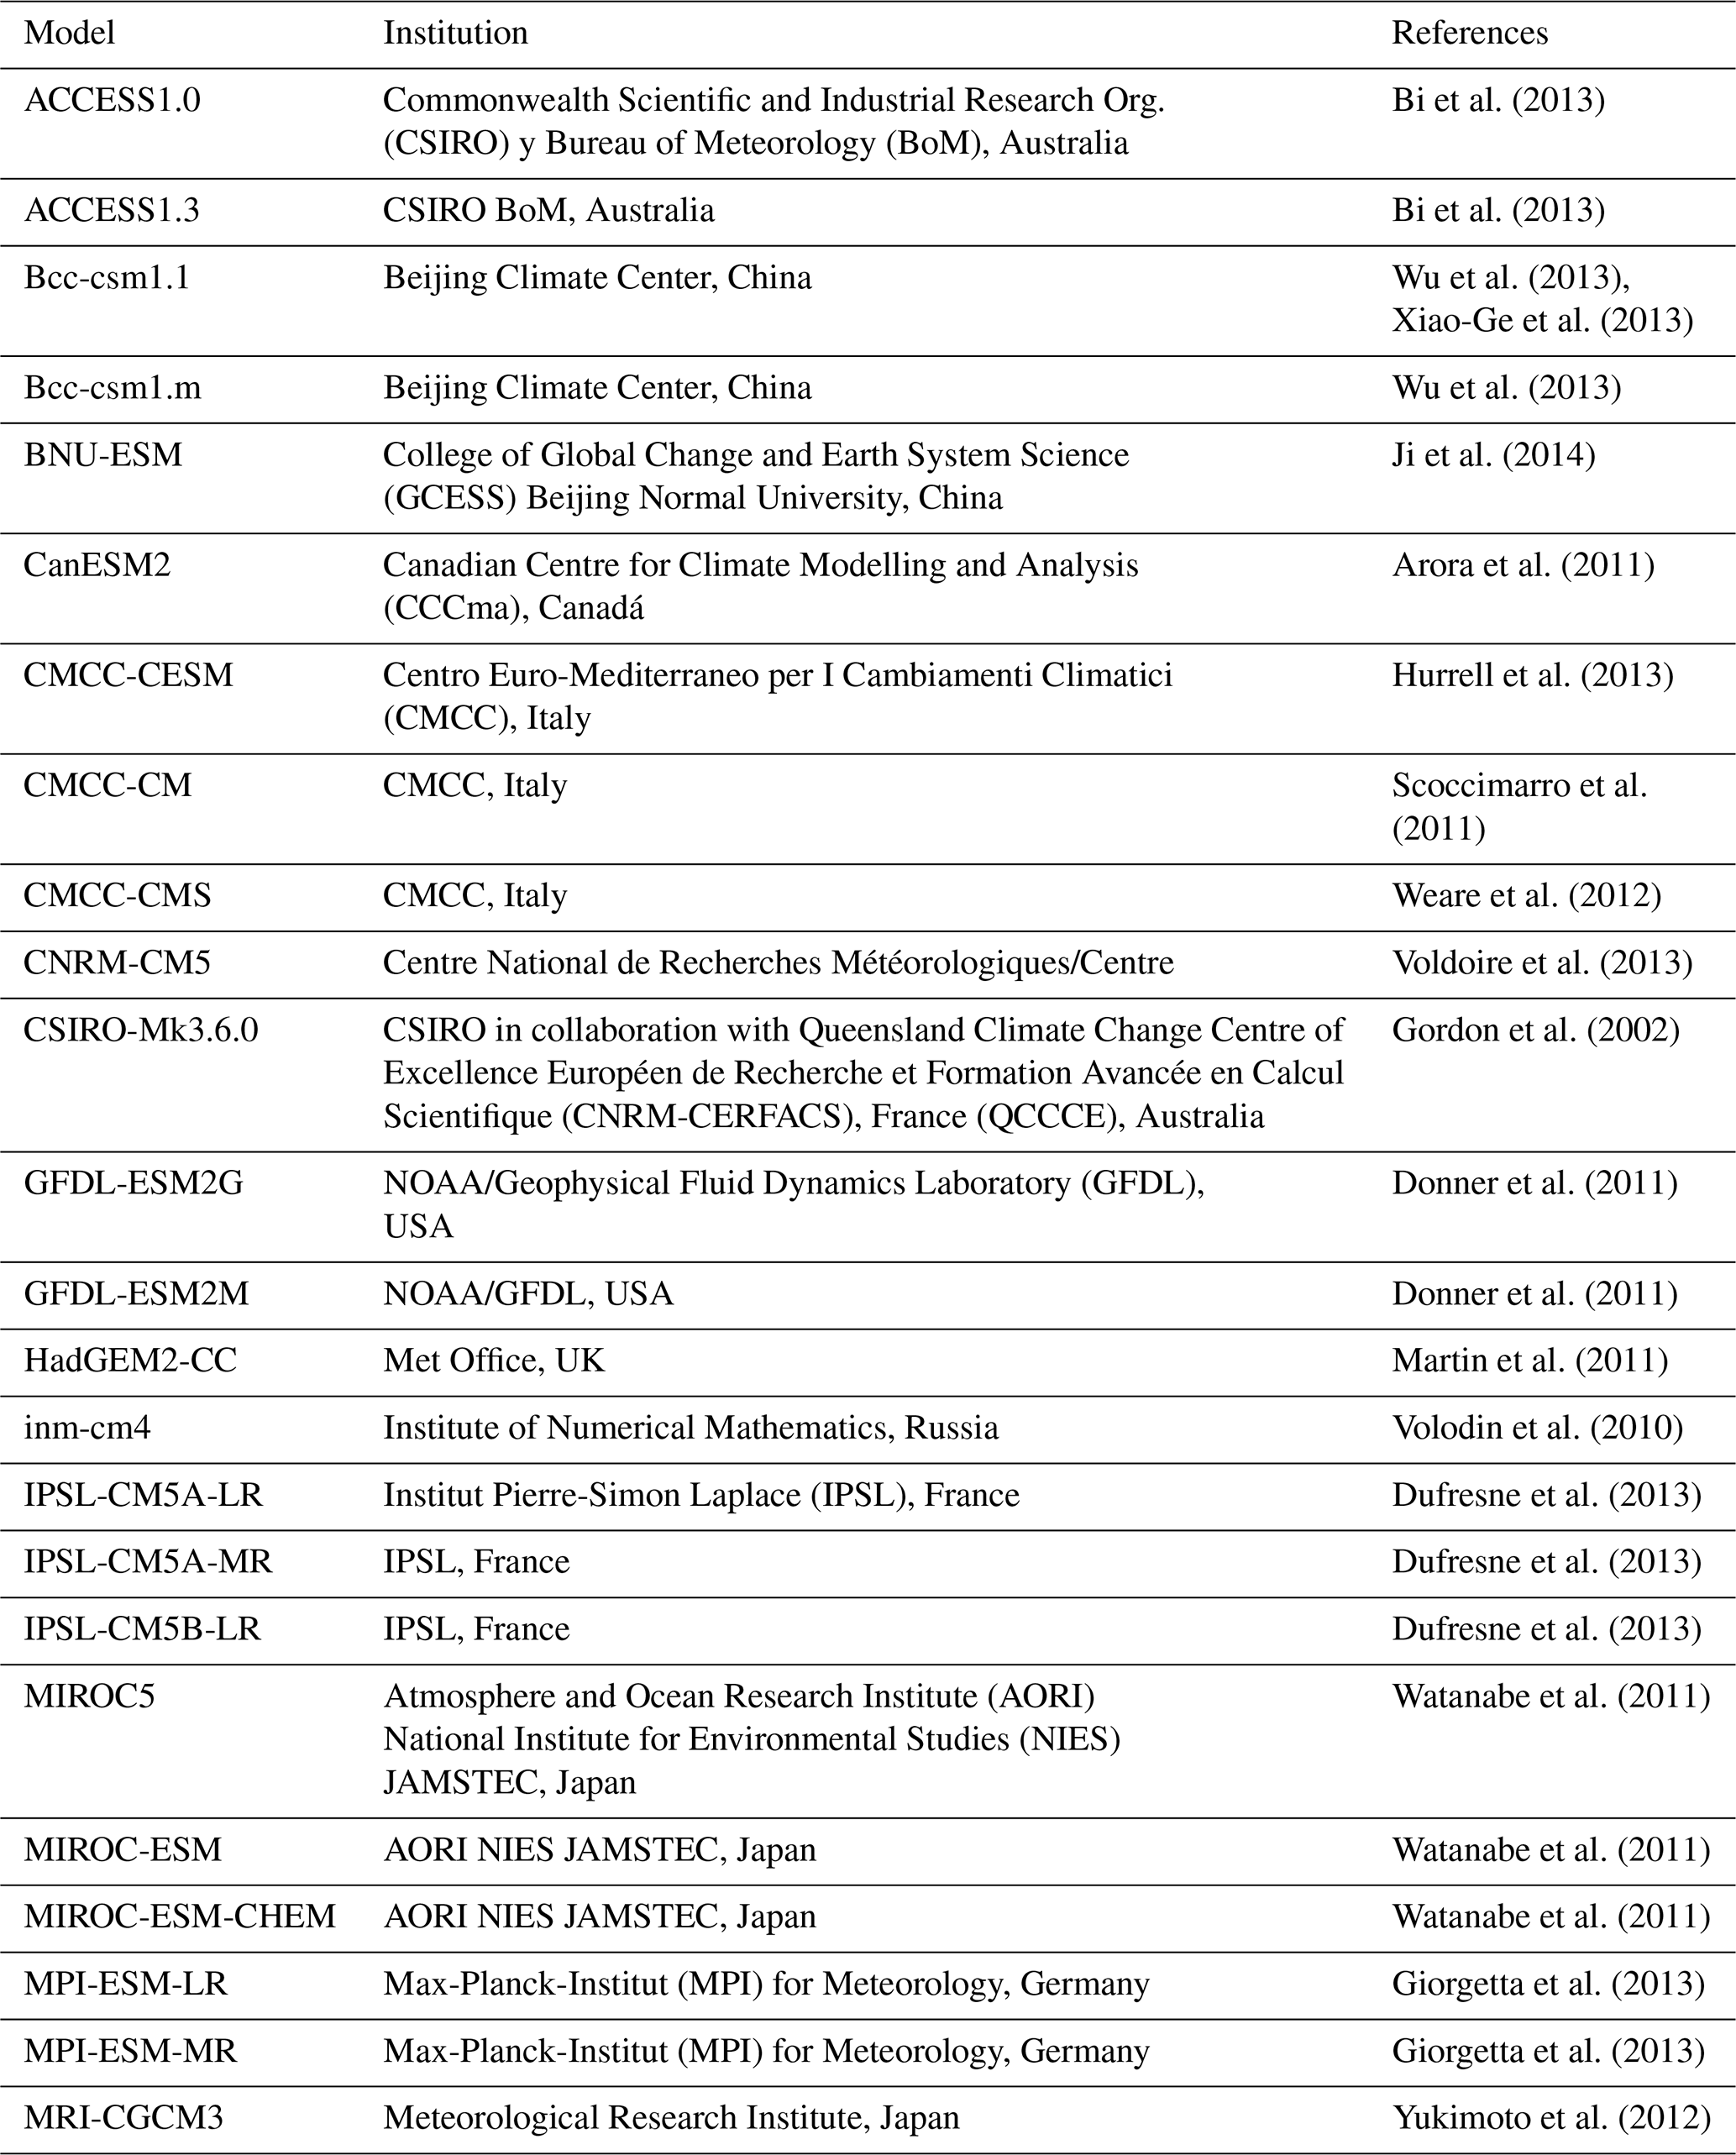
Table 3Regionalized projections of temperature (Tmax and Tmin) and precipitation obtained by statistical methods (regression and analogue) based on AR5-IPCC results.
We have addressed the analysis of climate change projections developed at AEMET, putting special emphasis on uncertainty analysis, considering various sources, i.e. several RCPs (RCP4.5, RCP6.0 and RCP8.5) and several CMIP5 models. The analysis focuses on the whole CLIMPY area and on the specific massifs. We keep track of the key messages of the SROCC (Special Report on the Ocean and Cryosphere in a Changing Climate (IPCC, 2019): in regions like Pyrenees, with mostly smaller glaciers and relatively little ice cover; glaciers have suffered a reduction of 88.25 % since 1850, and a rapid wastage since 1980s, confirming the accelerated shrinkage during the end of the 20th century and the first decade of the 21st century (Rico et al., 2017).
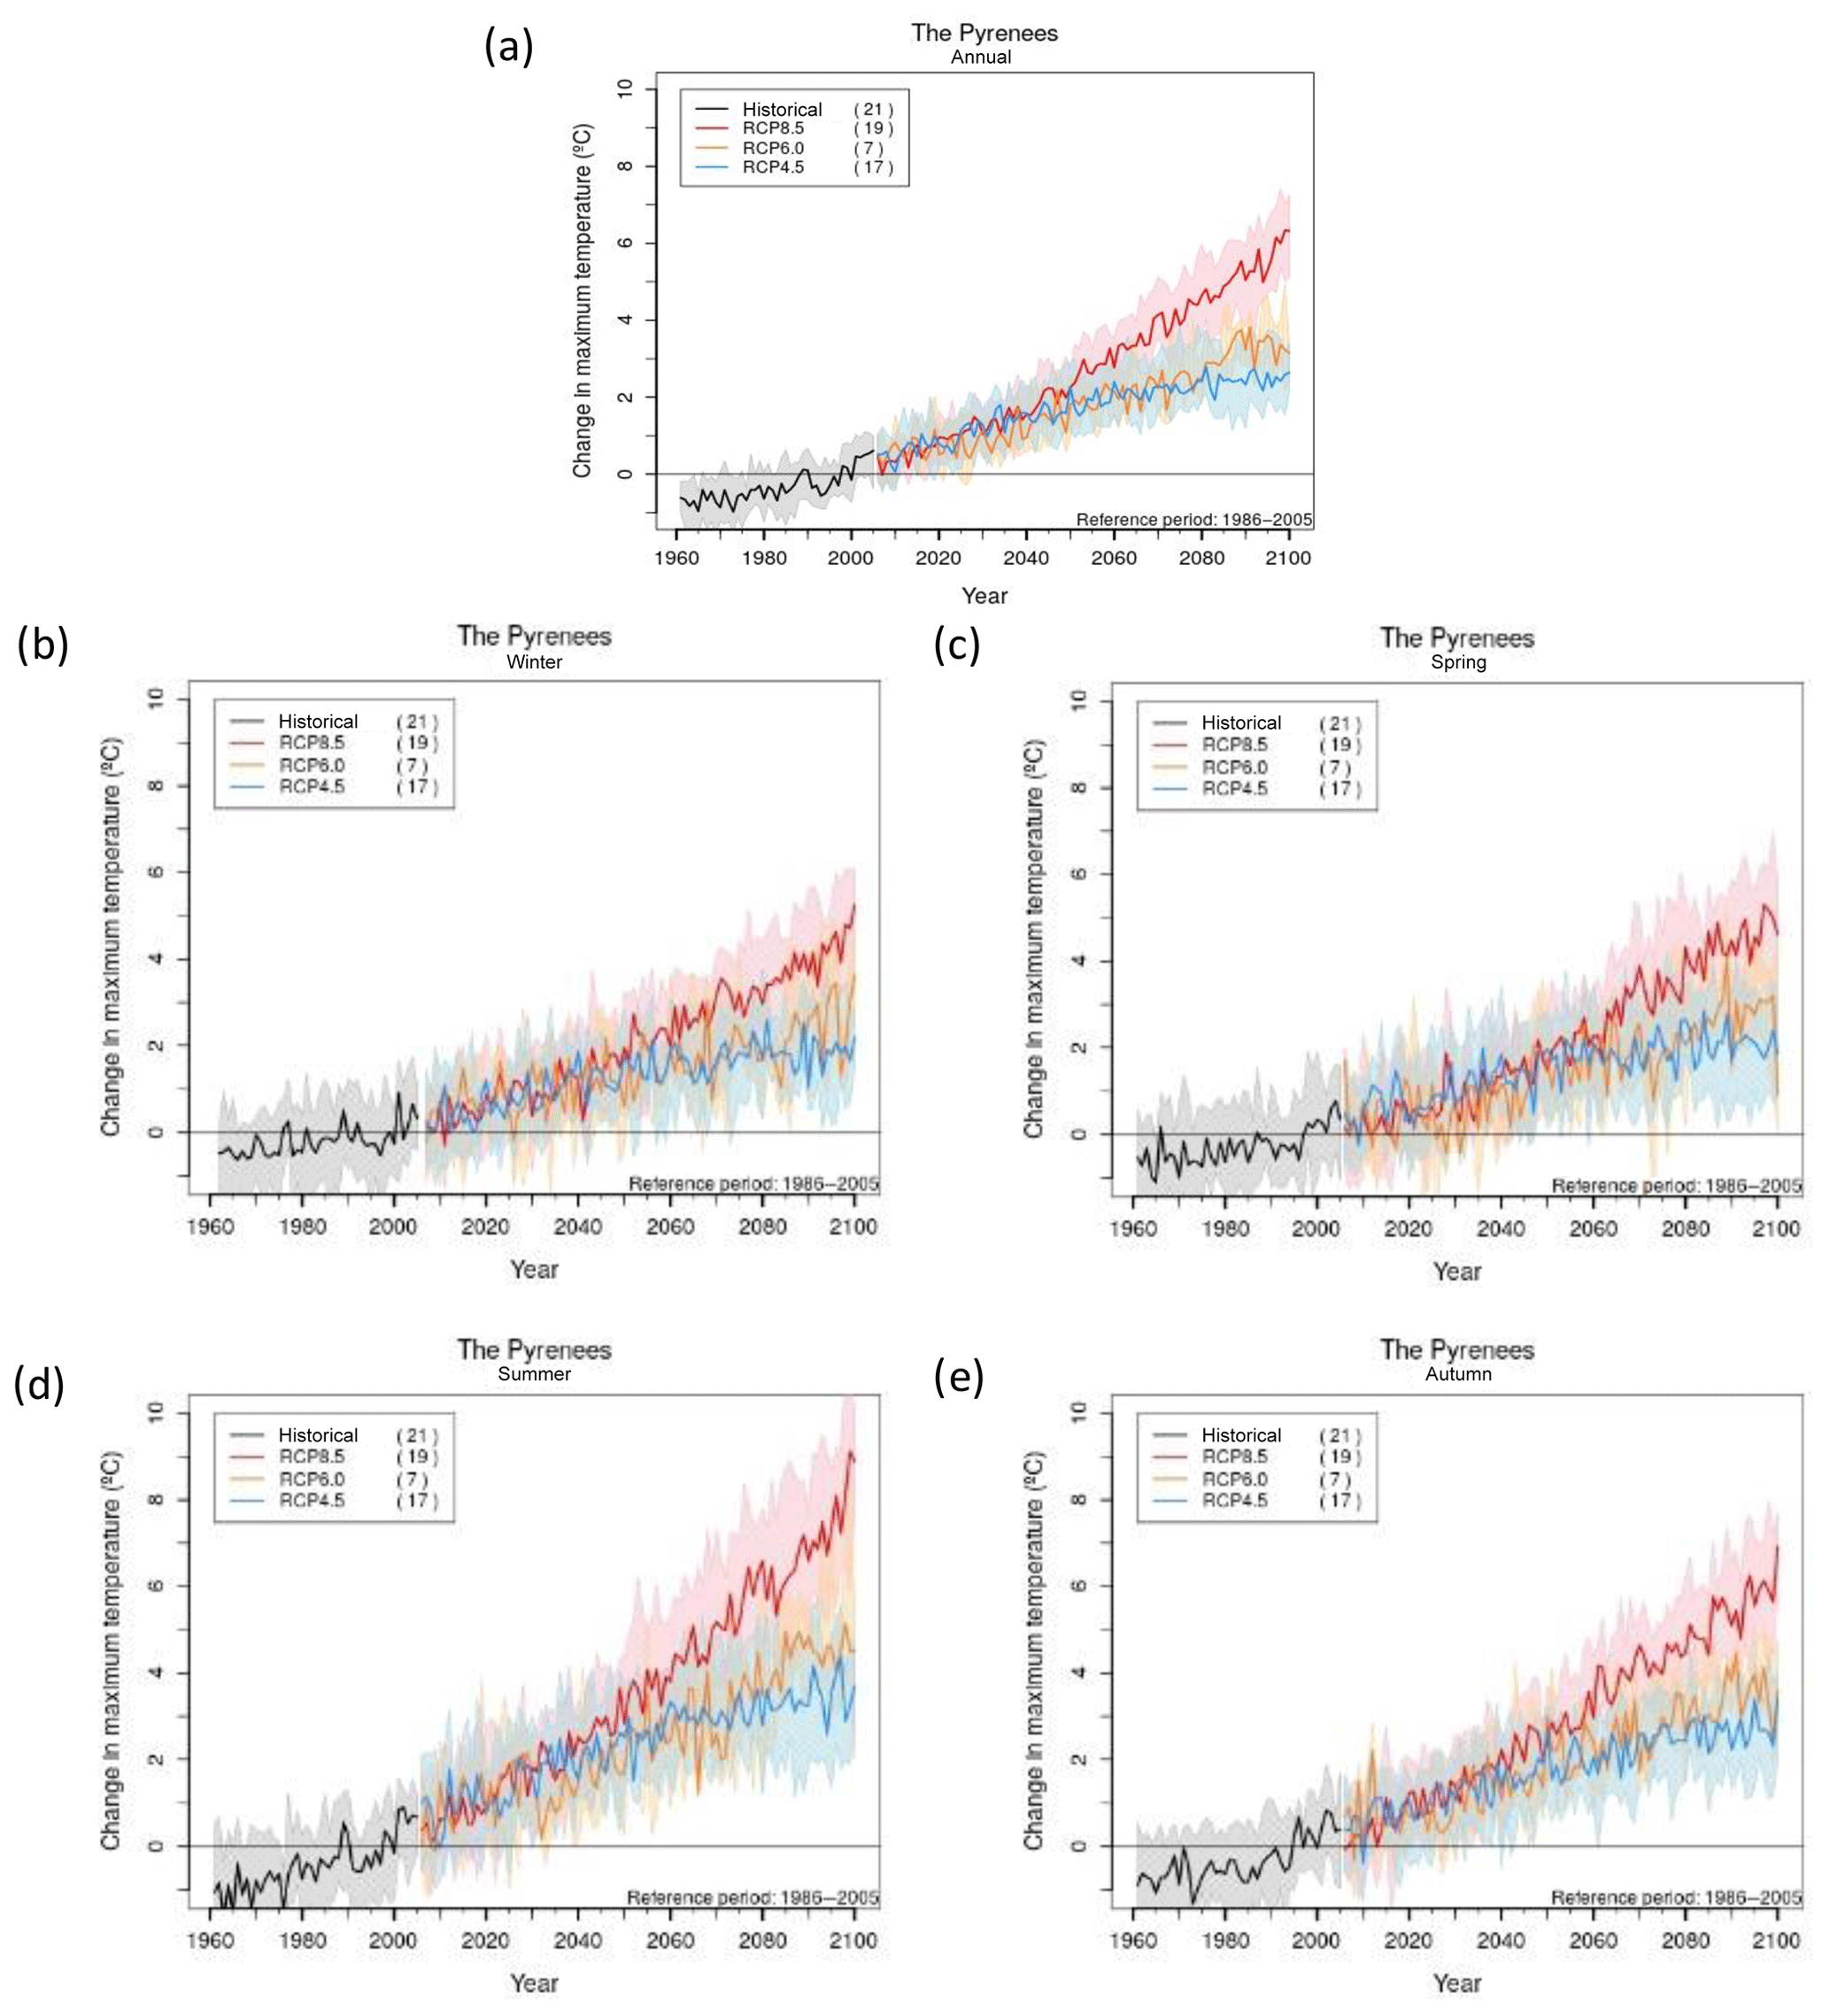
Figure 3Evolution of downscaled maximum temperature change for the Pyrenees corresponding to: (a) annual average, (b) winter, (c) spring, and (d) summer and (e) autumn. Median is represented by thick line and shadow represents 17th and 83rd percentiles. Number in parentheses indicates the number of models used for the corresponding emission scenario.
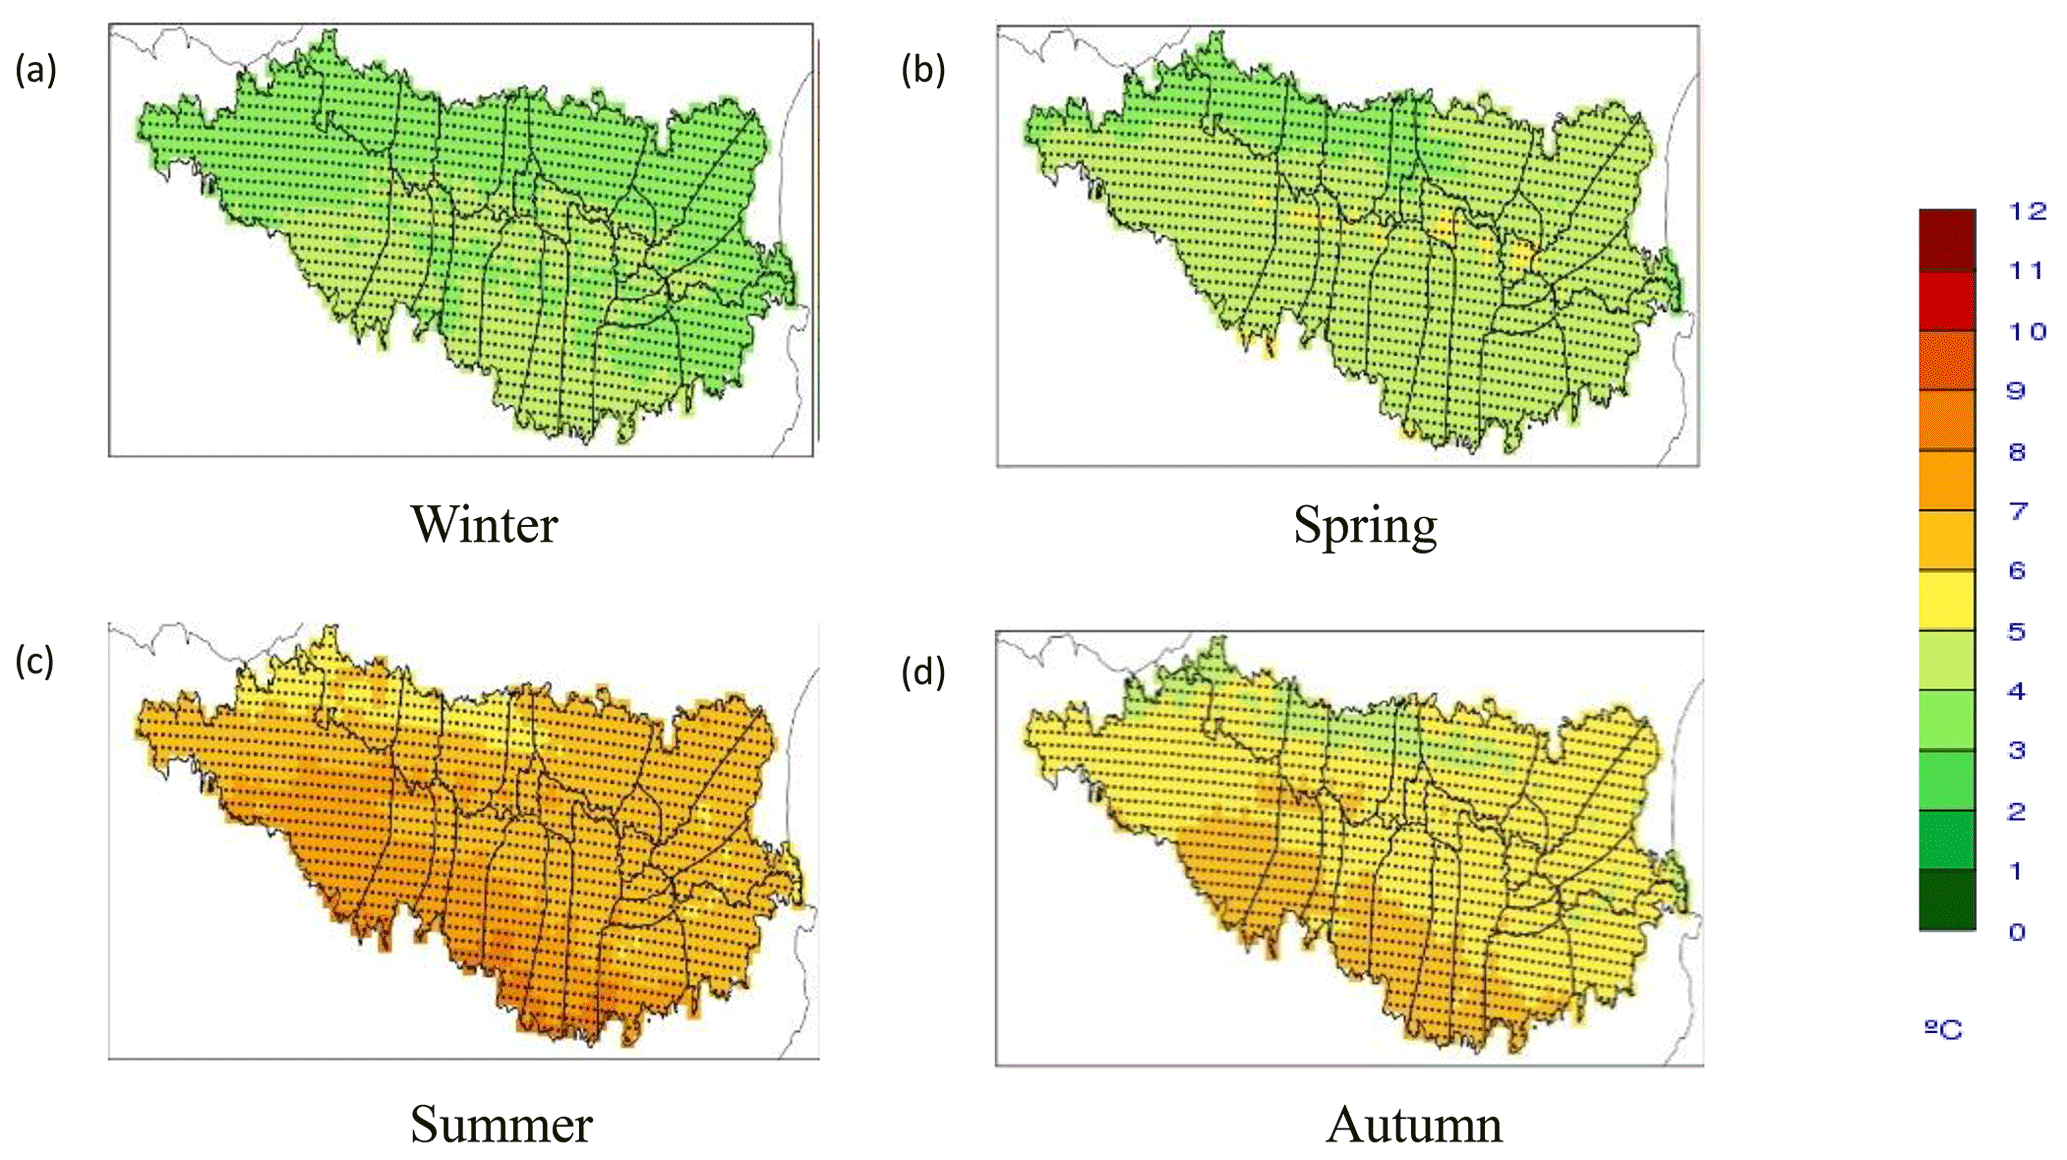
Figure 4Maps of maximum temperature anomaly for different seasons (a–d) and for RCP8.5 scenario and 2090 horizon. Stippled area reflects major signal ().
4.1 Maximum and minimum temperatures (regression method)
The analysis of Figs. 3 and 4 indicates that daily maximum temperature will increase during 21st century for all analyzed RCP (RCP8.5, RCP6.0 and RCP4.5), seasons and all places in this region. The increase will be more pronounced for the most emissive scenario (RCP8.5) and for the end of century, where, on average, temperatures will be between 4.0 and 6.3 ∘C with respect to the reference period (1986–2005). The same behavior is detected in the minimum temperature (Figs. 5 and 6), though the range of values will be between 3.2 and 4.9 ∘C. Uncertainties increase with time, both those linked to scenarios (separation of lines) and those related to models (width of shadowed zone). At the end of the 21st century, the uncertainty linked to emission scenarios is larger than the associated to models, for both maximum and minimum temperatures. This behavior is also found in all the 23 Pyrenean massifs (Figs. 7–8, and Figs. S1–S2 in the Supplement). Focusing on the seasonal behaviour, not surprisingly, the increase is greater in summer; thereby highlighting the specific sensitivity of mountain conditions to global climate conditions.
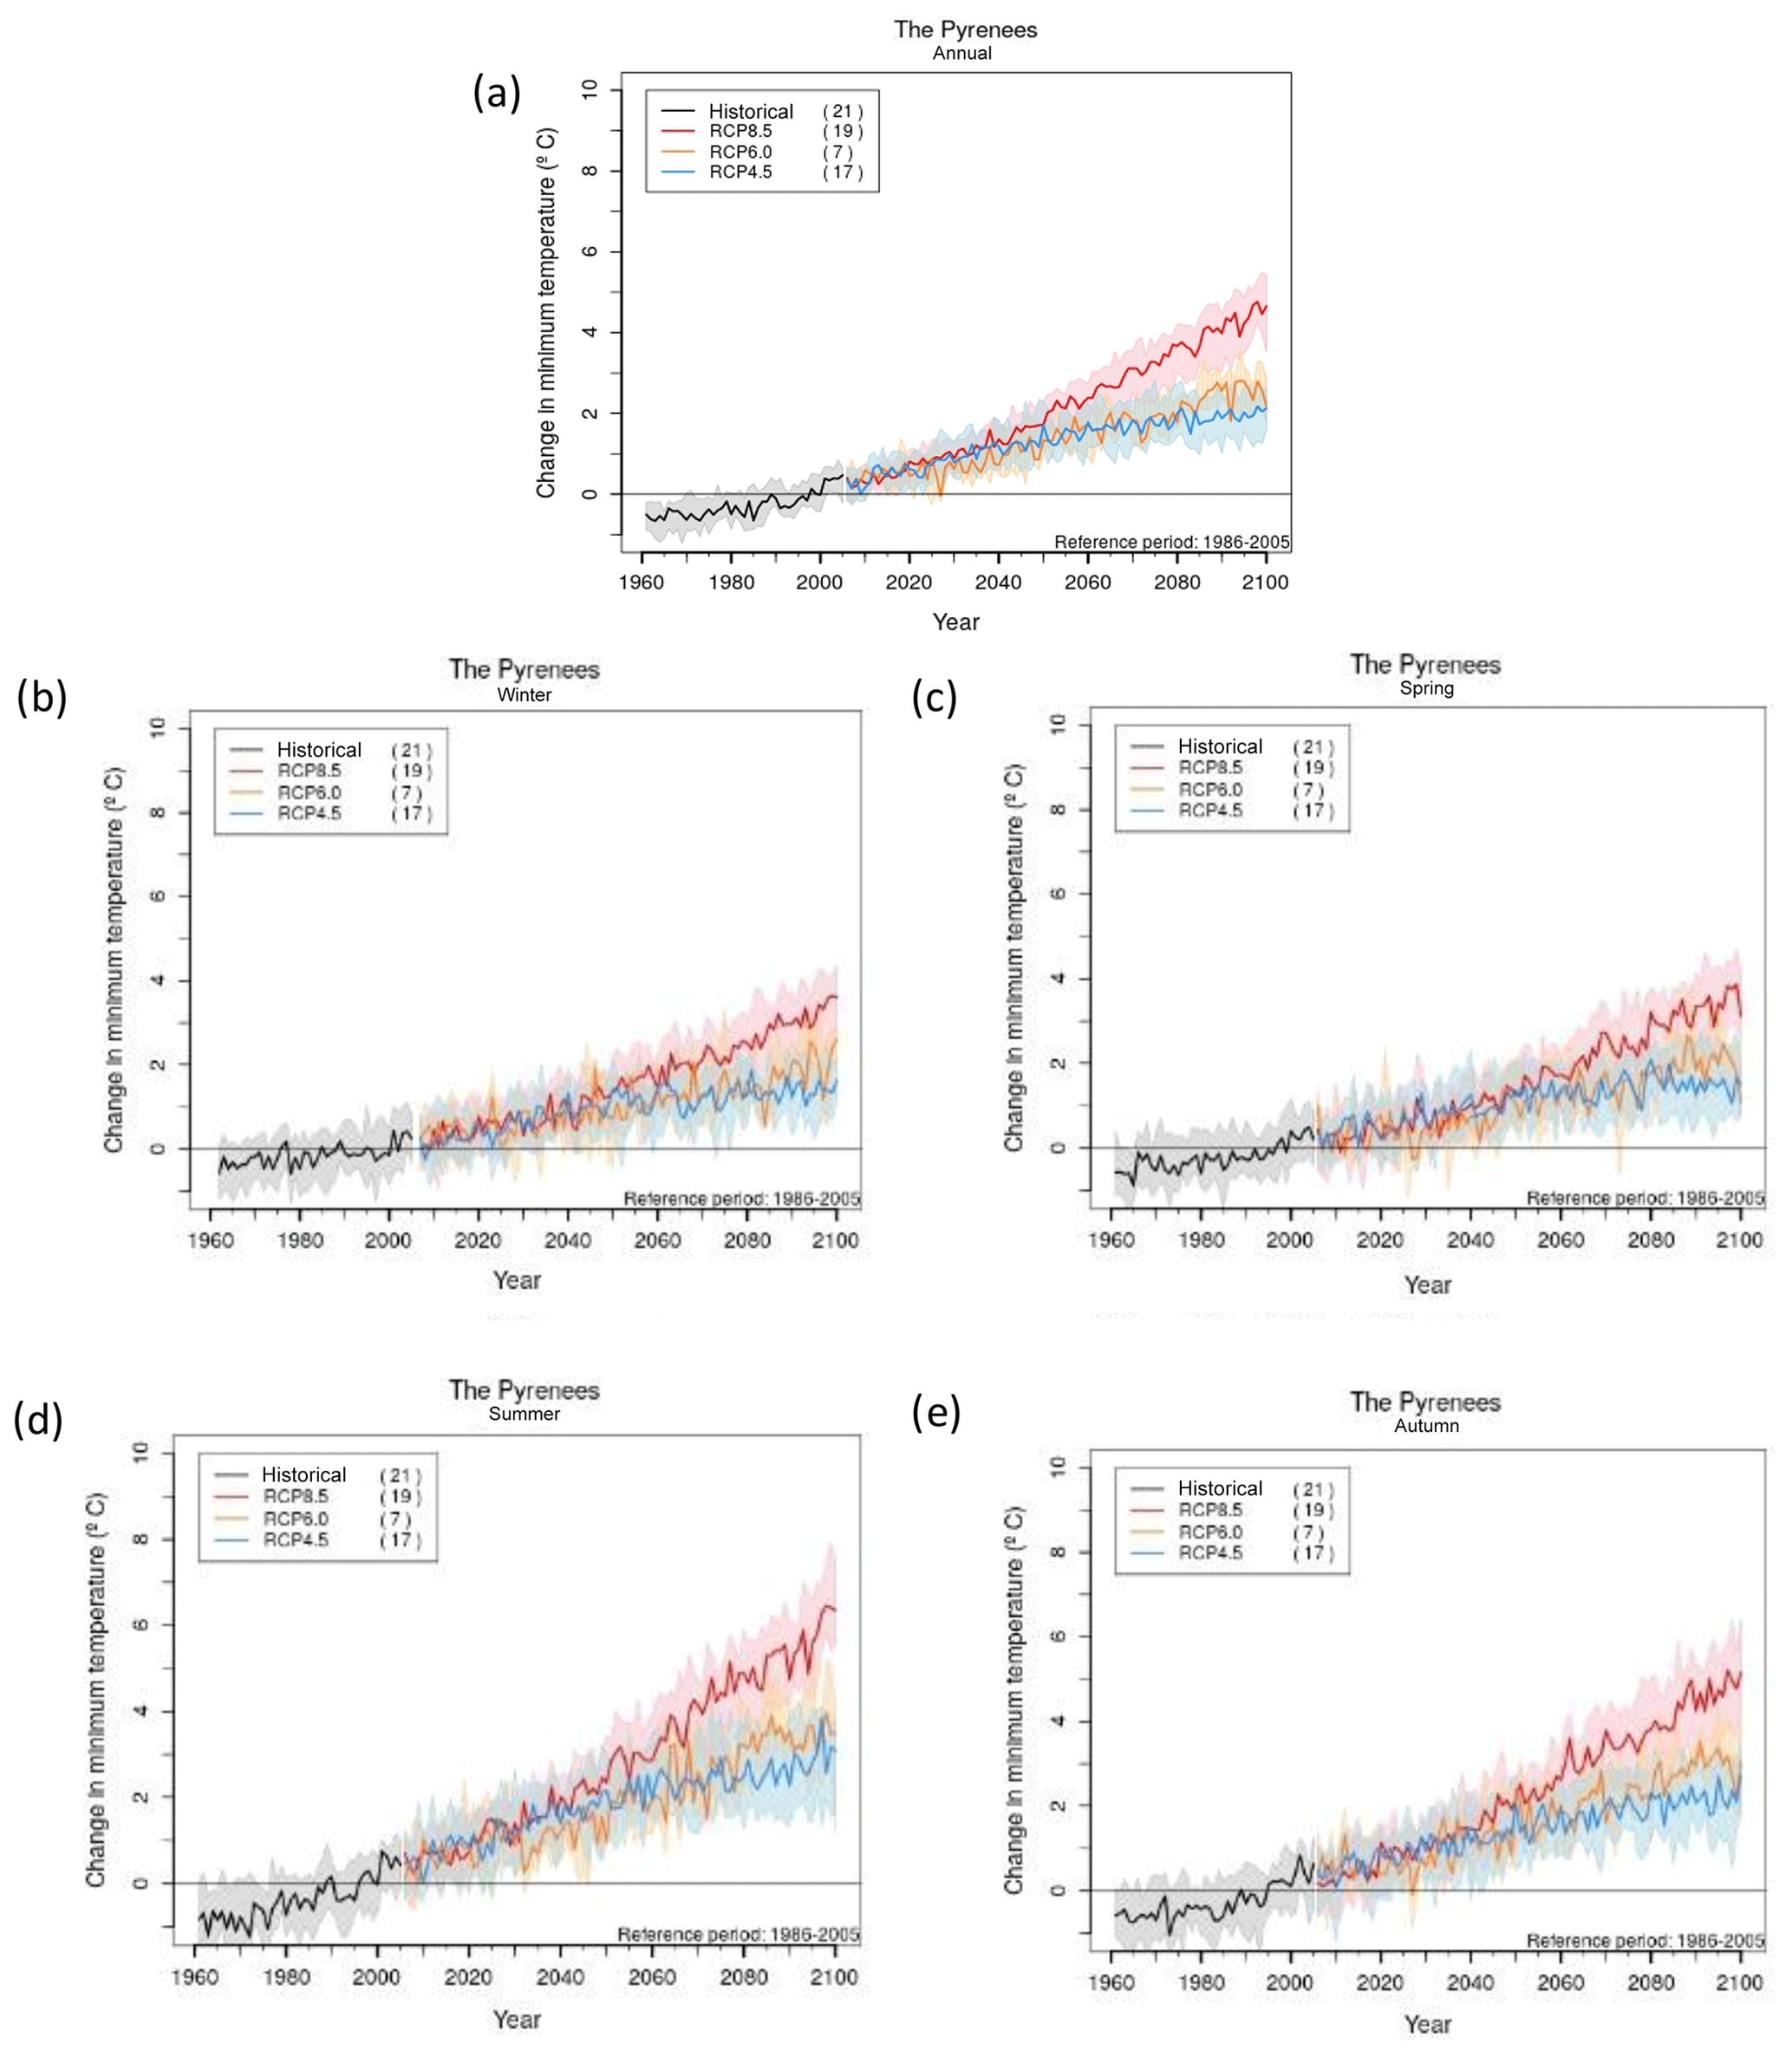
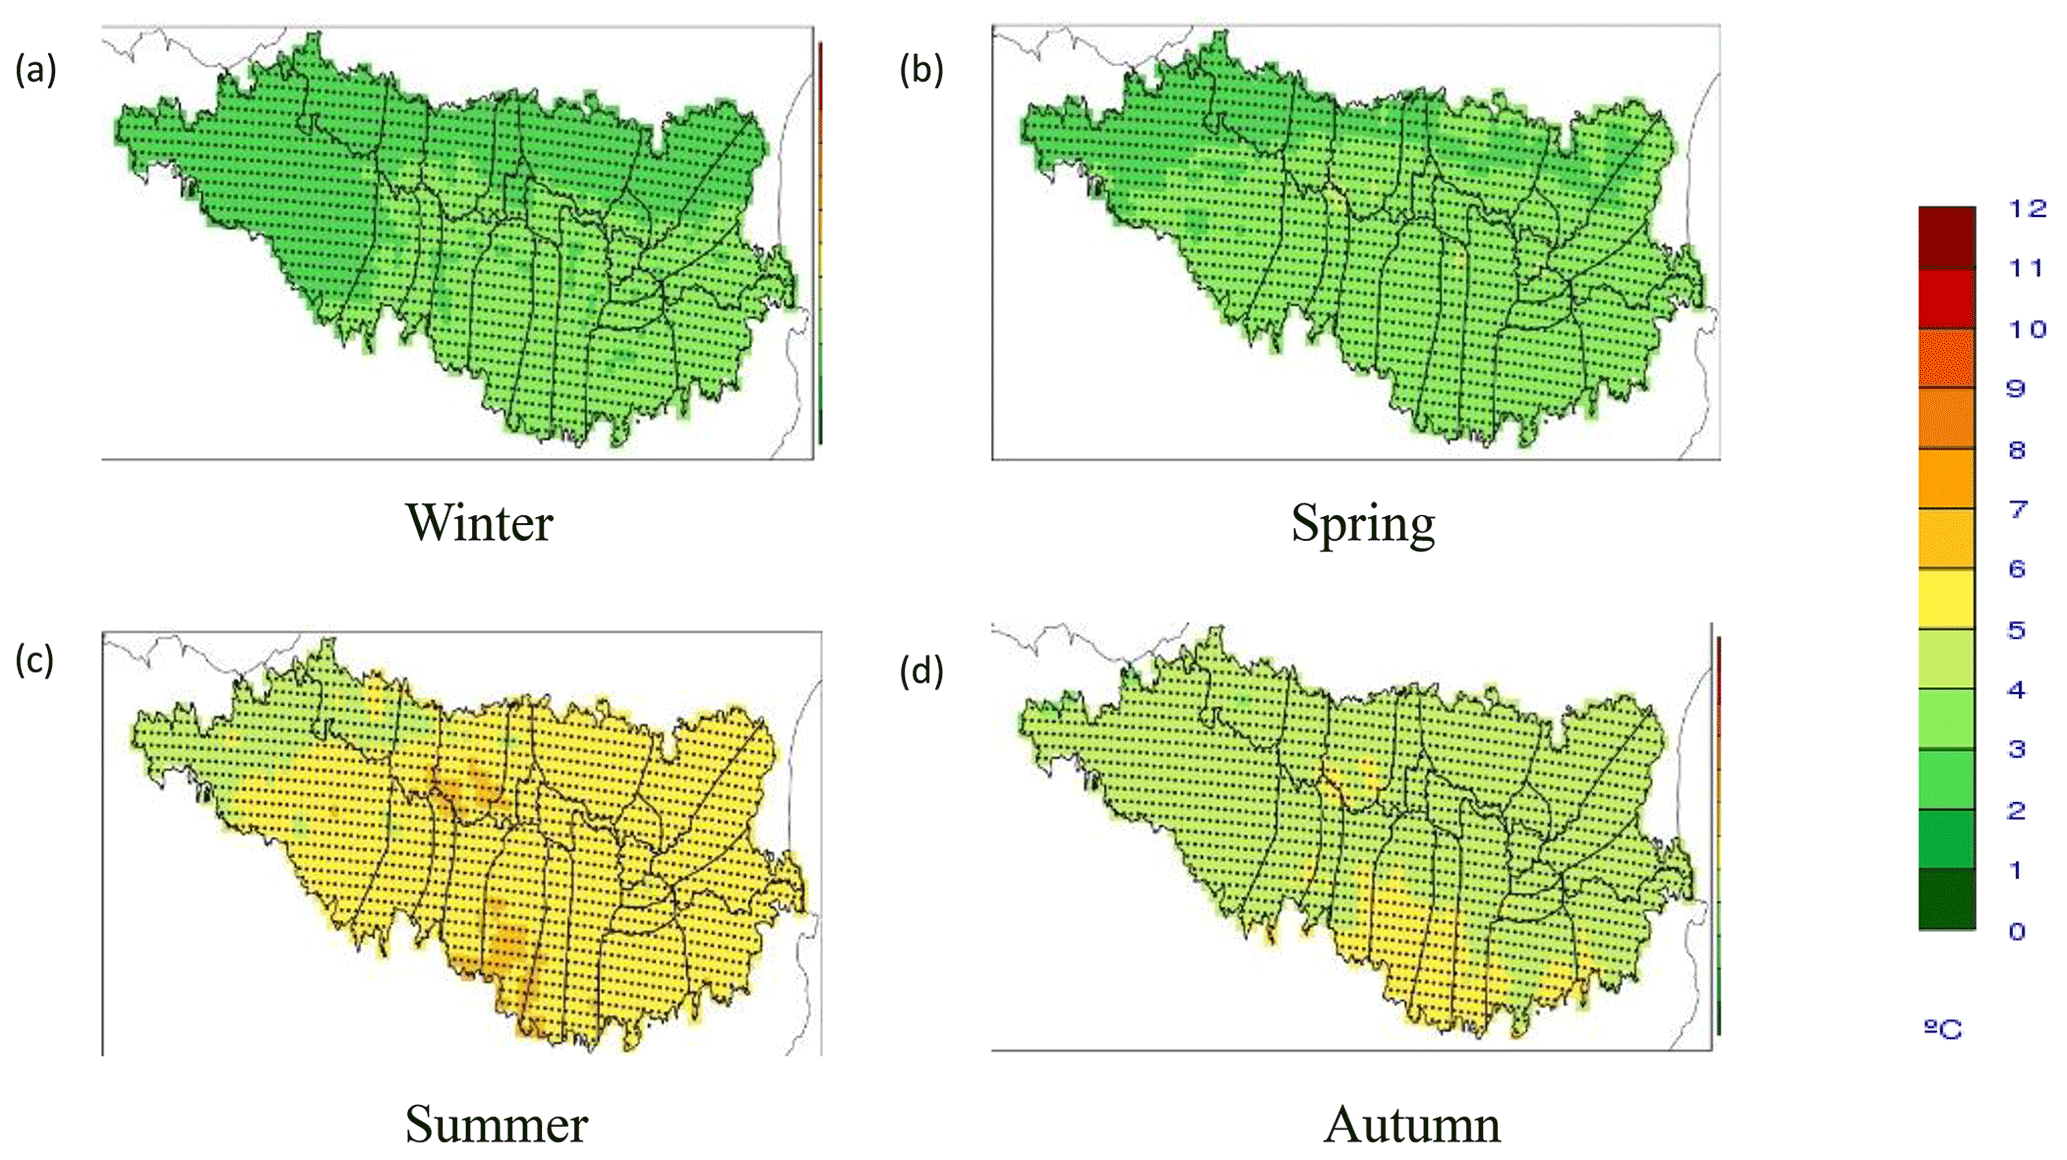
Figure 6The same as Fig. 4 but for minimum temperature.
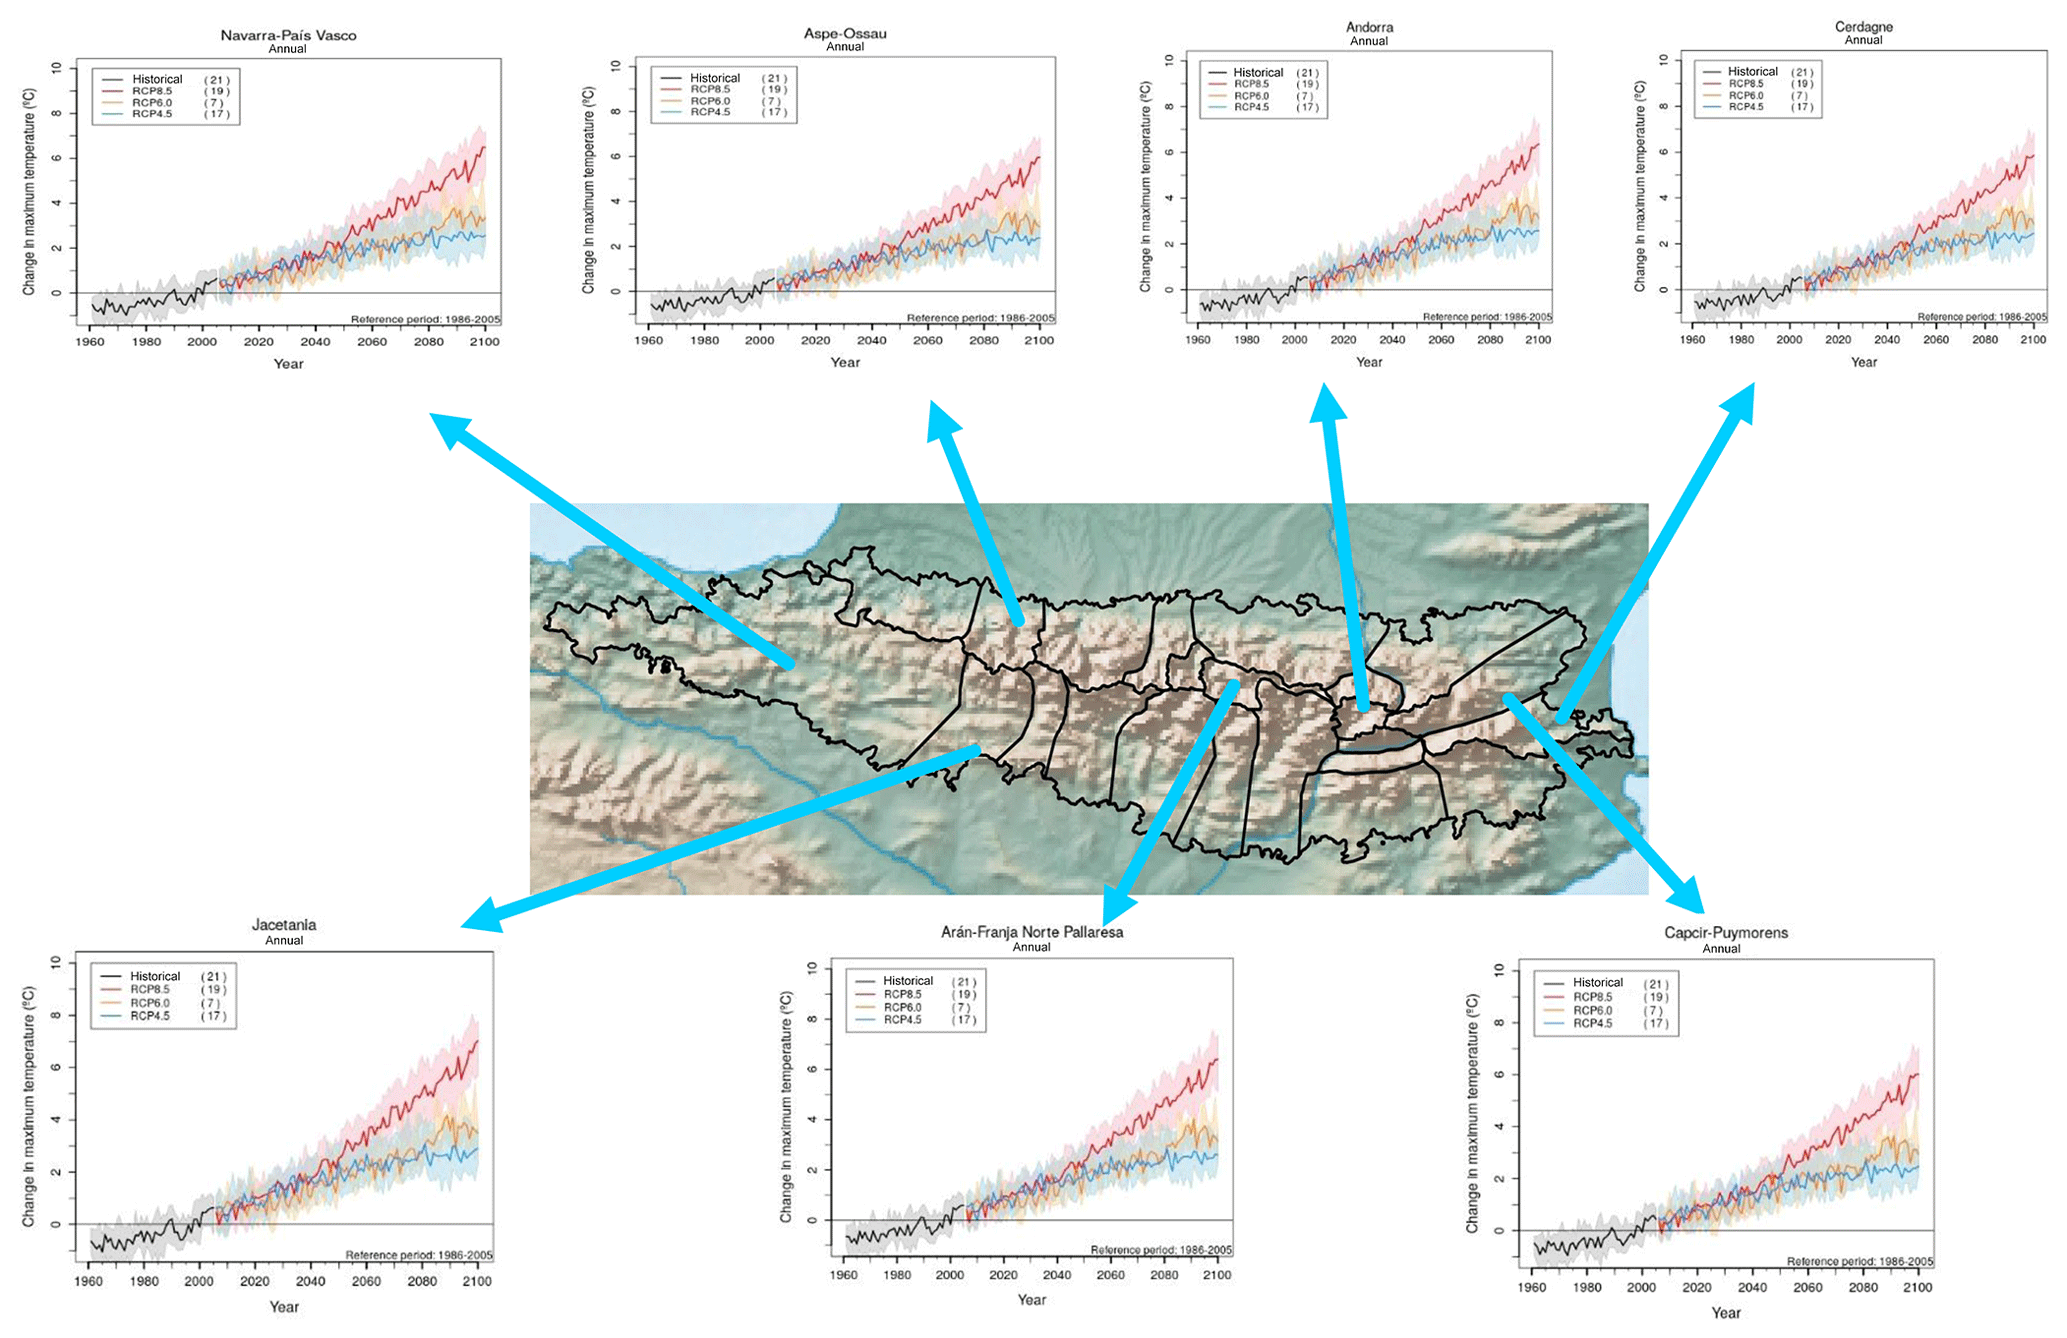
Figure 7Evolution of downscaled maximum temperature change for seven selected massifs in the Pyrenees. Median is represented by thick line and shadow represents 17th and 83rd percentile. Number in parentheses indicates the number of models used for the corresponding emission scenario.
Spatially, both variables (Figs. 4–6) display the larger increases over the south region and in summer season; more noticeable for maximum temperature (7–10 ∘C) than for minimum temperature (4–7 ∘C); reflecting major signals in the former than in the latter variable. It is worth mentioning that maximum temperature also exhibits larger increases in autumn and in the south region (5–8 ∘C).
As far as the extreme indexes related to maximum temperature, we have selected the number of warm days (WD) and the warm spell duration index (WSDI) while for minimum temperature, the number of warm nights (WN) and the number of frost days (FD) (see Karl et al., 1999). The analysis of the temporal evolution of these indexes shows an increase of WD and WN that is especially noticeable at the end of the century and for the more emissive scenarios, where the increases probably will be between 10–55 d for WD, 10–40 d for WSDI and 10–55 d for WN (Figs. 9a–d and S3–S6). On the contrary, FD shows a decline, more pronounced for the RCP8.5 and for the end of century (∼60 d). As happened with maximum and minimum temperatures, the influence of scenario is noticed from approximately 2050, and though there is an increase with time in both uncertainties, the one linked to scenarios as well as the associated to models; the first predominates over the second.
Spatially (Fig. 9e–h), all the extreme indexes show a clear signal, being the changes greater than the uncertainties associated with climate models. Both WD and WN exhibit an increase that is larger in the south and south-east parts, values that are around 45–50 d. The WSDI depicts a different behavior between the north and south parts: higher values mainly located in the south-east part (∼35 d) and lower values, in the north and northwestern parts (∼5–10 d). Finally, the FD shows a decline, which is larger in the central part (80 d) where the higher elevations are located, and where at present, there is a large number of FD. Indeed, projections of extreme temperature changes always show regional variability that can be partly attributed to mechanisms involving coupling between the surface and the atmosphere. Perhaps, for instance, heat waves might be intensified by a decrease in soil moisture due to reduced cooling caused by evaporation. Still today, our understanding of how climate change may affect heatwaves remains limited. Droughts and heatwaves have been suggested to intensify and propagate via land–atmosphere feedbacks (Miralles et al., 2019).
To sum up, with respect to the changes in maximum and minimum temperatures in the future period, we detect the influence of scenario, a tendency to the increase (in general and for massif), larger uncertainties to the end of 21st century and larger increase under RCP8.5 conditions and for maximum temperatures. As regards changes in temperature extreme indexes, they are especially noticeable at the end of the century and for the RCP8.5 scenario; mainly decline in the number of frost days, noticeable increase in the number of warm days and nights, and an increase in the warm spell duration index.
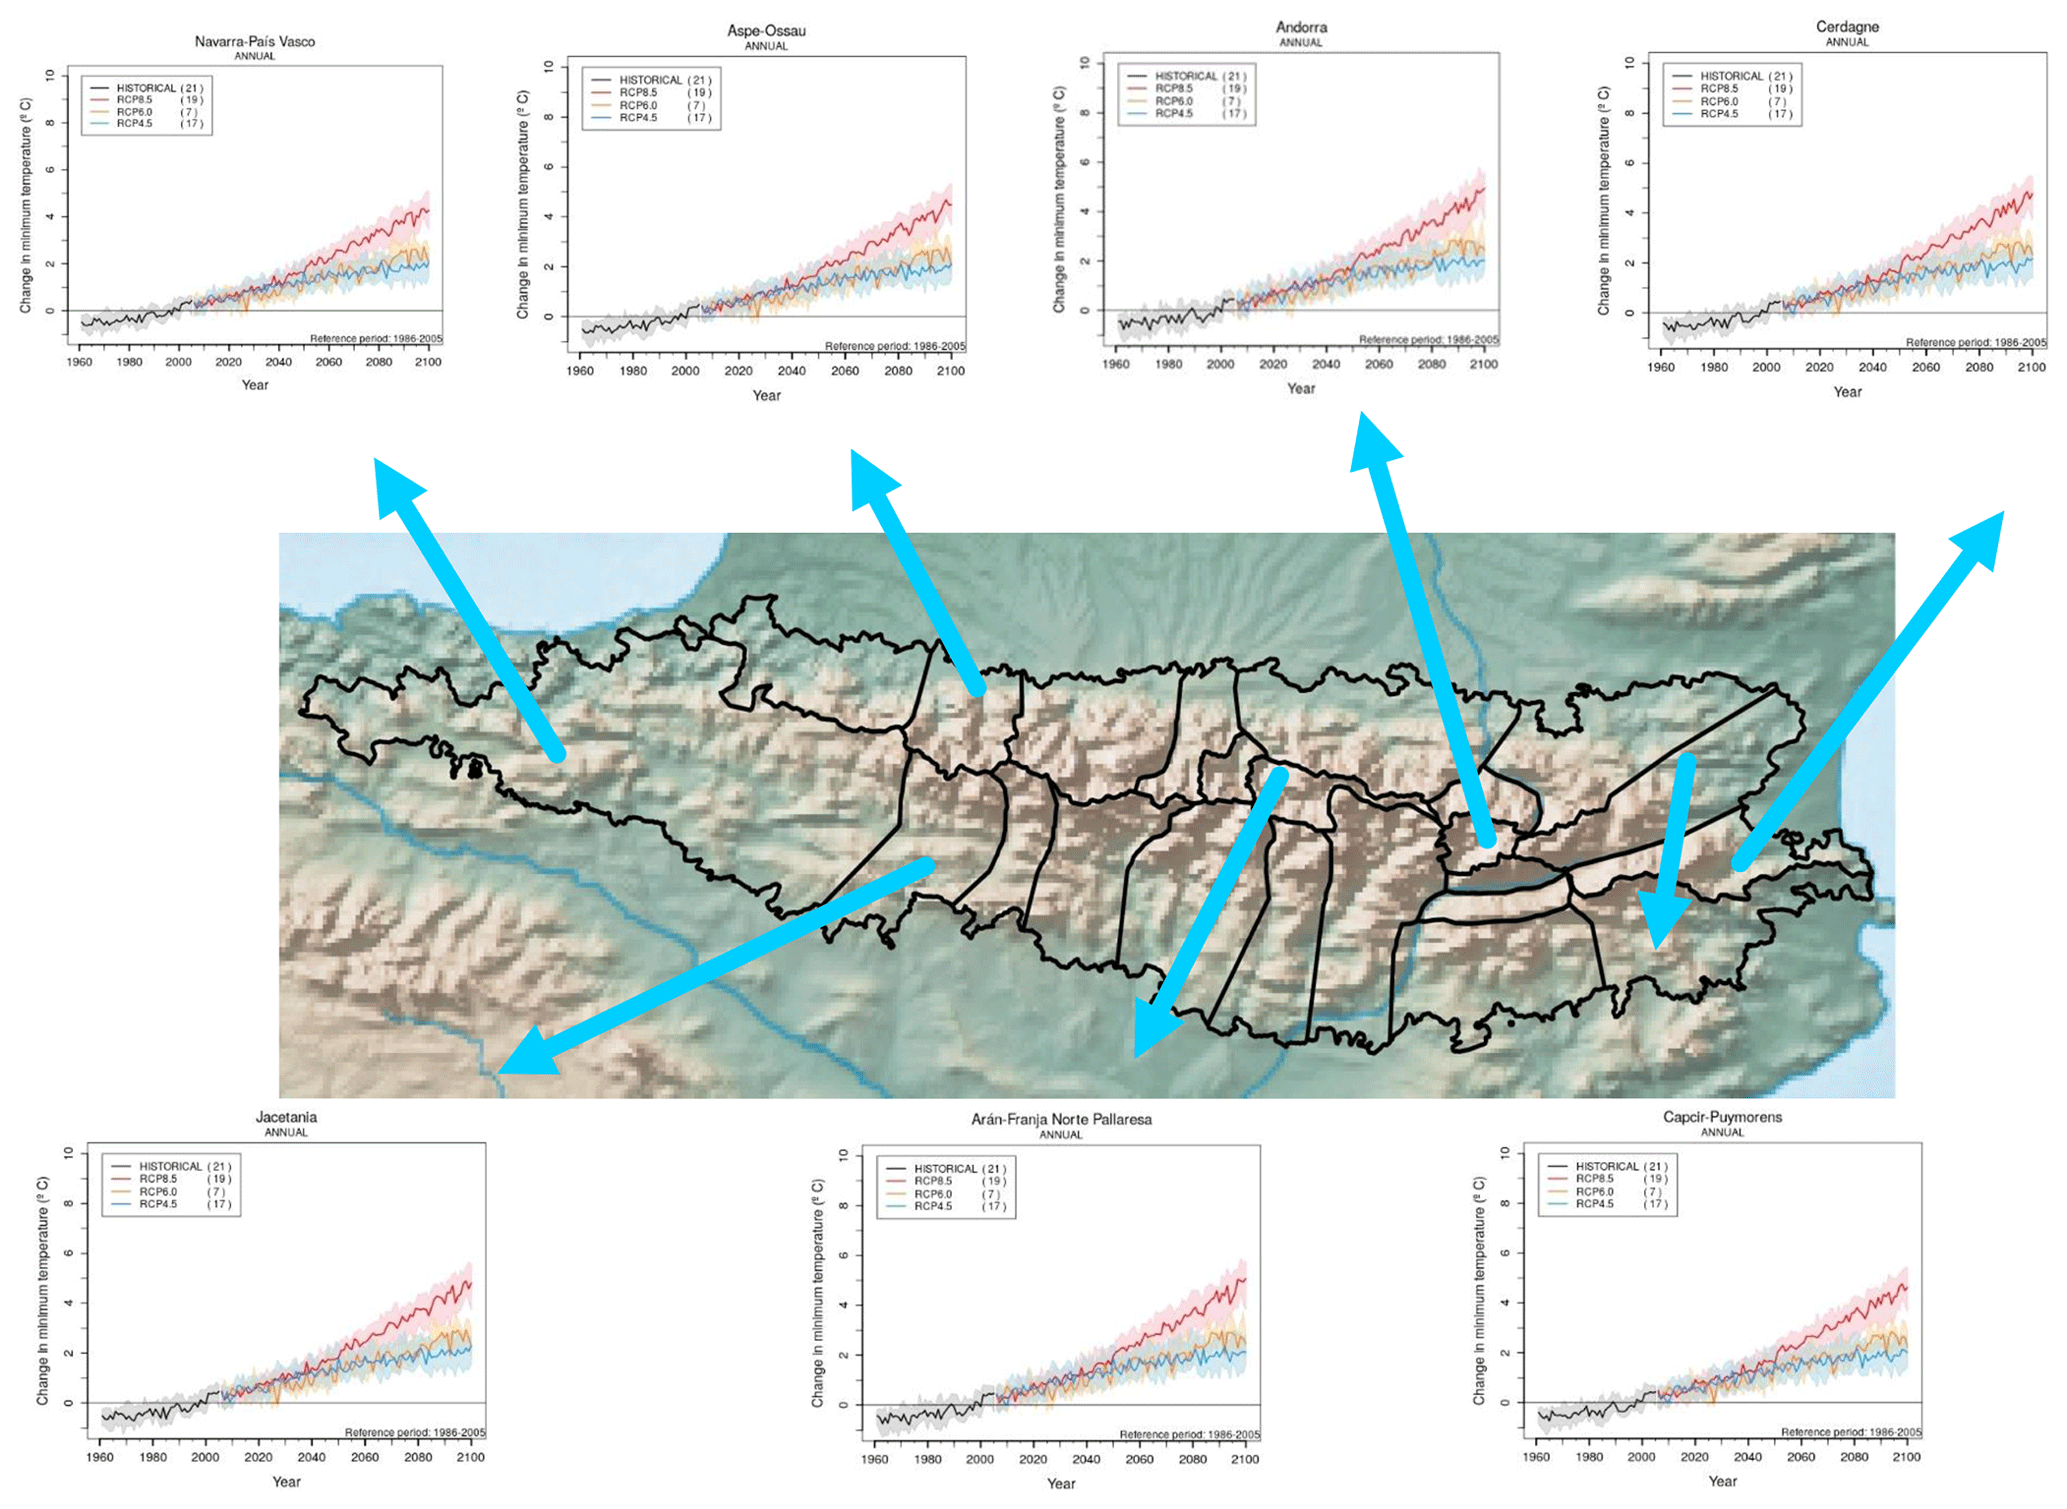
Figure 8The same as Fig. 7 but for minimum temperature.
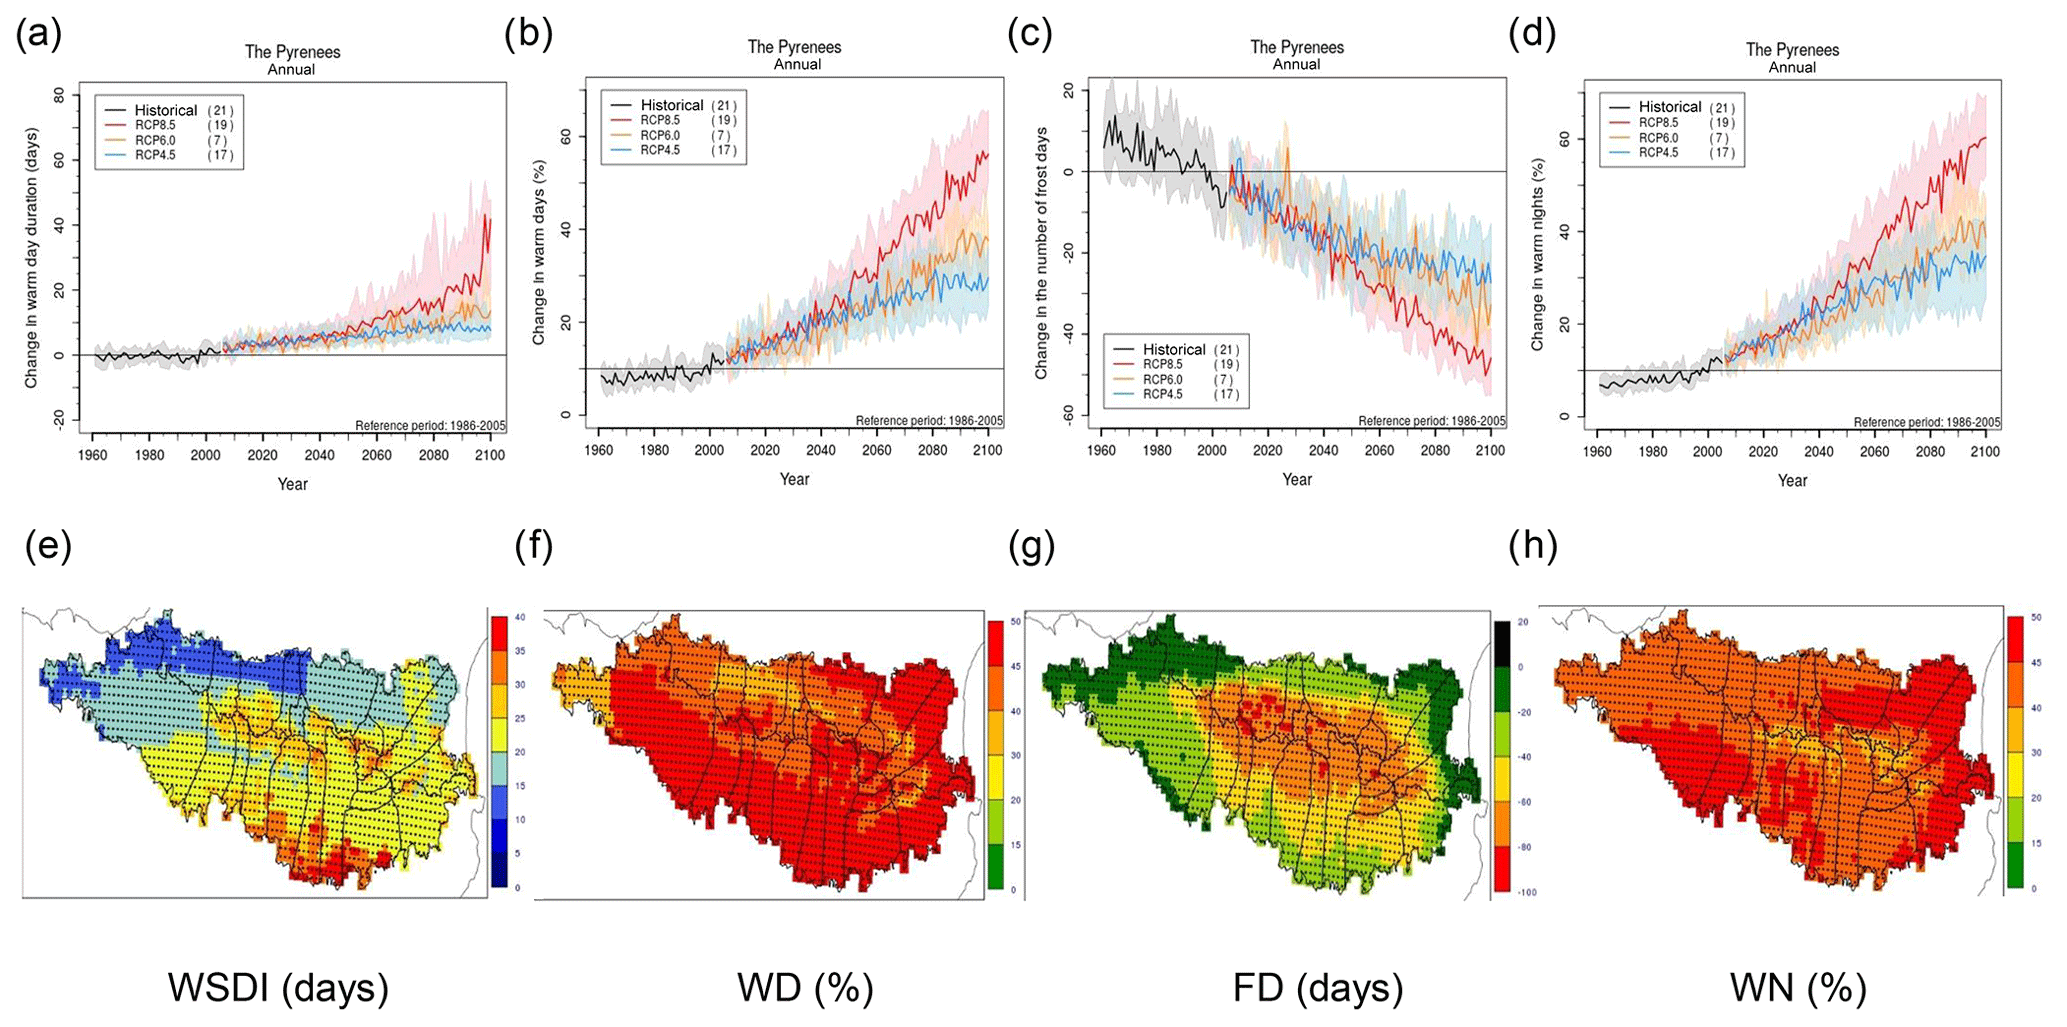
Figure 9Evolution of some downscaled extreme temperature indexes computed at annual scale. (a) WSDI; (b) WD; (c) FD; and (d) WN. Maps of the median for the same extreme temperature indexes (e–h) and for RCP8.5 scenario and 2090 horizon. Stippled area reflects major signal ().
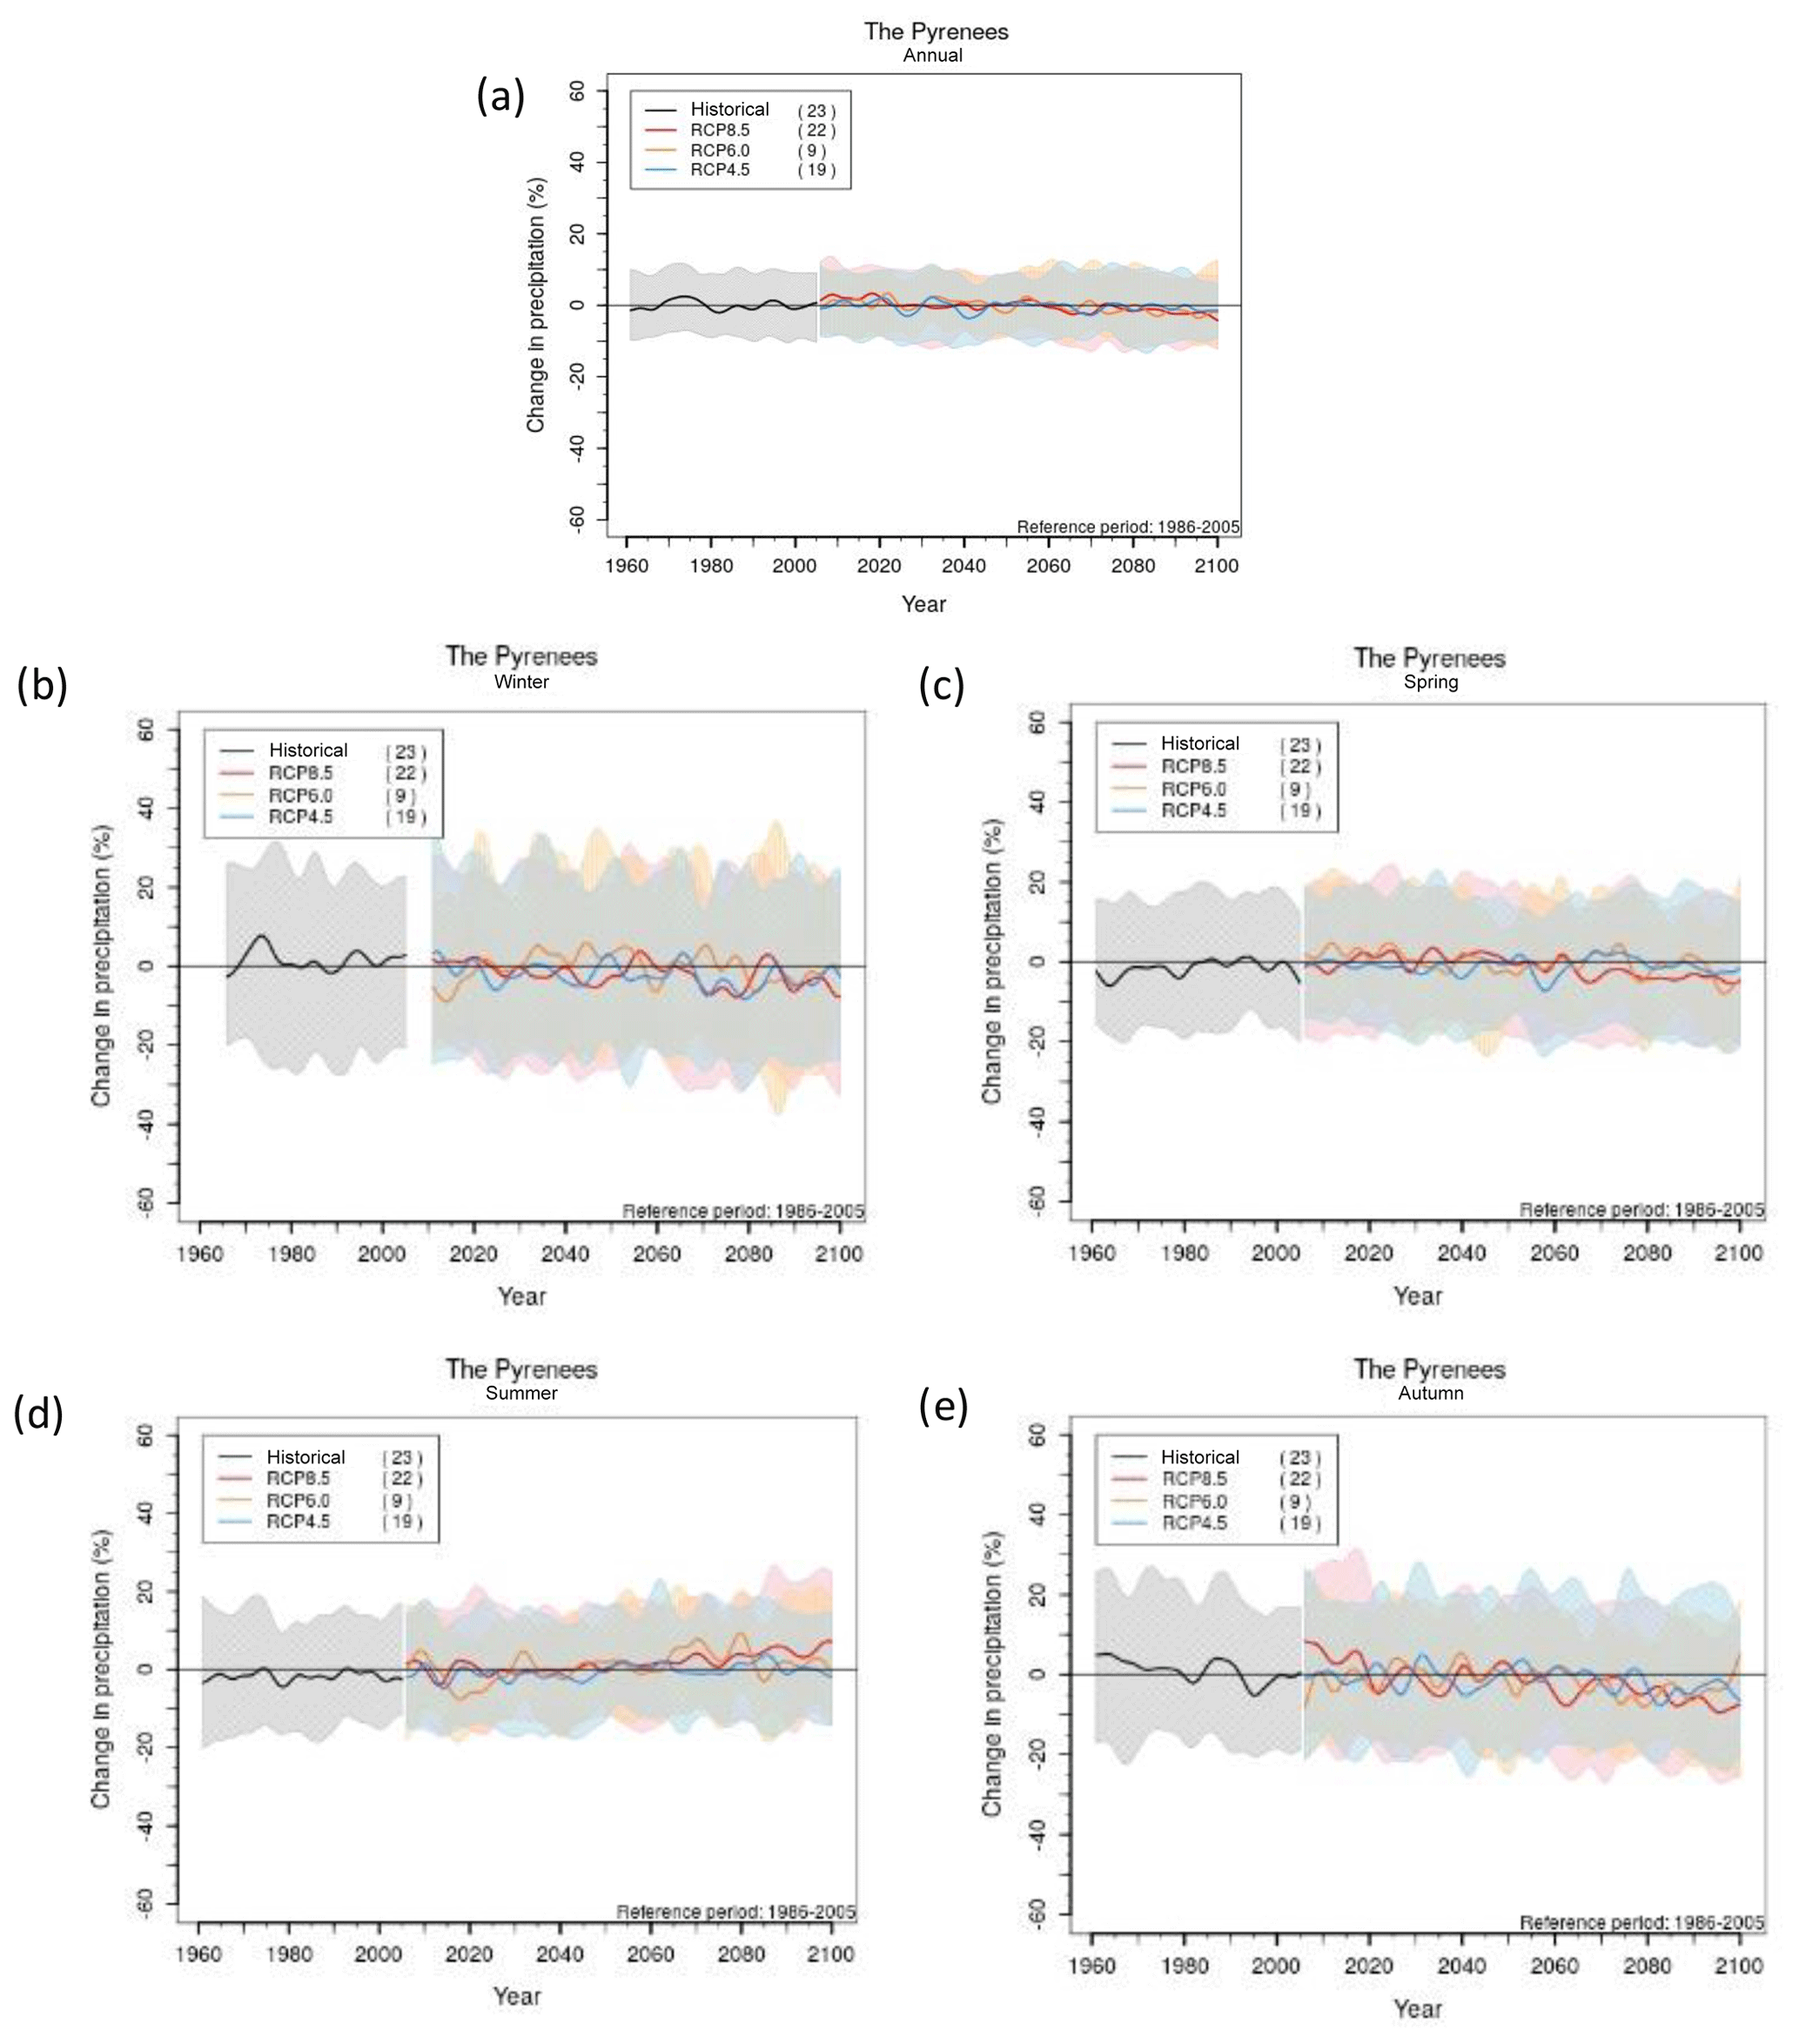
Figure 10The same as Fig. 3 but for relative anomaly of accumulated precipitation (%). A 10-point Gaussian filter has been applied.
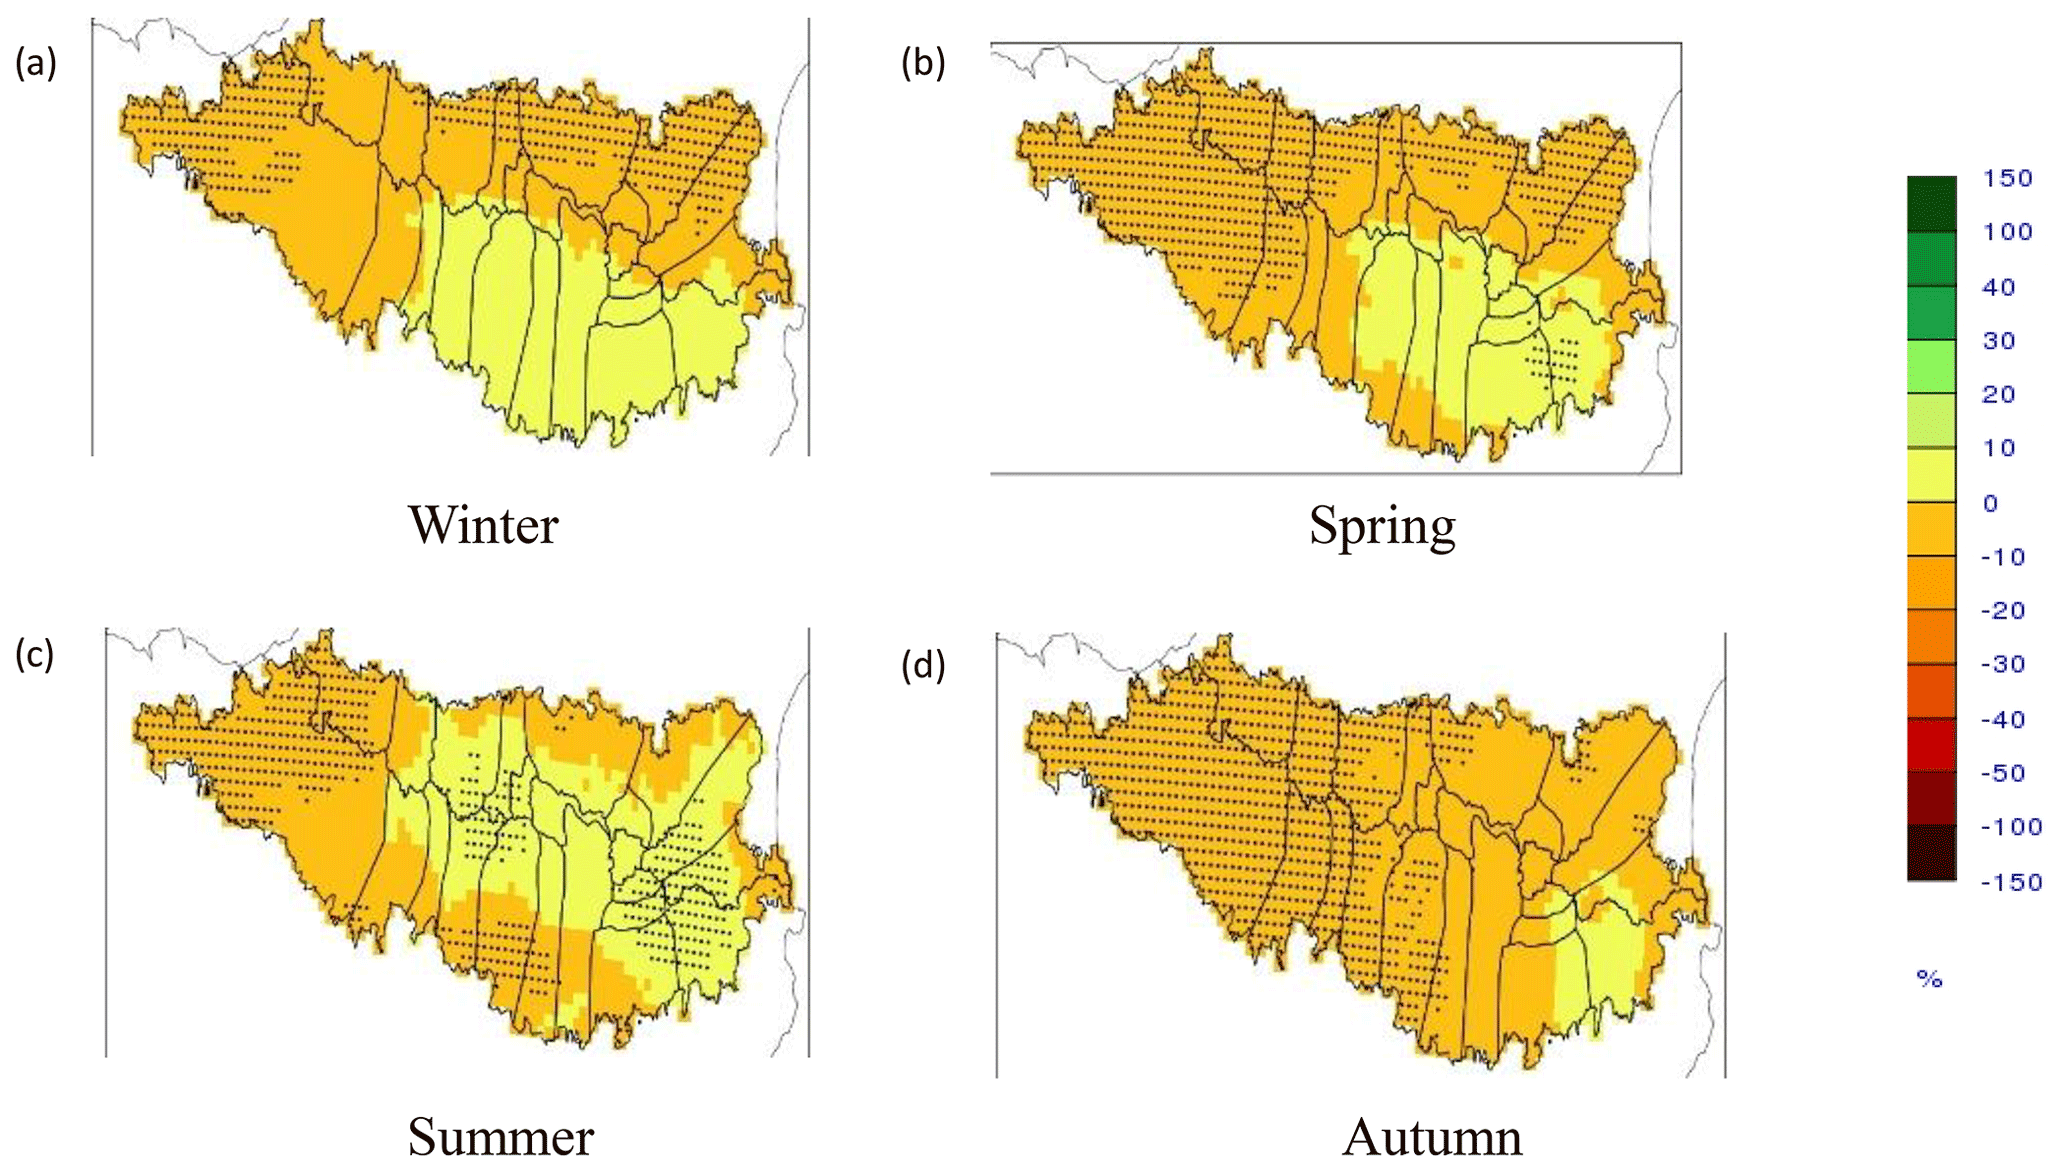
Figure 11The same as Fig. 4 but for relative anomaly of accumulated precipitation (%).
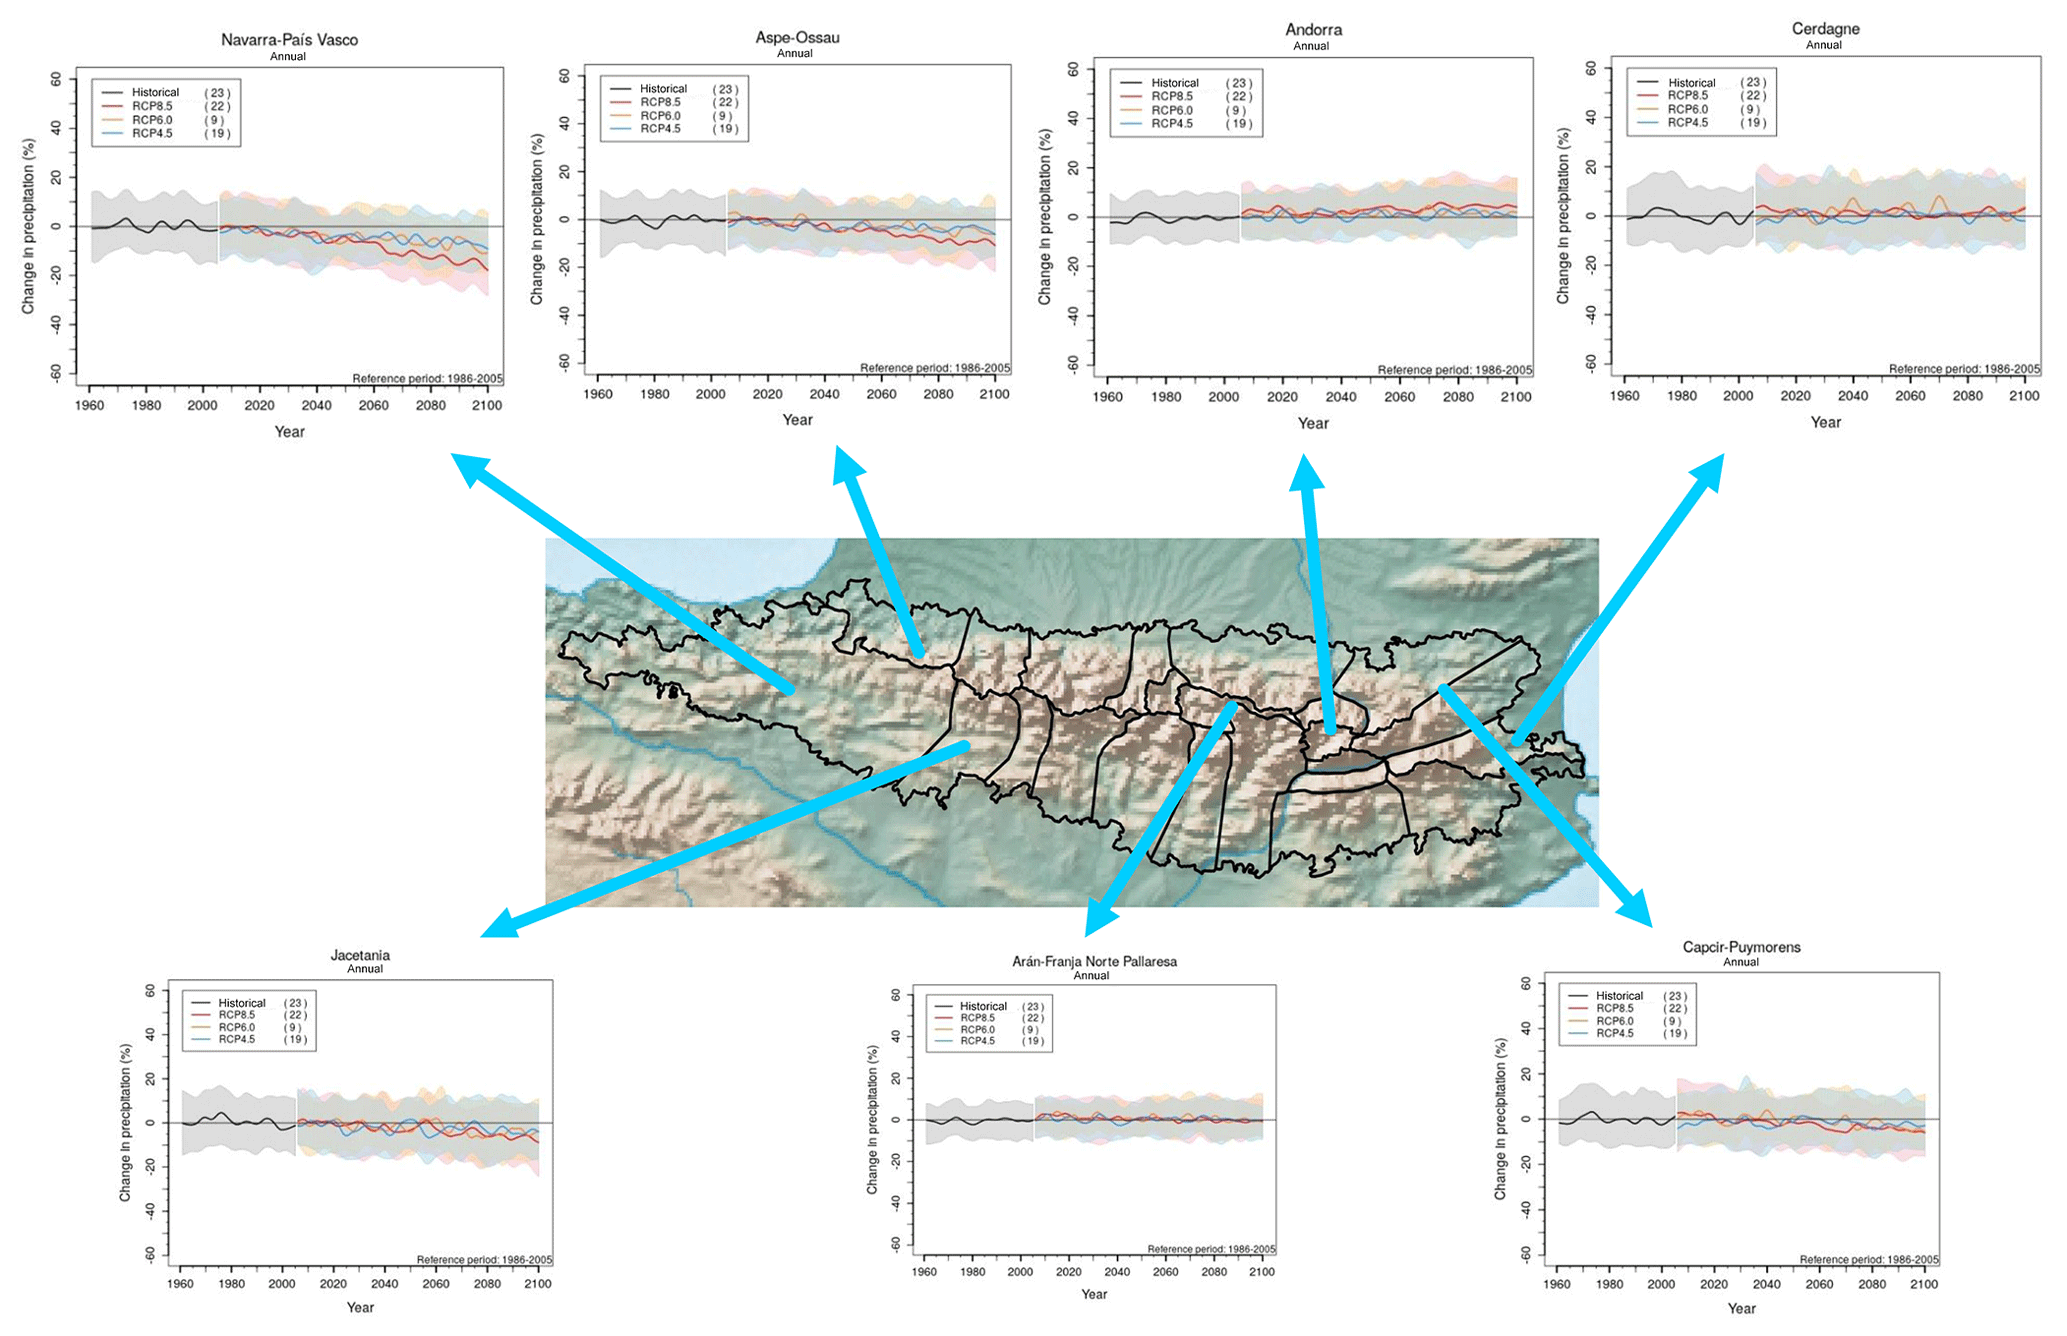
Figure 12The same as Fig. 7 but for relative anomaly of accumulated precipitation (%). A 10-point Gaussian filter has been applied.
4.2 Precipitation (analogue method)
As far as precipitation is concerned, we focus on the analogue method results. In this case, the temporal evolution of the median of the relative anomaly of precipitation (%) is analyzed (Figs. 10–12 and S7). The agreement between models is lower than for temperatures, being the uncertainty associated to models (hatched area) greater than uncertainty due to emission scenarios (separation between evolution lines) during all the considered period, contrary to temperatures. In agreement with Kirtman et al. (2013), the uncertainty arising from model spread is greater than that from internal variability and RCP scenario spread. A clear tendency is hardly discerned (Figs. 10 and S7), also due to the high uncertainty from differences among models. With regard to seasonal behaviour, one could appreciate a slight decline in autumn while an increase in summer at the end of the century. Concerning massifs (Fig. 11), we could appreciate a slight decrease in the western part opposite to a slight increase in the eastern part, but the signal is weak. When analyzing the median of relative anomaly of precipitation for 2090 horizon, in general, the signal indicative that a change will take place in the future is very weak, we get more consensus in the hatched areas with respect to the drop in precipitations. Overall, there is more signal in the autumn mainly located in the northeastern part, while in spring over the western parts. As in temperatures, major emphasis is on the RCP8.5 and the 2090 horizon (Figs. 10–12).
Concerning extreme precipitation indexes, we have selected the change in the number of wet days, the change in heavy precipitation (%) and the length of dry period. We can barely appreciate differences among scenarios (Fig. 13) and there is no clear tendency, all of them fluctuate around non-variation though a noticeable variability is observed. There is a large uncertainty, excepting for the number of wet days, where there is a slight and reduced signal to increase in some isolated zone of the eastern part while a slight signal to decrease in the northern part. Practically no signal is seen in the length of dry period and finally, as concerns heavy precipitations, there is a slight signal in the half-northern part of Pyrenees. Perhaps, this behavior could be related to a shift to the north of the subtropical high pressures zone (López-Moreno et al., 2010), which will produce a reduction in the number of frontal disturbances and could originate, by the latitudinal thermal gradient, that severe cold air masses might be isolated over the Mediterranean.
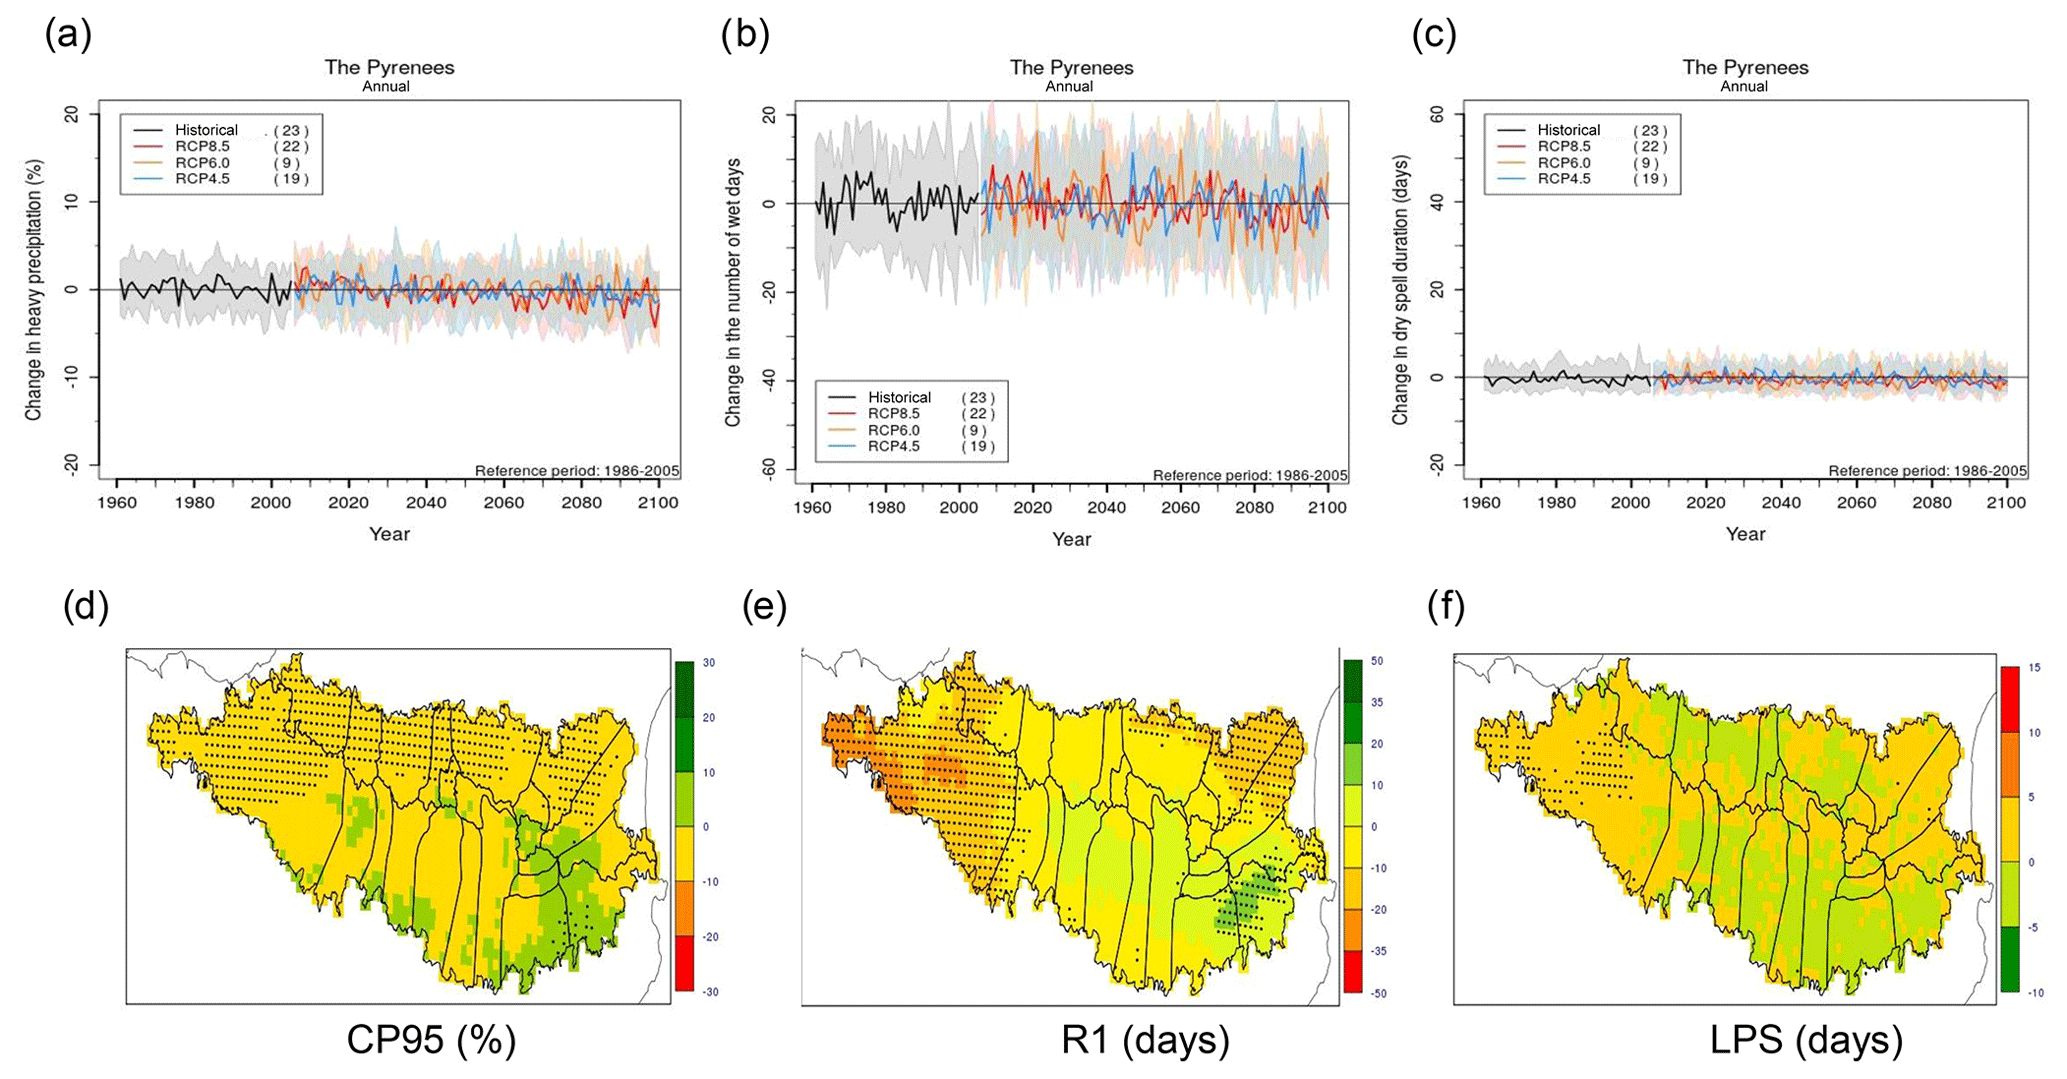
Figure 13Evolution of some downscaled extreme precipitation indexes computed at annual scale: (a) heavy precipitation (CP95); (b) number of wet days (R1) and (c) the length of dry period (LPS). Maps of the median for the same extreme precipitation indexes (d–f) and for RCP8.5 scenario and 2090 horizon. Stippled area reflects major signal ().
It should be noted that the analogue method tends to underestimate historical precipitation extremes (Castellano and DeGaetano, 2017) and also, the analogue method is by definition unable of making extrapolations outside the range of observed values and may distort the upper tail (Imbert and Benestad, 2005). The possible decrease in mean precipitation and the large decrease in frequency of precipitation events might increase the intensity and frequency of drought events (Giorgi and Coppola, 2009).
In recent years, there has been increasing societal demand for quantifying the local impacts of global warming levels to scientifically inform the needed adaptation measures. In this context, the downscaled projections here presented address the specific sensitivity of the mountain regions to global climate conditions. In our study, we have generated high-resolution climate projections by applying two statistical downscaling methods (regression for max and min temperatures, and analogue for precipitation) over the Pyrenees region in the frame of CLIMPY project over a new high-resolution (5 km × 5 km) observational grid using 24 climate models from CMIP5. The application of statistical downscaling to a high resolution observational grid instead of station data partially circumvent the problems associated to the non-uniform distribution of observational in situ data for some specific uses of these projections. As expected, our results indicate that the response of local meteorological conditions in the Pyrenees region is stronger for the end of the century and for the most emissive RCP8.5 scenario. Preliminary analysis of this new projections database are aligned with other studies using regional atmospheric models indicating an increase in the precipitation inter-annual variability with extreme events and a spatial heterogeneous signature, superimposed on a decrease in the total precipitation amount. In particular, spatial resolution as well as local climate conditions seems to impact significantly on the simulations (Jacob et al., 2014). Global and regional climate model projections indicate that warming and drying will likely continue, with the amplitude of the changes after 2050 being highly dependent on the emission scenario. Although climate models predict a general increase in temperature extremes for the end of the 21st century, the exact spatial distribution of changes in temperature and much more in precipitation remains uncertain as they are strongly model dependent. As precipitation is the main driver of the land surface hydrological cycle, other major hydrological indicators would also change accordingly.
To put it in a nutshell, maximum and minimum temperatures show a clear tendency to the increase (in general and by massif), with the larger increases in maximum temperatures compared to the minimum ones. As regards some selected temperature extremes, the number of frost days will decline more noticeably in the western part about to the increase of the length of heat waves in the eastern part of Pyrenees. Finally, the increase in warm days and nights (WD and WN) is almost widespread by the end of century and for RCP8.5. The impact of the RCP becomes significant for the second half of the 21st century, with increased temperature for RCP8.5 at the end of the century.
In general, future precipitation changes do not exhibit a clear tendency and can even point towards different sense of change (either positive or negative), due mainly to uncertainty coming from models. The decrease in precipitation could be due to a reduction in the frequency of precipitation events. In the aggregation by massifs, one can appraise a slight tendency to the decrease in the western part. Changes in moisture and temperature variables must be accounted for to correctly capture the climate change signals.
When analyzing the behavior of selected precipitation extremes (change in the length of dry period, change in the number of wet days and change in the heavy precipitation index), there is not a detectable change though a noticeable variability between climate models. When future precipitation and temperature changes are combined, soil moisture is expected to show negative trend due to enhanced evapotranspiration and the noticeable reduction in the frequency of precipitation events. The lack of trend may in part be caused by the approach as the analogue method is unable to predict new records and consequently could distort the upper tail of the pdf (Benestad, personal communication). However, the same downscaling algorithm has been applied over other regions where the decreasing precipitation trend was clearer and the downscaling method has maintained the trend.
By way of summary, a multi-component ensemble framework has been designed and built, addressing various sources of uncertainty and variability, i.e., several RCPs (RCP 4.5, RCP6.0 and RCP8.5), feeding a relatively high number of GCM runs from the CMIP5 intercomparison exercise. This new high resolution projections database based on statistical algorithms complements the widely used EUROCORDEX data based on dynamical downscaling and allows to identify features that are dependent on the particular downscaling method.
The datasets have been archived at AEMET. AEMET should be contacted for dataset access.
The supplement related to this article is available online at: https://doi.org/10.5194/asr-17-191-2020-supplement.
MPAF made most of the calculation for downscaling of climate change projections including process monitoring, quality control and postprocessing. PRC adapted and developed algorithms for regression method, performed calculations and sensitivity experiments, with major inputs in the concluding remarks. JSL adapted and developed algorithms for analogue method and performed calculations. AHL developed algorithms for analogue method and performed sensitivity experiments. MCPG and BN developed the daily extreme temperatures and 24 h accumulated precipitation gridded data. MDA prepared all the evaluation maps of this paper. MAPS prepared the first draft and made most of the editorial work. ERC supervised the whole work. All authors analysed and discussed results and contributed to final manuscript.
The authors declare that they have no conflict of interest.
This article is part of the special issue “19th EMS Annual Meeting: European Conference for Applied Meteorology and Climatology 2019”. It is a result of the EMS Annual Meeting: European Conference for Applied Meteorology and Climatology 2019, Lyngby, Denmark, 9–13 September 2019.
We thank participants involved in CLIMPY project. Special thanks are due to the teams involved in CMIP5 and ERA-Interim re-analysis. Thanks are due to an anonymous reviewer and Rasmus Benestad for their suggestions which improve substantially the manuscript.
This paper was edited by Rasmus Benestad and reviewed by Rasmus Benestad and one anonymous referee.
The CLIMPY project (EFA081/15) is under the umbrella of the Pyrenees Climate Change Observatory (OPCC-CTP), and it has a 65 % funding by the European Regional Development Fund (FEDER) through the Interreg Programme V-A Spain-France-Andorra (POCTEFA 2014–2020). More information: https://www.opcc-ctp.org/en/climpy (last access: 26 September 2020).
Amblar-Francés, P., Casado-Calle, M. J., Pastor-Saavedra, M. A., Ramos-Calzado, P., and Rodríguez-Camino, E.: Guía de escenarios regionalizados de cambio climático sobre España a partir de los resultados del IPCC-AR5, available at: https://www.aemet.es/documentos/es/conocermas/recursos_en_linea/publicaciones_y_estudios/publicaciones/Guia_escenarios_AR5/Guia_escenarios_AR5.pdf (last access: 26 September 2020), 2017.
Arora, V. K., Scinocca, J. F., Boer, G. J., Christian, J. R., Denman, K. L., Flato, G. M., Kharin, V. V., Lee, W. G., and Merryfield, W. J.: Carbon emission limits required to satisfy future representative concentration pathways of greenhouse gases, Geophys. Res. Lett., 38, L05805, https://doi.org/10.1029/2010GL046270, 2011.
Benestad, R. E.: Empirically Downscaled Multimodel Ensemble Temperature and Precipitation Scenarios for Norway, J. Climate, 15, 3008–3027, 2002.
Bi, D., Dix, M., Marsland, S., O'Farrell, S., Rashid, H., Uotila, P., Hirst, A., Kowalczyk, E., Golebiewski, M., Sullivan, A., Yan, H., Hannah, N., Franklin, C., Sun, Z., Vohralik, P., Watterson, I., Zhou, X., Fiedler, R., Collier, M., Ma, Y., Noonan, J., Stevens, L., Uhe, P., Zhu, H., Griffies, S., Hill, R., Harris, C., and Puri, K.: The ACCESS coupled model: description, control climate and evaluation, Aust. Meteorol. Ocean., 63, 41–64, 2013.
Castellano, C. M. and DeGaetano, A. T.: Downscaling Extreme Precipitation from CMIP5 Simulations Using Historical Analogs, J. Appl. Meteorol. Clim., 56, 2421–2439, https://doi.org/10.1175/JAMC-D-16-0250.1, 2017.
Daley, R.: Atmospheric data Analysis, Cambridge University Press, Cambridge, UK, 457 pp., 1991.
Dee, D. P., Uppala, S. M., Simmons, A. J., Berrisford, P., Poli, P., Kobayashi, S., Andrae, U., Balmaseda, M.A., Balsamo, G., Bauer, P., Bechtold, P., Beeljars, A. C. M., van den Berg, L., Bidlot, J., Bormann, N., Delsol, C., Dragani, R., Fuentes, M., Geer, A. J., Haimberger, L., Healy, S. B., Hersbach, H., Hólm, E. V., Isaksen, L., Kållberg, P., Köhler, M., Matricardi, M., McNally, A. P., Monge-Sanz, B. M., Morcrette, J.-J., Park, B.-K., Peubey, C., de Rosnay, P., Tavolato, C., Thépaut, J.-N., and Vitart, F.: The ERA-Interim reanalysis: configuration and performance of the data assimilation system, Q. J. Roy. Meteorol. Soc., 137, 553–597, 2011.
del Barrio, G., Creus, J., and Puigdefabregas, J.: Thermal Seasonality of the High Mountain Belts of the Pyrenees, Mount. Res. Dev. 10, 227–233, https://doi.org/10.2307/3673602, 1990.
Donner, L. J., Wyman, B. L., Hemler, R. S., Horowitz, L. W., Ming, Y., Zhao, M., Golaz, J.-C., Ginoux, P., Lin, S.-J., Schwarzkopf, M. D., Austin, J., Alaka, G., Cooke, W. F., Delworth, T. L., Freidenreich, S. M., Gordon, C. T., Griffies, S. M., Held, I. M., Hurlin, W. J., Klein, S. A., Knutson, T. R., Langenhorst, A. R., Lee, H.-C., Lin, Y., Magi, B. I., Malyshev, S. L., Milly, P. C. D., Naik, V., Nath, M. J., Pincus, R., Ploshay, J. J., Ramaswamy, V., Seman, C. J., Shevliakova, E., Sirutis, J. J., Stern, W. F., Stouffer, R. J., Wilson, R. J., Winton, M., Wittenberg, A. T., and Zeng, F.: The dynamical core, physical parameterizations, and basic simulation characteristics of the atmospheric component AM3 of the GFDL global coupled model CM3, J. Climate, 24, 3484–3519, 2011.
Dufresne, J. L., Foujols, M. A., Denvil, S., Caubel, A., Marti, O., Aumont, O., Balkanski, Y., Bekki, S., Bellenger, H., Benshila, R., Bony, S., Bopp, L., Braconnot, P., Brockmann, P., Cadule, P., Cheruy, F., Codron, F., Cozic, A., Cugnet, D., de Noblet, N., Duvel, J.-P., Ethe, C., Fairhead, L., Fichefet, T., Flavoni, S., Friedlingstein, P., Grandpeix, J.-Y., Guez, L., Guilyardi, E., Hauglustaine, D., Hourdin, F., Idelkadi, A., Ghattas, J., Joussaume, S., Kageyama, M., Krinner, G., Labetoulle, S., Lahellec, A., Lefebvre, M.-P., Lefevre, F., Levy, C., Li, Z. X., Lloyd, J., Lott, F., Madec, G., Mancip, M., Marchand, M., Masson, S., Meurdesoif, Y., Mignot, J., Musat, I., Parouty, S., Polcher, J., Rio, C., Schulz, M., Swingedouw, D., Szopa, S., Talandier, C., Terray, P., Viovy, N., and Vuichard, N.: Climate change projections using the IPSL-CM5 Earth System Model: from CMIP3 to CMIP5, Clim. Dynam., 40, 2123–2165, 2013.
Fowler, H. J., Blenkinsop, S., and Tebaldi, C.: Linking climate change modelling to impacts studies: recent advances in downscaling techniques for hydrological modelling, Int. J. Climatol., 27, 1547–1578, 2007.
Frei, C. and Schar, C.: A precipitation climatology of the Alps from high-resolution rain-gauge observations, Int. J. Climatol., 18, 873–900, https://doi.org/10.1029/98GL51099, 1998.
García-Ruiz, J. M., Beguería, S., López-Moreno, J. I., Lorente, A., and Seeger, M.: Los recursos hídricos superficiales del Pirineo aragonés y su evolución reciente, Geoforma Ediciones, Logroño, 192 pp., 2001.
Giorgetta, M. A., Jungclaus, J., Reick, C. H., Legutke, S., Bader, J., Böttinger, M., Brovkin, V., Crueger, T., Esch, M., Fieg, K., Glushak, K., Gayler, V., Haak, H., Hollweg, H.-D., Ilyina, T., Kinne, S., Kornblueh, L., Matei, D., Mauritsen, T., Mikolajewicz, U., Mueller, W., Notz, D., Pithan, F., Raddatz, T., Rast, S., Redler, R., Roeckner, E., Schmidt, H., Schnur, R., Segschneider, J., Six, K. D., Stockhause, M., Timmreck, C., Wegner, J., Widmann, H., Wieners, K.-H., Claussen, M., Marotzke, J., and Stevens, B.: Climate and carbon cycle changes from 1850 to 2100 in MPI-ESM simulations for the Coupled Model Intercomparison Project phase 5, J. Adv. Model. Earth Syst., 5, 572–597, https://doi.org/10.1002/jame.20038, 2013.
Giorgi, F., Hewitson, B., Arritt, R., Gutowski, W., Knutson, T., and Landsea, C.: Regional Climate Information-Evaluation and Projections, in: Geological and Atmospheric Sciences Publications, 110, available at: https://lib.dr.iastate.edu/ge_at_pubs/110 (last access: 26 September 2020), 2001.
Giorgi, F. and Coppola, E.: Projections of twenty-first century climate over Europe, Eur. Phys. J. Conf., 1, 29–46, https://doi.org/10.1140/epjconf/e2009-00908-9, 2009.
Gordon, H. B., Rotstayn, L. D., McGregor, J. L., Dix, M. R., Kowalczyk, E. A., O'Farrell, S. P., Waterman, L. J., Hirst, A. C., Wilson, S. G., Collier, M. A., Watterson, I. G., and Elliott, T. I.: The CSIRO Mk3 climate system model, CSIRO Atmospheric Research Technical Paper No. 60, CSIRO, Australia, 2002.
Gutiérrez, J. M., Maraun, D., Widman, M., Huth, R., Hertig, E., Benestad, R., Roessler, O., Wibig, J., Wilcke, R., Kotlarski, S., San Martin, D., Herrera, S., Bedia, J., Casanueva, A., Manzanas, R., Iturbide, M., Vrac, M., Dubrovsky, Ribalaygua, J., Portoles, J., Raty, O., Raisanen, J., Hingray, B., Raynaud, D., Casado, M. J., Ramos, P., Zerenner, T., Turco, M., Bosshard, T., Stepanek, P., Bartholy, J., Pongracz, R., Keller, D. E., Fischer, A. M., Cardoso, R. M., Soares, P. M. M., Czernecki, B., and Page, C.: An intercomparison of a large ensemble of statistical downscaling methods over Europe: Results from the VALUE perfect predictor cross-validation experiment, Int. J. Climatol., 39, 3750–3785, https://doi.org/10.1002/joc.5462, 2019.
Hertig, E., Maraun, D., Bartholy, J., Pongracz, R., Vrac, M., Mares, I., Gutiérrez, J. M., Wibig, J., Casanueva, A., and Soares, P. M. M.: Comparison of statistical downscaling methods with respect to extreme events over Europe: Validation results from the perfect predictor experiment of the COST Action VALUE, Int. J. Climatol., 39, 3846–3867, https://doi.org/10.1002/joc.5469, 2019.
Hurrell, J. W., Holland, M. M., Gent, P. R., Ghan, S., Kay, J. E., Kushner, P. J., Lamarque, J.-F., Large, W. G., Lawrence, D., Lindsay, K., Lipscomb, W. H., Long, M. C., Mahowald, N., Marsh, D. R., Neale, R. B., Rasch, P., Vavrus, S., Vertenstein, M., Bader, D., Collins, W. D., Hack, J. J., Kiehl, J., and Marshall, S.: The community earth system model: a framework for collaborative research, B. Am. Meteorol. Soc., 94, 1339–1360, 2013.
IPCC: Technical Summary, in: IPCC Special Report on the Ocean and Cryosphere in a Changing Climate, edited by: Pörtner, H.-O., Roberts, D. C., Masson-Delmotte, V., Zhai, P., Poloczanska, E., Mintenbeck, K., Tignor, M., Alegría, A., Nicolai, M., Okem, A., Petzold, J., Rama, B., and Weyer, N. M., available at: https://www.ipcc.ch/site/assets/uploads/sites/3/2019/11/04_SROCC_TS_FINAL.pdf (last access: 26 September 2020), 2019.
Jacob, D., Petersen, J., Eggert, B., Alias, A., Christensen, O. B., Bouwer, L. M., Braun, A., Colette, A., Déqué, M., Georgievski, G., Georgopoulou, E., Gobiet, A., Menut, L., Nikulin, G., Haensler, A., Hempelmann, N., Jones, C., Keuler, K., Kovats, S., Kröner, N., Kotlarski, S., Kriegsmann, A., Martin, E., van Meijgaard, E., Moseley, C., Pfeifer, S., Preuschmann, S., Radermacher, C., Radtke, K., Rechid, D., Rounsevell, M., Samuelsson, P., Somot, S., Soussana, J. F., Teichmann, C., Valentini, R., Vautard, R., Weber, B., and Yiou, P.: EURO-CORDEX: new high-resolution climate change projections for European impact research, Reg. Environ. Change, 14, 563–578, https://doi.org/10.1007/s10113-013-0499-2, 2014.
Ji, D., Wang, L., Feng, J., Wu, Q., Cheng, H., Zhang, Q., Yang, J., Dong, W., Dai, Y., Gong, D., Zhang, R. H., Wang, X., Liu, J., Moore, J. C., Chen, D., and Zhou, M.: Description and basic evaluation of Beijing Normal University Earth system model (BNU-ESM) version 1, Geosci. Model Dev., 7, 2039–2064, https://doi.org/10.5194/gmd-7-2039-2014, 2014.
Karl, T. R., Nicholls, N., and Ghazi, A.: CLIVAR/GCOS/WMO workshop on indices and indicators for climate extremes: Workshop summary, Climatic Change, 42, 3–7, 1999.
Kirtman, B., Power, S. B., Adedoyin, J. A., Boer, G. J., Bojariu, R., Camilloni, I., Doblas-Reyes, F. J., Fiore, A. M., Kimoto, M., Meehl, G. A., Prather, M., Sarr, A., Schär, C., Sutton, R., van Oldenborgh, G. J., Vecchi, G., and Wang, H. J.: Near-term Climate Change: Projections and Predictability, in: Climate Change 2013: The Physical Science Basis, Contribution of Working Group I to the Fifth Assessment Report of the Intergovernmental Panel on Climate Change, Cambridge University Press, Cambridge, 2013.
Kitoh, A., Ose, T., and Takayabu, I.: Dynamical downscaling for climate projection with high-resolution MRI AGCM-RCM, J. Meteorol. Soc. Jpn. A, 94, 1–16, https://doi.org/10.2151/jmsj.2015-022, 2016.
Landelius, T., Dahlgren, P., Gollvik, S., Jansson, A., and Olsson, E.: A high-resolution regional reanalysis for Europe. Part 2: 2D analysis of surface temperature, precipitation and wind, Q. J. Roy. Meteorol. Soc., 142, 2132–2142, https://doi.org/10.1002/qj.2813, 2016.
Liebmann, B. and Allured, D.: Daily Precipitation Grids for South America, B. Am. Meteorol. Soc., 86, 1567–1570, https://doi.org/10.1175/BAMS-86-11-1567, 2005.
López-Moreno, J. I., Vicente-Serrano, S. M., Angulo-Martínez, S M., Beguería, S., and El Kenawy, A.: Trends in daily precipitation on the northeastern Iberian Peninsula, 1955–2006, Int. J. Climatol., 30, 1026–1041, https://doi.org/10.1002/joc.1945, 2010.
Maraun, D. and Widmann, M.: Statistical Downscaling and Bias Correction for Climate Research, Cambridge University Press, Cambridge, ISBN 978-1-107-06605-2, https://doi.org/10.1017/9781107588783, 2018.
Maraun, D., Huth, R., Gutiérrez, J. M., Martín, D. S., Dubrovsky, M., Fischer, A., Widmann, M., Casado, M. J., Ramos, P., and Bedia, J.: The VALUE perfect predictor experiment: evaluation of temporal variability, Int. J. Climatol., 39, 3786–3818, 2019.
Martin, G. M., Bellouin, N., Collins, W. J., Culverwell, I. D., Halloran, P. R., Hardiman, S. C., Hinton, T. J., Jones, C. D., Mc-Donald, R. E., McLaren, A. J., O'Connor, F. M., Roberts, M. J., Rodriguez, J. M., Woodward, S., Best, M. J., Brooks, M. E., Brown, A. R., Butchart, N., Dearden, C., Derbyshire, S. H., Dharssi, I., Doutriaux-Boucher, M., Edwards, J. M., Falloon, P. D., Gedney, N., Gray, L. J., Hewitt, H. T., Hobson, M., Huddleston, M. R., Hughes, J., Ineson, S., Ingram, W. J., James, P. M., Johns, T. C., Johnson, C. E., Jones, A., Jones, C. P., Joshi, M. M., Keen, A. B., Liddicoat, S., Lock, A. P., Maidens, A. V., Manners, J. C., Milton, S. F., Rae, J. G. L., Ridley, J. K., Sellar, A., Senior, C. A., Totterdell, I. J., Verhoef, A., Vidale, P. L., and Wiltshire, A.: The HadGEM2 family of Met Office Unified Model climate configurations, Geosci. Model Dev., 4, 723–757, https://doi.org/10.5194/gmd-4-723-2011, 2011.
Maurer, E. P. and Hidalgo, H. G.: Utility of daily vs. monthly large-scale climate data: an intercomparison of two statistical downscaling methods, Hydrol. Earth Syst. Sci., 12, 551–563, https://doi.org/10.5194/hess-12-551-2008, 2008.
Miralles, D. G., Gentine, P., Seneviratne, S. I., and Teuling, A. J.: Land–atmospheric feedbacks during droughts and heatwaves: state of the science and current challenges, Ann. NY Acad. Sci., 1436, 19–35, https://doi.org/10.1111/nyas.13912, 2019.
Navascués, B., Rodríguez, E., Ayuso, J. J., and Järvenoja, S.: Analysis of surface variables and parameterization of surface processes in HIRLAM. Part II: Seasonal assimilation experiment, HIRLAM Technical Report 59, SMHI, Norrköping, Sweden, 2003.
Nogués-Bravo, D., Bastos-Araujo, M., Lasanta, T., and López-Moreno, I.: Climate Change in Mediterranean Mountains during the 21st Century, Ambio, 37, 280-5, 2008.
Peña, J. L. and Lozano, M. V.: Las unidades del relieve aragonés, available at: http://age.ieg.csic.es/fisica/docs/002.pdf (last access: 26 September 2020), 2004.
Peral, C., Navascués, B., and Ramos, P.: Serie de precipitación diaria en rejilla con fines climáticos, Nota Técnica no. 24, AEMET, available at: http://www.aemet.es/documentos/es/conocermas/recursos_en_linea/publicaciones_y_estudios/publicaciones/NT_24_AEMET/NT_24_AEMET.pdf (last access: 26 September 2020), 2017.
Perry, M. and Hollis, D.: The development of a new set of longterm climate averages for the UK, Int. J. Climatol., 25, 1023–1039, 2005.
Petisco de Lara, S. E.: Método de regionalización de precipitación basado en análogos, Explicación y Validación, Nota Técnica 3A, Área de Evaluación y Modelización del Cambio Climático, AEMET, Madrid, 2008.
Rico, I., Izagirre, E., Serrano, E., and López-Moreno, J. I.: Current glacier area in the Pyrenees: an updated assessment 2016, Pirineos, 172, e029, https://doi.org/10.3989/Pirineos.2017.172004, 2017.
Rodríguez, E., Navascués, B., Ayuso, J. J., and Järvenoja, S.: Analysis of surface variables and parameterization of surface processes in HIRLAM. Part I: Approach and verification by parallel runs, HIRLAM Technical Report 58, SMHI, Norrköping, Sweden, 2003.
Rummukainen, M.: State-of-the-art with Regional Climate Models, Wiley Interdisciplin. Rev.: Clim. Change, 1, 82–96, 2010.
Scoccimarro, E., Gualdi, S., Bellucci, A., Sanna, A., Fogli, P. G., Manzini, E., Vichi, M., Oddo, P., and Navarra, A.: Effects of Tropical Cyclones on Ocean Heat Transport in a High Resolution Coupled General Circulation Model, J. Climate, 24, 4368–4384, 2011.
Smid, M. and Costa, A. C.: Climate projections and downscaling techniques: a discussion for impact studies in urban systems, Int. J. Urban Sci., 22, 277–307, 2018
Soares, P. M., Maraun, D., Brands, S., Jury, M. W., Gutiérrez, J. M., San-Martín, D., Hertig, E., Huth, R., Vozila, A. B., Cardoso, R. M., Kotlarski, S., Dobrinski, P., and Obermann-Hellhund, A.: Process-based evaluation of the VALUE perfect predictor experiment of statistical downscaling methods, Int. J. Climatol., 39, 3868–3893, 2019
Stennet-Brown, R., Jones, J. J., Stephenson, T. S., and Taylor, M.: Future Caribbean temperature and rainfall extremes from statistical downscaling: Statistical Downscaling of Caribbean Temperature and Rainfall, Int. J. Climatol., 37, 4828–4845, https://doi.org/10.1002/joc.5126, 2017.
Takayabu, I., Kanamuru, H., Dairaku, K., Benestad, R., von Storch, H., and Christensen, J. H.: Reconsidering the Quality and Utility of Downscaling, J. Meteorol. Soc. Jpn. A, 94, 31–45, https://doi.org/10.2151/jmsj.2015-042, 2016.
Trzaska, S. and Schnarr, E.: A Review of Downscaling Methods for Climate Change Projections: African and Latin American Resilience to Climate Change (ARCC), available at: http://www.ciesin.org/documents/Downscaling_CLEARED_000.pdf (last access: 26 September 2020), 2014.
van den Besselaar, E. J. M., van der Schrier, G., Cornes, R., Iqbal, A. S., and Klein-Tank, A. M. G.: SA-OBS: A Daily Gridded Surface Temperature and Precipitation Dataset for Southeast Asia, J. Climate, 30, 5151–5165, https://doi.org/10.1175/JCLI-D-16-0575.1, 2017.
Voldoire, A., Sanchez-Gomez, E., Mélia, D. S., Decharme, B., Cassou, C., Sénési, S., Valcke, S., Beau, I., Alias, A., Chevallier, M., Déqué, M., Deshayes, J., Douville, H., Fernandez, E., Madec, G., Maisonnave, E., Moine, M. P., Planton, S., Saint-Martin, D., Szopa, S., Tyteca, S., Alkama, R., Belamari, S., Braun, A., Coquart, L., and Chauvin, F.: The CNRM-CM5.1 global climate model: description and basic evaluation, Clim. Dynam., 40, 2091–2121, 2013.
Volodin, E. M., Dianskii, N. A., and Gusev, A. V.: Simulating present-day climate with the INMCM4.0 coupled model of the atmospheric and oceanic general circulations, IZV Atmos. Ocean. Phys., 46, 414–431, 2010.
Watanabe, S., Hajima, T., Sudo, K., Nagashima, T., Takemura, T., Okajima, H., Nozawa, T., Kawase, H., Abe, M., Yokohata, T., Ise, T., Sato, H., Kato, E., Takata, K., Emori, S., and Kawamiya, M.: MIROC-ESM 2010: model description and basic results of CMIP5-20c3m experiments, Geosci. Model Dev., 4, 845–872, https://doi.org/10.5194/gmd-4-845-2011, 2011.
Weare, B. C., Cagnazzo, C., Fogli, P. G., Manzini, E., and Navarra, A.: Madden-Julian Oscillation in a climate model with a well-resolved stratosphere, J. Geophys. Res.-Atmos.,117, D01103, https://doi.org/10.1029/2011JD016247, 2012.
WEF – World Economic Forum: The Global Competitiveness Report 2018, 671 pp., available at: http://www3.weforum.org/docs/GCR2018/05FullReport/WEF_TheGlobalCompetitivenessReport2018.pdf (last access: 26 September 2020), 2018.
WEF – World Economic Forum: The Global Competitiveness Report 2019, 666 pp., available at: http://www3.weforum.org/docs/WEF_TheGlobalCompetitivenessReport2019.pdf (last access: 26 September 2020), 2019.
WEF – World Economic Forum: The Global Risks Report 2020, 102 pp., available at: http://www3.weforum.org/docs/WEF_Global_Risk_Report_2020.pdf (last access: 26 September 2020), 2020.
Wetterhall, F.: Statistical downscaling of precipitation from Large-scale Atmospheric circulation. Comparison of Methods and Climate Regions, available at: https://www.diva-portal.org/smash/get/diva2:166978/FULLTEXT01.pdf (last access: 26 September 2020), 2005.
Widmann, M., Bedia, J., Gutiérrez, J. M., Bosshard, T., Hertig, E., Maraun, D, Casado, M. J., Ramos, P., Cardoso, R. M., Soares, P. M. M., Ribalaygua, J., Pagé, C., Fischer, A. M., Herrera, S., and Huth, R.: Validation of spatial variability in downscaling results from the VALUE perfect predictor experiment, Int. J. Climatol., 39, 3819–3845, 2019.
Wilby, R. L. and Wigley, T. M. L.: Precipitation predictors for downscaling: observed and general circulation model relationships, Int. J. Climatol., 20, 641–661, 2000.
Wilby, R. L., Charles, S. P., Zorita, E., Timbal, B., Whetton, P., and Mearns, L. O.: Guidelines for use of climate scenarios developed from statistical downscaling methods, Supporting material of the Intergovernmental Panel on Climate Change, available from the DDC of IPCC TGCIA, 27 pp., available at: https://www.ipcc-data.org/guidelines/dgm_no2_v1_09_2004.pdf (last access: 26 September 2020), 2004.
Wu, T., Li, W., Ji, J., Xin, X., Li, L., Wang, Z., Zhang, Y., Li, J., Zhang, F., Wei, M., Shi, X., Wu, F., Zhang, L., Chu, M., Jie, W., Liu, Y., Wang, F., Liu, X., Li, Q., Dong, M., Liang, X., Gao, Y., and Zhang, J.: Global carbon budgets simulated by the Beijing Climate Center Climate System Model for the last century, J. Geophys. Res.-Atmos., 118, 4326–4347, https://doi.org/10.1002/jgrd.50320, 2013.
Xiao-Ge, X., Tong-Wen, W., Jiang–ong, L., Zai-Zhi, W., Wei-Ping, L., and Fang-Hua, W.: How well does BCC_CSM1.1 reproduce the 20th century climate change over China?, Atmos. Ocean. Sci. Lett., 6, 21–26, 2013.
Yukimoto, S., Adachi, Y., Hosaka, M., Sakami, T., Yoshimura, H., Hirabara, M., Tanaka, T.Y., Shindo, E., Tsujino, H., Deushi, M., Mizuta, R., Yabu, S., Obata, A., Nakano, H., Koshiro, T., Ose, T., and Kitoh, A.: A new global climate model of the Meteorological Research Institute: MRI-CGCM3-model description and basic performance, J. Meteorol. Soc. Jpn., 90, 23–64, https://doi.org/10.2151/jmsj.2012-A02, 2012.