 | 16 Apr 2020
Bias-adjusted seasonal forecasts of soil moisture for forestry applications in Finland
Ari Venäläinen
Andrea Vajda
Seasonal forecasts for forestry have been developed in the Finnish Meteorological Institute in cooperation with Finnish end-users. Such forecasts could help forest companies in preparing for adverse conditions of timber harvesting operations. Bearing capacity for harvesting operations is dependent on soil moisture, and skillful forecasts have potentially large economic value. Using the ECMWF seasonal forecasts, we evaluated the monthly mean soil moisture forecasts for four different start months, with lead times from 0 to 2 months. Forecasts were bias adjusted, and showed skill in the first month for all four months. After the first lead month, winter months fared a bit better than summer months.
- Article
(3466 KB) - Full-text XML
- BibTeX
- EndNote


Seasonal forecasts can help stakeholders in preparing for adverse conditions, and in strategic decision making in general. Such applications for different sectors are developed by the Finnish Meteorological Institute in cooperation with Finnish end-users. In this article we concentrate on soil moisture forecasts for forestry developed in SÄÄTYÖ project and the European ERA4CS project INDECIS. SÄÄTYÖ is a project funded by the Ministry of Agriculture and Forestry of Finland, that aims at developing new weather services and meteorological data-sets for the benefit of forest based bioeconomy in Finland. Forests and forestry have an important role for the Finnish economy and as well for the climate change mitigation as forests store large amounts of carbon from the atmosphere.
Soil moisture forecasts are to be used for the planning of timber harvesting operations. Timber harvesting in Finland is mainly based on the cut-to-length method where delimbing and crosscutting into assortments are carried out with a single-grip harvester. Trafficability in forest terrains is one of the most important issues in timber harvesting, because multiple passes of a harvester and loaded forwarder may cause deep ruts to the forest floor (Pohjankukka et al., 2016). The timber is transported to the roadside landing by a forwarder. At the roadside, the timber is temporarily stored, sorted and piled for secondary transport. The raw material demand is constant throughout the year and the harvesting and transportation logistics of timber are crucial issues because large amounts of timber has to be transported.
Harvesting operations done during poor bearing capacity periods can cause serious economic and ecological damage for soil and trees. While in general, the bearing capacity of soil is dependent on soil texture, moisture and soil frost, during the period when there is no soil frost, i.e., summer season, soil bearing capacity depends largely on soil moisture. Soil moisture forecasts have thus potentially large economic value. Harvesting is mainly done by logging companies that are the main potential users of this service. For the wet periods, operations can be targeted to the locations with good bearing capacity and, for dry soil periods, operations can be carried out also from locations having poor bearing capacity.
Different weather parameters have different characteristics and require different methodologies for bias-correction, calibration and evaluation to be usable in the development of tailored products for stake-holders. For an essential parameter, such as 2 m temperature, there is extensive literature available on the suitable methods for adjustment, but long-range forecasts of soil moisture have not been used widely, and the literature for bias adjustment is scarce. Moreover, as soil moisture can vary greatly on smaller scale, even the useful reference observations for the soil moisture are challenging. However, monthly means of soil moisture are at least somewhat Gaussian, that simplifies the adjustment somewhat as methodology of temperature adjustment can be used. However, in seasonal forecasting, the amount of data available for fitting statistical models can be very limited.
2.1 Data
We concentrated on reforecasts of soil moisture available from ECMWF SEAS5 seasonal forecast system (Johnson et al., 2019) for years 1981–2016. Data was accessed through the Meteorological Archival and Retrieval System (MARS). We downloaded “Volumetric soil water layer 1” (Soil layer from 0 to 7 cm, swlv1) and “Volumetric soil water layer 2” (Soil layer from 7 to 28 cm, swlv2) and the soil moisture was calculated as swlv1 ⋅ 0.25+ swlv2 ⋅0.75. The ERA5 reanalysis (Hersbach and Dee, 2016) is used as reference. Again, two upmost volumetric soil water layers were retrieved and combined. Both reforecasts and reanalysis were downloaded at degree resolution.
Verification results are shown for those months (February, May, August, and November) that have the same 51 number of reforecast members as the operational forecasts. Even though forecasts up to seven months are available, we concentrate here in the first three months, that is, three forecasts of monthly mean of the soil moisture. We call the forecasts for the same month as the start month the lead-0 forecasts and the other two lead-1 and lead-2 forecasts.
2.2 Methods
In bias adjustment, the R package Climate4R (Iturbide et al., 2018) was utilised as it enables rapid testing of different bias-correction methods. Climate4R provides bias-correction methods for both temperature (and similar variables) and precipitation. Methods for temperature include simple delta method, empirical (EQM) and parametric quantile mapping, additive and variance scaling.
Variance scaling corrects the mean and variance of temperature time series (Chen et al., 2011). First the mean is corrected by subtracting the bias, or the mean error of observed and reforecasted soil moisture of the even years used for the fitting. Then the variance is corrected by multiplying the bias-corrected values by the ratio of the standard deviation of the observed soil moisture and the standard deviation of reforecasted soil moisture. Before multiplication the mean of the bias-corrected values is subtracted so the values will have a zero mean, and after multiplication the mean is added back.
For each grid point separately, ensemble reforecasts of monthly means of soil moisture were forecasted and bias adjusted using the variance scaling method. We tried to avoid overfitting by using even years for fitting, and using only odd years for validation.
All bias adjustment methods tested improved on the raw, uncorrected forecasts, while giving very similar results compared to each other. We hypothesise that this is because all methods were able to correct the bias, but after the bias is corrected, the spread is much harder to improve (Manzanas et al., 2019). At first the use of EQM was considered. However, while EQM is a valid method in climate research, it can give unsatisfactory results in forecasting (Zhao et al., 2017), and here the results for variance scaling are shown. Moreover, preliminary results showed that variance gave better results than in EQM between 60 % and 80 % of grid points, depending on the month and the lead time.
Separate results for all four start months are shown. Reliability diagrams (e.g. Wilks, 2019) of tercile forecasts for Finnish land areas are shown in Fig. 1. All terciles of all months for the lead-0 forecasts are usable, but results for other lead times diverge. In winter months (November and February), lower and upper terciles are somewhat usable even with the lead-2 forecasts, but for summer forecasts these terciles are no longer very usable, and can be downright misleading. For all months, the forecasts of middle tercile are mostly unusable for longer than the lead-0 forecasts. Our working hypothesis for this is that it is difficult to discriminate between no signal and the average conditions.
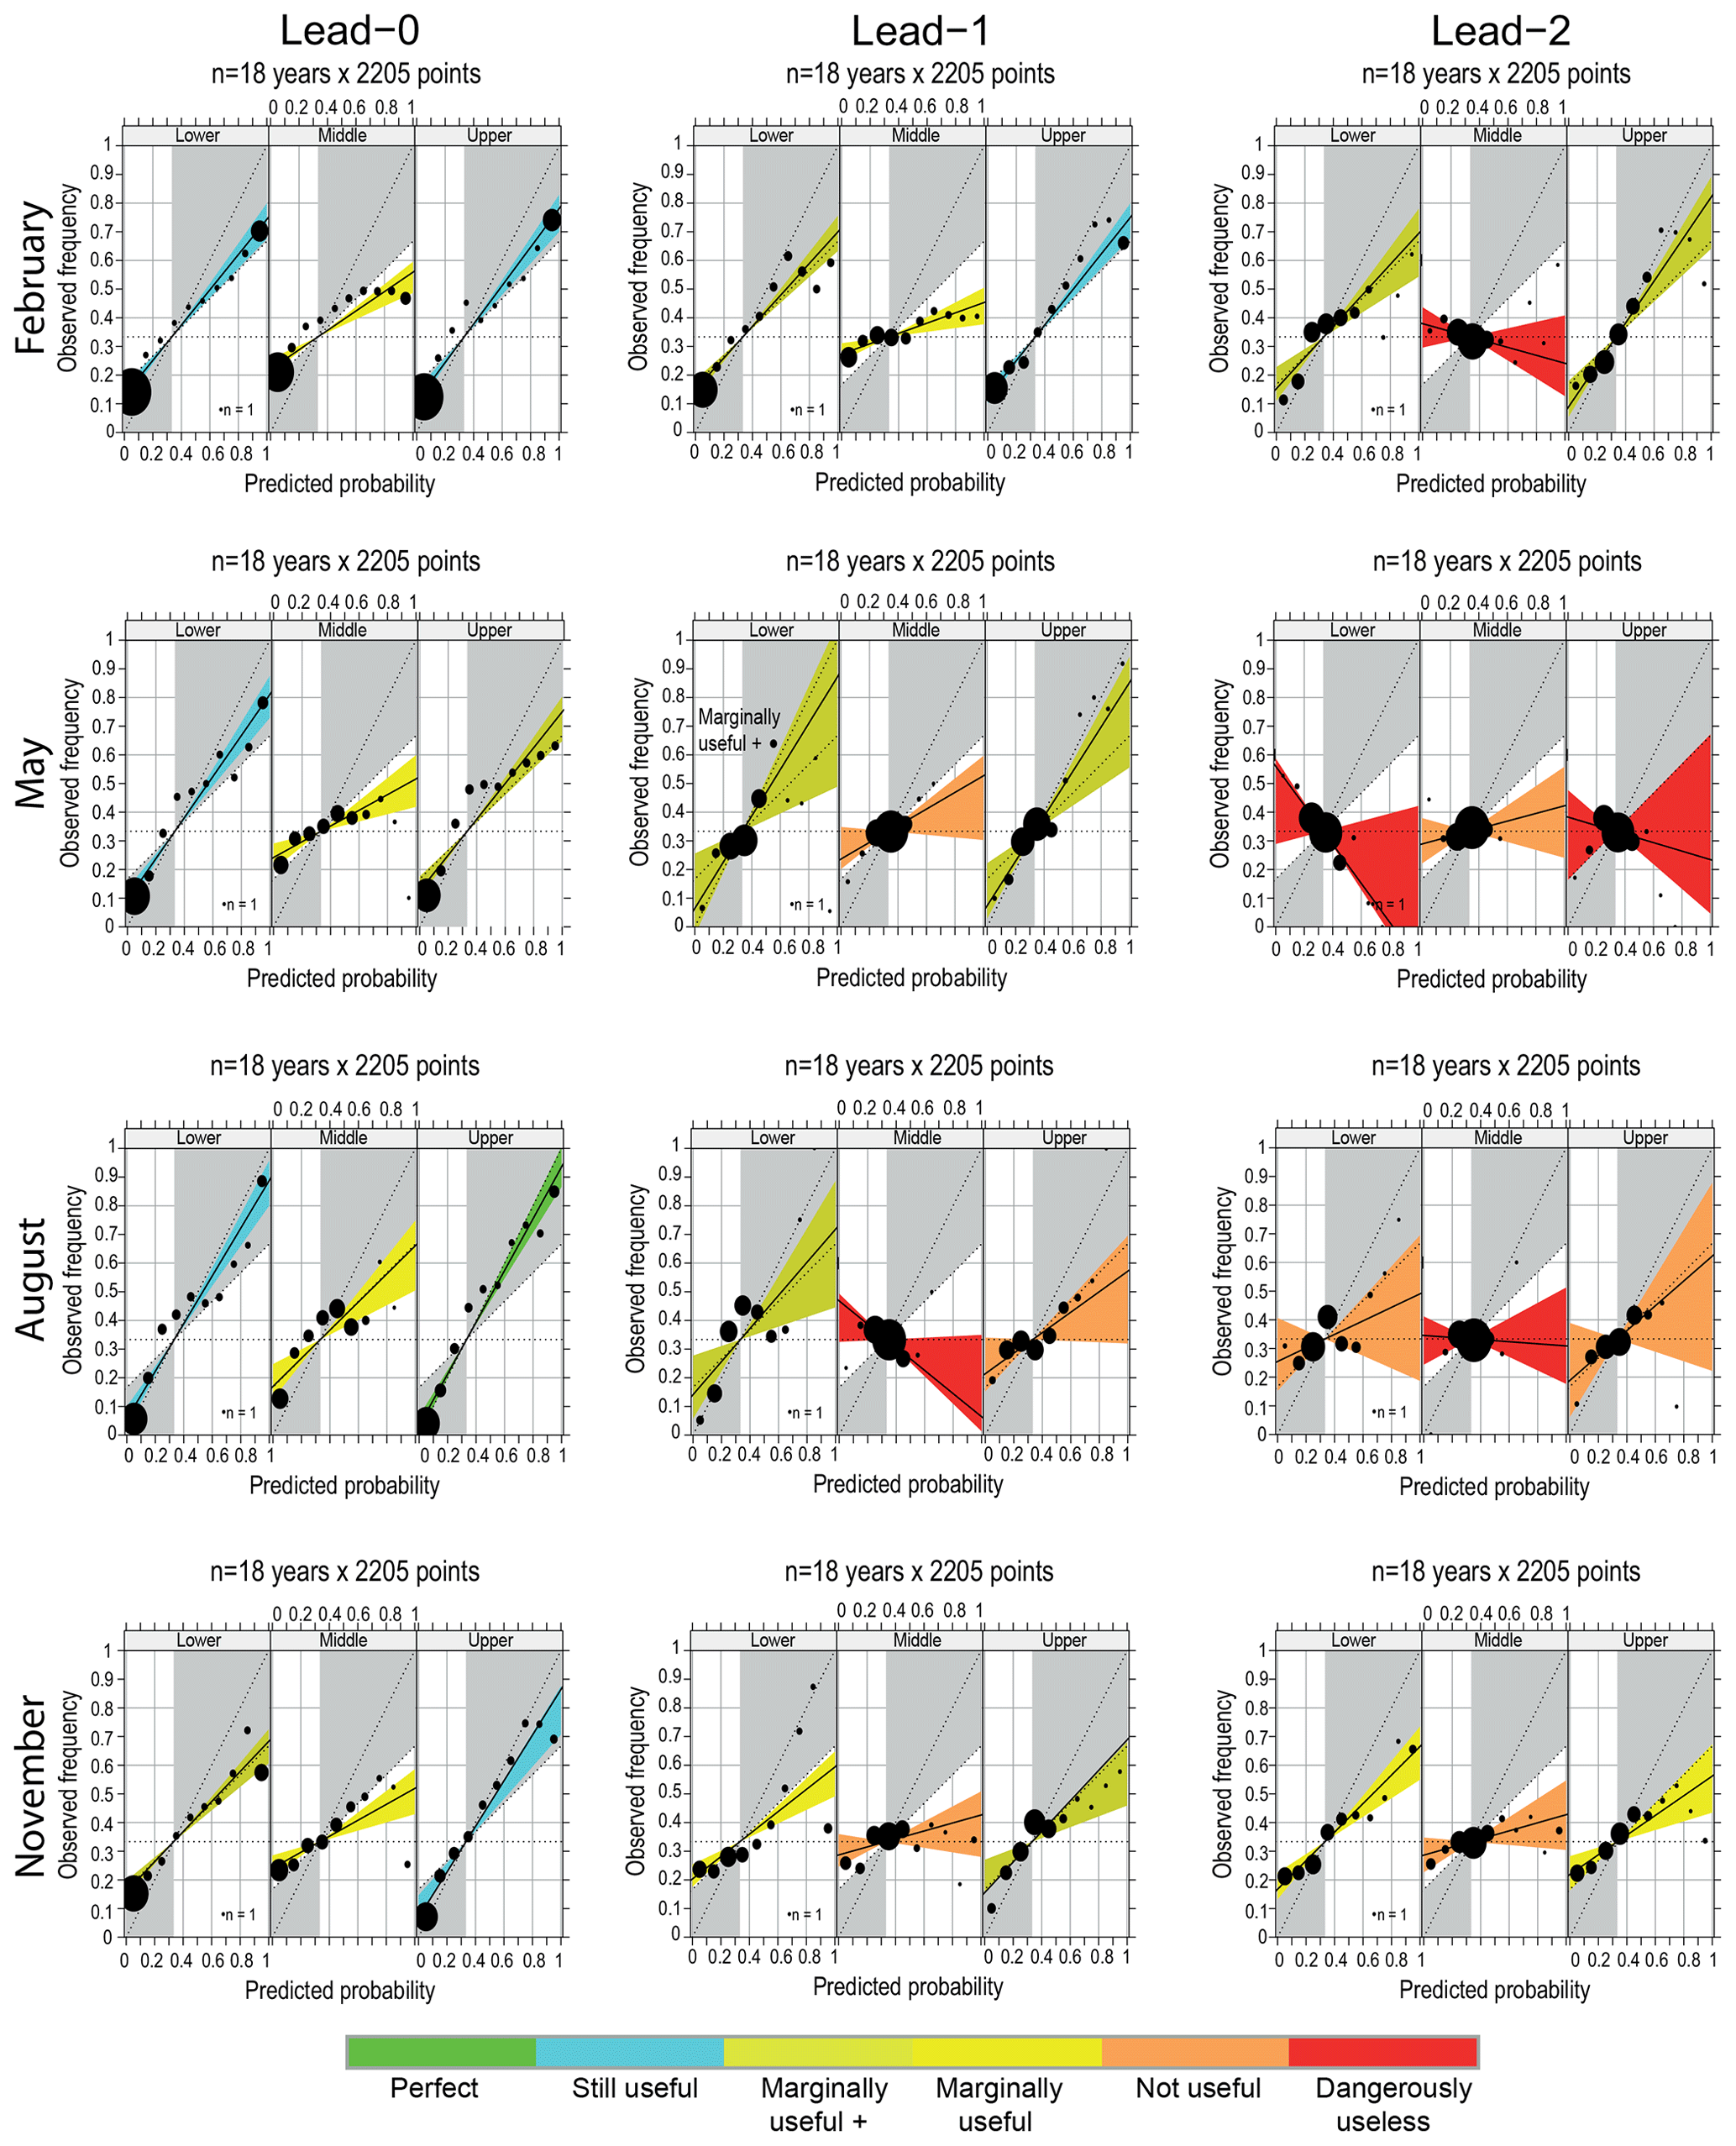
Figure 1The reliability diagrams of tercile forecasts for February, May, August, and November for Finnish land areas with lead times of 0, 1, and 2 months. Green color means “perfect” forecast, cyan is “still useful”, two shades of yellow are “marginally useful”, orange is “not useful”, and red is “dangerously useless”.
The continuously ranked probability skill score (CRPSS) for each grid point is shown in Fig. 2. With lead-0 forecasts there rather large areas with reasonable large skill score values that are statistical significant. For lead-1 forecasts, values are lower, somewhat better in winter months than in summer months. For lead-2 forecasts, values are very near zero everywhere and statistical significant areas are scarce, so it is mostly hard to argue that the forecasts would be better than the reference.
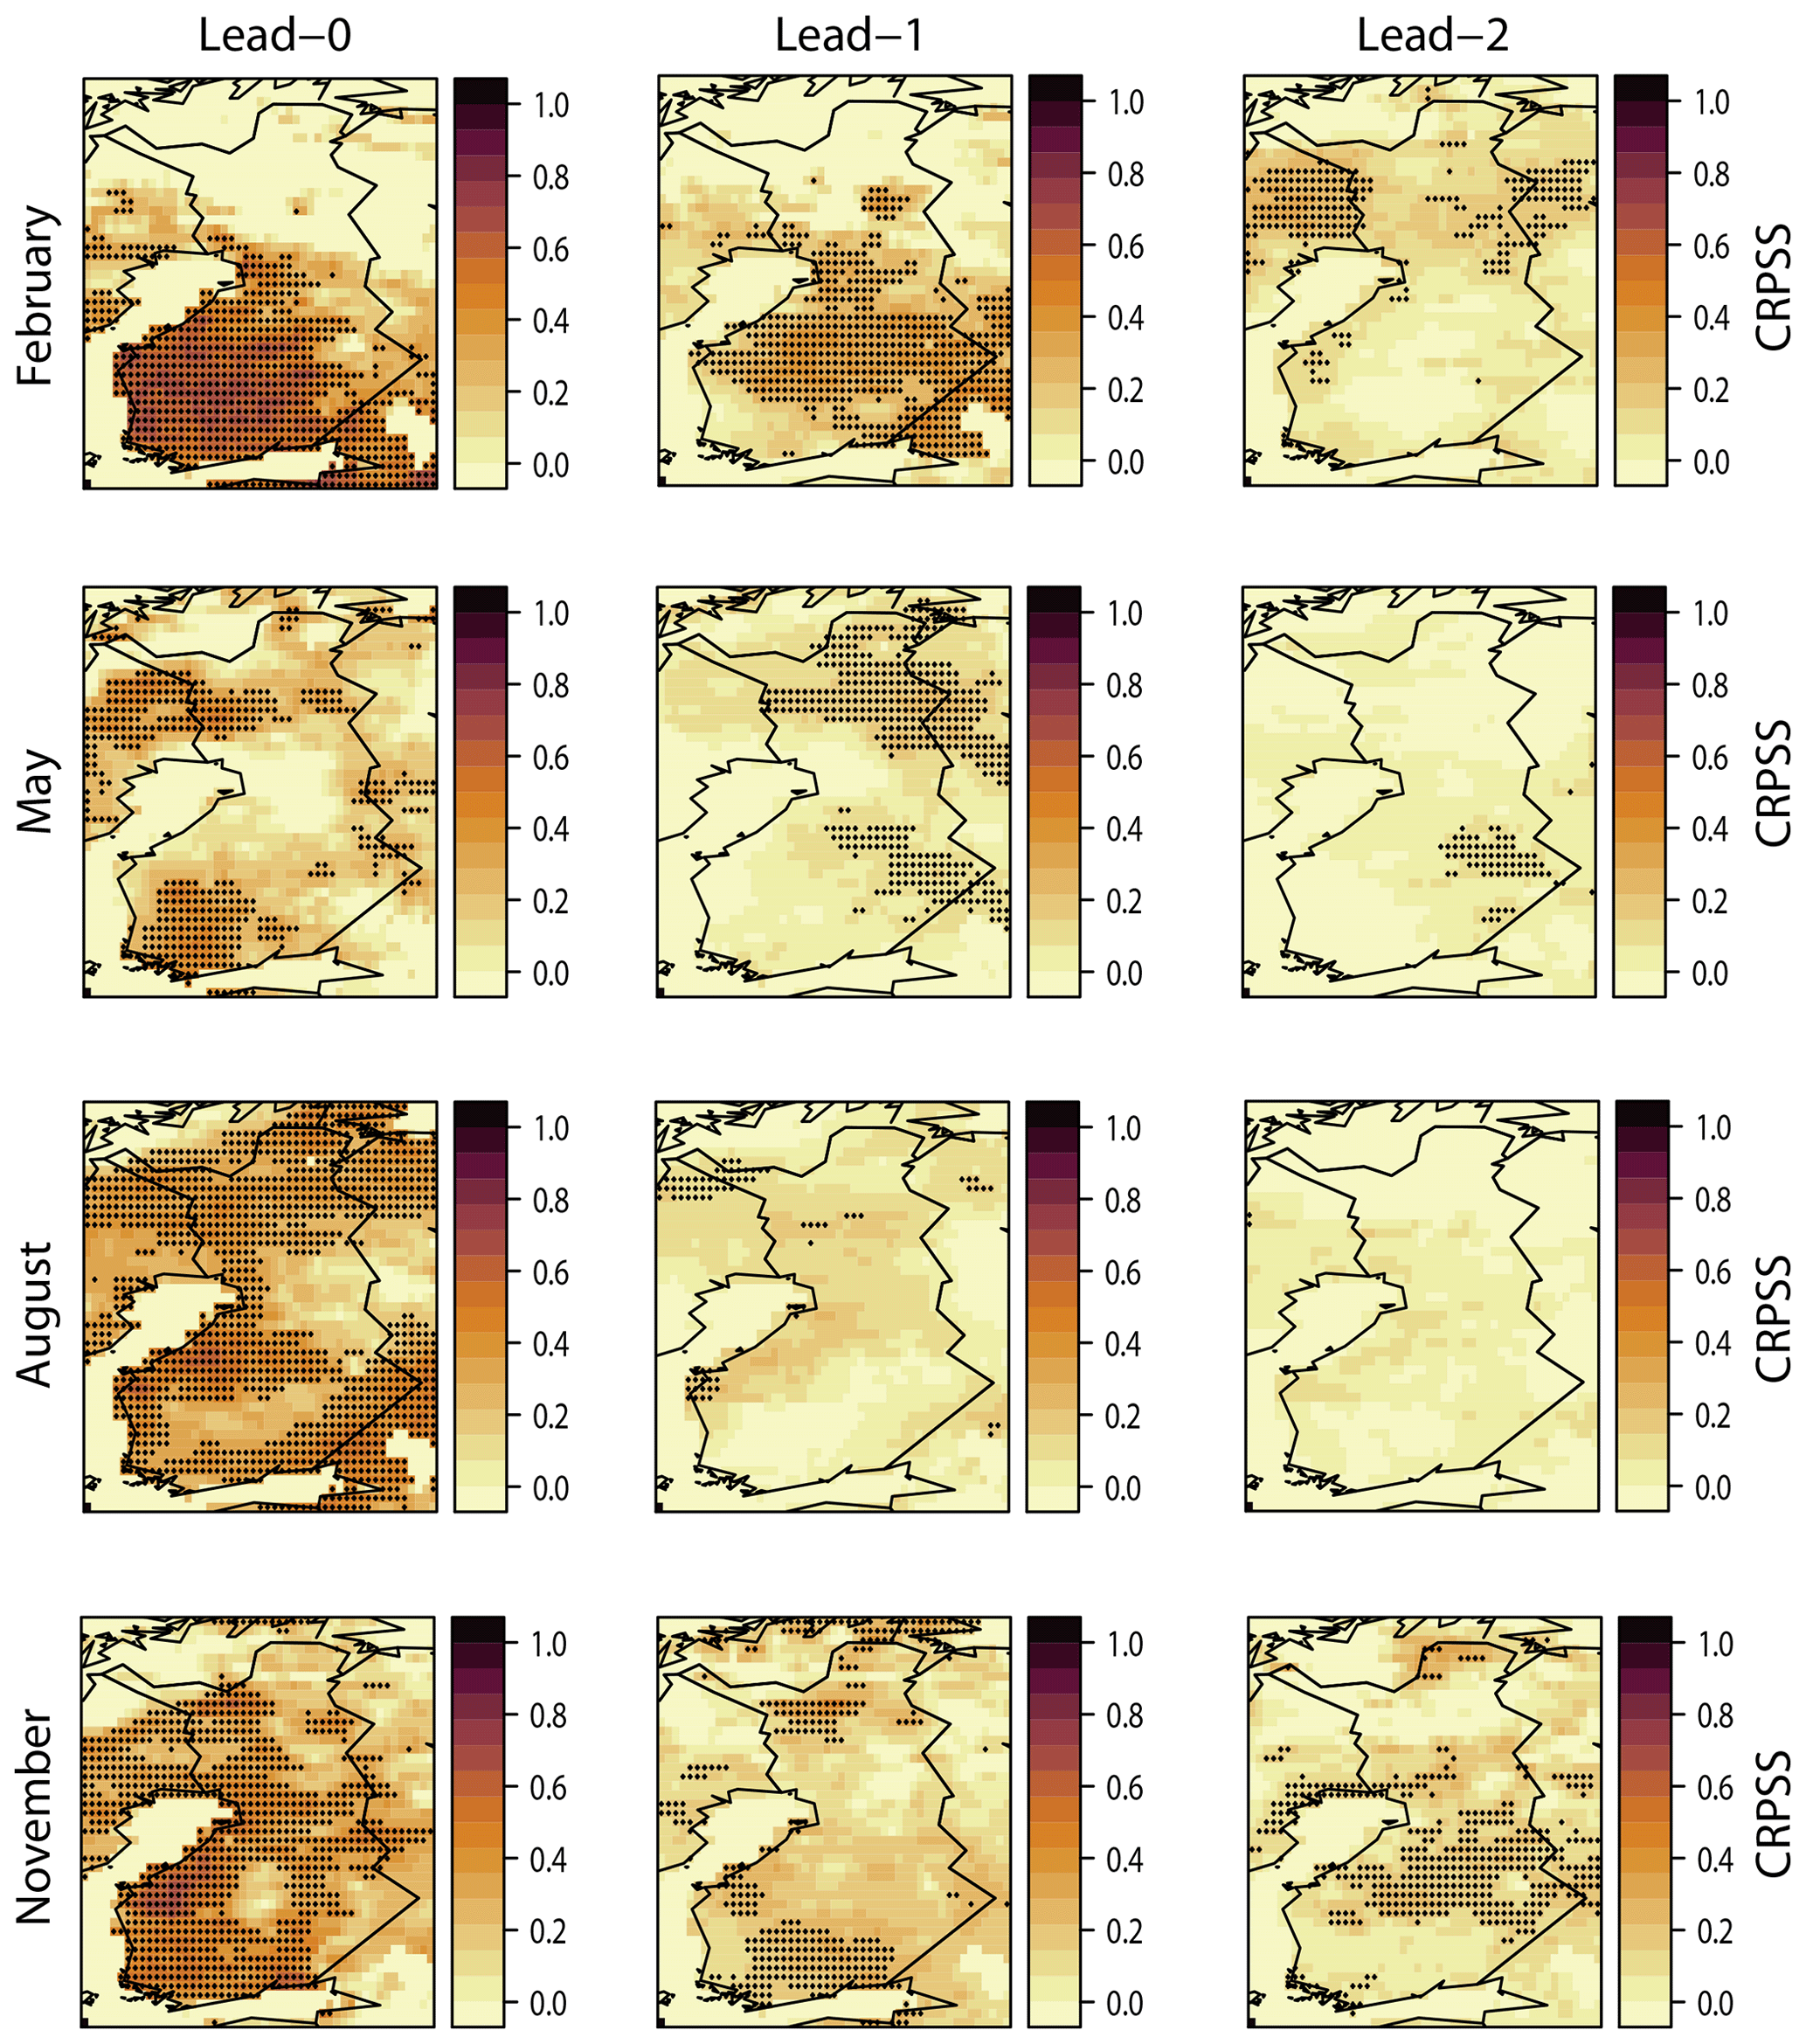
Figure 2The maps of CRPSS for February, May, August, and November with lead times of 0, 1, and 2 months. Statistically significant grid points marked with points.
The evaluation of soil moisture forecasts is complicated as the soil moisture is challenging to measure and analyse on the large scale. In addition to precipitation and evaporation rates, the spatial variation of soil moisture depends on soil properties, orography of terrain, vegetation, and drainage. This leads to large spatial variation of soil moisture. For example at gravel ridges, soil is almost always dry, whereas at peat-soils and fine grain mineral soils, already relatively small amounts of precipitation make terrain wet. In Finland, there are only very few soil moisture monitoring stations and, based only on this measured data, it is not possible to get detailed information on the state of soil moisture, and thus soil moisture monitoring is very much based on hydrological modelling. In this study we relied on the ERA5 reanalysis as the reference, but it would be very useful to compare the impact of different analyses to the bias adjustment and verification results.
The number of data points used for fitting and evaluation was rather limited, as for each grid point, there were only 18 points available for fitting and 18 points for evaluation, that is, there is one data point for each month of 36 years, split in two data sets. Therefore it is not surprising that the results on the map (Fig. 2) were not statistical significant for most grid points. With more data, more grid points with low skill values might turn out to be statistical significantly different from the reference. However, statistical significance alone does not guarantee that those forecasts would also be skillful enough to be useful for the end-users.
Not surprisingly, the skill depends on the season, the winter months being somewhat better than the summer. However, summer is more important for SÄÄTYÖ, because, in wintertime, the soil is usually frozen and provides sufficient capacity for timber harvesting. But as there are still some skill in the first month also in summer months, further development of soil moisture forecasts is warranted as forecasts have potentially large economic value. Forecasts of development soil moisture could be used for the planning of timber harvesting operations. Forest companies have several forest areas reserved for harvesting. Some areas can be harvested only under dry conditions and the other areas have almost always good bearing capacity. For the wet periods, operations can be targeted to the locations with good bearing capacity and for dry soil periods, operations can be carried out also from locations having poor bearing capacity. In practice, if forecasts in, for example, May indicate dry conditions for July, the harvesting in June could start from good bearing capacity locations and continue in July at more wet soils. However, the use of seasonal forecasts for the planning of harvesting operations is a new issue for the forest companies, and the efficient utilisation of these products necessitate user training on forecasts and extensive co-design and testing of these products with forest companies.
Using the ECMWF seasonal forecasts, we evaluated the monthly mean soil moisture forecasts for four different start months, with lead times from 0 to 2 months. Forecasts were bias adjusted, and that increased the prediction skill for the first month in case of each analyzed month. After the first lead month, winter months fared a bit better than summer months.
The use of seasonal forecasts for the planning of harvesting operations is still in its infancy, and these product have to be designed and tested in a close cooperation with forest companies. But forecasts have potential large economical benefits for timber harvesting operations and their development will be continued. Scientific issues to be addresses would be the continuing work on the post-processing of the ensemble forecasts and the impact of different soil moisture analyses on the post-processing and the validation.
The ECMWF reforecasts are available for national meteorological services of ECMWF member and co-operating states and holders of suitable licences. The ERA5 reanalysis can be downloaded from Copernicus Climate Data Store (https://cds.climate.copernicus.eu/; Copernicus Climate Change Service, 2020) after accepting the Copernicus Products Licence.
OH did most of the analysis and wrote most of the article. AV wrote the parts explaining SÄÄTYÖ and the forestry applications. AV took part in the analysis, commented on the article and helped with figures.
Authors declare that no competing interests are present.
This article is part of the special issue “19th EMS Annual Meeting: European Conference for Applied Meteorology and Climatology 2019”. It is a result of the EMS Annual Meeting: European Conference for Applied Meteorology and Climatology 2019, Lyngby, Denmark, 9–13 September 2019.
This research has been supported by the Ministry of Agriculture and Forestry of Finland/SÄÄTYÖ (grant no. 625/03.02.06.00/2018) and the ERA4CS/INDECIS (grant no. 690462).
This paper was edited by Andrea Montani and reviewed by two anonymous referees.
Chen, J., Brissette, F. P., and Leconte, R.: Uncertainty of downscaling method in quantifying the impact of climate change on hydrology, J. Hydrol., 401, 190–202, https://doi.org/10.1016/j.jhydrol.2011.02.020, 2011. a
Copernicus Climate Change Service: Climate Data Store, available at: https://cds.climate.copernicus.eu, last access: 14 April 2020. a
Hersbach, H. and Dee, D.: ERA5 reanalysis is in production, ECMWF Newsletter, 147, https://www.ecmwf.int/en/newsletter/147/news/era5-reanalysis-production (last access: 10 January 2020), 2016. a
Iturbide, M., Bedia, J., Herrera, S., Baño-Medina, J., Fernández, J., Frías, M. D., Manzanas, R., San-Martín, D., Cimadevilla, E., Cofiño, A. S., and Gutiérrez, J. M.: The R-based climate4R open framework for reproducible climate data access and post-processing, Environ. Modell. Softw., 111, 42–54, https://doi.org/10.1016/j.envsoft.2018.09.009, 2018. a
Johnson, S. J., Stockdale, T. N., Ferranti, L., Balmaseda, M. A., Molteni, F., Magnusson, L., Tietsche, S., Decremer, D., Weisheimer, A., Balsamo, G., Keeley, S. P. E., Mogensen, K., Zuo, H., and Monge-Sanz, B. M.: SEAS5: the new ECMWF seasonal forecast system, Geosci. Model Dev., 12, 1087–1117, https://doi.org/10.5194/gmd-12-1087-2019, 2019. a
Manzanas, R., Gutiérrez, J. M., Bhend, J., Hemri, S., Doblas-Reyes, F. J., Torralba, V., Penabad, E., and Brookshaw, A.: Bias adjustment and ensemble recalibration methods for seasonal forecasting: a comprehensive intercomparison using the C3S dataset, Clim. Dynam., 53, 1287–1305, https://doi.org/10.1007/s00382-019-04640-4, 2019. a
Pohjankukka, J., Riihimäki, H., Nevalainen, P., Pahikkala, T., Ala-ilomäki, J., Hyvänen, E., Varjo, J., and Heikkonen, J.: Predictability of boreal forest soil bearing capacity by machine learning, J. Terramechanics, 68, 1–8, https://doi.org/10.1016/j.jterra.2016.09.001, 2016. a
Wilks, D. S.: Statistical Methods in the Atmospheric Sciences, Elsevier, Amsterdam, 4 Edn., 2019. a
Zhao, T., Bennett, J. C., Wang, Q. J., Schepen, A., Wood, A. W., Robertson, D. E., and Ramos, M. H.: How suitable is quantile mapping for postprocessing GCM precipitation forecasts?, J. Climate, 30, 3185–3196, https://doi.org/10.1175/JCLI-D-16-0652.1, 2017. a