 | 18 Nov 2020
Development of seasonal climate outlooks for agriculture in Finland
Otto Hyvärinen
Seasonal climate forecast products offer useful information for farmers supporting them in planning and making decisions in their management practices, such as crop choice, planting and harvesting time, and water management. Driven by the need of stakeholders for tailored seasonal forecast products, our goal was to assess the applicability of seasonal forecast outputs in agriculture and to develop and pilot with stakeholders a set of seasonal climate outlooks for this sector in Finland. Finnish end users were involved in both the design and testing of the outlooks during the first pilot season of 2019. The seasonal climate outlooks were developed using the SEAS5 seasonal forecast system provided by ECMWF. To improve the prediction skill of the seasonal forecast data, several bias adjustment approaches were evaluated. The tested methods increased the quality of temperature forecast, but no suitable approach was found for eliminating the biases from precipitation data. Besides the widely applied indices, such as mean temperature, growing degree days, cold spell duration, total precipitation and dry conditions, new sector-oriented indices (such as progress of growing season) have been implemented and issued for various lead times (up to 3 months). The first result of forecast evaluation, the development of seasonal forecast indices and the first pilot season of May–October 2019 are presented. We found that the temperature-based outlooks performed well, with better performance skills for short lead times, providing useful information for the farmers in activity management. Precipitation indices had poor skills for each forecasted month, and further research is needed for improving the quality of forecast for Finland. The farmers who have tested the seasonal climate outlooks considered those beneficial and valuable, helping them in planning their activities. Following the first pilot season, further research and implementation work took place to improve our understanding of the skill of seasonal forecasts and increase the quality of tailored seasonal climate services.
- Article
(3370 KB) - Full-text XML
- BibTeX
- EndNote


In northern Europe, special features of climate represent risks for farmers in managing agricultural systems. These risks include harsh winter, very short growing season with generally low mean temperature, high risk of late and early season frost, early summer drought and high risk of abundant precipitation close to harvests, and the substantial seasonal and inter-annual variability (Peltonen-Sainio et al., 2009). For example, Finland experienced an extremely cold summer in 2017, followed by an extremely hot and dry summer in 2018, both resulting in a decrease of over 25 % in crop yield, registering in 2018 the smallest harvest of the last 26 years. Seasonal forecast can be applied as an effective agricultural risk management tool, facilitating preparedness to climate variability and change in agricultural planning and operations (Hansen, 2005; Meinke and Stone, 2005). Although seasonal climate forecasts (SCFs) have a large potential to improve productivity, their utilization for decision making in agriculture in Europe has been relatively limited (Bruno Soares and Dessai, 2016). This is partly due to the limited skill of forecast systems in this region (Doblas-Reyes et al., 2013; Bruno Soares, 2017) but also because users are not aware that such forecasts are available, and sometimes the information provided by the forecasts is ineffective (Bruno Soares and Dessai, 2016). The prediction skill of seasonal forecasts depends on variable, location, season and lead time. The skill of seasonal forecasts over northern Europe has been gradually increasing, forecasts for summer temperature varying between marginally useful and useful for decision making (Weisheimer and Palmer 2014; Scaife et al., 2014; Bauer et al., 2015; Wehrli et al., 2017). Forecasting the precipitation on a seasonal scale is more challenging, and that causes a lower although not negligible skill (Weisheimer and Palmer, 2014; Mishra et al., 2019). The applicability of seasonal forecast outputs in agriculture has not yet been studied in Finland.
This paper presents the development process and piloting of new seasonal forecast indices tailored to the needs of Finnish farmers and the first results of their quality assessment. The tailored seasonal forecast products were developed in very close collaboration with Finnish stakeholders and piloted with them to estimate their performance, effectiveness and their value for the farmers. Section 2 describes the interaction with stakeholders, the post-processing of seasonal model data and the seasonal forecast indices developed. The results of skill assessment and the first pilot of the seasonal climate outlooks including their performance are presented in Sect. 3. This work is part of the ERA4CS INDECIS project and contributes to the development of tailored seasonal climate services for targeted sectors, such as agriculture and winter tourism.
2.1 Interaction with users
One of the core requirements of climate services development is the interaction between providers and users (Buontempo et al., 2014) that implies users' involvement in the co-design and co-development of services. The seasonal forecast indices tailored for the agricultural sector were developed in collaboration with the Central Union of Agricultural Producers and Forest Owners (MTK) of Finland and tested with over 200 farmers during June–October 2019. The farmers involved were from various parts of Finland, predominantly from the southern, western and south-western part of the country. The MTK was engaged through dialogue from the beginning in the design and development process in order to harmonize the needs of the farmers in terms of seasonal forecast indices, visualization and delivery form of forecasts. A set of temperature- and precipitation-based seasonal forecast indices were selected, developed and compiled into seasonal climate outlooks. The outlooks were delivered by mail to the farmers for testing purposes. To gather farmers' opinions about the level of usability and value of the developed seasonal forecast indices and climate outlooks, a feedback survey was conducted with them at the end of the pilot season. Based on the findings of the first pilot, the indices were further improved and tested during the 2020 pilot phase.
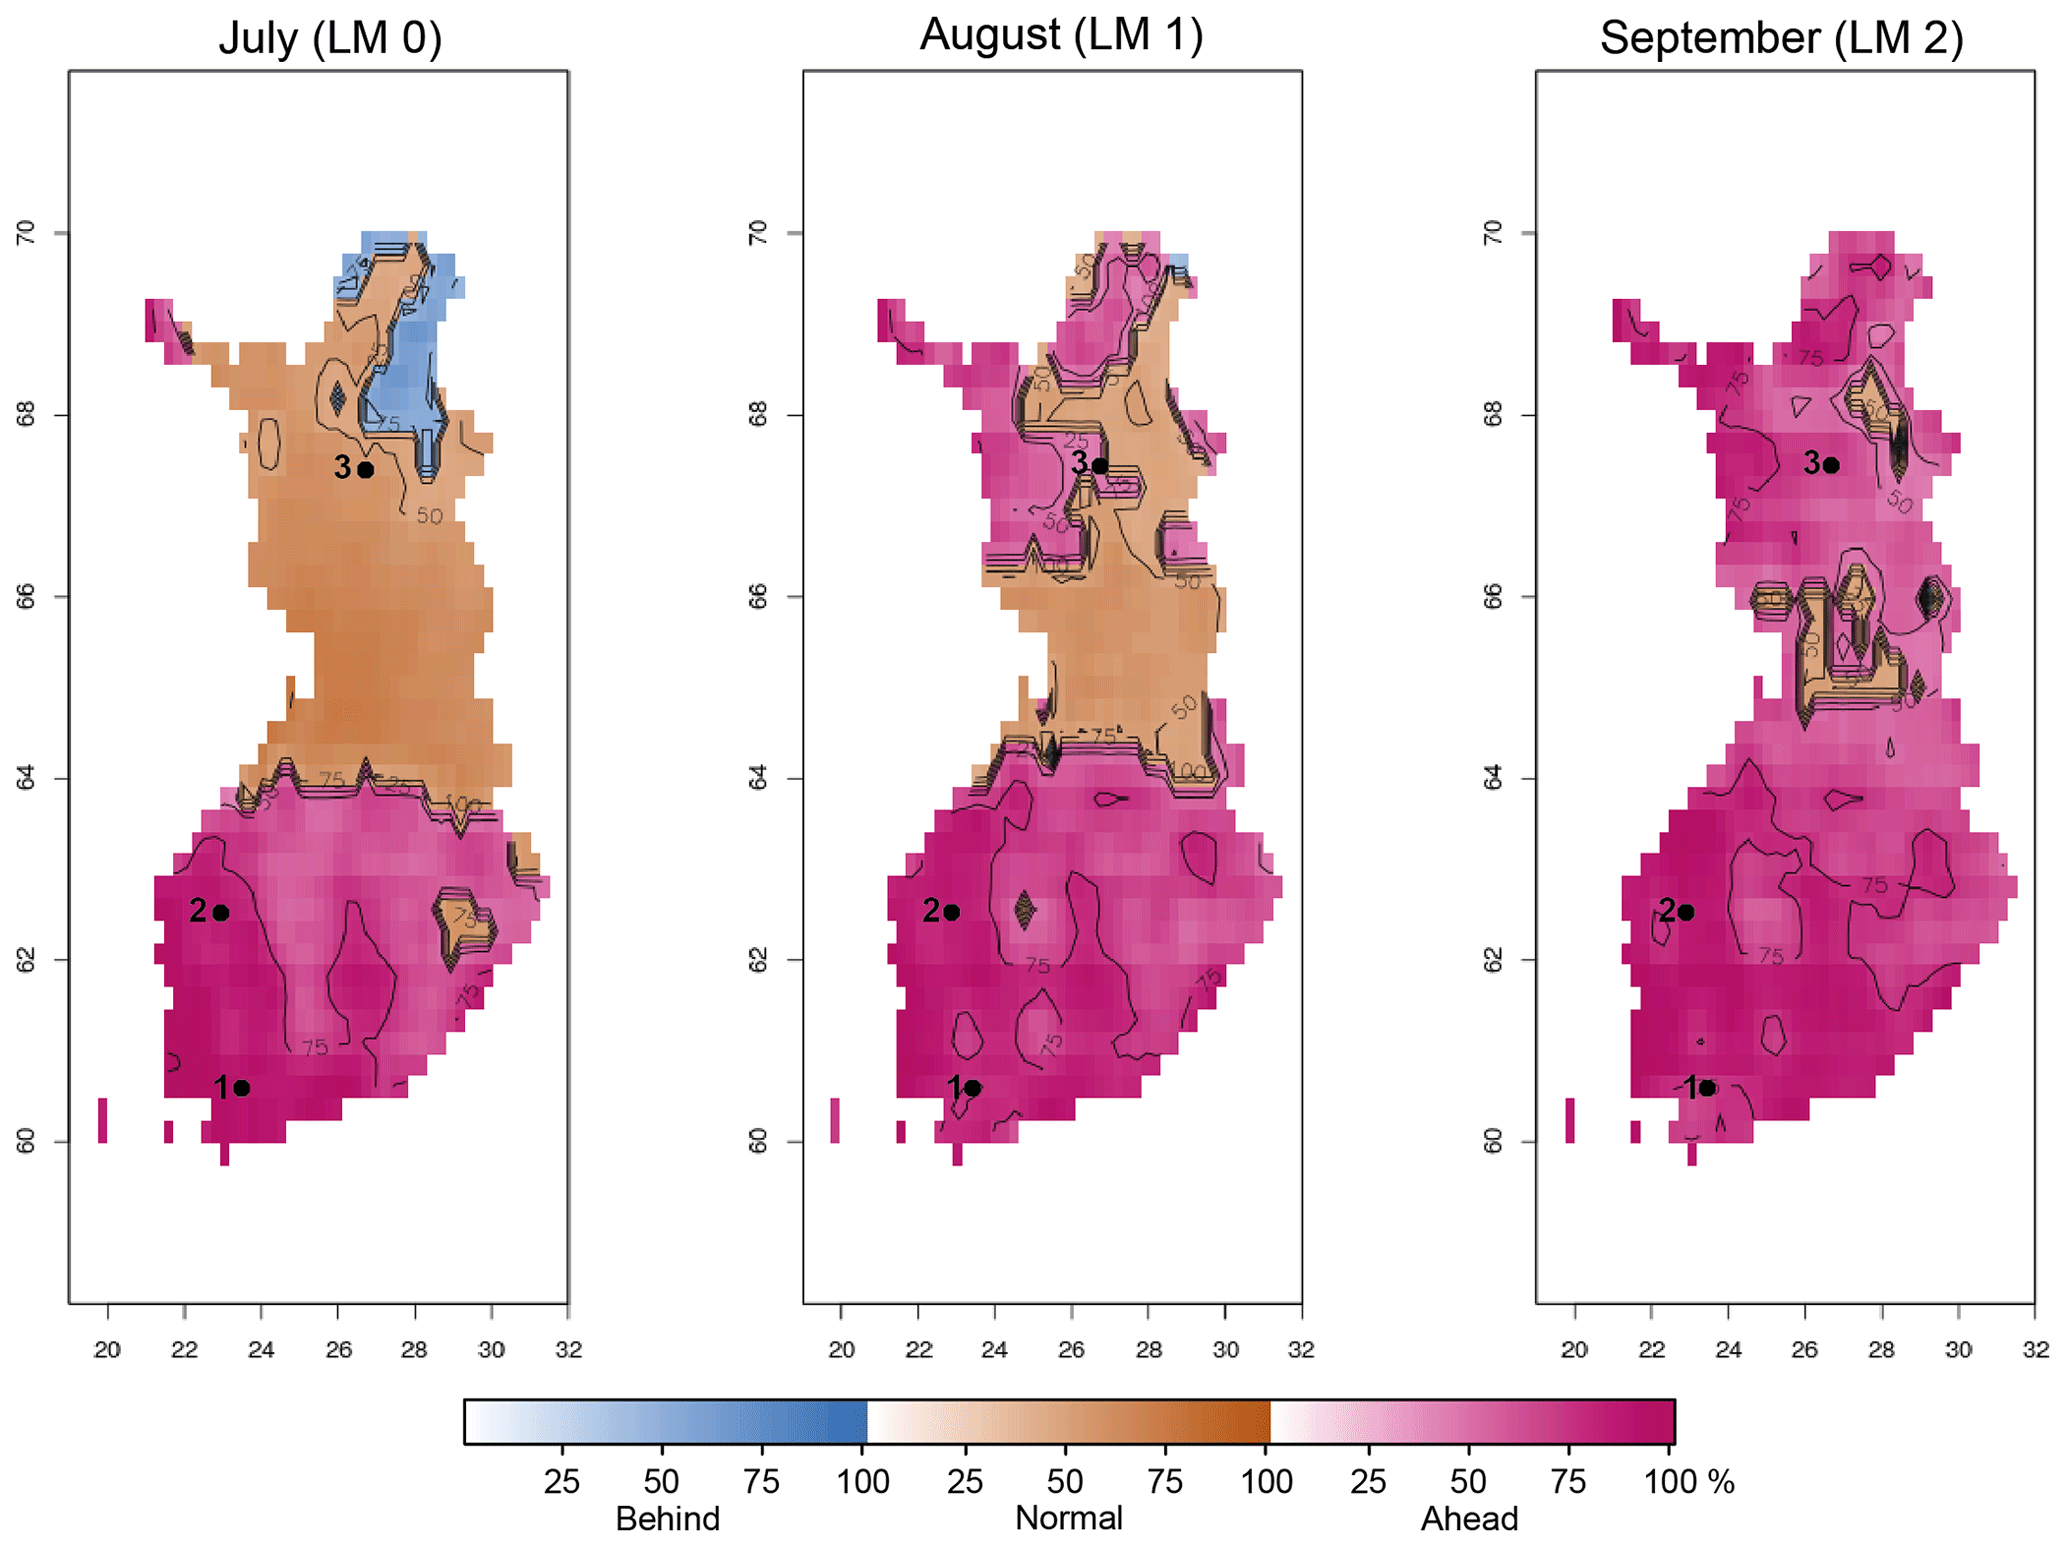
Figure 1Seasonal climate outlook describing the development of growing season with lead months 0, 1 and 2 initialized in July 2019. Dots from maps mark the location of the reported stations (discussed in Sect. 3.3): 1 – Jokioinen, 2 – Seinäjoki and 3 – Sodankylä.
2.2 Data used and post-processing of seasonal forecast data
The forecast data used in the development of seasonal climate outlooks were provided by ECMWF SEAS5 seasonal forecast system (Johnson et al., 2019). The quality of forecast was assessed using re-forecast data for the period 1993–2016 accessed from the C3S Copernicus Data Store, available at ∘ spatial resolution for 25 ensemble members. The variables used in the development of tailored seasonal forecast indices were the 2 m temperature and total precipitation. These parameters were evaluated and calibrated using as reference data the ERA5 reanalysis (Hersbach et al., 2020) for the same period. The reanalysis data were interpolated to the same resolution as re-forecast data. Although high-quality and high-density observational temperature and precipitation data are available for Finland, the use of ERA5 as reference dataset in the current project was justified by the quality of observed variables, such as soil moisture and snow depth needed in the development of indices for other sectors.
In addition, observational gridded (10 km × 10 km) growing degree day (GDD) values available from Finnish Meteorological Institute (FMI) database from 2003 onward were used both in the computation and verification of seasonal GDD indices. The real-time forecasts of tailored indices were computed using the 0.25∘ spatial resolution data available for the 51 ensemble members from SEAS5 forecast system, accessed through the Meteorological Archival and Retrieval System (MARS). Forecasts have been produced for three months ahead, meaning three monthly forecasts; the prediction from the start month is called lead month (LM) 0, followed by lead month 1 and 2.
In order to reduce the substantial systematic biases from raw model outputs and produce useful information for sectoral applications, a bias adjustment process was required. The skill assessment and bias adjustment of model data were performed using the open-source R package climate4R (Iturbide et al., 2019). The ensemble re-forecasts of monthly averages of daily mean temperature and monthly sum of daily precipitation were calculated for each grid point and evaluated. Several bias adjustment methods were tested both for temperature (such as delta, scaling, mean and variance adjustment, and empirical quantile mapping method) and for precipitation (i.e. scaling, empirical quantile mapping, parametric quantile mapping methods). The raw forecast ensemble and the bias-adjusted ensemble data for the three lead months were evaluated against ERA5 reanalysis data using reliability diagrams (e.g. Weisheimer and Palmer, 2014) of aggregated grid points of Finnish land areas and maps of verification measures, such as correlation and continuous ranked probability skill score (CRPSS). To avoid overfitting we used odd years for fitting and only even years for validation.
2.3 The development of tailored seasonal forecast indices
A set of six seasonal forecast indices were tailored for agriculture: mean temperature, development of growing season, growing degree days, cold spell, total precipitation and dry/wet conditions. The development of growing season, cold spell and dry/wet condition indices described the likelihood of expected weather conditions through probability forecast, while for mean temperature, growing degree day and total precipitation indices absolute values were forecasted.
The mean temperature index was calculated for each grid from the bias-corrected monthly ensemble mean values and predicted monthly mean temperature for three months ahead. Total precipitation index was calculated in a similar way but using the raw model monthly ensemble precipitation sum.
The growing degree day index provided the forecasted GDD sum accumulated by the end of each month. GDD was defined as the degree sum above the base temperature (5 ∘C) since the start of the growing season and was calculated from the bias-corrected daily values. Therefore, the forecasted GDD consists of the observed GDD by the initialization month and the additional forecasted sum of temperatures above the base temperature for each ensemble member. The development of growing season index predicted the progress of growing season, indicating the likelihood of being behind, normal or ahead of climatology (Fig. 1). The GDD calculated was compared to the climatology for the normal period 1981–2010. The development phase was defined by the proportion of forecast members indicating below normal, normal and above normal category compared to climatology. In addition, probabilities within these categories (shown in the maps by colour shades from light to dark) describe the proportion of members falling in the tercile categories (below 33 %, 33 %–66 % and above 66 %) of the forecast. For instance, if most of the ensemble members lied within the below normal category the growing season was predicted to be behind the climatology and the uncertainty is relatively small.
The cold spell index (Klein Tank et al., 2009) was implemented by combining the forecasted mean temperature with the re-forecast mean temperature for the period 1993–2016. A cold spell was considered to occur when the mean temperature of a 6 d period falls below the 0.1 quantile of the re-forecast mean temperature climatology. The proportion of ensemble members that satisfied this criterion expressed the probability of occurrence. The dry/wet condition index defines the conditions that are drier than usual and rainier than usual. It was determined by relating the forecasted monthly total precipitation amount of the ensemble mean to the monthly 0.5 quantiles of re-forecasted total precipitation for the respective month from the 1993–2016 period. Values below the 0.5 quantile marked the drier while those above the 0.5 quantile the rainier than usual conditions.
3.1 The seasonal climate outlooks tested during summer 2019
The seasonal forecast indices visualized through monthly maps were combined into seasonal climate outlooks. The outlooks also provided information on each index, such as a short description of the index, advice on how to interpret the forecast and information on the computation of the product. An easily understandable and interpretable format was one of the main goals pursued when implementing the outlooks. Details on the skill level of forecasts in particular were not included in the climate outlooks at this stage. Nevertheless relevant information has been shared with the users during the co-design process. Also, users were made aware of the experimental aspect of the climate outlooks. The first seasonal outlooks were issued in June, including four indices: mean temperature, development of growing season, growing degree days and total precipitation. The indices describing dry/wet conditions and cold spell were added in August. However, all the indices were subsequently computed for the period May–October 2019 for evaluation purposes.
3.2 Assessment of forecast quality
Verification results for temperature as well as precipitation re-forecasts and the developed growing degree day index are presented hereafter. All the bias adjustment methods tested for temperature corrected the raw model biases and spread of data to some degree. Reliability diagrams for tercile forecasts indicate that lower and upper terciles are in general useable, varying between marginally useful and perfect for LM0, but with only very limited skill or misleading for other lead times. The forecasts of middle tercile are not useful for most of initializations, except for August. Based on preliminary verification results the empirical quantile mapping (EQM) method was selected to be used in the calculation of indices during the first pilot year. The EQM method improved the raw data in 65 %–70 % of the grid points depending on lead time and months. The CRPSS of the EQM bias-adjusted temperature is shown for all the lead times in Fig. 2. Skill score values for LM0 are the largest and statistically significant over a larger area for July. For the other initializations and lead times values are lower, somewhat better in May (LM0 and LM2) and in June (LM1). The near-zero values for LM0 in June and for LM2 in general (except in May) suggest that forecasts hardly perform better than reference data.
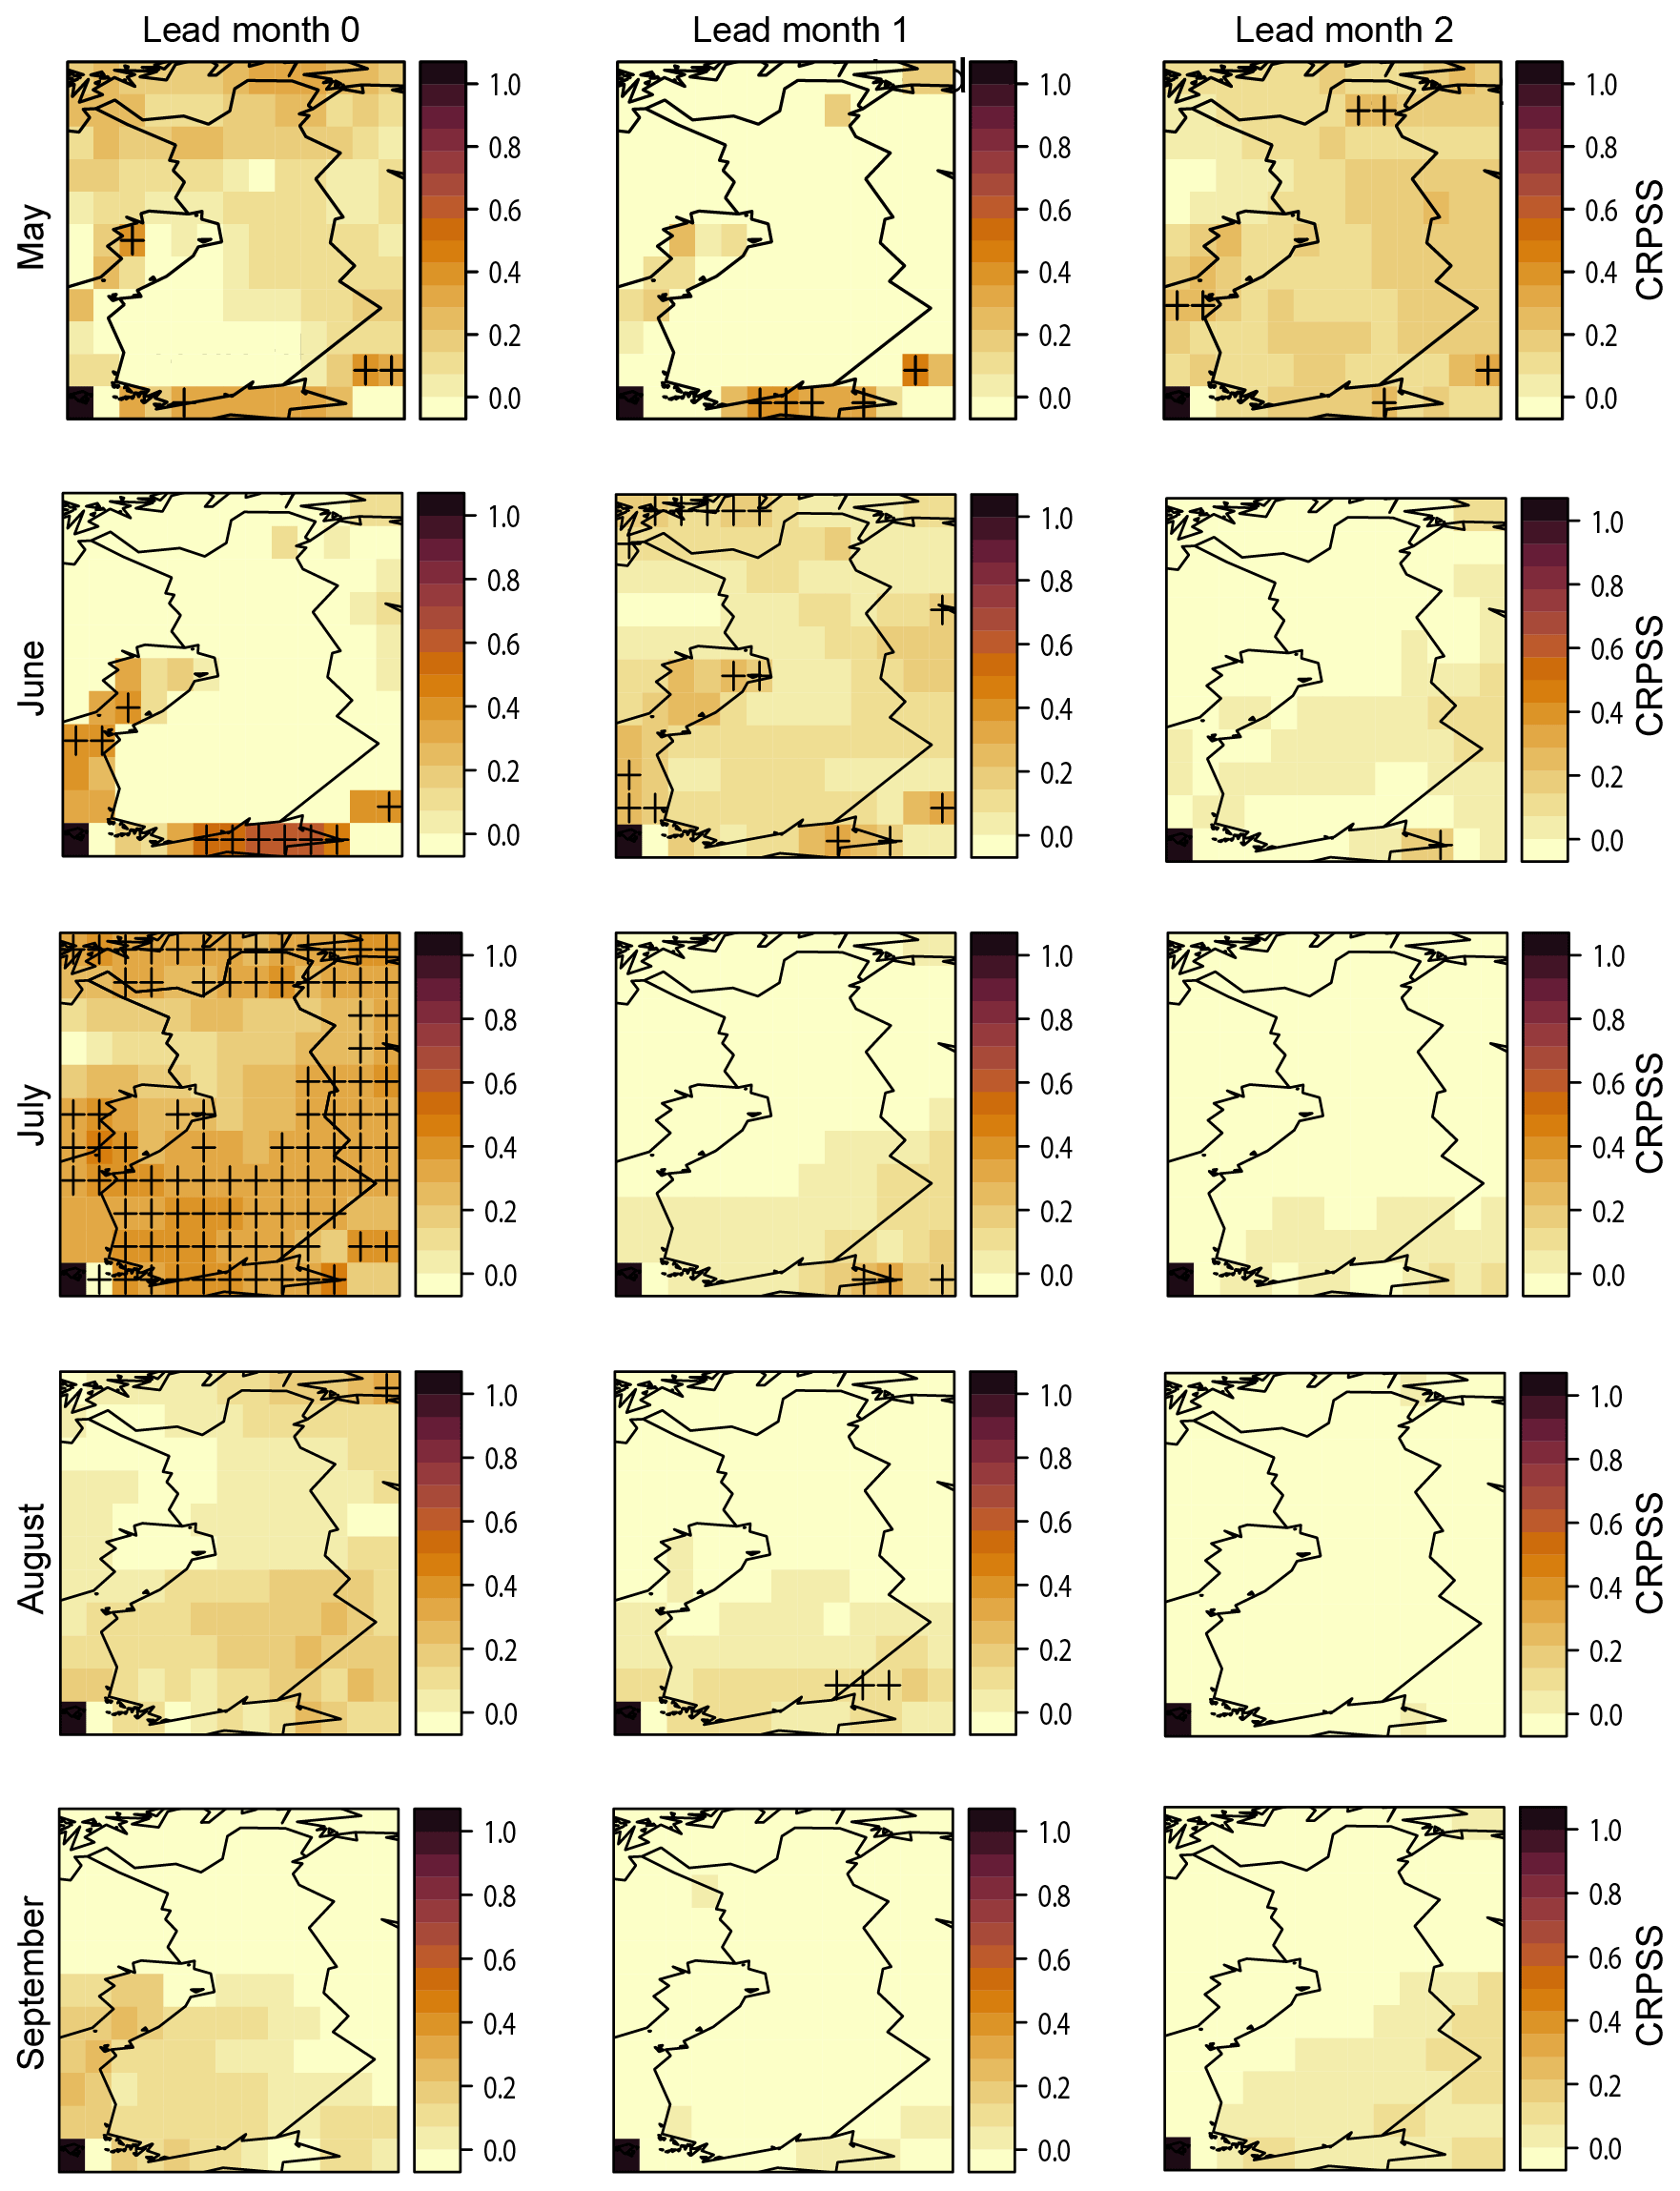
Figure 2Maps of CRPSS for bias-corrected temperature (applying the EQM method) for May–September with lead months 0, 1 and 2. Statistically significant grid points are marked with crosses.
The GDD index calculated using the raw and bias-adjusted temperature data was evaluated against observational GDD. Reliability diagrams for tercile forecasts of growing degree day index indicate that for LM0 the lower and upper terciles fall between the marginally useful and perfect category for July–August–September initialization, but for LM1 and 2 the forecasts are useless (not shown). Considerably large CRPSS values that are statistically significant were found over large areas for LM0 in July and September, somewhat lower, but still statistically significant skill score values were in June for LM1. For the other initializations and lead times the skill scores are lower, in some cases near-zero. Skilful predictions of growing season development and growing degree days sum provide valuable information on crops stages and agricultural productivity, permitting better management and planning the timing of activities. Using the observed GDD as a starting point in the computation of forecasted GDD values improved the forecast to some degree.
1
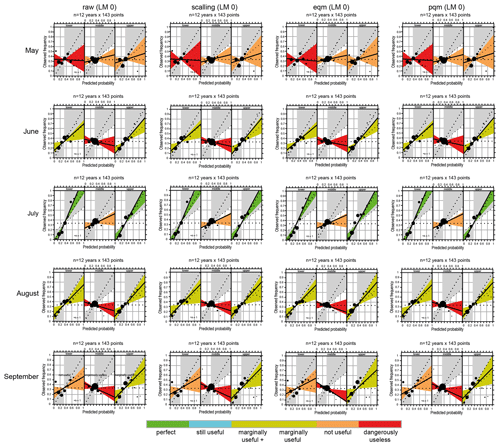
Figure 3Reliability diagrams of tercile precipitation forecasts with lead month 0 for May–September obtained for SEAS5 raw model data and the bias correction methods considered.
It must be noted, that although the EQM technique applied in post-processing of temperature effectively adjusts the large biases exhibited by raw model data, it may not ensure forecast reliability and coherence in seasonal forecast post-processing and thus is not a wholly satisfactory method for a seasonal forecast timescale (Zhao et al., 2017). Therefore, following the first pilot season, more bias adjustment methods, suitable for a limited data amount, have been tested, based on which the choice of bias correction method has been reconsidered. However, since the present study describes the experiment from the pilot season of 2019, these findings are not included to this paper.
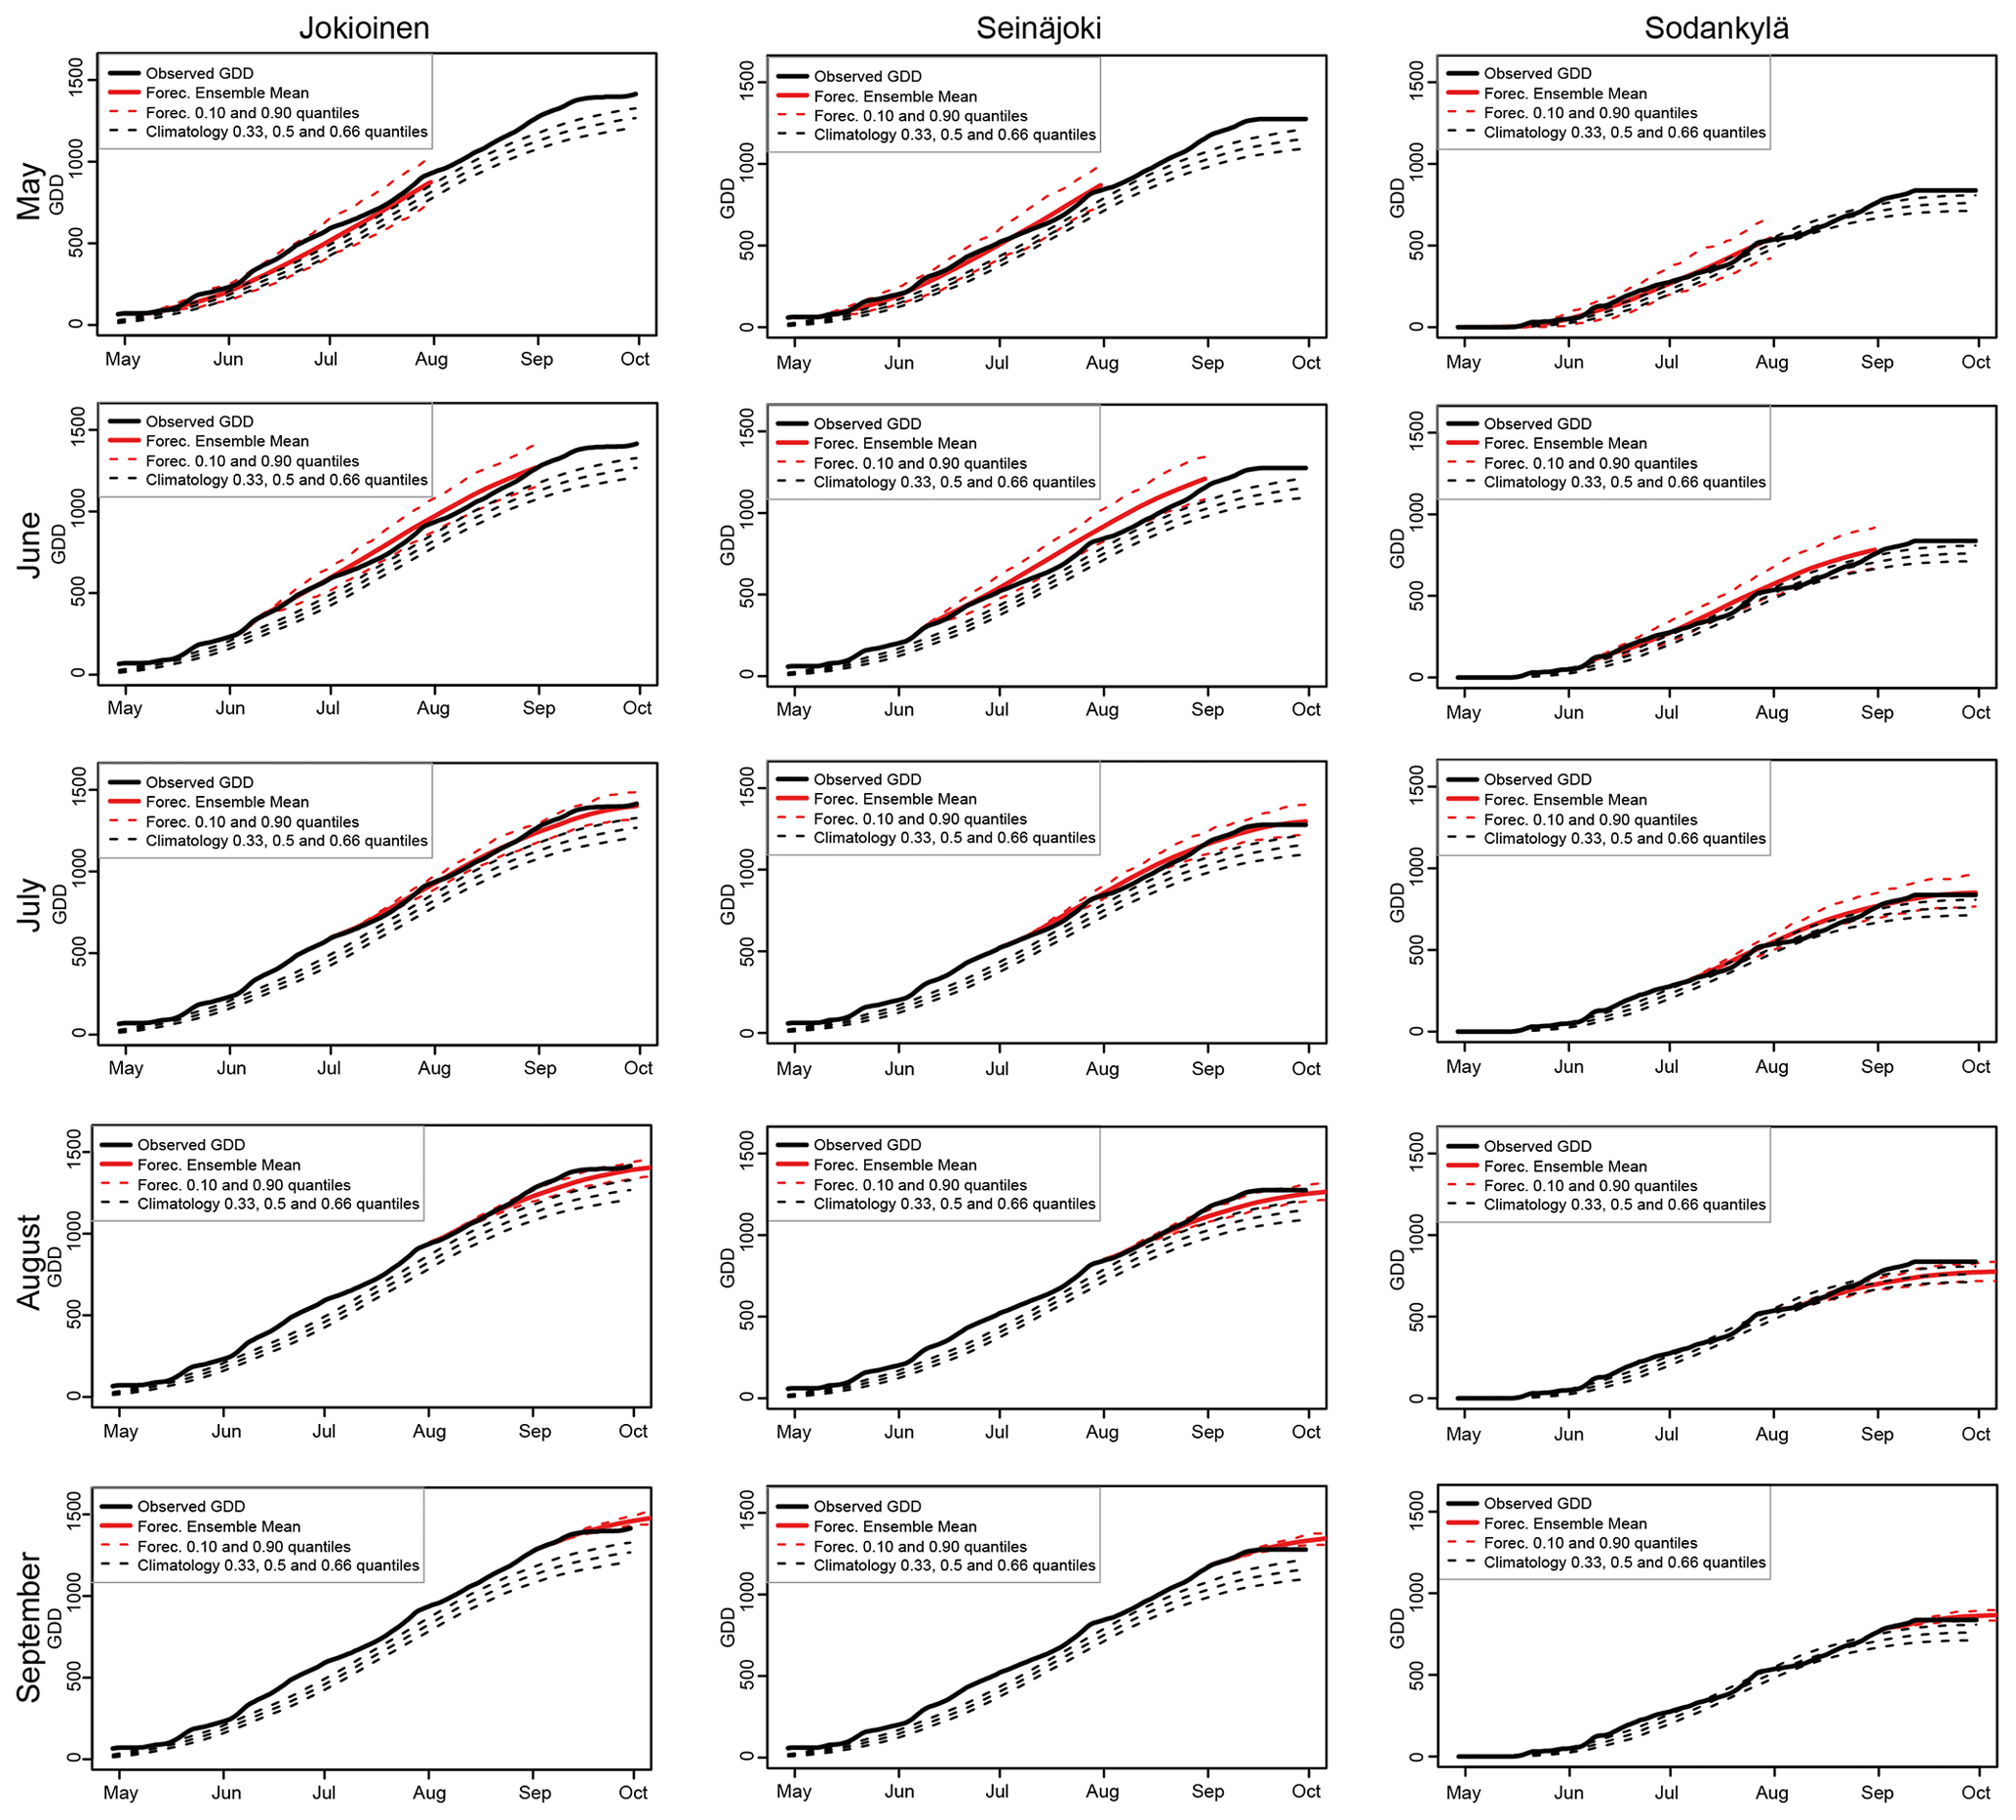
Figure 4Forecasted and observed GDD during May–September 2019 for the selected locations: Jokioinen, Seinäjoki and Sodankylä. Runs from October are not included in the figure since growing season ended during October.
Verification results showed low skill for precipitation. Reliability diagrams of raw model data and bias-adjusted data with various methods (Fig. 3) indicate that lower and upper terciles of the forecasts for LM0 fall between useful and marginally useful categories for the June–July–August initializations but useless for LM1 and LM2. For May and September, the forecasts are useless for LM0 and climatology would give better estimations. Moreover, the bias correction methods tested performed similarly for the studied months. For LM0 forecasts, the CRPSS has the largest values in July both for the raw and bias-adjusted data. For the other forecast initializations and lead months, the skill score is much lower. Our verification results concerning the low seasonal predictability of precipitation over Europe are consistent with the earlier studies (Mishra et al., 2019; Wehrli et al., 2017). Challenges in improving the quality of precipitation in seasonal forecast were shown also in earlier studies (Manzanas et al., 2018). According to verification results none of the applied bias adjustment methods improved the forecast quality of raw data, and thus the raw precipitation forecast was used in the production of seasonal climate indices during the first pilot season. However, we are aware that reducing biases from raw model data is essential when using seasonal forecast data in sectoral applications. Thus, following the first pilot season, additional bias adjustment techniques and approaches were tested for precipitation in order to improve the skill of forecast for the second pilot phase. It must be also noted that the evaluation of forecast quality was performed using mainly reanalysis data as a reference. Evaluation against observational datasets might result in slightly different outcomes due to observational uncertainty, which might play a role in the statistical post-processing of forecasts (Manzanas et al., 2020). This will be considered in future analyses.
3.3 Performance of seasonal climate outlooks during the 2019 pilot season
After the first pilot season the accuracy of forecasts was tested by comparing the climate outlooks provided with observations for temperature, GDD and precipitation for the whole study area and in more details for three selected stations located in various regions: Jokioinen (60∘48′, 23∘29′), Seinäjoki (62∘56′, 22∘29′) and Sodankylä (67∘21′, 26∘37′). The performance of the climate outlooks during one pilot phase clearly does not assess the skill of the forecasts and developed indices. The intention is rather to estimate whether the produced forecasts were of any use to the farmers.
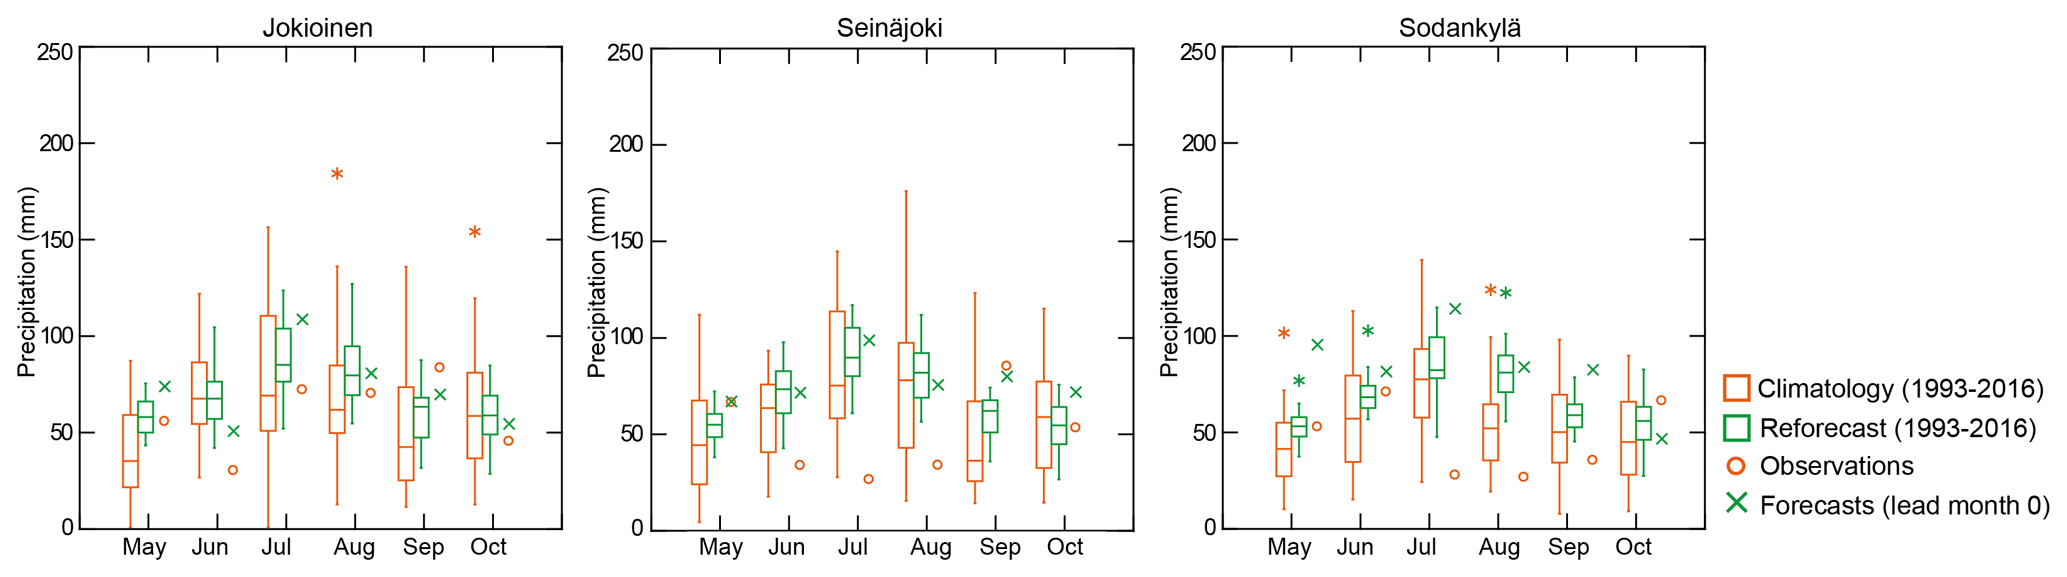
Figure 5The forecasted and observed monthly precipitation sums for May–October 2019 and the climatology based on re-forecast precipitation values and observations from 1993 to 2016 for the selected locations.
Mean temperature was well forecasted for each month and lead time. In the case of forecasts for LM0, errors of 1–2 ∘C range occurred, especially in the southern and southwestern coastal area where the mean temperature was systematically underestimated. A similar analogy was found for LM1 and LM2 forecasts for most of the months. The accumulation of forecasted and observed GDD sum during the pilot season for the three selected locations is shown in Fig. 4. The predicted GDD shares a strong resemblance with the observed accumulation, with higher accuracy for shorter lead time. Even for LM2 the observed values still fall within the 10 % and 90 % probability distribution of ensemble members.
Precipitation was not well predicted; forecasts for LM0 indicated rainier conditions for the whole pilot season than was realized (Fig. 5), with the largest errors in the extremely dry month of July. The quality of the precipitation forecast for the summer season of 2019 was lower than that of the re-forecast climatology for the same months.
Although the skill of the forecast products needs to be improved, the seasonal forecast outlooks provided valuable information for the farmers, according to the feedback survey conducted with the users. Of the contacted users, 43 answered the survey, 83 % of whom found the climate outlooks very easily or easily understandable. All the provided indices were found useful; of all the indices the total precipitation index was marked as very useful and useful by 78 % and the mean temperature and development of growing season indices by 74 % of the respondents. The evaluation regarding precipitation is not in line with our verification results; nevertheless, it might indicate user demand for seasonal precipitation forecasts, but it also shows that users need more information on the skill of forecast to better understand its usability. A total of 29 % of repliers have used the seasonal forecasts provided when planning their activities, especially for the timing of harvests; 45 % have not changed their normal course of action although followed the forecasts. Most of the respondents (93 %) indicated their willingness to continue the piloting during the following year.
Recent advances in seasonal climate modelling offer the opportunity to provide valuable information for agricultural risk management but only if forecasts are tailored to the needs of the stakeholders. The first results of our experiment in developing and testing new seasonal climate services for agriculture with limited resources are presented in this paper, including applicability assessment of seasonal forecasts in Finland, the newly developed seasonal climate outlooks and the outcomes of the first pilot season.
Involving end users in co-designing and testing of seasonal forecast products provided us qualitative information on the requirements concerning both the content and visualization of the new forecast products and their usability. Working with the Central Union of Agricultural Producers and Forest Owners as an intermediary provided essential support both in defining the required products and engaging the farmers. Skill assessment of seasonal forecast model outputs showed that there is limited skill in the variables used, and biases should be reduced in order to improve the quality of forecasts. The skill of temperature and of the tailored temperature-based indices can be successfully increased through bias adjustment. Predictability of precipitation is found to be more limited over Finland, and improving its forecast skill is more challenging. Although the tested seasonal forecast indices had a limited skill and need further improvements, the farmers found the climate outlooks useful, and almost one-third of them used those in planning the timing of certain activities. The presented seasonal forecast indices are still under development; following the 2019 pilot season further studies on forecast quality improvement and product development were conducted to improve the skill and usability of the tailored forecast products. Additional bias adjustment methods and other approaches were considered for both temperature and precipitation data. Testing of the improved seasonal forecast indices with end users continued during spring and summer 2020.
The SEAS5 long-range forecasting system is available for national meteorological services of ECMWF members, cooperating states, and holders of suitable licences. The ERA5 reanalysis and also SEAS5 forecast products can be downloaded from the C3S Climate Data Store (https://cds.climate.copernicus.eu/, last access: 12 June 2020; Copernicus Climate Change Service, 2020) after accepting the terms of the Copernicus Products Licence.
AV planned and wrote the manuscript with input from OH. AV and OH designed and implemented the climate outlooks and performed the analysis.
The authors declare that they have no conflict of interest.
This article is part of the special issue “19th EMS Annual Meeting: European Conference for Applied Meteorology and Climatology 2019”. It is a result of the EMS Annual Meeting: European Conference for Applied Meteorology and Climatology 2019, Lyngby, Denmark, 9–13 September 2019.
This work was supported by the ERA4CS INDECIS project (grant agreement no. 690462). We thank Tiina Ervasti for the help provided in the preparation of the feedback survey. We also acknowledge the Finnish stakeholders who took part in the piloting of seasonal climate outlooks and provided their valuable opinions.
This research has been supported by the ERA4CS INDECIS (grant no. 690462).
This paper was edited by Carlo Buontempo and reviewed by two anonymous referees.
Bauer, P., Thorpe, A., and Brunet, G.: The quiet revolution of numerical weather prediction, Nature, 525, 47–55, 2015.
Bruno Soares, M.: Assessing the usability and potential value of seasonal climate forecasts in land management decisions in the southwest UK: challenges and reflections, Adv. Sci. Res., 14, 175–180, https://doi.org/10.5194/asr-14-175-2017, 2017.
Bruno Soares, M. and Dessai, S.: Barriers and enablers to the use of seasonal climate forecasts amongst organisations in Europe, Clim. Change, 137, 89–103, 2016.
Buontempo, C., Hewitt, C. D., Doblas-Reyes, F. J., and Dessai, S.: Climate service development, delivery and use in Europe at monthly to inter-annual timescales, Climate Risk Management, 6, 1–5, https://doi.org/10.1016/j.crm.2014.10.002, 2014.
Copernicus Climate Change Service: Climate Data Store, available at: https://cds.climate.copernicus.eu, last access: 12 June 2020.
Doblas-Reyes, F. J., Garcia-Serrano, J., Lienert, F, Biescas, A. P., and Rodrigues, L. R. L.: Seasonal climate predictability and forecasting: status and prospects, Wiley Interdiscip. Rev. Clim. Change, 4, 245–268, https://doi.org/10.1002/wcc.217, 2013.
Hansen, J. W.: Integrating seasonal climate prediction and agricultural models for insights into agricultural practice, Philos. T. R. Soc. B, 360, 2037–2047, 2005.
Hersbach, H., Bell, B., Berrisford, P., Hirahara, S., Horányi, A., Muñoz-Sabater, J., Nicolas, J., Peubey, C., Radu, R., Schepers, D., Simmons, A., Soci, C., Abdalla, S., Abellan, X., Balsamo, G., Bechtold, P., Biavati, G., Bidlot, J., Bonavita, M., De Chiara, G., Dahlgren, P., Dee, D., Diamantakis, M., Dragani, R., Flemming, J., Forbes, R., Fuentes, M., Geer, A., Haimberger, L., Healy, S., Hogan, R. J., Hólm, E., Janisková, M., Keeley, S., Laloyaux, P., Lopez, P., Lupu, C., Radnoti, G., de Rosnay, P., Rozum, I., Vamborg, F., Villaume, S., and Thépaut, J.-N.: The ERA5 Global Reanalysis, Q. J. R. Meteor. Soc., 146, 1–51, https://doi.org/10.1002/qj.3803, 2020.
Iturbide, M., Bedia, J., Herrera, S., Baño-Medina, J., Fernández, J., Frías, M. D., Manzanas, R., San-Martín, D., Cimadevilla-Alvarez, E., Cofiño, A. S., and Gutiérrez, J. M.: The R-based climate4R open framework for reproducible climate data access and post-processing, Environ. Modell. Softw., 111, 42–52, https://doi.org/10.1016/j.envsoft.2018.09.009, 2019.
Johnson, S. J., Stockdale, T. N., Ferranti, L., Balmaseda, M. A., Molteni, F., Magnusson, L., Tietsche, S., Decremer, D., Weisheimer, A., Balsamo, G., Keeley, S. P. E., Mogensen, K., Zuo, H., and Monge-Sanz, B. M.: SEAS5: the new ECMWF seasonal forecast system, Geosci. Model Dev., 12, 1087–1117, https://doi.org/10.5194/gmd-12-1087-2019, 2019.
Klein Tank, A. M. G., Zwiers, F. W., and Zhang, X.: Guidelines on analysis of extremes in a changing climate in support of informed decisions for adaptation, climate data and monitoring WCDMP-No 72, WMO-TD No. 1500, p. 5, 2009.
Manzanas, R., Lucero, A., Weisheimer, A., and Gutiérrez, J. M.: Can bias correction and statistical downscaling methods improve the skill of seasonal precipitation forecasts?, Clim. Dynam., 50, 1161–1176, https://doi.org/10.1007/s00382-017-3668-z, 2018.
Manzanas, R., Gutiérrez, J. M., Bhend, J., Hemri. S., Doblas-Reyes, F. J., Penabad, E., and Brookshaw, A.: Statistical adjustment, calibration and downscaling of seasonal forecasts: a case-study for Southeast Asia, Clim. Dynam., 54, 2869–2882, https://doi.org/10.1007/s00382-020-05145-1, 2020.
Meinke, H. and Stone, R. C.: Seasonal and inter-annual climate forecasting: the new tool for increasing preparedness to climate variability and change in agricultural planning and operations, Clim. Change, 70, 221–253, 2005.
Mishra, N., Prodhomme, C., and Guemas, V.: Multi-model skill assessment of seasonal temperature and precipitation forecast over Europe, Clim. Dynam., 52, 4207–4225, https://doi.org/10.1007/s00382-018-4404-z, 2019.
Peltonen-Sainio, P., Rajala, A., Känkänen, H., and Hakala, K.: Improving farming systems in northern European conditions, in: Crop physiology: applications for genetic improvement and agronomy, edited by: Sadras, V. O. and Calderini, D., Elsevier, Amsterdam, the Netherlands, 71–97, 2019.
Scaife, A. A., Arribas, A., Blockley, E., Brookshaw, A., Clark, R. T., Dunstone, N., Eade, R., Fereday, D., Folland, C. K., Gordon, M., Hermanson, L., Knight, J. R., Lea, D. J., MacLachlan, C., Maidens, A., Martin, M., Peterson, A. K., Smith, D., Vellinga, M., Wallace, E., Waters, J., and Williams, A.: Skillful long-range prediction of European and North American winters, Geophys. Res. Lett., 41, 2514–2519, https://doi.org/10.1002/2014GL059637, 2014.
Wehrli, K., Bhend, J., and Liniger, M. A.: Systematic quality assessment of an operational seasonal forecasting system, Technical Report, MeteoSwiss, 263, 52 pp., 2017.
Weisheimer, A. and Palmer, T. N.: On the reliability of seasonal climate forecasts, J. Roy. Soc. Interface, 1, 20131162, https://doi.org/10.1098/rsif.2013.1162, 2014.
Zhao, T., Bennett, J. C., Wang, Q. J., Schepen, A., Wood, A. W., Robertson, D. E., and Ramos, M. H.: How suitable is quantile mapping for post-processing GCM precipitation forecasts?, Journal of Climate, 30, 3185–3196, https://doi.org/10.1175/JCLI-D-16-0652.1, 2017.