 | 18 Jun 2020
Statistics of sea-effect snowfall along the Finnish coastline based on regional climate model data
Anna Luomaranta
Kirsti Jylhä
Julia Jeworrek
Tuuli Perttula
Christian Dieterich
Lichuan Wu
Anna Rutgersson
Antti Mäkelä
The formation of convective sea-effect snowfall (i.e., snow bands) is triggered by cold air outbreaks over a relatively warm and open sea. Snow bands can produce intense snowfall which can last for several days over the sea and potentially move towards the coast depending on wind direction. We defined the meteorological conditions which statistically favor the formation of snow bands over the north-eastern Baltic Sea of the Finnish coastline and investigated the spatio-temporal characteristics of these snow bands. A set of criteria, which have been previously shown to be able to detect the days favoring sea-effect snowfall for Swedish coastal area, were refined for Finland based on four case study simulations, utilizing a convection-permitting numerical weather prediction (NWP) model (HARMONIE-AROME). The main modification of the detection criteria concerned the threshold for 10 m wind speed: the generally assumed threshold value of 10 m s−1 was decreased to 7 m s−1. The refined criteria were then applied to regional climate model (RCA4) data, for an 11-year time period (2000–2010). When only considering cases in Finland with onshore wind direction, we found on average 3 d yr−1 with favorable conditions for coastal sea-effect snowfall. The heaviest convective snowfall events were detected most frequently over the southern coastline. Statistics of the favorable days indicated that the lower 10 m wind speed threshold improved the representation of the frequency of snow bands. For most of the favorable snow band days, the location and order of magnitude of precipitation were closely captured, when compared to gridded observational data for land areas and weather radar reflectivity images. Lightning were observed during one third of the favorable days over the Baltic Sea area.
- Article
(4659 KB) - Full-text XML
- BibTeX
- EndNote


During the cold season, vigorous boundary layer convection can develop when cold continental air masses are advected over an open and relatively warm body of water, like the Great Lakes of North America (e.g., Hjelmfelt and Braham, 1983), the English Channel and the Irish Sea (e.g., Norris et al., 2012), the Japan Sea (e.g., Ohtake et al., 2009) and the Baltic Sea in northern Europe (Savijärvi, 2012; Mazon et al., 2015; Jeworrek et al., 2017; Olsson et al., 2018). Intense snowfall may occur when significant amounts of heat and moisture fluxes from the water destabilize the overlying air. Sea-effect snowfall events may last for several days over the sea, with the potential accumulation of heavy snowfall at the coastline if an onshore wind direction persists. The consequences of such snowfall events may cause tree and roof damage, power cuts, massive damage to the traffic sector (Groenemeijer et al., 2015, 2016) and problems for snow removal logistics (Keskinen, 2012). If intense snowfall occurs in highly populated areas with large traffic volumes the decreased visibility and reduced road surface friction can impede traffic and result in motor vehicle accidents (Juga et al., 2012, 2014). Such extreme weather conditions must also be taken into account in precaution planning for shore-located nuclear power plants (e.g., Jylhä et al., 2018).
This paper focuses on sea-effect snowfall over the Finnish sea and coastal areas, located in the north-eastern region of the Baltic Sea in northern Europe. In this region snow bands are typically long (70–200 km), narrow (20–50 km) and seldom move far inland. The population density in Finland is relatively low, with the exception of the Helsinki metropolitan area and a few other densely populated urban areas. Given these circumstances it may be of greater importance where the snow band event occurs along the coastline, than simply the amount of snowfall generated. For instance, in two cases that strongly affected the Helsinki region (17 March 2005 related to an approaching warm front, see Juga et al., 2012; and 3 February 2012 when multiple perpendicular snow bands affected about 100 km of the Finnish coastline, see Fig. 1b, Juga et al., 2014; Niemelä, 2012; Mazon et al., 2015), the maximum accumulated snow depths measured only 5 and 10 cm. In both instances, the rapidly worsening conditions resulted in several hundred motor vehicle accidents and dozens of injured persons. In contrast, a record-breaking snow band hit the coast perpendicularly at Merikarvia, a small municipality on the western coast of Finland (Fig. 1c, Olsson et al., 2017). In this instance it snowed 73 cm in less than 24 h on 8 January 2016, clearly exceeding the previous national record of 50 cm d−1 which occurred in Rauma on 21 November 1971. No damage was reported to emergency services and only a few cars were immobilized due to snowdrifts. The impact of this extreme weather event for society was small in this case, given that the area of most intense snowfall was only ∼30 km wide and that the municipality affected had only around seven inhabitants per square kilometer.
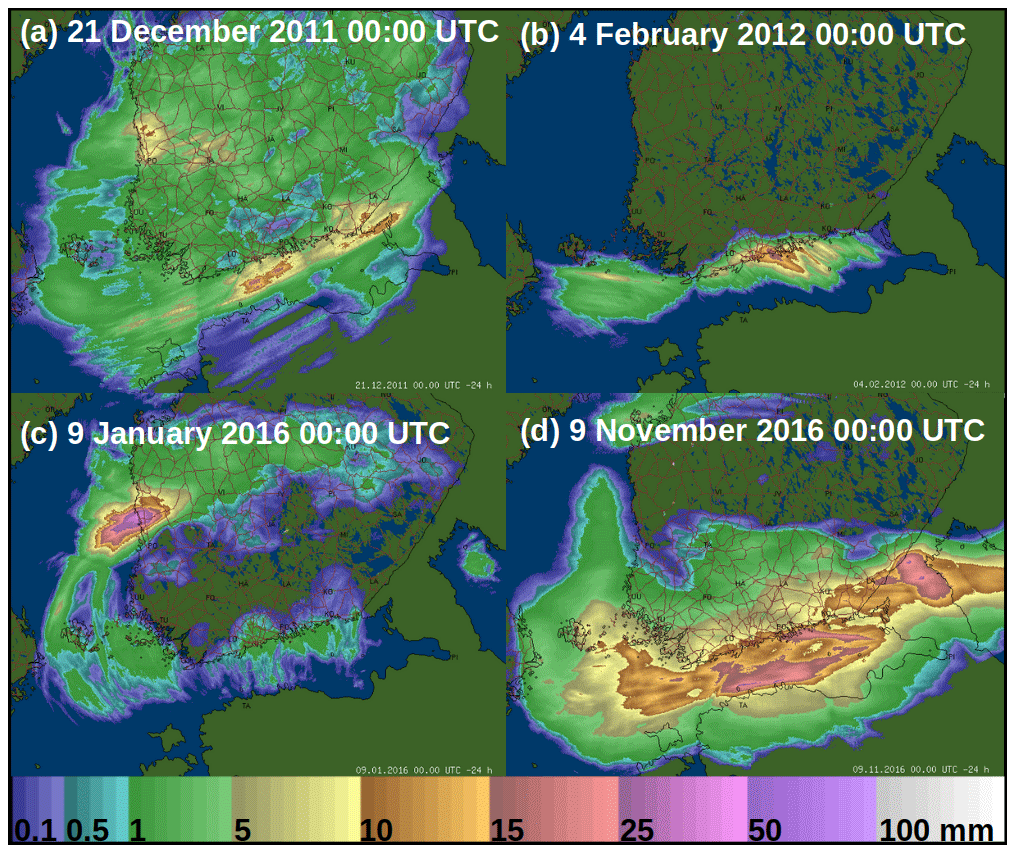
Figure 1Radar images of accumulated precipitation (mm per 24 h−1) during the past 24 h within the four selected cases (A–D, see Table A1 for details). Images from radar service of FMI intranet.
One of the main factors in preventing the occurrence of sea-effect snow bands in Finland is the seasonal sea-ice cover during winter months. The formation of sea-ice cover reduces the heat and moisture fluxes from the sea to the atmosphere, which are essential for the formation of convection. The sea area surrounding Finland is L-shaped and consists of the Gulf of Bothnia in the west, the Gulf of Finland in the south and the Archipelago Sea in the south-west (Fig. 2). In the current climate, the sea usually starts freezing along the northern coast of the Gulf of Bothnia in late November and along the eastern coast of the Gulf of Finland in mid-December. During an average winter all of the near coastal sea areas freeze over. In mild winters (like in 2012 and 2016) a large part of the Gulf of Bothnia can remain open, while the Gulf of Finland is only partially covered by ice. The largest extent of annual sea-ice coverage is usually attained between February and March, while the melting season starts in April. The average ice coverage remains the longest in the northern part of the Gulf of Bothnia with over 180 d, whereas it is the shortest in the Archipelago Sea with just under 20 d (Seinä and Peltola, 1991).
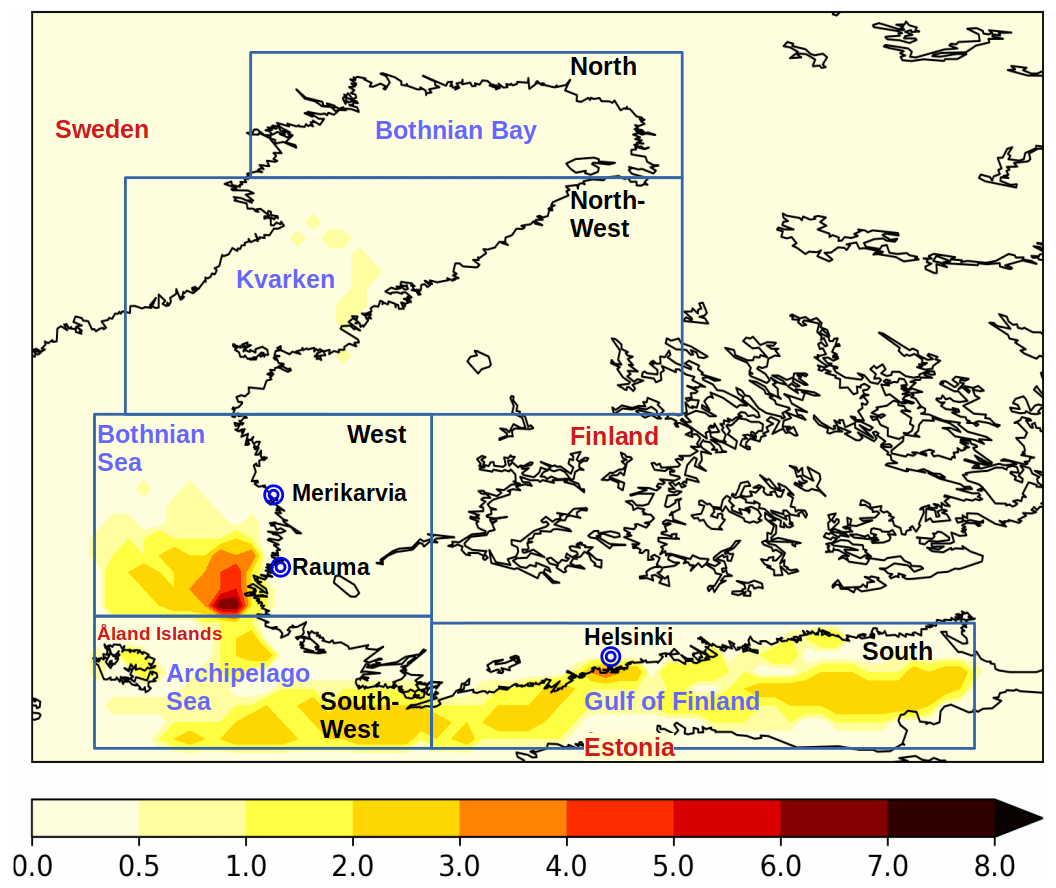
Figure 2Total number of favorable days with a suitable wind direction (Table 1) to bring snowfall to the Finnish coast from 2000–2010 based on RCA4 data. Different areas listed in Table 1 are shown with blue rectangles (south: S, south-west: SW, west: W, north-west: NW, north: N). Sea areas, countries and mentioned cities are also shown.
Altough the surface roughness of ice is similar to that of water, surface temperature differences can vary widely between solid ice cover and areas of unfrozen sea water (Markowski and Richardson, 2010). In previous case studies of convective snow bands over the Baltic Sea area, sensible heat fluxes from the ice-free sea into the atmosphere peaked at around 300–350 W m−2 whereas latent heat fluxes reached 160–230 W m−2 (Jeworrek et al., 2017; Olsson et al., 2018). It has been reported that a large air-water temperature difference is the most important factor triggering instability above open-sea areas. This instability can then enhance the sensible and latent heat fluxes from the sea, which are essential for snowfall (Mazon et al., 2015; Markowski and Richardson, 2010). Consequently, the high possibility for cold air outbreaks from the continent along with an open and relatively warm Baltic Sea makes November the most active month for sea-effect snowfall events (Jeworrek et al., 2017).
Thus, when searching for favorable weather conditions to produce sea-effect snowfall, an important factor is the temperature difference between the open water surface and the 850 hPa atmospheric level (Mazon et al., 2015). The vertical temperature difference should be at least 13 ∘C to exceed the dry adiabatic lapse rate (temperature decrease by 9.8 ∘C km−1), which is a necessary condition for significant sea-effect convection (Markowski and Richardson, 2010). Another crucial factor is the fetch of cold air over open water. The longer the fetch, the larger the heat flux from the sea and more intense the destabilization of the lower atmosphere. The fetch should be at least 75 km (Markowski and Richardson, 2010) to provide suitable time for the air mass to absorb heat and moisture from the water. In idealized cases the ratio between the 10 m wind speed (m s−1) and the fetch over open water (km) should be between 0.02 and 0.09 m s−1 km−1 in order to form cloud bands (Laird et al., 2003). Therefore, the higher the wind speed the longer the required fetch. In addition, convective cloud bands are more likely to occur with a directional wind shear of less than 30∘, although they can still develop if the shear is below 60∘ (Niziol, 1987). Unless the cold air mass extends from the surface to at least 850 hPa, steam fog can develop instead of convective cloud bands. Thus, the boundary layer should be at least 1 km thick to allow for adequate convective cloud growth, which is usually no higher than 4–5 km (Markowski and Richardson, 2010; Niziol et al., 1995).
A set of criteria for conditions favoring convective snow band formation along Swedish coastal areas has been introduced by Jeworrek et al. (2017). These criteria were adopted from previous works by Laird et al. (2003), Niziol et al. (1995), Andersson and Nilsson (1990), Niziol (1987), and Holroyd (1971). Case studies and idealized simulations of snow bands over the Gulf of Finland have been conducted in the past (Savijärvi, 2012; Mazon et al., 2015). However, no statistics of the frequency and intensity of the snow bands affecting the Finnish coast have been published to our knowledge. Neither is there a national weather events database available for our study period which would have collected and stored dates of sea-effect snowfall cases, such as those identified by operational meteorologists. Therefore, this study applies thresholds to relevant meteorological variables in order to detect of a wide range of sea-effect snowfall cases. This allows us to investigate the statistics of the phenomenon.
In this paper, the first objective is to refine the criteria introduced by Jeworrek et al. (2017), in order to make them suitable for detecting sea-effect snow bands that drift towards the Finnish coast. The tuning of the criteria is based on four case study simulations with the convection-permitting numerical weather prediction (NWP) model HARMONIE-AROME. These refined criteria are then applied to detect sea-effect snowfall events from the data of the regional climate model RCA4 for the time period of 2000–2010. The goal is to produce statistics of the frequency and intensity of snow bands affecting the Finnish coast during the 11-year period. Finally, a comparison between the RCA4-based estimates and gridded observational data is made to assess the reliability of the statistics. In addition, weather radar reflectivity images and observations from the lightning location system of Finnish Meteorological Institute (FMI) were used as supplementary data, to provide more information on the detected favorable days.
2.1 Methodology
The criteria introduced by Jeworrek et al. (2017) to detect days favorable for sea-effect snowfall on the Swedish coastline (Table A1) are as follows: 10 m wind speed stronger than 10 m s−1, difference between sea surface temperature (SST) and air temperature at 850 hPa higher than 13 ∘C, 2 m temperature lower than 8 ∘C, wind shear between 700 and 975 hPa less than 60∘, wind direction between 0 and 90∘ (towards the Swedish coast), boundary layer height over 1000 m, and daily snowfall amount at least 1.5 mm (water equivalent). The suitability of these threshold values for Finland were first assessed by means of four case study simulations with the NWP model HARMONIE-AROME. The refined criteria were then applied to output data of the same RCA4 experiment used by Jeworrek et al. (2017). For the evaluation of the RCA4 results, coastal total precipitation events were also identified from the daily gridded climate dataset for Finland (FMIClimGrid), which is based on observations (Aalto et al., 2016; Luomaranta et al., 2019). Radar reflectivity images were used to check the location of snow bands, especially in cases where total precipitation remained mainly over sea areas. As lightning may be associated with convective snow bands, lighting data was also checked within the favorable days.
2.2 Data
2.2.1 Case study events
Four snow band episodes were selected for the case study simulations: (A) 20–23 December 2011, (B) 1–4 February 2012, (C) 8 January 2016, and (D) 2–9 November 2016. These are well known sea-effect snowfall cases that have been confirmed by operational meteorologists as well as by weather radar images (Fig. 1). Case B has previously been examined by Juga et al. (2014), Niemelä (2012) and Mazon et al. (2015), and Case C by Olsson et al. (2017, 2018). It was essential to select cases which were relatively recent, given that the HARMONIE-AROME simulations utilized full volume weather radar scans (Sect. 2.2.2), which were not readily available for earlier time periods for the simulated area. The four events varied in their duration, spatial extent and geographical location (Fig. 1) and were also distinct from one another meteorologically, thus providing a representation of a variety of sea-effect snowfall cases. Although it would be preferable to have a larger number of cases, the model simulations were both time and dataspace consuming making this an unfeasible option in the present study.
2.2.2 HARMONIE-AROME
HARMONIE-AROME is a convection permitting regional NWP model developed by the ALADIN (Seity et al., 2011; Brousseau et al., 2011) and HIRLAM model consortia (Bengtsson et al., 2017). This model is utilized for operational short-range weather forecasts by several European NWP centres, therefore, its performance is continuously monitored vigilantly. As this model includes a full 3D-Var data assimilation system, a wide range of observations can be used to improve the simulations. Assimilated observations in our study included surface synoptic observations, aircraft reports, buoy observations, radiosondes, wind profiler observations and radar reflectivity (Olsson et al., 2018).
The simulations of the four cases (Sect. 2.2.1) were run using the 40h1.1 version of the model. The resolution was 2.5 km horizontally and 65 model levels vertically with the model top at 10 hPa. Boundary conditions were obtained hourly from the global NWP model Integrated Forecasting System (IFS) of the European Centre for Medium-Range Weather Forecasts (ECMWF). The atmospheric processes near the underlying surface were calculated using the surface scheme SURFEX (SURFEX Scientific Documentation, 2018). The analysis cycle with data assimilation was performed every 3 h, while the spin-up time for each case was one week.
2.2.3 RCA4
The Rossby Centre Atmosphere (RCA) model is a regional atmospheric climate model developed by the Rossby Centre of the Swedish Meteorological and Hydrological Institute (SMHI). The RCA model was developed to simulate the atmosphere on climatological timescales and is a hydrostatic model with terrain-following hybrid vertical coordinates and a rotated longitude-latitude grid.
In this paper, we used the hourly output data of the same RCA4 experiment as Jeworrek et al. (2017). The aforementioned experiment simulated the atmosphere over the 11-year time period from 2000 to 2010, with a spin-up time of two months. The domain covered Europe and the horizontal resolution was set to 0.16∘, which approximately corresponds to an 18 km grid spacing with 40 levels in the vertical direction. Initial and lateral conditions for parameters such as ice cover, SST and wind speed were provided to the model every 6 hours by the interpolated ECMWF reanalysis data ERA-40 (Uppala et al., 2005).
The characteristics of the RCA4 experiment perfectly fitted the purposes of this study; The output data were already tested with various sensitivity studies in Jeworrek et al. (2017) and it was readily available.
2.2.4 Observational data
The gridded climate data FMIClimGrid (Aalto et al., 2016) is a dataset based on observations which provides daily values of variables such as snow depth, temperature, and precipitation over land areas of Finland, with a spatial resolution of 10 km × 10 km and for a time period of 1961–2018. Data for wind speed and direction were not included. The dataset is built on observations extracted from national (Finnish Meteorological Institute, FMI) and international (European Climate Assessment & Dataset, ECA & D) – databases (Klok and Klein Tank, 2009). The kriging interpolation method was used for the gridding procedure (Matheron, 1963; Goovaerts, 2000). The effects of geographical location (i.e., the stations' latitudinal and longitudinal position), topography and water bodies (sea and lake effects) were taken into account in the interpolation routine.
The FMIClimGrid dataset was used as reference data for precipitation and accumulated snowfall analyzed from HARMONIE-AROME and RCA4 data on land areas. In addition, weather radar reflectivity images and data collected from the lightning location system of the Finnish Meteorological Institute (FMI) were used as supplementary data, to provide more information on the detected favorable days.
3.1 Case studies
To define the threshold values for meteorological conditions favoring the formation of sea-effect snowfall near the Finnish coast, four well known snow band cases (A–D in Fig. 1) were simulated with the HARMONIE-AROME model. The simulated snowfall amounts and the location of precipitation compared well against both FMIClimGrid data (over land areas only) and weather radar images.
In the beginning of both modelled cases A and B, the simulated 10 m wind blew along the long side of the Gulf of Finland with a relatively high speed (over 12 m s−1). During A the snowfall remained mainly over the sea, given the southwesterly wind direction that was invariably almost parallel to the southern Finnish coast and which never turned directly inland (Figs. 1a and A1a). In B the 10 m wind speed decreased to 7–8 m s−1 when the easterlies turned to become more southerlies, which led to the accumulation of snow over the Helsinki metropolitan area (Figs. 1b and A1b, and see Fig. 2 for the places). In “the Merikarvia case” C, the 10 m wind speed increased towards the coast, peaked (13 m s−1) just before the coastline and resulted in the highest snow accumulation over land areas (Figs. 1c and A1c). The same area near Merikarvia received ∼10 mm d−1 (as liquid water equivalent) in accumulation of snow during case A (Fig. 1a). The highest snowfall amounts remained over the sea in both cases A and D. Throughout the D event a northeasterly wind blew mostly parallel to the coast of the Gulf of Finland with a speed that was mainly over 13 m s−1. This high wind speed and the long fetch along the Gulf of Finland (elongating even to Stockholm and Gotland) enabled an intense snow band to form over the sea (Fig. 1d). The snow band touched the Finnish coastline only at the end of the episode when the wind turned inland (Fig. A1d). A simultaneous lake-effect snowfall over the Lake Ladoga can be seen (Fig. 1d) and the snow bands hampered traffic along the eastern coast of Sweden (Expressen, 2020).
The main characteristics of the simulated atmospheric conditions over the Baltic Sea for the four sea-effect snowfall cases are summarized in Table A1. The values in Table A1 represent the minimal values fulfilled over the corresponding sea area (Gulf of Finland and Bothnian Sea) within the four selected sea-effect snowfall cases. Compared to each other, the cases showed similar properties. In all cases the 10 m wind speed was over 7 m s−1, the wind shear stayed below 30∘ within the snow bands, the difference between the SST and the air temperature at 850 hPa levels exceeded 13 ∘C, and the boundary layer height was distinctly above 1000 m. Due to the L-shape of the Finnish coastline, the favorable wind direction to bring snowfall over land areas varied from easterlies to westerlies.
Based on the simulation results (Table A1) utilizing the threshold values set by Jeworrek et al. (2017) for the wind shear, the vertical temperature difference and the boundary layer height along the Swedish coast are applicable in Finland. It should be noted however that the threshold values needed to be modified slightly for the 10 m wind speed and direction, with the 10 m wind speed threshold decreased to 7 m s−1 (Table 1). This value is lower than the threshold originally presented by Andersson and Nilsson (1990) for severe snow bands (i.e., 10 m s−1) but still higher than the minimal value defined by Markowski and Richardson (2010), below which snowfall is unlikely to be observed inland (i.e., 5 m s−1).
Table 1Used criteria for the selection of days with favorable atmospheric conditions for convective snowfalls. The areas are defined in Fig. 2.

Owing to the shape of the Finnish coastline, sea-effect snowfall can occur with many wind directions, provided that the overlying air mass is cold enough. The coastal zone was divided into five different areas (S, SW, W, NW, N; Table 1) according to the direction the coast is facing (Fig. 2). The thresholds for wind direction deviate between the five considered areas of the Baltic Sea (Table 1, Fig. 2). At the southern coastline (S) the potential wind directions range from easterlies to southwesterlies and at the western coastline (W) from southwesterlies to northwesterlies. Northeasterly wind which would be the most prominent to bring cold air masses to the Baltic Sea, cannot accumulate sea-effect snowfall to the Finnish coast. In the following, we excluded those cases where the wind direction was not favorable to bring snowfall to the Finnish coastline and only consider cases where the wind direction was towards the coast.
Given that the SST is associated with heat fluxes, it is an important factor in triggering instability above water areas. We therefore used a SST higher than 0 ∘C (Table A1) as a threshold instead of a 2 m temperature lower than 8 ∘C (Jeworrek et al., 2017). In summary, through using the detection criteria presented by Jeworrek et al. (2017) as a starting point and taking into account our case-study results (Table A1), we refined the threshold values to detect the atmospheric conditions favoring sea-effect snowfall along the Finnish coasts. The final thresholds chosen in the study are shown in Table 1. It is worth noting that the criteria may detect both smaller-scale entirely convective cases and larger-scale precipitation areas, in which convective sea-effect snow bands are embedded. Both types of sea-effect snowfall may be equally influential for society.
3.2 Sea-effect snowfall in 2000–2010
Favorable days to produce sea-effect snowfall on the Finnish coastline (i.e., favorable days) were detected from RCA4 data using the refined criteria presented in Table 1. In order to consider only relevant situations and to avoid overestimating the number of favorable days in Finland, we considered only days when the wind direction was facing inland.
3.2.1 Frequency of snow bands
Figure 2 displays the total number of favorable days detected in single grid cells during the years 2000–2011. The highest frequency (>6 d in 11 years) of sea-effect snowfall days was found over a rather constricted area in the west, near Rauma. A total of 33 favorable days to form sea-effect snowfall around Finland's sea areas were detected during the study period, most frequently in area S but without large differences between S, SW and W (12–15 d in each, Fig. 3a). The total annual number of snow band days varied from one to seven, with an average of 3 d yr−1. In six detected days the snow band covered large areas or several smaller snow bands occurred in different areas (S, SW and W) on the same day, hence the combined number in Fig. 3a is larger than 33 d. During the simulated 11-year period, only two favorable days (in 2001 and 2006) were detected in area NW and none in area N (Fig. 2). Thus, the emphasis in Figs. 4–6 is focused on S, SW and W.
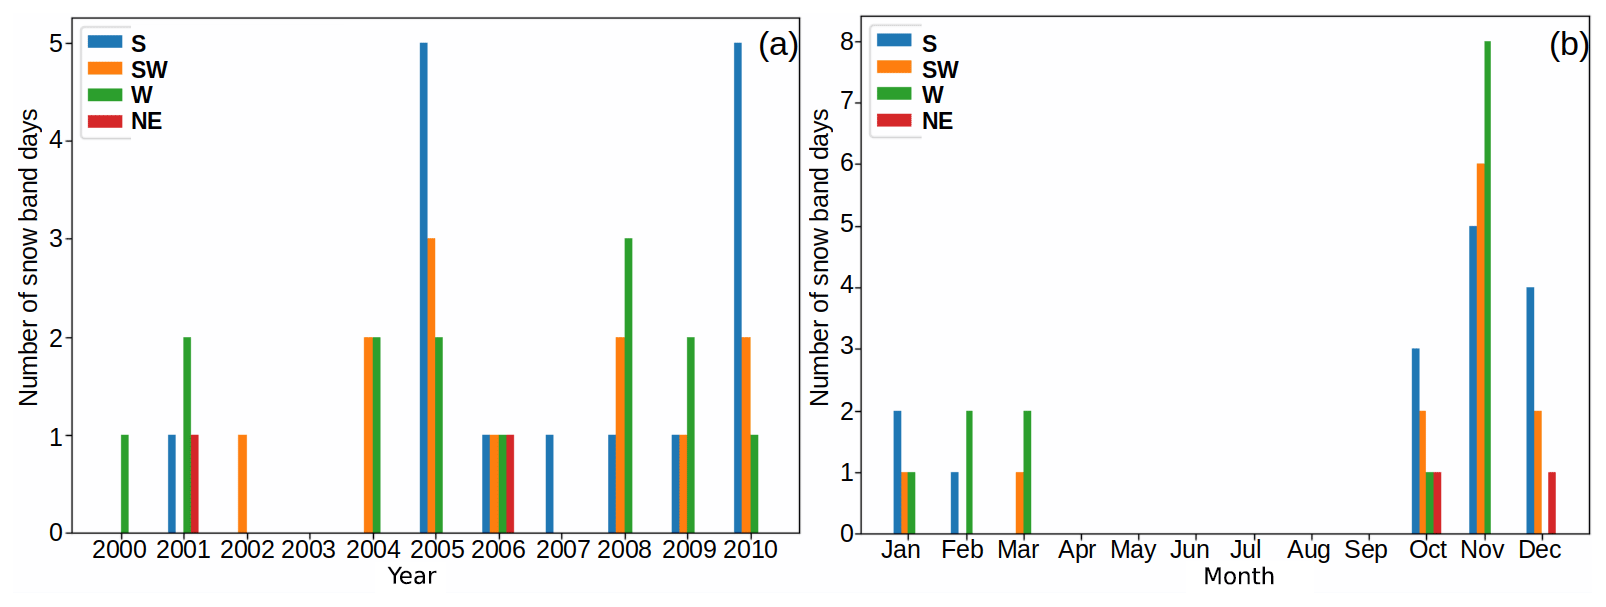
Figure 3Total number of favorable days over the Baltic Sea during 2000–2010 per year (a) and month (b) in the different areas (shown in Fig. 2 and Table 1) based on RCA4 data. Area N is not included as no events were found.
Most of the detected sea-effect snowfall events lasted only 1 d but in five cases the conditions favorable for snow bands lasted for two to four consecutive days. These longer (favorable) periods occurred roughly every second year, on February 2001, November 2004, January 2006, November 2008 and December 2010. If only the successive days were taken into account the longest favorable periods occurred during November 2004 with 3 d and during December 2010 with 4 d. If 1 d separation between the favorable days is allowed for, the longest period occurred on November 2004 with 5 d. On 2001, 2006 and 2008 the favorable conditions lasted two consecutive days.
According to the RCA4 simulation, the most active month to produce favorable conditions for sea-effect snowfall is November (Fig. 3b) especially in W. In addition, the favorable conditions covered larger areas during detected favorable days more often in November compared to the other months. In six occasions of favorable days sea-effect snowfall was identified to occur over a large area. Sea-effect snowfall was detected simultaneously from at least two of the S, SW and W areas during 4 d in November and during 1 d in October and March.
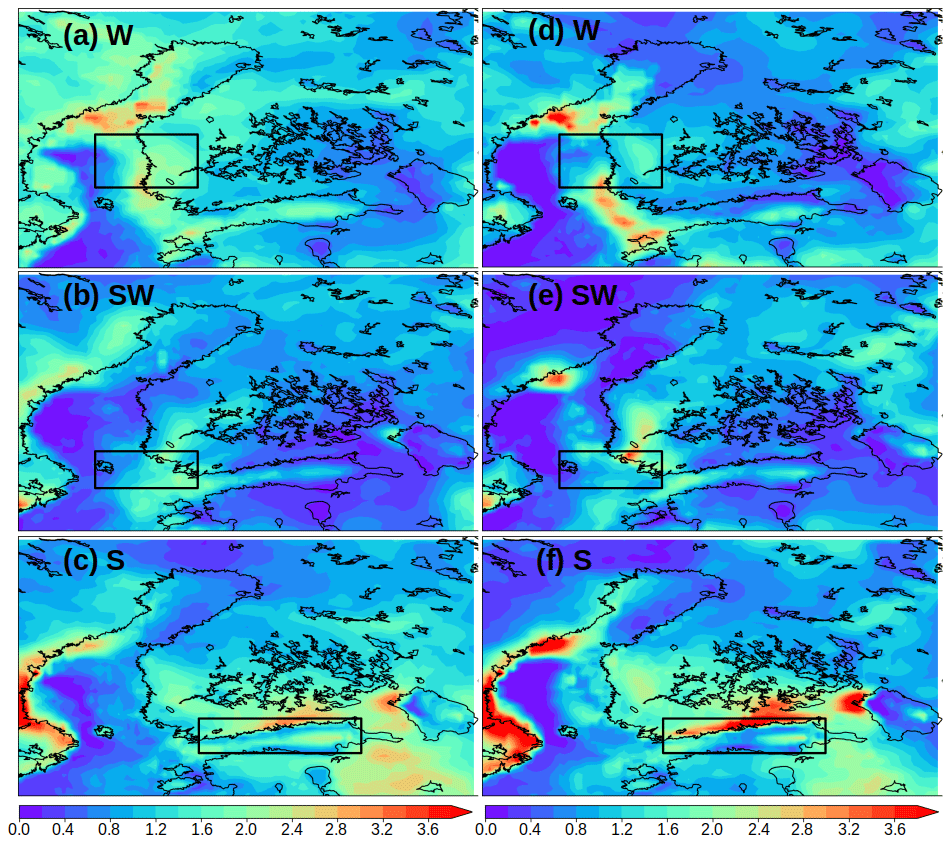
Figure 4Average daily snowfall amount (mm d−1) during 2000–2010 with 10 m wind speed of 7 m s−1 (a-c) and 10 m s−1 (d–f) whenever there were favorable conditions to bring sea-effect snowfall towards the coast in areas W (a, d), SW (b, e) and S (c, f) (as in Fig. 2, Table 1) based on RCA4 data.
3.2.2 Snowfall amounts
The frequency of favorable days was highest in November, and hence that month accounts for the majority of the daily mean snowfall amounts presented in Fig. 4a–c. Daily total snowfall varied between 1.5 and 13 mm d−1 with a mean varying from 2.4 mm d−1 (SW) to 3.4 mm d−1 (S). The snow bands stayed over the sea in approximately half of the detected favorable days in S, SW and W areas. In S the maximum daily snow accumulation was higher in those cases when the snow bands hit the land, compared to cases where the snow bands remained at sea, with 12 and 5 mm d−1 of snow (as liquid water equivalent) respectively. In SW the maximum snow accumulation over land occurred with snow bands perpendicular to the shoreline, whereas shore parallel snow bands remained more often over the sea at the vicinity of the coast, with maximum values of 13 and 8 mm d−1 respectively. In W the snow bands remained over the sea in most of the cases and the maximum daily snow accumulation was 10 mm d−1 over land and sea. In S and SW land areas, the maximum accumulated snowfall was over 5 mm d−1 in a third of the favorable days. In W, values this high were detected during half of the favorable days but those remained over the sea in most of cases. An intense snow band with over 9 mm d−1 of snowfall was experienced four times in S, twice in SW and once in W during 2000–2010. These heavy snowfall days appeared to have a noticeable influence on the daily mean snowfall amounts in Fig. 4a–c.
In NW only two favorable days (in December 2001 and October 2006) were detected. In both cases the maximum snow accumulation was high, at 6.5–8.5 mm d−1. The latter snow band in October 2006 was stereotypical with a long, shore parallel, snow accumulation line over the land, high sea surface temperature (>5 ∘C) and strong (>13 m s−1) northerly winds. The former case in December 2001, was part of a large and heavy precipitation area over Sweden and Finland. In this instance the convection in the unstable boundary layer might have only intensified the precipitation locally over the sea.
In most of the snow bands in S, the simulated snowfall was distributed along the shoreline covering a long shore-parallel area (Fig. 4c and f). In SW, the snow bands were either parallel or perpendicular to the shoreline (Fig. 4e). In many of the shore-parallel cases the snow band was wrapped around the shoreline even from S to W. In W the structure of the snow bands tended to be more varied, yet the area south of Rauma was most often affected (Fig. A3). One factor possibly affecting the flow pattern and snow band structures in W was the Åland islands. This effect was most pronounced during southerly and south-westerly flows by slowing down the 10 m wind speed and affecting the wind direction.
3.2.3 Wind speed and direction of snow bands
The highest daily mean wind speeds at 10 m during the snow band events were simulated over the narrowest area of the Gulf of Finland, as well as over the Bothnian Sea (Fig. A2). The 10 m wind speed mostly exceeded 10 m s−1 when the wind blew parallel to the long side of the gulfs but decreased rapidly near the coast. Most of the snow bands in S occurred with southwesterly winds, compared to in W with northwesterly winds (Fig. 5). For these aforementioned wind directions the 10 m wind speed was also highest compared to other wind directions during the detected favorable days in the corresponding areas. Nevertheless, for S the largest daily snow accumulations (>5 mm d−1) were simulated most often with easterly to southeasterly winds, while in W with westerly winds. In W northwesterly winds were also associated with large daily snow accumulation but these remained over the sea.
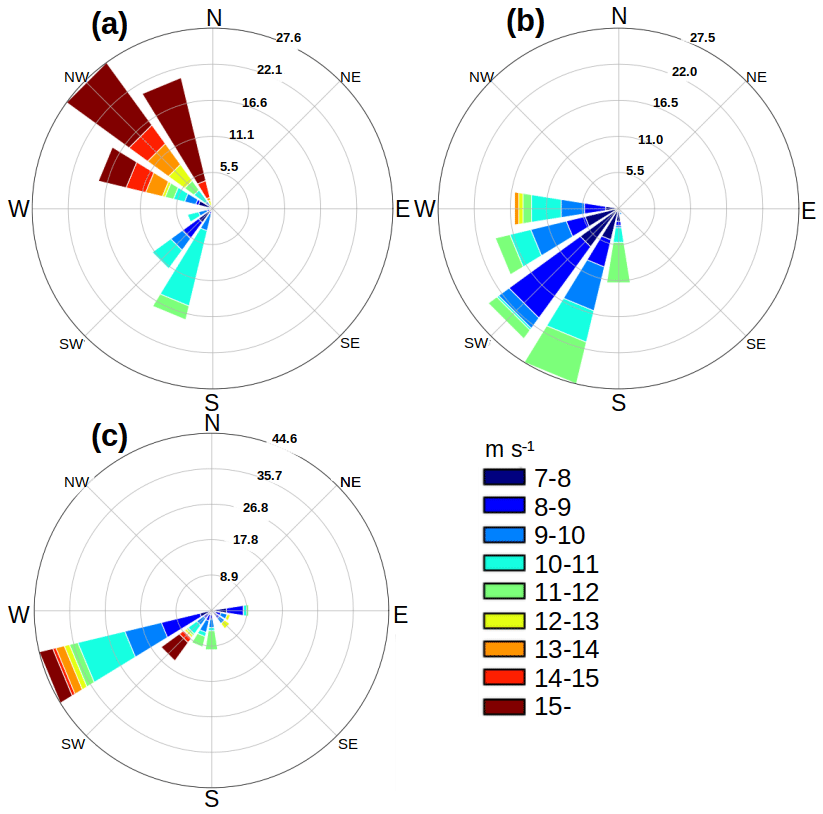
Figure 5Windroses showing the wind direction and 10 m wind speed (m s−1) in the areas W (a), SW (b) and S (c), for the favorable days on the Baltic Sea area during 2000–2010 based on RCA4 data. Colors refer to wind speed (m s−1) and the number on the circles to the frequency (%) of a wind component relative to all wind components during favorable days in the considered area.
To study the effect of 10 m wind speed on the average snowfall amount, a threshold of 10 m s−1 was also used to detect the favorable days, and the results were compared to the ones obtained by applying the reference threshold of 7 m s−1 (Fig. 4d–f). In the Gulf of Finland the 10 m wind speed could easily exceed 10 m s−1 when the wind blew parallel to the long axis of the Gulf, but it weakened rapidly if the wind turned shoreward. When the threshold for 10 m wind speed was kept at 7 m s−1, there were 33 favorable days (Sect. 3.2.1) with a well-known sea-effect snowfall case detected in January 2006 (Savijärvi, 2012). When the threshold value for 10 m wind speed was increased to 10 m s−1, the number of detected favorable days decreased to 15. This corresponded with seven favorable days in S, 5 d in SW, 7 d in W and 1 d NW, as favorable conditions could occur over large areas over the course of 1 d.
While the 10 m s−1 wind speed criterion reduced the total days of sea-effect snowfall, it increased the mean accumulated snowfall when compared to the 7 m s−1 threshold (Fig. 4). With a threshold of 7 m s−1 (10 m s−1), the snowfall maxima ranged from less than 5 mm d−1 (for both thresholds) over sea areas to about 10 mm d−1 (14 mm d−1) at places over S and SW coastal land areas. In only some regions, such as the land area in W (Fig. 4a and d), the lower 10 m wind speed corresponded to a larger average snowfall amount. Although the maximum daily snow accumulation was the highest with strongest winds, four favorable days in S and SW and two favorable days in W with notable snowfall amount (4–8 mm d−1) were not detected with a higher 10 m wind speed threshold.
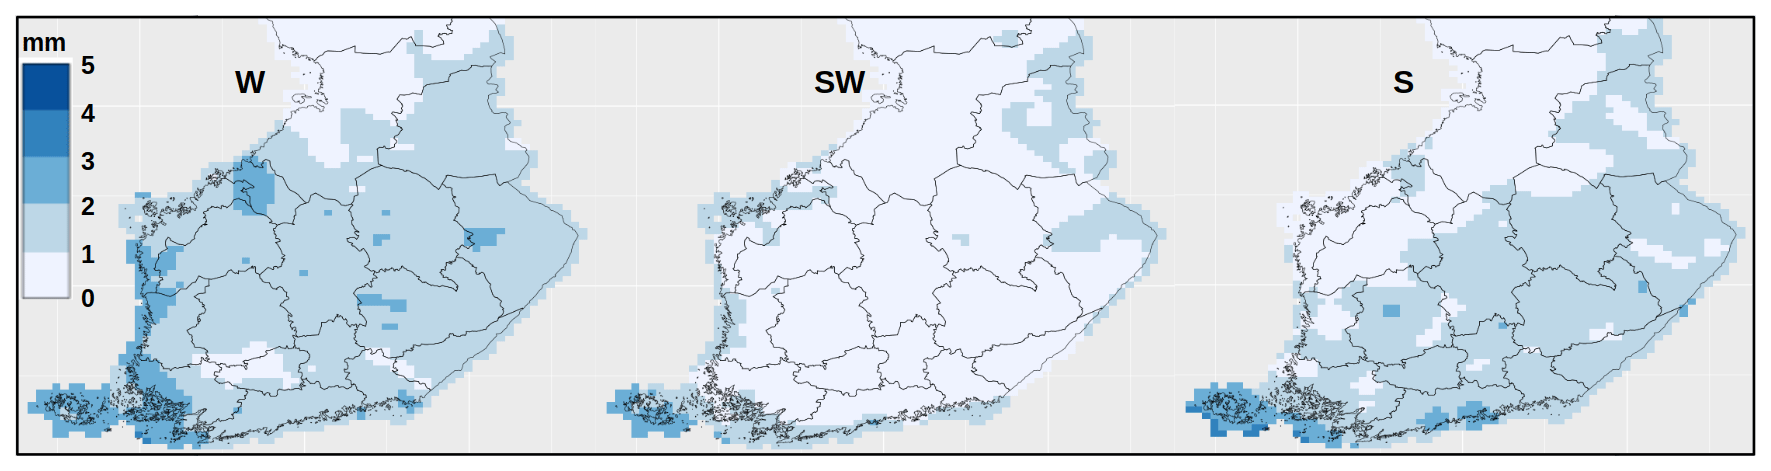
Figure 6Average daily precipitation amount (mm d−1) from FMIClimGrid data during 2000–2010 whenever there were favorable conditions to bring sea-effect snowfall towards coast in W, SW and S areas (as in Fig. 4a–c). The average daily precipitation was calculated without the event on 30 November 2005 (Sect. 3.3).
When considering the most prolonged simulated duration of favorable atmospheric conditions, the duration was longer with the higher 10 m wind speed threshold compared to the lower wind speed threshold. During the 3 (to 5) d long case in November 2004 (Sect. 3.2.1), favorable conditions for snow bands were detected over SW and W with strong (>13 m s−1) northwesterly winds. In December 2010, favorable conditions lasted 4 d in S with slightly weaker (8–13 m s−1) southeasterly winds. In January 2006 the 2 d lasting snow band in S was detected only with the threshold of 7 m s−1, although the 10 m wind speed was greater than 11 m s−1 over the sea. This was related to the location of the snowfall. In cases where the main snowfall area was located over land the wind speed often decreased to below 10 m s−1, resulting in the snow bands being undetected when utilizing the higher wind speed threshold. During 2 d periods in February 2001 and November 2008, the wind speed was also below 10 m s−1 over sea areas and thus the cases were detected only when employing the lower wind speed threshold.
3.3 Comparison to observations in 2000–2010
In order to validate the model results for the detected snow band days, the simulated total precipitation amounts were compared with the observations provided by the FMIClimGrid data. The comparison of the detected favorable days during the period between 2000–2010 could be performed only over the land, given that the FMIClimGrid data does not cover sea areas. In addition, the FMIClimGrid data does not discern snow and rain amounts but rather provides the daily total precipitation amounts.
In approximately half of the simulated snow bands the maximum precipitation area remained over the sea. Because it was challenging to assess precipitation amounts and location of those cases from the FMIClimGrid data, we considered a snow band to be accurately simulated if the total precipitation occurred on a similar scale and near the observed location during the considered day.
During 23 out of the total 33 favorable snow band days, RCA4 was able to closely capture the location and the order of magnitude of the observed total precipitation amount over land (Fig. 6). During six out of the remaining ten favorable days, the locations of the simulated and observed precipitation over land were distinctly different or no snowfall was actually observed from FMIClimGrid data, although simulated. Within the rest four favorable days the snow band was simulated to stay over the sea, consistent with the fact that no precipitation was observed over land in FMIClimGrid data. Since the location and the magnitude of precipitation over the sea could not be validated with FMIClimGrid data, simulated precipitation areas were also compared to radar reflectivity images. Precipitation was observed from radar images over the sea near the RCA simulated location in all the favorable days, although the location was not always well represented.
During most of the favorable days the total precipitation amounts were relatively well simulated, with a difference of ±4 mm d−1 compared to observations. The amounts found to be lower than 10 mm d−1 were the most closely reproduced. The highest precipitation rates (>10 mm d−1) among the 33 favorable days were equally common in RCA4 and FMIClimGrid data but did not necessarily occur during the same snow band events. The maximum observed total precipitation amounts within the detected sea-effect snowfall dates ranged from 10 mm d−1 (from S to NW areas), to up to 41 mm d−1 (in S area). In the RCA4 data, the maximum total precipitation over land ranged from 11 mm d−1 (from S to NW areas), to up to 24 mm d−1 (in SW area). In comparison, the simulated maximum daily snowfall was 12–13 mm d−1 in S and SW areas, while it was found to be 8–10 mm d−1 elsewhere (excluding the N area).
The location of the observed heaviest precipitation of 41 mm d−1 (30 November 2005) was different between FMIClimGrid (inland in S) and RCA4 (mostly over sea in SW) data but both were perpendicular to the coast in the southwest to northeast direction (Fig. A4). Although the simulated precipitation area associated with the snow band did not enter as far inland as was observed, the area over the sea corresponded well with radar reflectivity images. The snow band was highly convective; FMI's lightning location system (Mäkelä et al., 2014) observed a total of 160 lightning strokes between 00:00–12:00 UTC (02:00–14:00 LT – local time) along the snow band (Fig. A4). The amount of lightning was relatively large considering the time of the year. Although unusual in Finland, such a large number of lightning can still develop in late November if atmospheric conditions favor convection (Mäkelä et al., 2013). Lightning was observed during 11 favorable days over the Baltic Sea area. Most of the lighting events occurred in October (3 d) and November (6 d), while fewer lighting events occurred in December (1 d) and March (1 d).
The event on 30 November 2005 was distinctly the most intense when compared among the rest of the studied favorable days. The mean daily precipitation in Fig. 6 is therefore calculated without this anomaly in order to not interfere with other daily precipitation amounts, which would have resulted in no other structures for the precipitation areas to be observable. With this exclusion, the highest values were up to 25 mm d−1 which corresponded well with the simulated highest values of up to 24 mm d−1.
The snow band cases which lasted several days in November 2004, January 2006, November 2008 and December 2010 (Fig. A5) were well simulated with respect to location and total precipitation. During the 2 d period in 2001, the simulated total precipitation occurred in a different location than the observations, but the accumulated total precipitation corresponded well to the observed value of 4–5 mm d−1. The two favorable days simulated in NW in December 2001 and October 2006 were well represented with respect to the location, but the total precipitation amount was underestimated by RCA4 data (8 and 11 mm d−1, respectively) compared to FMIClimGrid data (21 and 24 mm d−1, respectively). The snowfall event on March 2005 (mentioned in Sect. 1) was not detected from RCA4 data as it was related to an approaching warm front and the Gulf of Finland was ice covered and thus did not fulfill the criteria for a favorable day. In addition, the known snow band case on 15 December 2009 (Kämäräinen, 2012) was not detected, as the wind direction was mainly northerly over the Gulf of Finland.
The main objectives of this work were (i) to define a set of criteria which allows the detection of sea-effect snowfall on the Finnish coast from climate model data and (ii) to produce statistics of the frequency and intensity of the phenomenon for a recent 11-year period. To meet the first objective, four well known sea-effect snowfall cases were simulated with the NWP model HARMONIE-AROME to gain information on atmospheric conditions favoring coastal snow band formation in Finland. Results from the case studies were used to modify the detection criteria presented by Jeworrek et al. (2017) for convective snow bands along the east coast of Sweden. Based on the assessment of the detection criteria we set the threshold for 10 m wind speed to 7 m s−1, which is lower than the generally assumed threshold value of 10 m s−1. Using the refined criteria, we studied the frequency and intensity of sea-effect snowfall along the Finnish coastline with hourly RCA4 output from years 2000–2010. The observed precipitation amounts on the detected favorable days were then extracted from the daily gridded climate dataset for Finland (FMIClimGrid) and used as reference data for land areas. In addition, radar reflectivity images and lightning location data provided supplementary information.
A total of 33 favorable days for the development of convective snow bands were detected from the RCA4 output. The snow bands were simulated to most frequently affect two relatively restricted regions along the western (W) and southern (S) coasts of Finland, with one to the south of Rauma and the other to the east of Helsinki. A high frequency of favorable days in W was expected, given that the previous national records on daily snowfall amount were observed in that area. Over land areas in W, the largest snow accumulations occurred with moderate (<10 m s−1) westerly winds, while stronger northwesterly winds resulted in snow bands remaining over the sea, in the vicinity of the coast. Most of the favorable days in S were detected with southwesterly winds. This was somewhat unexpected as the air masses coming from this direction are usually too warm. Nevertheless, the largest daily snow accumulations along the southern coast were detected with easterly winds. In addition, the snow bands detected with southwesterly winds remained more often over the sea in S.
The refined criterion of 7 m s−1 for the 10 m wind speed appeared to have a large impact on the frequency of the favorable days and average snowfall amount. The analysis of the detected favorable days indicated that the refined threshold led to an improvement in the representation of the frequency of snow bands. While the commonly used wind speed criterion of 10 m s−1 reduced the total days of sea-effect snowfall by half, it resulted in an increased mean of accumulated snowfall when compared to the lower threshold. The largest daily snowfall accumulations were associated with a higher 10 m wind speed (>10 m s−1), yet many weaker (4–8 mm d−1) snowfall events were missed if the higher wind speed threshold was used. Nevertheless, the frequency of weaker sea-effect snowfall is of some importance, as even moderate amounts of daily snowfall may cause serious problems for coastal traffic, communications and critical infrastructure, as was the case in Helsinki in February 2012 (Sect. 1).
It is worth noting that the refined detection criteria for Finland may not be applicable to other meteorological datasets (such as reanalyses or regional climate models). Besides the wind speed criterion discussed above, the horizontal resolution of the meteorological data strongly affects the detection of snow bands. The data used should have a horizontal grid scale ≤ 20 km in order to sufficiently resolve the observed precipitation and circulation patterns for convective snowfall (Hjelmfelt and Braham, 1983). Jeworrek et al. (2017) found that the increased horizontal resolution resulted in improved model performance, especially when concerning the 10 m wind speeds. Moreover, the detection criteria should be validated separately for each different study area, to ensure that the thresholds allow for identification of the well-known past snow band cases at a minimum.
The results of the statistics in the frequency and intensity of snow bands are affected by some limitations: the small number of case studies (4) utilized to modify the detection criteria for Finland, the relatively short time period (2000–2011) compared to climatological time scales which typically consists of 30 years, and the small amount of detected days (33) favoring the formation of sea-effect snowfall. While it would be difficult to increase the number of case studies for the reasons explained in Sect. 2.2.1, a longer time period will be considered, in order to extend the number of favorable days for a larger statistics. Nevertheless, compared to the gridded observational climate data FMIClimGrid, the location and timing of the snow bands were relatively well simulated with the refined lower wind speed threshold when the daily total precipitation was under 10 mm d−1. Higher daily precipitation values (>10 mm d−1) were equally frequent in most land areas, although these occurred on different days in the RCA4 and FMIClimGrid data. Radar images indicated precipitation over the sea near the RCA simulated locations in all of the favorable days, although this was not in exactly the same location. In addition, lightning strokes were observed during 11 favorable days over the Baltic Sea area.
The next step is to study a longer time series, which would preferably cover the two previous record breaking snowfalls on the western coast of Finland on 21 November 1971 (50 cm d−1 in Rauma) and 8 January 2016 (73 cm d−1 in Merikarvia). This would be beneficial to increase the statistics and, thus, the understanding of these extreme events in Finland. For the assessment of climate change impacts on sea-effect snowfall, it would be beneficial to validate model-based statistics on historical time periods, before use in estimating future changes. With a changing climate, the ice-covered season in the Baltic Sea is expected to become shorter in the future (IPCC, 2019; Luomaranta et al., 2014). This could increase the frequency or intensity of the sea-effect snowfall in the Baltic Sea region by extending the time period in which convective snow bands can form. In addition, wintertime precipitation amounts are expected to increase (IPCC, 2019), yet at the same time a smaller share of snowfall compared to rainfall is expected in a warming climate (Dieterich et al., 2019; Luomaranta et al., 2019). However, since easterly and northerly wind directions might become less frequent in the autumn and winter over the future Baltic sea (Ruosteenoja et al., 2019), the large-scale conditions might become less favorable for snow bands. Based on simple physical reasoning it is therefore difficult to predict the future evolution of sea-effect snowfall, but careful analysis of climate model data is needed.
Table A1The minimum atmospheric conditions fulfilled over the Baltic Sea within the four selected sea-effect snowfall cases (A–D) based on HARMONIE simulations. In addition, the thresholds defined in Jeworrek et al. (2017) are shown.
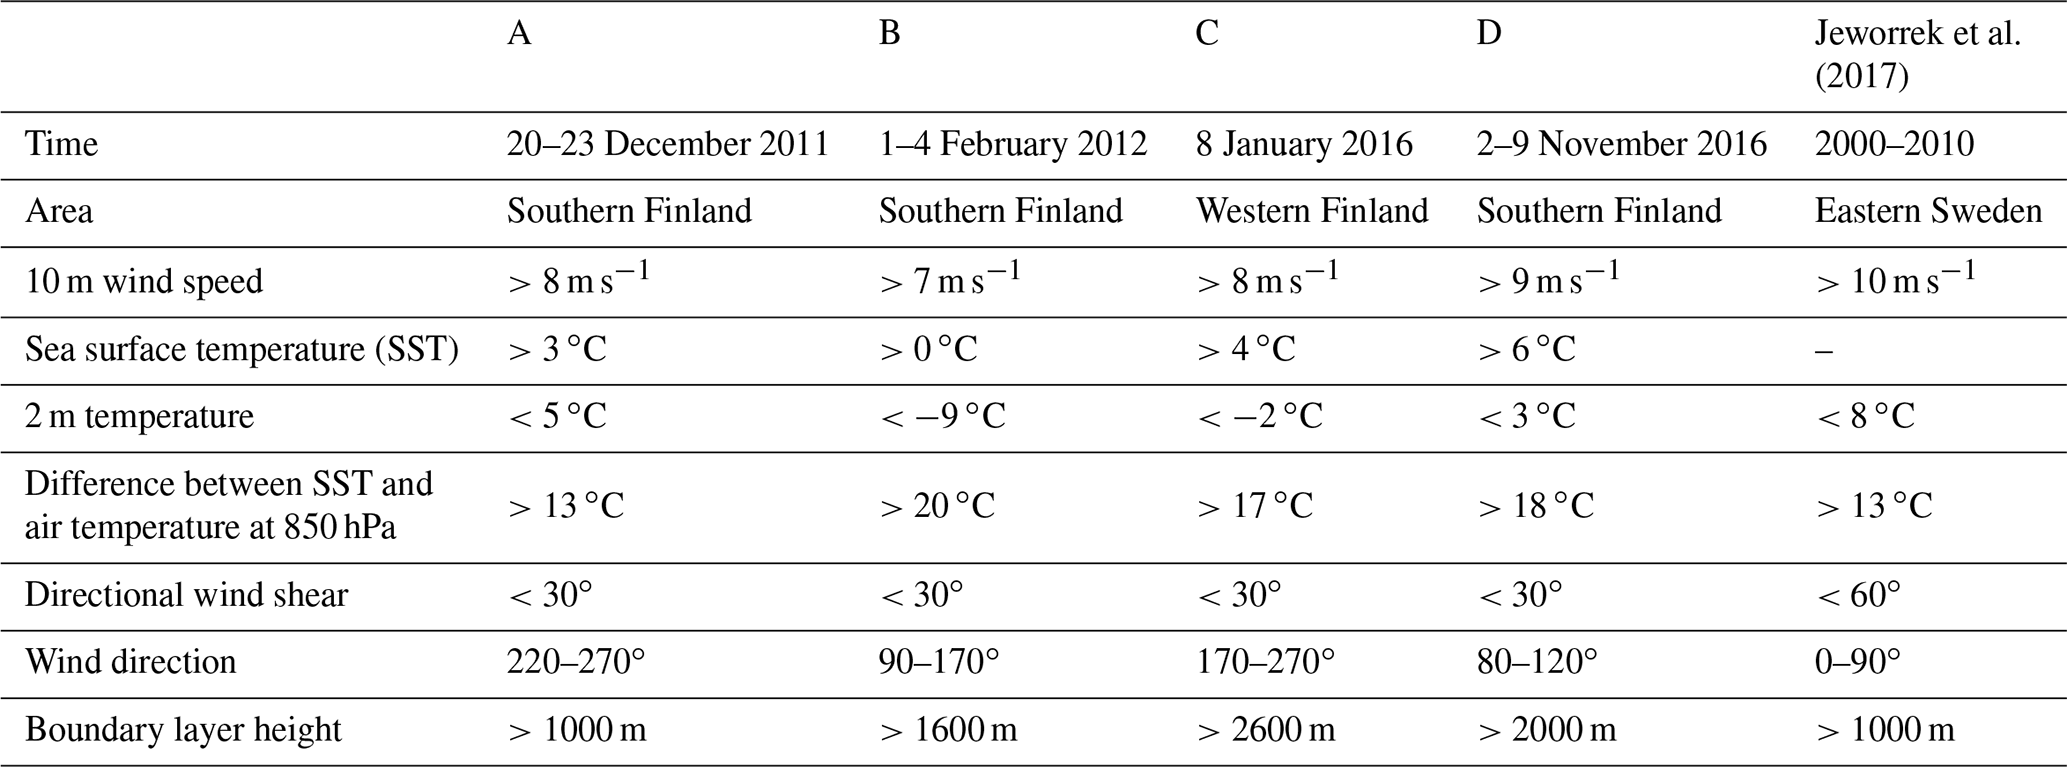
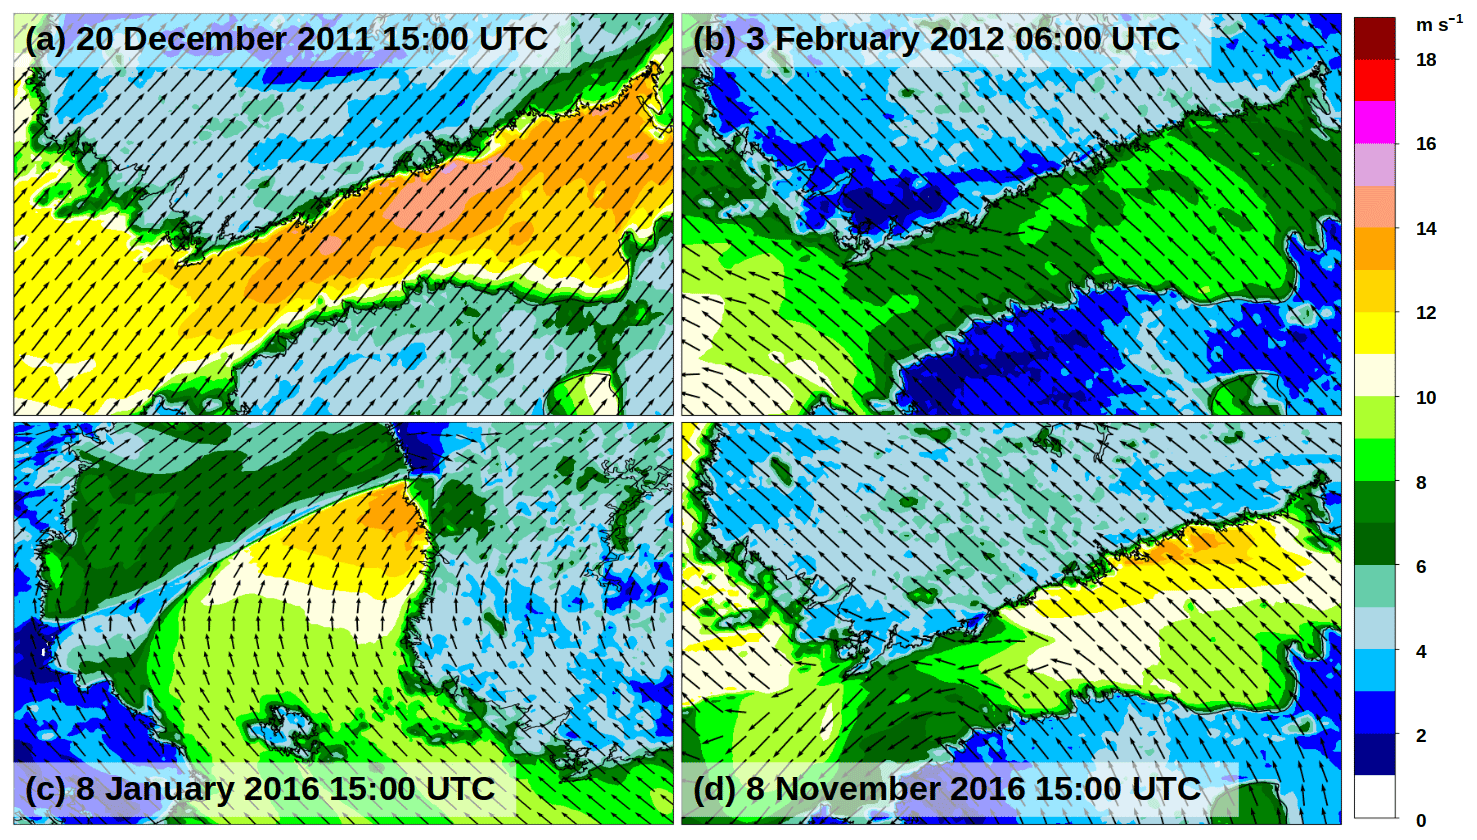
Figure A110 m wind speed (colors) and 900 hPa wind direction (arrows) during the selected snow band cases, A–D, when the snowfall was over land areas as simulated with HARMONIE-AROME. The wind arrows are normalized to same lengths. (a), (b) and (d) observes southern Finland and (c) observes western Finland.
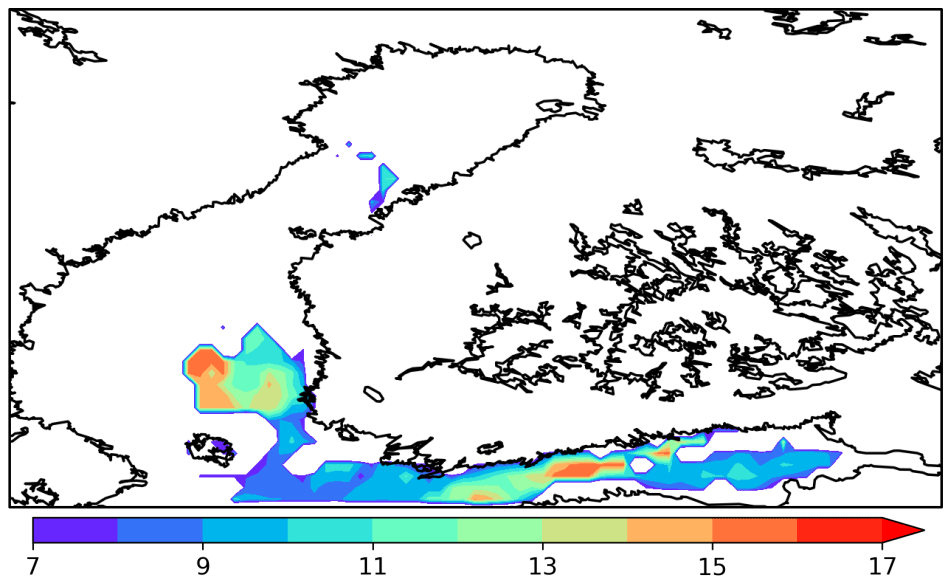
Figure A2The mean 10 m wind speed (m s−1) within the detected snow bands in the Baltic Sea area during 2000–2010 based on RCA4 data.

Figure A3Precipitation on 26 February 2006 from different databases. (a) Accumulated snowfall from RCA4 (mm d−1), (b) total precipitation from RCA4 (mm d−1), (c) total precipitation from FMIClimGrid (mm d−1), (d) radar reflectivity factor (dBZ) image at 13:00 UTC.
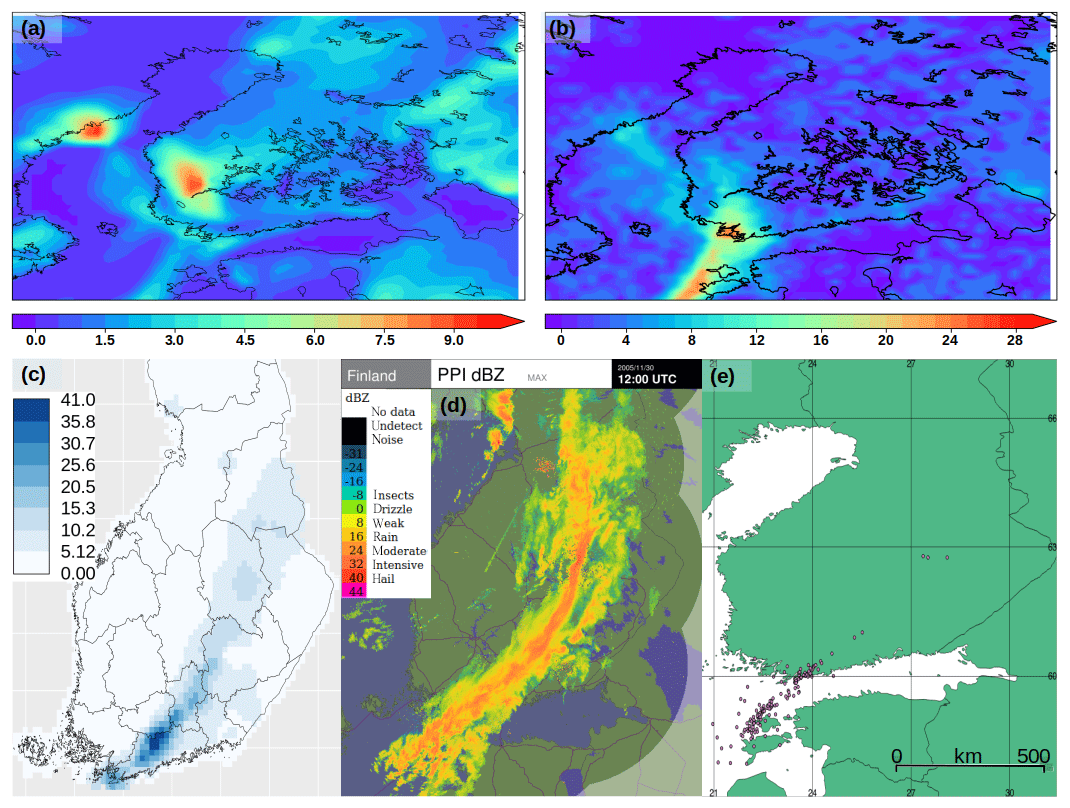
Figure A4Precipitation in 30 November 2005 from different databases. (a) Accumulated snowfall from RCA4 (mm d−1), (b) total precipitation from RCA4 (mm d−1), (c) total precipitation from FMIClimGrid (mm d−1), (d) radar reflectivity factor (dBZ) image at 12:00 UTC. (e) Located lightning strokes on 30 November 2005. In the map, a total of 160 strokes.

Figure A5Precipitation in 19 December 2010 from different databases. (a) Accumulated snowfall from RCA4 (mm d−1), (b) total precipitation from RCA4 (mm d−1), (c) total precipitation from FMIClimGrid (mm d−1), (d) radar reflectivity factor (dBZ) image at 11:00 UTC.
The RCA4 data used in this study can be acquired by contacting the corresponding author. The source code of the HARMONIE-AROME model is not publicly available. Daily gridded climate data, FMIClimGrid, can be downloaded from https://avaa.tdata.fi/web/paituli/latauspalvelu (last access: 16 June 2020) (Aalto et al., 2020). FMI's OpenData including lightning location data: https://en.ilmatieteenlaitos.fi/open-data (last access: 16 June 2020) (Finnish Meteorological Institute, 2020). Full list of detected favorable days with daily total precipitation images from RCA4 and FMIClimGrid data together with radar reflectivity factor images and lightning location data will be available at ZENODO repository https://doi.org/10.5281/zenodo.3872892 (Olsson et al., 2020).
TO did the formal analysis and investigation of the RCA4, HARMONIE-AROME and FMIClimGrid data. TO prepared the original draft of the manuscript with contributions from all co-authors. AL did the formal analysis of the FMIClimGrid data and wrote the data description as well as contributed to review and editing of the manuscript. KJ did the review and editing of the manuscript and was responsible for the project administration, supervision and funding acquisition. JJ contributed advice in methodology, conceptualization and writing and reviewing the manuscript. TP performed the HARMONIE-AROME simulations and wrote the model description. CD contributed advice in methodology, conceptualization and writing and reviewing the manuscript. LW provided the RCA4 data and contributed to writing and reviewing the manuscript. AR contributed to supervision and reviewing the manuscript. AM provided the lighting information.
The authors declare that they have no conflict of interest.
This article is part of the special issue “19th EMS Annual Meeting: European Conference for Applied Meteorology and Climatology 2019”. It is a result of the EMS Annual Meeting: European Conference for Applied Meteorology and Climatology 2019, Lyngby, Denmark, 9–13 September 2019.
We acknowledge MSc. Jouni Vainio and MSc. Anni Montonen (FMI) for the support and guidance given with ice-coverage data and Ilari Lehtonen (FMI) for the guidance concerning meteorological situation in 30 November 2005. We are grateful for the two anonymous referees for their constructive comments.
This research has been supported by the Finnish State Nuclear Waste Management Fund (grant nos. Dnro SAFIR 8/2019 and SAFIR 6/2020).
This paper was edited by Dario Giaiotti and reviewed by two anonymous referees.
Aalto, J., Pirinen, P., and Jylhä, K.: New gridded daily climatology of Finland: Permutation-based uncertainty estimates and temporal trends in climate, J. Geophys. Res.-Atmos., 121, 3807–3823, https://doi.org/10.1002/2015JD024651, 2016.
Aalto, J., Pirinen, P., and Jylhä, K.: FMIClimGrid, Finnish Meteorological Institute, available at: https://avaa.tdata.fi/web/paituli/latauspalvelu, last access: 16 June 2020.
Andersson, T. and Nilsson, S.: Topographically induced convective snowbands over the Baltic Sea and their precipitation distribution, Weather Forecast., 5, 299–312, 1990.
Bengtsson, L., Andrae, U., Aspelien, T., Batrak, Y., Calvo, J., de Rooy, W., Gleeson, E., Hansen-Sass, B., Homleid, M., Hortal, M., Ivarsson, K.-I., Lenderink, G., Niemelä, S., Nielsen, K. P., Onvlee, J., Rontu, L., Samuelsson, P., Muñoz, D. S., Subias, A., Tijm, S., Toll, V., Yang, X., and Ødegaard Køltzow, M.: The HARMONIE–AROME Model Configuration in the ALADIN–HIRLAM NWP System, Mon. Weather Rev., 145, 1919–1935, https://doi.org/10.1175/MWR-D-16-0417.1, 2017.
Brousseau, P., Berre, L., Bouttier, F., and Desroziers, G.: Background-error covariances for a convective-scale data-assimilation system: AROME–France 3D-Var, Q. J. Roy. Meteorol. Soc., 137, 409–422, https://doi.org/10.1002/qj.750, 2011.
Dieterich, C., Gröger, M., Jeworrek, J., Jylhä, K., Kjellström, E., Meier, M., Olsson, T., Wu, L., Rutgersson, A.: Baltic Earth Workshop on Climate projections and uncertainties in the northern Baltic Sea region. Helsinki, Finland, 19–20 November 2019, International Baltic Earth Secretariat Publication No. 16, 38 pp., available at: https://www.baltic-earth.eu/publications/ibesp.html, last access: 28 November 2019.
Expressen: Värsta snöovädret I November på 111 år, 9 November 2016, available at: https://www.expressen.se/nyheter/smhi-varsta-ovadret-i-stockholm-pa-111-ar/, last access: 18 April 2020.
Finnish Meteorological Institute: Open Data (updates every 5-minutes), available at: https://en.ilmatieteenlaitos.fi/open-data, last access: 16 June 2020.
Goovaerts, P.: Geostatistical approaches for incorporating elevation into the spatial interpolation of rainfall, J. Hydrol., 228, 113–129, 2000.
Groenemeijer, P., Becker, N., Djidara, M., Gavin, K., Hellenberg, T., Holzer, A. M., Juga, I., Jokinen, P., Jylhä, K., Lehtonen, I., Mäkelä, H., Morales Napoles, O., Nissen, K., Paprotny, D., Prak, P., Púčik, T., Tijssen, L., and Vajda, A.: Past Impacts of Extreme Weather Impact on Critical Infrastructure in Europe (List of Past Cases). RAIN – Risk Analysis of Infrastructure Networks in Response to Extreme Weather, D2.2, April 2015, available at: http://rain-project.eu/wp-content/uploads/2015/11/D2.2-Past-Cases-final.compressed.pdf (last access: January 2020), 2015.
Groenemeijer, P., Vajda, A., Lehtonen, I., Kämäräinen, M., Venäläinen, A., Gregow, H., Becker, N., Nissen, K., Ulbrich, U., Morales Nápoles, O., Paprotny, D., and Púčik, T.: Present and future probability of meteorological and hydrological hazards in Europe. RAIN – Risk Analysis of Infrastructure Networks in Response to Extreme Weather, D2.5, May 2016, available at: http://rain-project.eu/wp-content/uploads/2016/09/D2.5_REPORT_final.pdf (last access: January 2020), 2016.
Hjelmfelt, M. R. and Braham, R. R.: Numerical Simulation of the Airflow over Lake Michigan for a Major Lake-Effect Snow Event, Mon. Weather Rev., 111, 205–219, https://doi.org/10.1175/1520-0493(1983)111<0205:NSOTAO>2.0.CO;2, 1983.
Holroyd, E. W.: Lake-Effect Cloud Bands as Seen From Weather Satellites, J. Atmos. Sci., 28, 1165–1170, https://doi.org/10.1175/1520-0469(1971)028<1165:LECBAS>2.0.CO;2, 1971.
IPCC – Intergovernmental Panel on Climate Change: IPCC Special Report on the ocean and cryosphere in a changing climate, available at: https://www.ipcc.ch/report/srocc/ (last access: 16 June 2020), 2019.
Jeworrek, J., Wu, L., Dieterich, C., and Rutgersson, A.: Characteristics of convective snow bands along the Swedish east coast, Earth Syst. Dynam., 8, 163–175, https://doi.org/10.5194/esd-8-163-2017, 2017.
Juga, I., Hippi, M., Moisseev, D., and Saltikoff, E.: Analysis of weather factors responsible for the traffic `BlackDay' in Helsinki, Finland, on 17 March 2005, Meteorol. Appl., 19, 1–9, https://doi.org/10.1002/met.238, 2012.
Juga, I., Hippi, M., Nurmi, P., and Karsisto, V.: Weather factors triggering the massive car crashes on 3 February 2012 in the Helsinki metropolitan area, in: Proceedings of the 17th SIRWEC conference, La Massana, Andorra, 2014.
Jylhä, K., Kämäräinen, M., Fortelius, C., Gregow, H., Helander, J., Hyvärinen, O., Johansson, M., Karppinen, A., Korpinen, A., Kouznetsov, R., Kurzeneva, E., Leijala, U., Mäkelä, A., Pellikka, H., Saku, S., Sandberg, J., Sofiev, M., Vajda, A., Venäläinen, A., and Vira, J.: Recent meteorological and marine studies to support nuclear power plant safety in Finland, Energy, 165, 1102–1118, https://doi.org/10.1016/j.energy.2018.09.033, 2018
Kämäräinen, M.: Järvi-ilmiön yhteydessä esiintyvät mesoskaalapyörteet ja niiden mallintaminen, Kandidaatin tutkielma, Meteorologia, 3. joulukuuta 2012, Fysiikan laitos, Helsingin yliopisto, 2012.
Keskinen, A.: Lumilogistiikan tehostaminen kaupungeissa (Enhanced snow removal logistics in suburban areas), Diplomityö, Aalto-yliopisto, Yhdyskunta- ja ympäristötekniikka, Espoo, kieli: suomi, available at: https://aaltodoc.aalto.fi/bitstream/handle/123456789/6106/master_keskinen_anna_2012.pdf;sequence=1 (last access: 16 June 2020), 2012.
Klok, E. and Klein Tank, A.: Updated and extended European dataset of daily climate observations, Int. J. Climatol., 29, 1182–1191, https://doi.org/10.1002/joc.1779, 2009.
Laird, N. F., Kristovich, D. A. R., and Walsh, J. E.: Idealized Model Simulations Examining the Mesoscale Structure of Winter Lake-Effect Circulations, Mon. Weather Rev., 131, 206–221, https://doi.org/10.1175/1520-0493(2003)131<0206:IMSETM>2.0.CO;2, 2003.
Luomaranta, A., Ruosteenoja, K., Jylhä, K., Gregow, H., Haapala, J., and Laaksonen, A.: Multimodel estimates of the changes in the Baltic Sea ice cover during the present century, Tellus A, 66, 22617, https://doi.org/10.3402/tellusa.v66.22617, 2014.
Luomaranta, A., Aalto, J., and Jylhä, K.: Snow cover trends in Finland over 1961–2014 based on gridded snow depth observations, Int J. Climatol., 7, 3147–3159, https://doi.org/10.1002/joc.6007, 2019.
Mäkelä, A., Saltikoff, E., Julkunen, J., Juga, I., Gregow, E., and Niemelä, S.: Cold-Season Thunderstorms in Finland and Their Effect on Aviation Safety, B. Am. Meteorol. Soc., 94, 847–858, https://doi.org/10.1175/BAMS-D-12-00039.1, 2013.
Mäkelä, A., Enno S.-E., and Haapalainen, J.: Nordic Lightning Information System: Thunderstorm climate of Northern Europe for the period 2002–2011, Atmos. Res., 139, 46–61, https://doi.org/10.1016/j.atmosres.2014.01.008, 2014.
Markowski, P. and Richardson, Y.: Mesoscale Meteorology in Midlatitudes, John Wiley & Sons, Ltd, 407 pp. 2010.
Matheron, G.: Principles of geostatistics, Econ. Geol., 58, 1246–1266, 1963.
Mazon, J., Niemelä, S., Pino, D., Savijärvi, H., and Vihma, T.: Snow bands over the Gulf of Finland in wintertime, Tellus A, 67, 25102, https://doi.org/10.3402/tellusa.v67.25102, 2015.
Niemelä S.: Winter-time convection – a heavy snowfall case in Southern Finland, in: Hirlam Newsletter, The joint HIRLAM All Staff Meeting 2012 and ALADIN 22st Workshop, 7–10 May 2012, Marrakech, Morocco, 21–26, available at: http://www.hirlam.org/index.php/publications-54/hirlam-newsletters-a (last access: 16 June 2020), 2012.
Niziol, T. A.: Operational forecasting of lake effect snowfall in western and central New York, Weather Forecast., 2, 310–321, 1987.
Niziol, T. A., Snyder, W. R., and Waldstreicher, J. S.: Winter weather Forecasting throughout the Eastern United States. Part IV: Lake Effect Snow, Weather Forecast., 10, 61–77, 1995.
Norris, J., Vaughan, G., and Schultz, D. M.: Snowbands over the English Channel and Irish Sea during cold–air outbreaks, Q. J. Roy. Meteorol. Soc., 139, 1747–1761, https://doi.org/10.1002/qj.2079, 2012.
Ohtake, H., Kawashima, M., and Fujiyosh, Y.: The formation mechanism of a thick cloud band over the northern part of the Sea of Japan during cold air outbreaks, J. Meteorol. Soc. Jpn., 87, 289–306, https://doi.org/10.2151/jmsj.87.289, 2009.
Olsson, T., Perttula, T., Jylhä, K., and Luomaranta, A.: Intense sea-effect snowfall case on the western coast of Finland, Adv. Sci. Res., 14, 231–239, https://doi.org/10.5194/asr-14-231-2017, 2017.
Olsson, T., Post, P., Rannat, K., Keernik, H., Perttula, T., Luomaranta, A., Jylhä, K., Kivi, R., and Voormansik, T.: Sea-effect snowfall case in the Baltic Sea region analysed by reanalysis, remote sensing data and convection-permitting mesoscale modelling, Geophysica, 53, 65–91, 2018.
Olsson, T., Luomaranta, A., Jylhä, K., Jeworrek, J., Perttula, T., Dieterich, C., Wu, L., Rutgersson, A., and Mäkelä, A.: Sea-effect snowfall in Finland, zenodo, https://doi.org/10.5281/zenodo.3872892, 2020.
Ruosteenoja, K., Vihma, T., and Venäläinen, A.: Projected Changes in European and North Atlantic Seasonal Wind Climate Derived from CMIP5 Simulations, J. Climate, 32, 6467–6490, https://doi.org/10.1175/JCLI-D-19-0023.1, 2019.
Savijärvi, H.: Cold air outbreaks over high-latitude sea gulfs, Tellus A, 64, 12244, https://doi.org/10.3402/tellusa.v64i0.12244, 2012.
Seinä, A. and Peltola, J.: Jäätalven kestoaika ja kiintojään paksuustilastoja merialueilla 1961–1990/Duration of the ice season and statistics of fast ice thickness along the Finnish coast 1961–1990, No. 258, Finnish Marine Research, Helsinki, 46 pp., 1991.
Seity, Y., Brousseau, P., Malardel, S., Hello, G., Bénard, P., Bouttier, F., Lac, C., and Masson, V.: The AROME-France Convective-Scale Operational Model, Mon. Weather Rev., 139, 976–991, https://doi.org/10.1175/2010MWR3425.1, 2011.
SURFEX Scientific Documentation: SURFEX V7.3, available at: http://www.cnrm.meteo.fr/surfex/spip.php?rubrique11 (last access: 16 June 2020), 2018.
Uppala, S. M., Kållberg, P. W., Simmons, A. J., Andrae, U., Bechtold, V. D. C., Fiorino, M., Gibson, J. K., Haseler, J., Hernandez, A., Kelly, G. A., Li, X., Onogi, K., Saarinen, S., Sokka, N., Allan, R. P., Andersson, E., Arpe, K., Balmaseda, M. A., Beljaars, A. C. M., Van De Berg, L., Bidlot, J., Bormann, N., Caires, S., Chevallier, F., Dethof, A., Dragosavac, M., Fisher, M., Fuentes, M., Hagemann, S., Hólm, E., Hoskins, B. J., Isaksen, L., Janssen, P. A. E. M., Jenne, R., Mcnally, A. P., Mahfouf, J.-F., Morcrette, J.-J., Rayner, N. A., Saunders, R. W., Simon, P., Sterl, A., Trenberth, K. E., Untch, A., Vasiljevic, D., Viterbo, P., and Woollen, J.: The ERA-40 re-analysis, Q. J. Roy. Meteorol. Soc., 131, 2961–3012, https://doi.org/10.1256/qj.04.176, 2005.