 | 30 Jul 2021
Evaluation of wind speed estimates in reanalyses for wind energy applications
Sebastian Brune
Jan D. Keller
Sabrina Wahl
A correct spatio-temporal representation of retrospective wind speed estimates is of large interest for the wind energy sector. In this respect, reanalyses provide an invaluable source of information. However, the quality of the various reanalysis estimates for wind speed are difficult to assess. Therefore, this study compares wind measurements at hub heights from 14 locations in Central Europe with two global (ERA5, MERRA-2) and one regional reanalysis (COSMO-REA6). Employing metrics such as bias, RMSE and correlation, we evaluate the performance of the reanalyses with respect to (a) the local surface characteristics (offshore, flat onshore, hilly onshore), (b) various height levels (60 to 200 m) and (c) the diurnal cycle.
As expected, we find that the reanalyses show the smallest errors to observations at offshore sites. Over land, MERRA-2 generally overestimates wind speeds, while COSMO-REA6 and ERA5 represent the average wind speed more realistically. At sites with flat terrain, ERA5 correlates better with observations than COSMO-REA6. In contrast, COSMO-REA6 performs slightly better over hilly terrain, which can be explained by the higher horizontal resolution. In terms of diurnal variation, ERA5 outperforms both other reanalyses. While the overestimation of MERRA-2 is consistent throughout the day, COSMO-REA6 significantly underestimates wind speed at night over flat and hilly terrain due to a misrepresentation of nightly low level jets and mountain and valley breezes. Regarding the representation of downtime of wind turbines due to low/high wind speeds, we find that MERRA-2 is consistently underperforming with respect to the other reanalyses. Here COSMO-REA6 performs better over the ocean, while ERA5 shows the best results over land.
- Article
(3163 KB) - Full-text XML
-
Supplement
(66 KB) - BibTeX
- EndNote


A sound knowledge of relevant climatological parameters is essential in advancing the transition towards renewable energies. For the wind power production, retrospective information on spatio-temporal representations of wind speed are of large interest for the transition towards renewable energies and the accompanying ongoing expansion of the wind energy sector. Here, a focus is on strategic planning and risk assessment where these information are a basis for planning new wind power parks, estimating future requirements to the power supply mixture or the potential demands on power transmission providers.
While the measurement density at ground level in Europe is high and well captured by numerical weather prediction models (Kaiser-Weiss et al., 2015), there are only very few measurements at hub heights of wind turbines. Continuous and reliable measurements of wind speed in up to 200 meters above ground can be carried out by large measuring towers which are not feasible for widespread use. Another possibility is the employment of lidars. However, due to costs these are mostly employed in the context of temporary measurements campaigns, e.g., Macke et al. (HOPE, 2017) or Wulfmeyer et al. (LAFE, 2018). Further, the quality of wind speed estimates from lidars depends among other things on the choice of the carrier-to-noise ratio (Gryning and Floors, 2019). Other possible sources of wind data have shown to be of inferior quality such as the observations at installed wind turbines (St. Martin et al., 2017) or the ICOS (Rehman, 2014) mast measurements as the location of the anemometers are subject to shadowing effects. Useful long-term observation time series of wind speed are therefore only available at very few locations.
An alternative to observational data is given by high-resolution reanalyses that cover periods of several decades and provide a physically consistent representation of the atmosphere. An overview of the applications of reanalyses in the field of renewable energies can be found in Kaspar et al. (2020). Borsche et al. (2016) and Frank et al. (2020b) compare wind speed data from meteorological masts in Central Europe with global reanalyses such as ERA-20C, ERA-Interim and MERRA-2 as well as the regional reanalysis COSMO-REA6. Jourdier (2020) evaluate several reanalyses using wind mast data in France, Ramon et al. (2019) compare the Tall Tower Dataset (Ramon et al., 2020) with global reanalyses. All these studies show that reanalyses can be an important additional data source for the wind energy sector, but small-scale phenomena of the boundary layer such as the low level jet or local effects are not satisfyingly described by the reanalyses.
In contrast to previous studies, this study is based on a larger number of measurement sites as representations for the “true” state. Specifically, we use measurements from the Tall Tower Dataset, the mast observations analysed in Frank et al. (2020b), two lidar observations provided by the Danish company Orsted as well as five additional observation sites from BayWa r.e. Wind Gmbh made exclusively available to us. Furthermore, we are looking at hourly wind speed values and include the most recent global reanalysis ERA5, while some of the aforementioned studies focus on an analysis of three-hourly data and mostly use ERA-Interim. In particular, we are looking at hourly data in the time period 2014 to 2019 and analyse the performance of the regional reanalyses COSMO-REA6 and the two global reanalyses MERRA-2 and ERA5. We look at the results at eight different height levels relevant for wind power turbines and for three different surface characteristics (offshore, flat and hilly) in Central Europe. Due to the higher number of observation sites and the higher temporal resolution, we are able to investigate also wind speed extremes (such as calm or strong winds) which pose risks to the power production, e.g., turbine shutdowns.
This article is structured as follows. In the data and methods section we describe the wind speed measurements as well as the reanalyses MERRA-2, ERA5 and COSMO-REA6. Then we present our methods regarding horizontal, vertical and temporal matching of observation and reanalyses. The results section starts with a short overview of the data for three selected observation sites. For a more thorough analysis, we calculate common metrics such as bias, root-mean-squared error and correlation from the data and with that, also analyse the diurnal cycle. We then take a closer look at the performance of the reanalyses in the range of the cut-in and cut-out speed of wind turbines. We conclude with a short summary and additional remarks.
Our study area covers Central Europe and parts of the North Sea and Baltic Sea, since here, in addition to the global reanalyses ERA5 and MERRA-2, the spatially higher-resolution regional reanalysis COSMO-REA6 and a satisfactory number of measurements are available. We choose an investigation period of about five years from January 2014 to August 2019. While observations are available after that date, it marks the end of production of the current version of COSMO-REA6. In the following, the measurements and reanalyses are explained in detail.
2.1 Measurements
An overview of all observation locations is given in Fig. 1. BayWa r.e. Wind GmbH shares four lidar measurements (B1 … B4) and one mast observation (B5) exclusively with the German national meteorological service (Deutscher Wetterdienst, DWD) within the FAIR project (Frank et al., 2020a). The observations were commissioned for the planning of wind farms and cover a period of half a year up to one year with a temporal resolution of 10 min. Ramon et al. (2020) collected worldwide data from measuring masts and published the Tall Tower Dataset. The raw observation data undergoes a total of 18 different quality checks, which filter out errors and inconsistencies. However, the only tower with measurements at relevant heights inside the period of interest is located in Lindenberg (T1). The third data set consists of three offshore research platforms in the North Sea and Baltic Sea (FINO)1 with measurement levels up to 100 m. All three measurement series cover the investigation period with 10 min resolution. The Danish company Orsted2 shares 10 min lidar measurements at the Anholt offshore wind farm (O1) and Westermost Rough offshore wind farm (O2). In addition, we also use the mast data as described in Frank et al. (2020b) in Cabauw (C1, Van Ulden and Wieringa, 1996), Hamburg (C2, Brümmer et al., 2012) and Karlsruhe (C3, Kohler et al., 2018). Details on the observation sites are provided in Table 1.
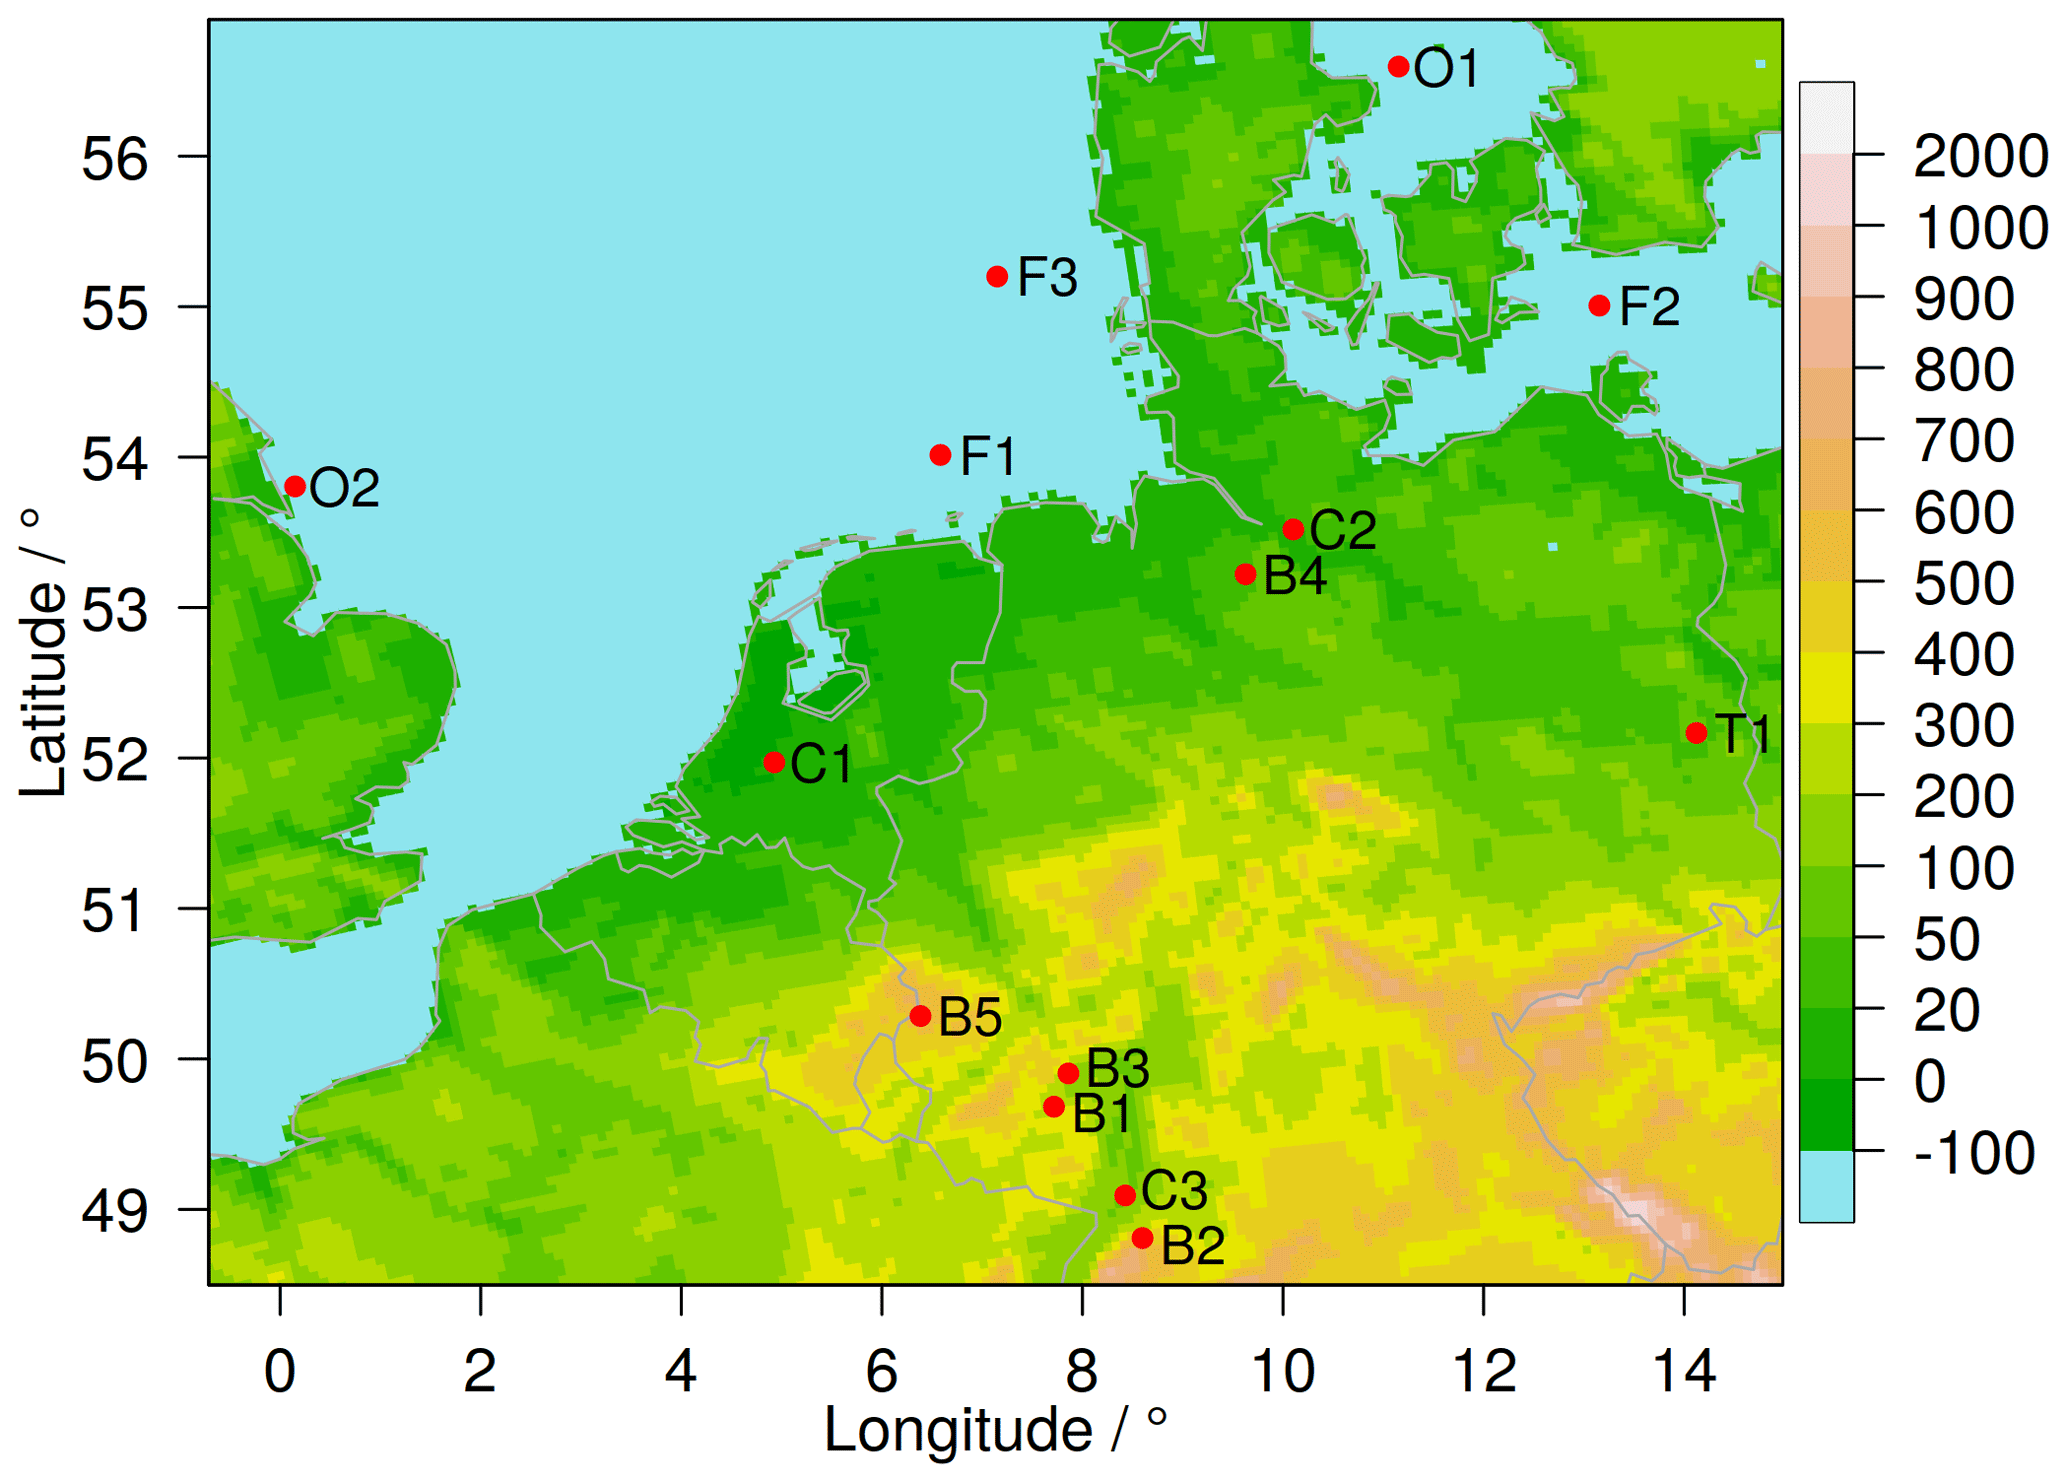
Figure 1Measurement sites of BayWa r.e. (B1 … B5), masts used in Frank et al. (2020b) (C1 … C3), FINO (F1 … F3), Orsted (O1, O2) and Tall Tower Dataset (T1). Colors in the background show COSMO-REA6 topography.
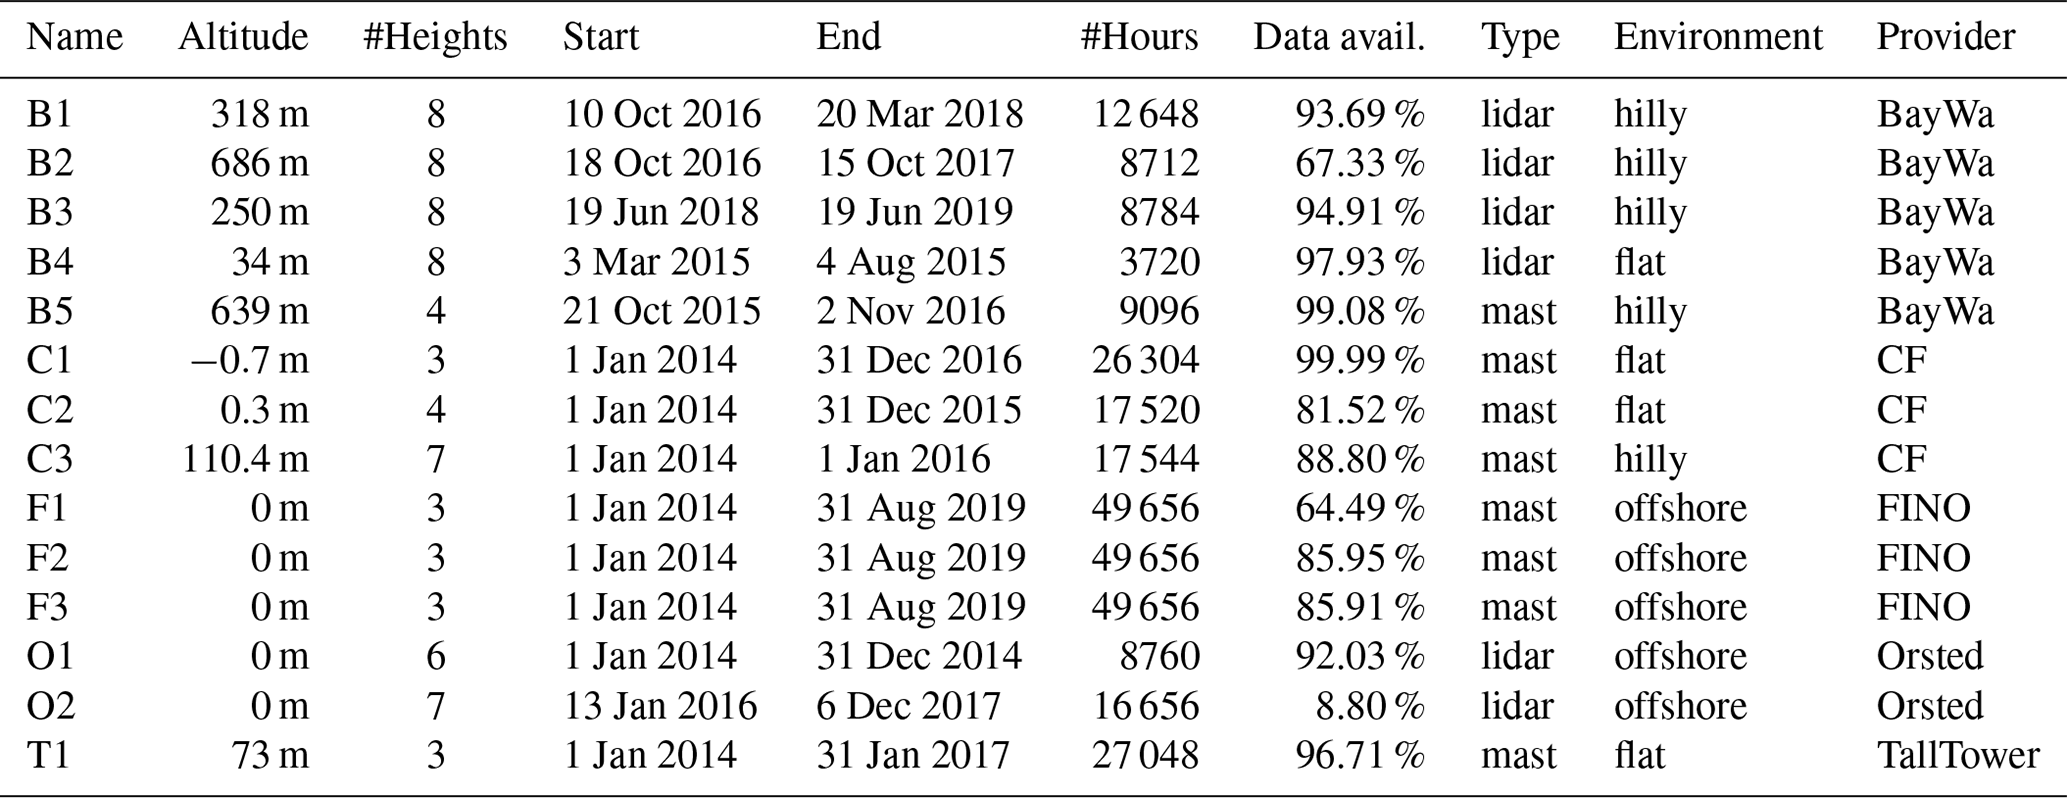
Table 1Details of the 14 different measurement sites used in this study.
2.2 Reanalyses
We use two global reanalyses, namely NASA's MERRA-2 (Gelaro et al., 2017) and ECMWF's ERA5 (Hersbach et al., 2020) as well as DWD's regional reanalysis COSMO-REA6 (Bollmeyer et al., 2015) developed by the Hans-Ertel-Centre for Weather Research (Simmer et al., 2016). The horizontal resolution is approximately 50 and 30 km for MERRA-2 and ERA5, respectively. The regional reanalysis COSMO-REA6 covers Europe with a grid spacing of 6.2 km. In the vertical, both global reanalyses are based on a pressure-dependent representation, i.e., an eta vertical coordinate system, while COSMO-REA6 has a height-based terrain-following vertical coordinate. Figure 2 shows the (average) heights where reanalysis data is available compared to the heights of the observation sites. The vertical resolution of ERA5 is highest in the lowest levels, while MERRA-2 output is given only on three model levels (approximately 60, 190, 320 m) and a fixed height of 10 m.
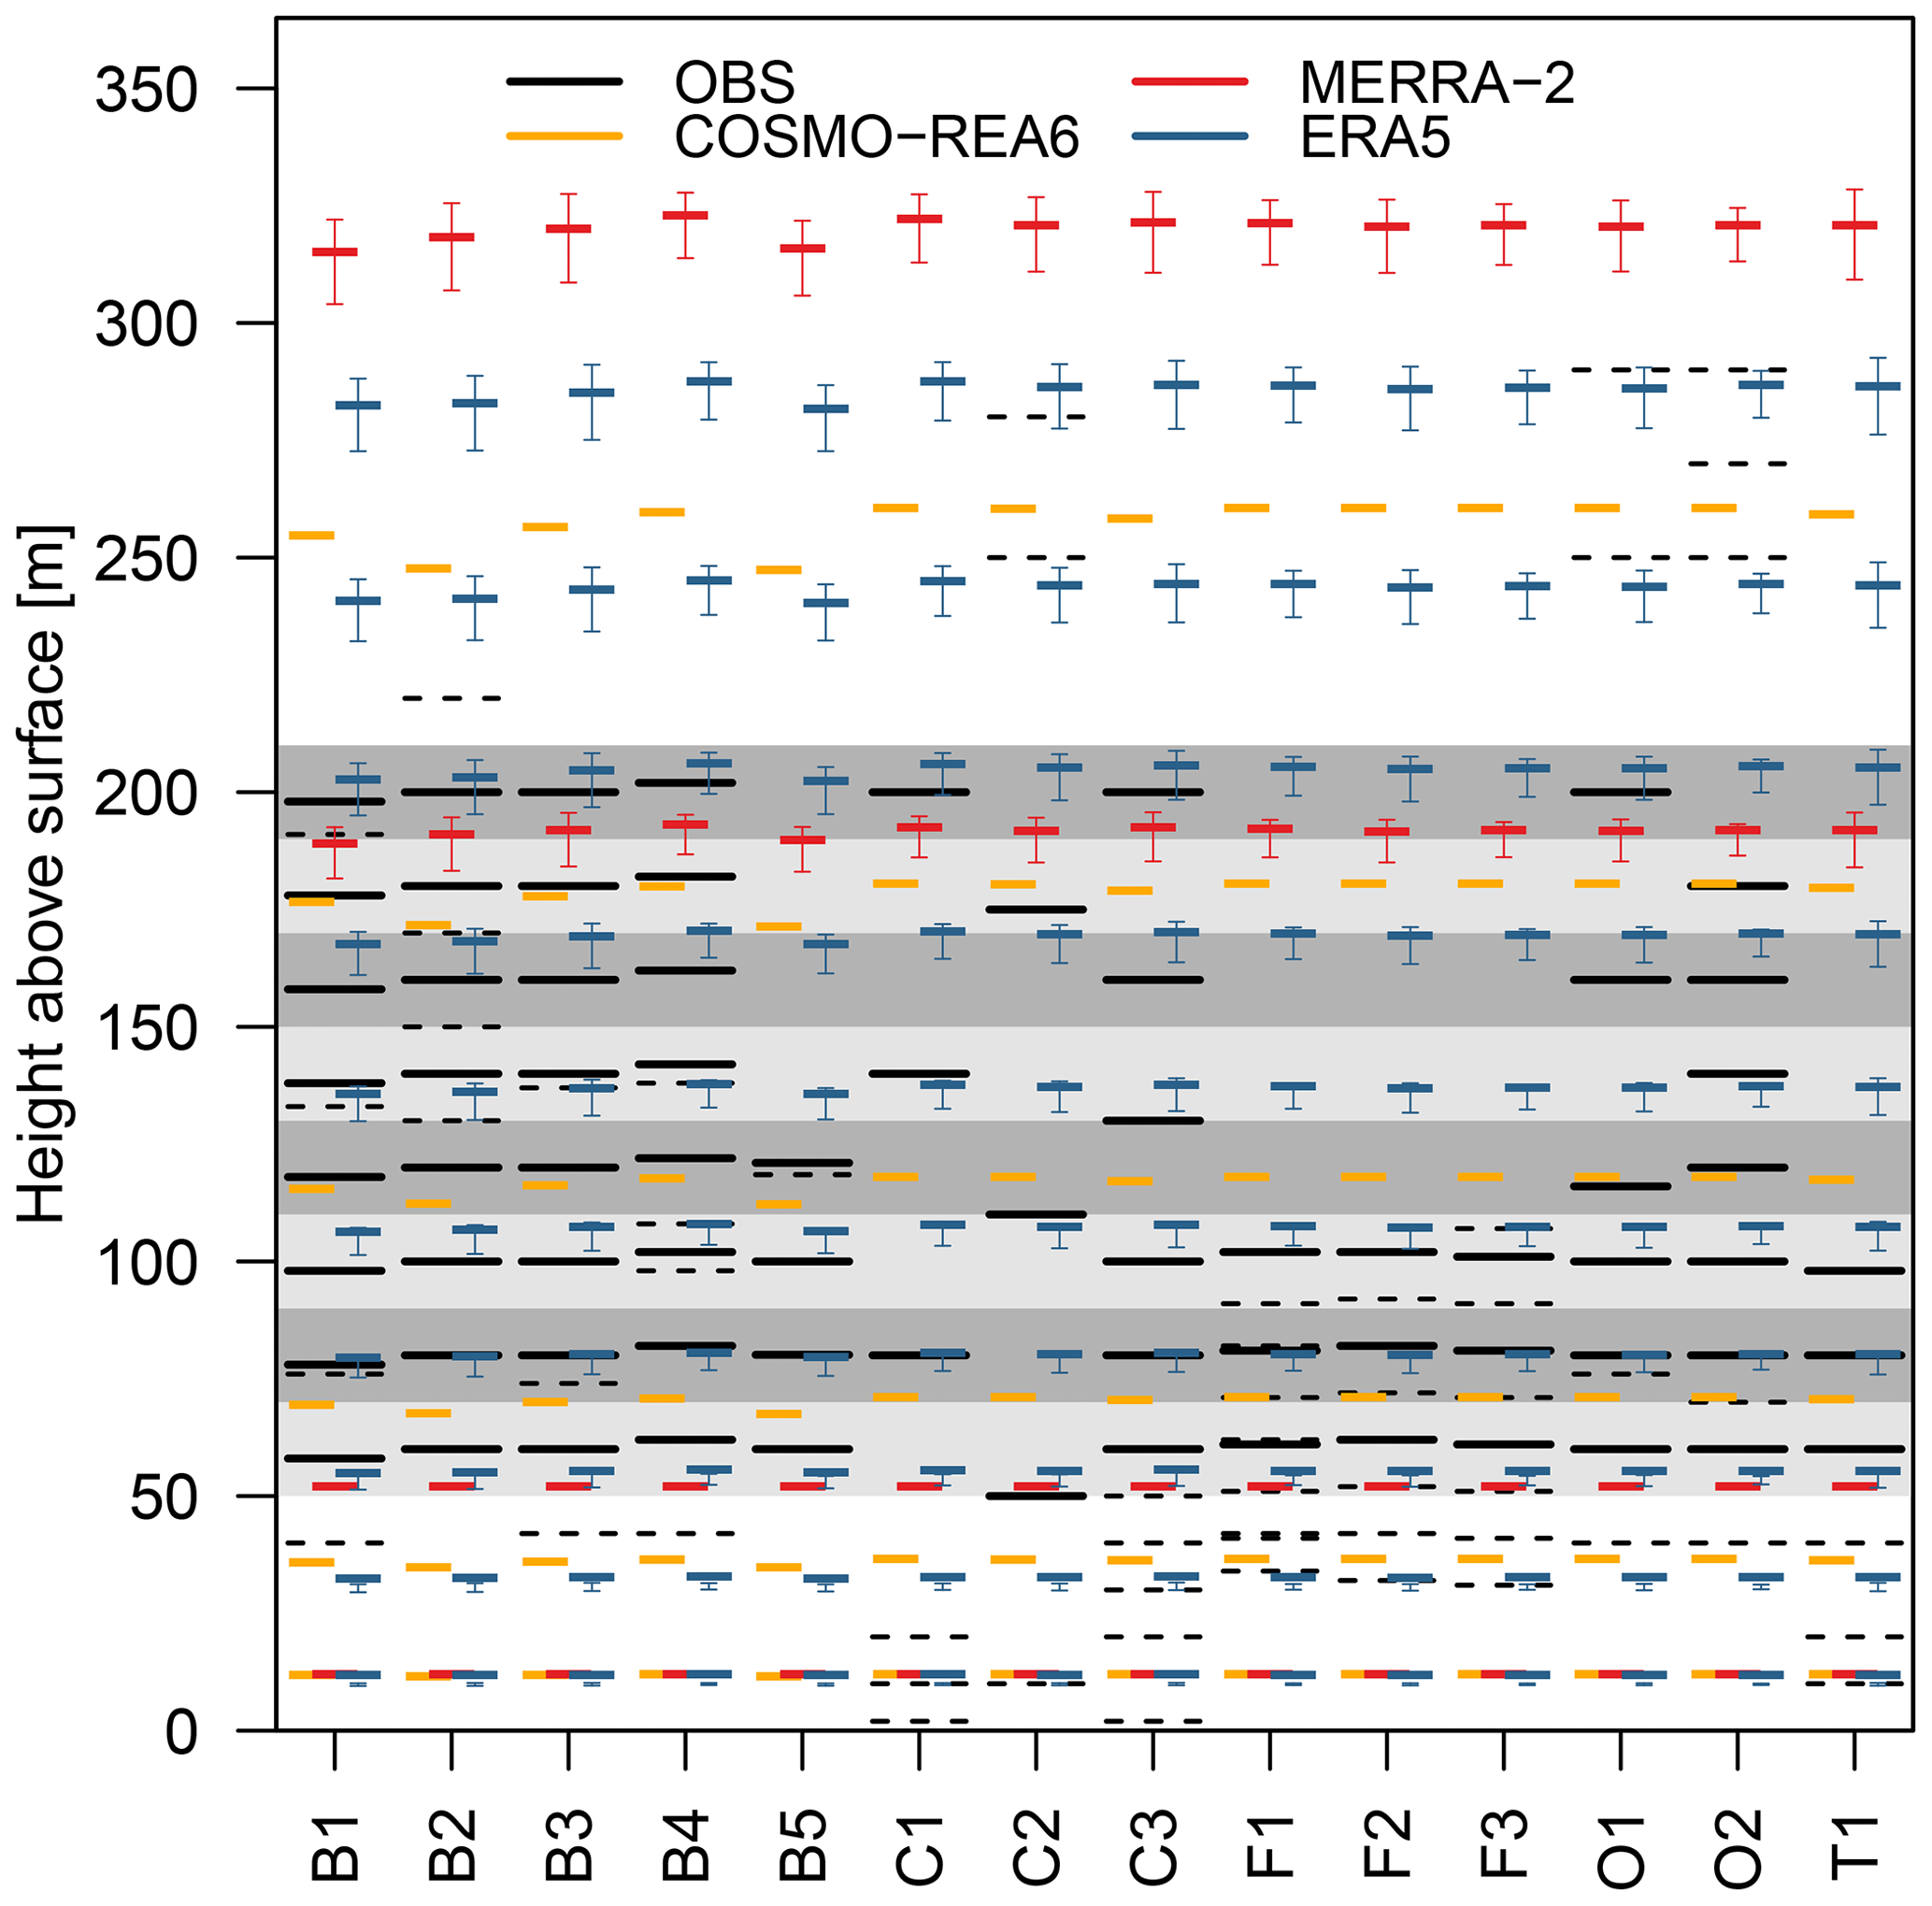
Figure 2Observation heights (solid black) and output levels of COSMO-REA6 (orange), MERRA-2 (red) and ERA5 (blue) for all measurement sites. Grey shaded areas represent height ranges between 50–70, 70–90, …, 190–210 m. Dashed black lines indicate observation heights which are not used in this study, because they are either below (above) 50 m (210 m) or further away from the centre of a height range than an other observation. The vertically high-resolution observations B1 to B4 and O1 to O2 are from lidar measurements. Height of model levels in MERRA-2 and ERA5 depend on pressure, thus error bars indicate the standard deviation.
2.3 Spatial and temporal interpolation
In order to create corresponding data sets from observations and reanalyses, certain steps towards a spatio-temporal alignment of the data have to be made. First, the vertical levels of the reanalyses generally do not correspond to the observation heights. Thus, the model output is vertically interpolated to better correspond to the observations. The vertical distance between the lowest model levels is very small, especially for COSMO-REA6 and ERA5, so we follow the approach described in Frank et al. (2020b) and perform a linear vertical interpolation. For the horizontal matching, we choose the nearest model grid point from the reanalyses for each observation location. Due to the horizontal resolution of the reanalyses, local effects such as local topography or small-scale variations in the roughness length are not directly represented.
With respect to the temporal representation, the observations constitute mean wind speeds for ten or 60 min intervals while the reanalyses provide instantaneous wind speed estimates. Therefore, we calculated hourly averages from the 10 min observations, so that all observations represent a period from 0 to 59 min of each hour. For the reanalyses, the mean is calculated from the instantaneous time step of minute 0 of the current and following hour. This method of temporal averaging may reduce the standard deviation of wind speed, but the mean wind speed remains almost the same (Veronesi and Grassi, 2015). Since the MERRA-2 output is only available every three hours, temporal linear interpolation is performed to obtain intermediate values. It turned out that this approach provides better results than extrapolating 50 m hourly wind speeds to the observation heights. Time steps with a missing value in one of all available vertical levels are completely neglected. Due to many missing values, O2 has the fewest time steps with around 1500 h.
We are aware that through nearest neighbor approach, vertical as well as temporal interpolation, additional errors are introduced into the data set depending in part on the resolution of the reanalysis. However, as all methods to generate a homogeneous data set will lead to additional errors, we have to accept these inaccuracies for the following analyses.
2.4 Evaluation approach
In order to reduce complexity for the evaluation and to allow for a reasonable interpretation of the results, we consider a total of eight vertical height ranges with a vertical extent of 20 m each (cf. Fig. 2). Thus, heights between 50 and 210 m, which are relevant for wind energy production, are covered. If more than one measurement is available within a height range, the closest observation height to the center of the height range is selected. Each observational site and each height level is evaluated separately. However, results are displayed for groups of sites according to their surface characteristic, i.e., offshore, flat, hilly.
Due to contractual obligations, we are not at liberty to share raw data of the BayWa measurements. Therefore, the evaluation results will be provided as relative information such as differences, RMSE or correlations.
Our initial approach is to statistically describe and compare the observed wind speeds and corresponding reanalysis estimates in terms of their distribution function. In this regard, a widely used distribution function for wind speed is the two-parameter Weibull distribution (Justus and Mikhail, 1976; Takle and Brown, 1978; Conradsen et al., 1984). Since, it has become the most-used distribution for wind speeds mainly due to its simplicity (Jung and Schindler, 2019). Its density function f(u) can be written as
where u is the wind speed in m s−1, k>0 is the dimensionless shape parameter and λ>0 is known as the scale parameter with the same unit as u.
We further employ standard metrics such as the bias, root-mean-squared error (RMSE) and correlation. Bias and RMSE between the reanalysis ri and the observation oi at time i for a time series of length N are given as
The correlation between reanalysis and observation is given by the Pearson correlation coefficient ρR,O as
where cov(R,O) is the covariance between the time series data of the reanalysis (R) and observation (O) and σR and σO their respective standard deviations.
For the wind energy sector, the performance of the reanalyses is of particular interest in the tails of the wind speed distribution. Wind turbines are ramped up at a certain wind speed threshold (the cut-in speed). On the other end of the wind speed spectrum, the turbines have to be shut off when wind speeds get too high, i.e., the so-called cut-out speed is exceeded. Therefore, the wind speed ranges below the cut-in and above the cut-out value represent the shut-down phases of a wind turbine. In order to evaluate the potential for wind power generation, the frequency of occurrence of wind speeds of the cut-in speed and cut-out speed should be well reproduced in the reanalysis. In our analyses, we assume that a hypothetical wind turbine with a hub height of 100 m has a cut-in speed of 3 m s−1 and a cut-out speed of 20 m s−1 in relation to the hourly average. We calculate the difference between the number of time steps with wind speeds below 3 m s−1 (above 20 m s−1) in each reanalysis and the observation. The difference is divided by the respective frequency of the observations.
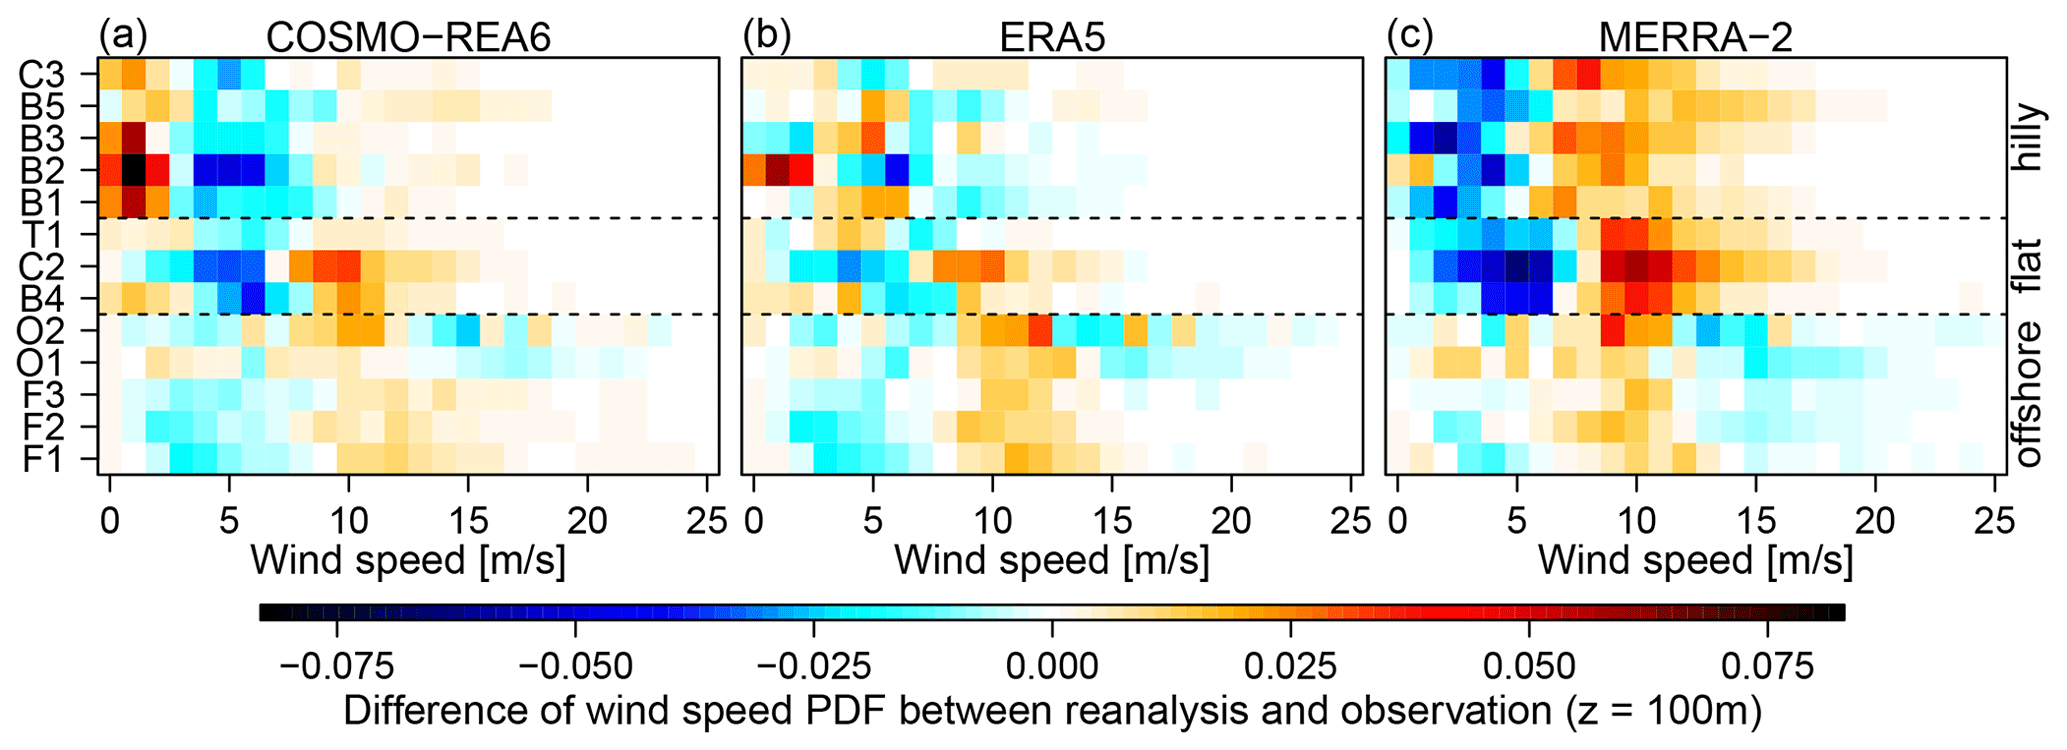
Figure 3Difference of wind speed histograms between reanalyses and observations for COSMO-REA6 (a), ERA5 (b), MERRA-2 (c) in bins of 1 m s−1 for all observation sites at 100 m height level. Yellow/red color (cyan/blue) indicates a positive (negative) difference to the observations.
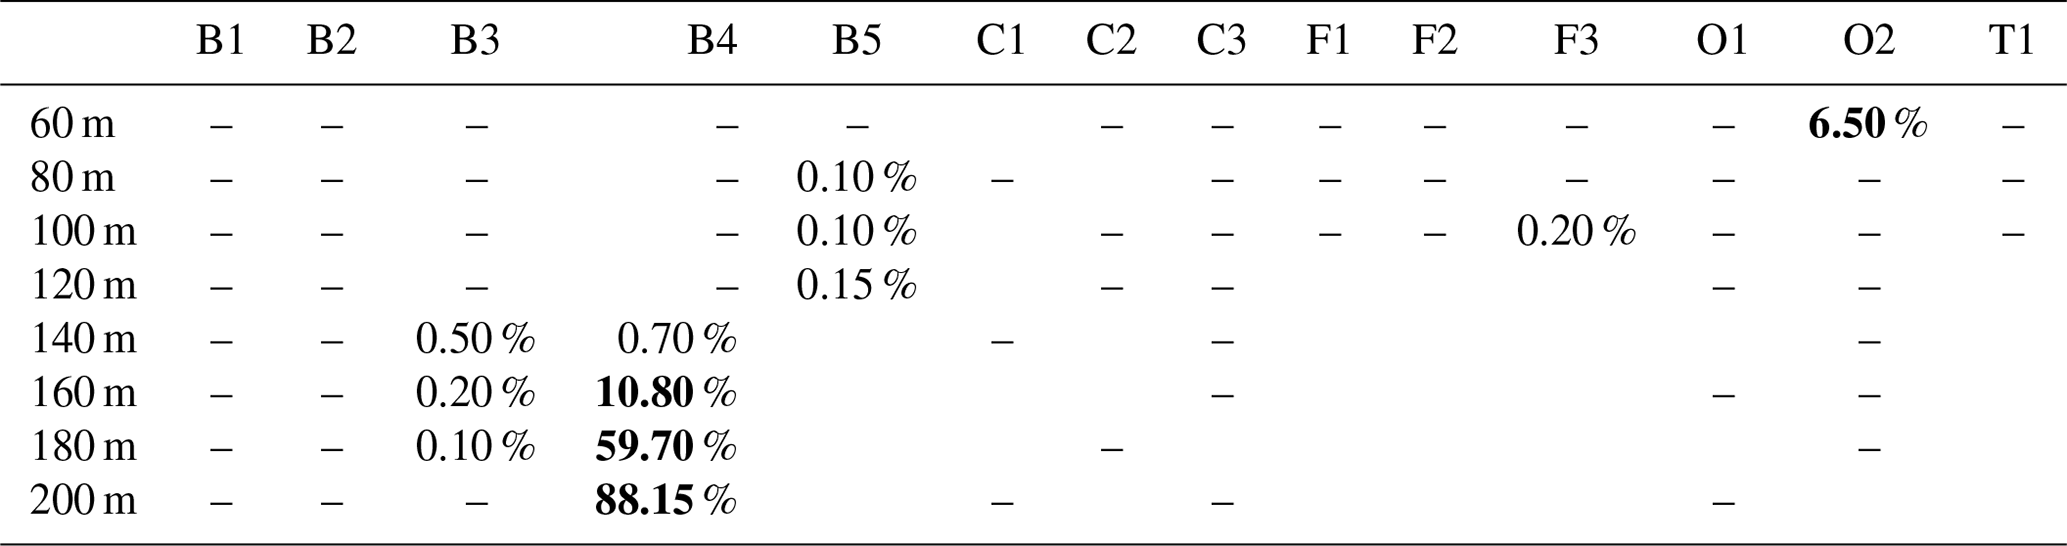
Table 2The probability at each observation location and height that the wind speed follows a Weibull distribution. A horizontal line indicates that the p value is below 0.05 %. Bold numbers represent p values above the significance level of 5 %.
3.1 Weibull distribution
To investigate whether our observational data can be described using the two-parameter Weibull distribution, we perform a Kolmogorov–Smirnov goodness of fit test (Massey, 1951). Since we need to estimate the parameters of the Weibull distribution directly from the observational data, we use the Lilliefors-corrected version of the Kolmogorov–Smirnov goodness of fit test (LcKS, Lilliefors, 1967, 1969; Parsons and Wirsching, 1982). Calculations are done with the function LcKS within the software package KScorrect by Novack-Gottshall and Wang (2018) using 1999 Monte Carlo simulations (Manly, 2006). For each observation location and available height, we then test whether the wind speed can be expressed as a Weibull distribution. This should be the case if the p value exceeds the significance level of 5 % (Table 2).
The test shows that the assumption of the two-parameter Weibull distribution only holds for certain heights at two locations, namely B4 (flat terrain in northern Germany) and O2 (offshore). For the remaining observation sites the p value is even below 1 % and the hypothesis that the wind speed follows the Weibull distribution is rejected. Thus, for the majority of observing sites used in this study, a Weibull distribution should not be used to evaluate wind speeds at hub heights.
A more accurate fit may be provided by combinations of different normal distributions or the Rayleigh–Rice distribution (Jourdier and Drobinski, 2017). However, the discussion based on such multi-parameter distributions with different weights would be unwieldy. Instead, in the following we use the usual metrics such as bias, RMSE or correlation to assess the performance of the different reanalyses. Further we investigate the performance of the empirical distribution functions derived from the data sample without any parametric assumption.

Figure 4(a–c) Bias, (d–f) RMSE and (g–i) Pearson correlation between the reanalyses COSMO-REA6 (orange), MERRA-2 (red), ERA5 (blue) and the observed wind speed as a function of height. Symbols indicate the offshore locations (a, d, g), flat (b, e, h) and hilly terrain (c, f, i). Solid lines represent means over all observation sites.
3.2 Wind speed distribution at 100 m
Figure 3 shows the difference between reanalyses and observations in the wind speed histograms for all observation sites at 100 m above ground. We find that, in general, deviations are larger over land than over the ocean. For the latter, we find an underestimation (overestimation) of smaller (larger) wind speeds for all reanalyses and sites except for O1. Over land, the differences are more or less homogeneous in both groups (hilly, flat) for COSMO-ERA6 and MERRA-2 while the pattern is more alternating among the sites for ERA5. COSMO-REA6 exhibits a consistent underestimation of wind speeds between 4 and 8 m s−1 with a strong overestimation of small wind speeds (<4 m s−1) in hilly terrain and moderate overestimation for wind speeds above 8 m s−1 over flat terrain. For MERRA-2, the differences over land are more consistent with an underestimation of smaller wind speeds (<5 m s−1 over hilly and <7 m s−1 over flat terrain). ERA5 exhibits no consistent pattern in the deviations of wind speed histograms. In general, the differences are smaller in absolute value compared to the other reanalysis except for B2, where the results are comparable to that of COSMO-REA6.
3.3 Bias, RMSE and correlation
For a more detailed view on the performance of each reanalysis, Fig. 4 shows bias, RMSE, and the correlation of the three reanalyses with the observed wind speed grouped by offshore, flat and hilly sites. All three metrics vary individually with height, location and terrain. Note that at each height level, the mean value may be calculated on a different number of stations, thus, leading to occasional jumps in the vertical for the reanalysis mean (thick line).
In general, the bias at the observation sites over the sea is lower than over land. MERRA-2 appears to slightly underestimate the wind speed over the ocean, while over land the average wind speed is systematically overestimated by at least 1 m s−1. It is noteworthy that the bias in MERRA-2 over land decreases successively with height. This suggests that local heterogeneity in land surface characteristics are not sufficiently represented due to the coarse horizontal resolution. At higher levels, the influence of the Earth's surface decreases, such that the performance of MERRA-2 improves. COSMO-REA6 and ERA5 also underestimate the wind speed over the ocean between 60 and 100 m, but only by about 0.2 m s−1. At the upper levels, where only measurements of O1 and O2 are available, the bias turns negative. COSMO-REA6 is closer to the observation than ERA5 for the two locations with observations above 100 m. For flat terrain over land, the average bias for ERA5 varies around 0 m s−1 and slightly increases with height for COSMO-REA6. Over hilly terrain, the biases of COSMO-REA6 and ERA5 exhibit a similar behavior for all locations: at 60 m, the average bias is 0 m s−1 and then decreases with height to about −0.2 m s−1 at 200 m above ground for ERA5 and −0.3 m s−1 for COSMO-REA6.
The good performance of ERA5 in orographically structured terrain is somewhat surprising, since the horizontal resolution of about five times coarser than that of COSMO-REA6. Thus, the enhanced representation of local surface heterogeneity in COSMO-REA6 does not seem to lead to a improved performance. Instead, we assume that its higher vertical resolution might enable ERA5 to better describe the vertical exchange processes in the lower boundary layer over land. Over the ocean, where vertical exchange is smaller, COSMO-REA6 outperforms the global reanalyses.
For the maritime sites with its homogeneous environment, the RMSE is almost homogeneous in the vertical with values of about 1.45, 1.55, 1.75 m s−1 for ERA5, COSMO-REA6 and MERRA-2, respectively. The RMSE of MERRA-2 over the mainland is about 2 m s−1 and thus considerably larger than that of COSMO-REA6 and ERA5. Especially MERRA-2's large discrepancy near the ground is remarkable, but can probably be attributed to its coarser horizontal and vertical resolution as well as the employed temporal interpolation. In ERA5 and COSMO-REA6, the RMSE in flat and hilly terrain increases with height. There are clear differences between the two reanalyses especially between 100 and 200 m above the flat terrain, while the RMSE is very similar in hilly terrain. It is well known that COSMO-REA6 has a difficulty modeling low level jets (LLJs) and thus tends to lower wind speeds in stable nights (Heppelmann et al., 2017). We suspect that this could be a major contributing factor here as well. For a more detailed analysis on this, we investigate the diurnal cycles in Sect. 3.4.
While it is possible to correct the wind speed bias with statistical post-processing, correction for temporal correlations proves much more difficult. In this regard, a reanalysis with higher temporal correlation may be preferred despite larger systematic biases. We find that the correlation decreases with the complexity of the terrain. For the offshore stations the correlation at all levels is between 0.92 and 0.96 for MERRA-2, COSMO-REA6 and ERA5. Over flat terrain, the correlation is smaller and increases slightly with height. Surprisingly, COSMO-REA6 shows the lowest correlations and ERA5 performs best in the correlation over flat terrain. Over hilly terrain, however, the correlations between COSMO-REA6 and observed wind speed are highest. Compared to the flat terrain, LLJs, which are not well-represented in COSMO-REA6, occur less frequently here and local phenomena such as mountain and valley breezes determine the diurnal cycle of wind speeds. Hence, we suspect, that these characteristics lead to an improved performance of COSMO-REA6 in hilly versus flat terrain.
3.4 Diurnal cycle
Close to the ground, wind speeds generally exhibit a distinct diurnal cycle with higher values during the day due to developing turbulence. At hub height and above, a reversal of the diurnal cycle can be observed (Brümmer et al., 2012; Drechsel et al., 2012) with LLJs often forming in these height ranges during the night. In the following, we analyse the diurnal variations of wind speed bias at 60, 100 and 140 m grouped by offshore, flat and hilly locations (Fig. 5).
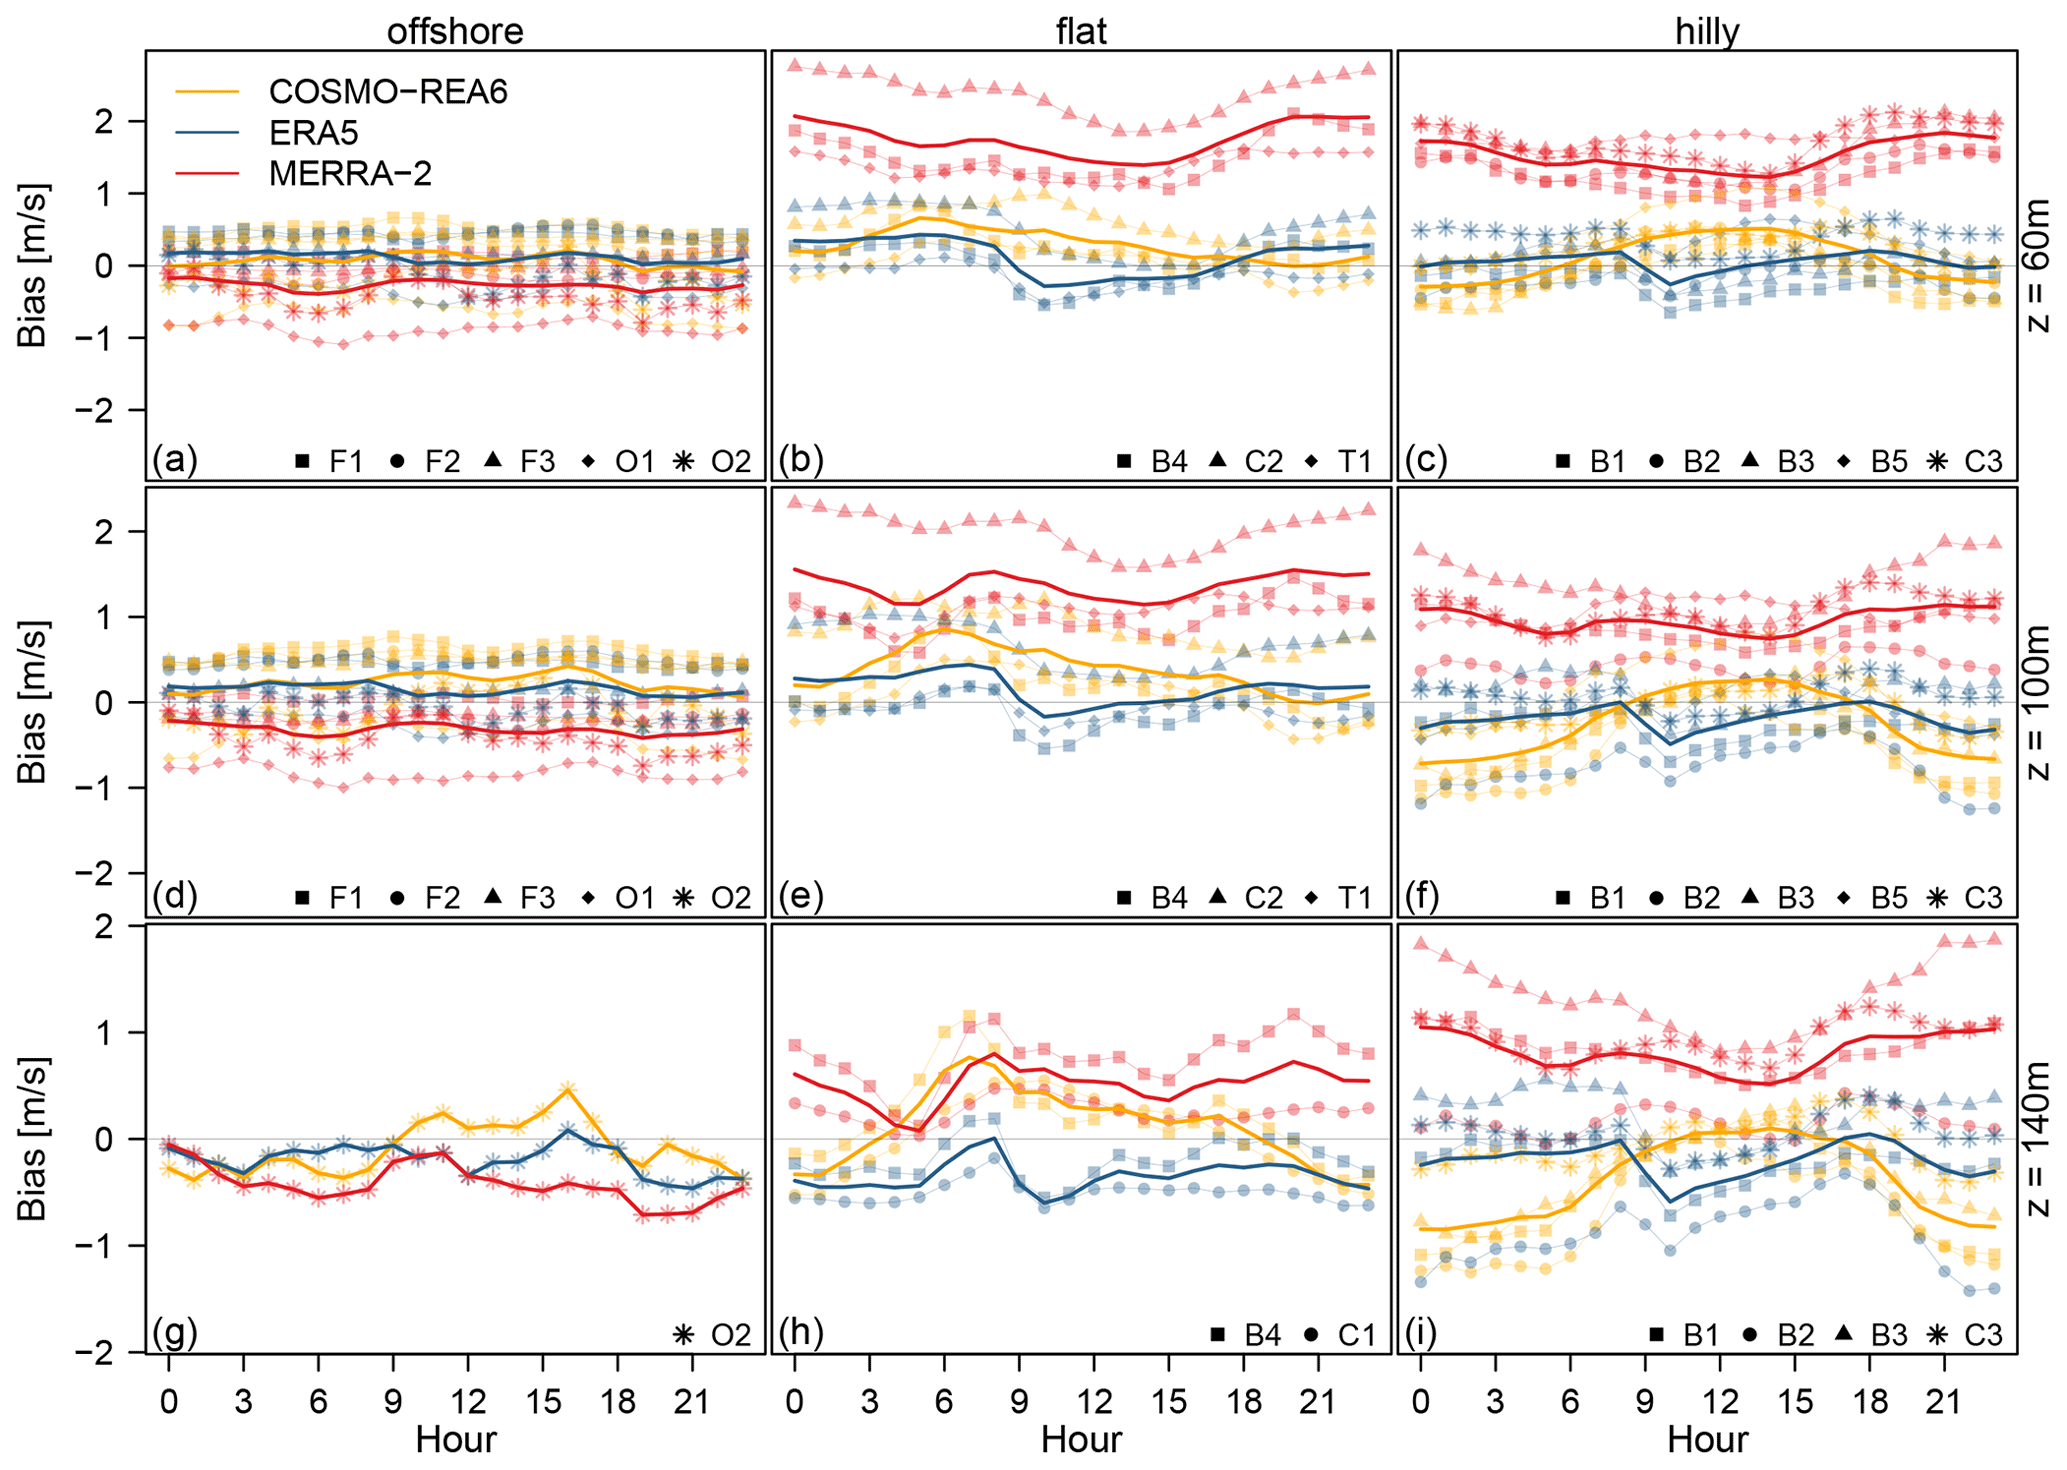
Figure 5Lines show the average diurnal cycle of wind speed bias at (a–c) 60 m, (d–f) 100 m and (g–i) 140 m for COSMO-REA6 (orange), MERRA-2 (red) and ERA5 (blue). Symbols indicate the offshore locations (a, d, g), flat (b, e, h) and hilly terrain (c, f, i).
For the offshore sites, there is no clear diurnal variation in bias for the three reanalyses at 60 and 100 m. MERRA-2 consistently underestimates the wind speed at both levels by about 0.3 m s−1, while COSMO-REA6 and ERA5 have a small positive bias of 0.1 m s−1. At 140 m, only measurements of O2 are available, which show a slight negative bias for both global reanalyses during the day, while COSMO-REA6 overestimates wind speeds during the day between 09:00 and 18:00 UTC.
More pronounced biases of the diurnal cycle become apparent over land. Each of the reanalyses has an individual pattern, which is more or less independent of the hilliness of the environment and the height above ground. MERRA-2 shows comparatively small variations of bias in the diurnal cycle and overestimates wind speed almost consistently. There are two weakly pronounced minimums at 06:00 and 15:00 UTC, one due to the onset of turbulence after sunrise and the other during maximum turbulent mixing in the afternoon. It should be noted that the temporal interpolation of the three-dimensional MERRA-2 output could distort the results at this point.
All diurnal variations of ERA5 show an abrupt drop of 0.5 m s−1 between 08:00 and 11:00 UTC, and then slowly return to the initial level during the rest of the day. The discontinuity was already reported by Kalverla et al. (2019); Jourdier (2020) and is related to a data assimilation issue in ERA5. As the day progresses, the negative bias gradually disappears, so that on average, ERA5 reproduces the wind speed in the afternoon quite well.
The regional reanalysis COSMO-REA6 shows a very clear diurnal variation in wind speed bias. Over flat terrain, a sharp maximum of overestimation is apparent between 05:00 UTC (60 m) and 07:00 UTC (140 m), whereas during the night, COSMO-REA6 has only a very small positive bias for 60 and 100 m which becomes a more pronounced negative bias at 140 m probably due to the aforementioned shortcomings in representing the LLJs. For hilly terrain, we find small positive biases during the day and strong negative biases during the night with the magnitude of the latter increasing with height.
We also looked at the seasonal dependence of the reanalysis biases (figure in the Supplement). However, for each of the reanalyses, no significant difference between the dominant patterns of the seasons can be found. The seasonal variations are rather expressed through a general shift to more positive (negative) biases in winter (summer).
3.5 Performance in the range of cut-in and cut-out speed
Finally, we evaluate the reanalysis' representation of potential wind power generation at the observation locations using cut-in and cut-out speeds (cf. Sect. 2.4). Figure 6 shows the difference between the reanalyses and the observations in percentage of time steps for which wind speeds lie below (above) the assumed cut-in (cut-out) thresholds at the 100 m height level.
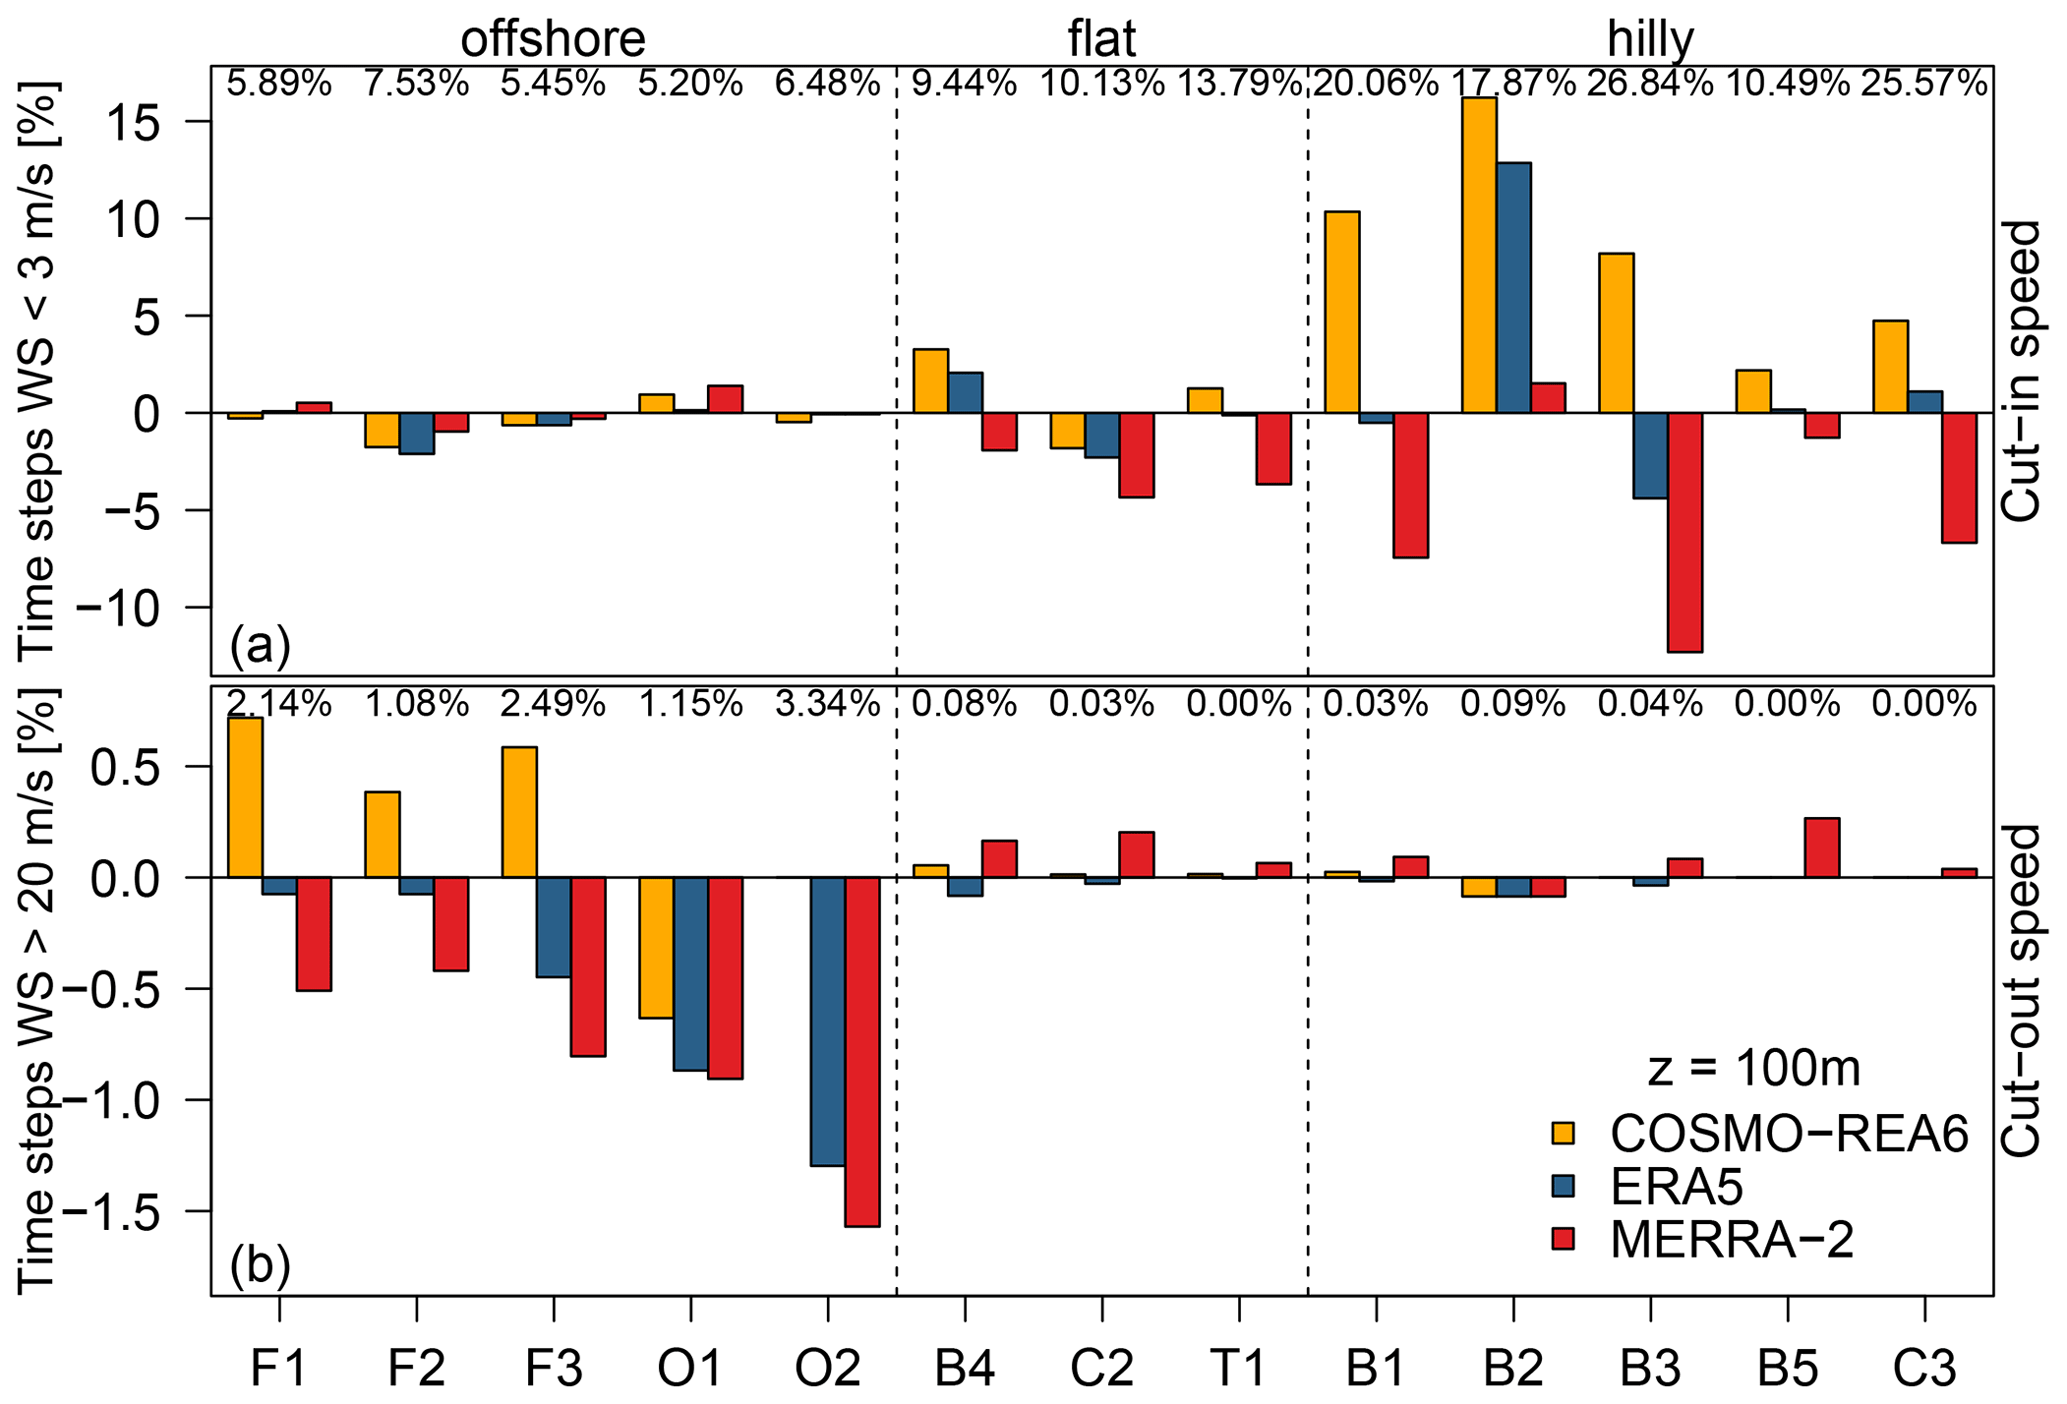
Figure 6Colored bars represent the difference between the reanalyses COSMO-REA6 (orange), MERRA-2 (red), ERA5 (blue) and the observed percentage of time steps with (a) wind speeds below 3 m s−1 and (b) wind speeds above 20 m s−1. The observation height is 100 m and the sites are grouped into offshore (F1 … O2), flat terrain (B4 … T1) and hilly regions (B1 … C3). The percentages at top of each panel indicate how often the cut-in speed is undercut or the cut-out speed is exceeded in the observations.
With respect to the low wind situations (upper row), we find that for the offshore sites, percentages are similarly well reproduced by all three reanalyses. Over flat land, an underestimation of MERRA-2 can be found which is in correspondence with the reanalysis' general tendency to overestimate wind speeds. For ERA5 and COSMO-REA6, no clear signal can be found across the three sites. However, the differences are below ±5 % for all reanalyses. For the hilly terrain, the difference become much more pronounced. At three of the five stations, MERRA-2 has a strong underestimation of the percentage of winds below the cut-in speed with close to zero differences at the other two sites. COSMO-REA6 exhibits a general overestimation of low wind situations which is above 5 % at three sites. This is in accordance with wind speeds being too low during the night over hilly terrain in COSMO-REA6 (cf. Fig. 5f). For ERA5, we, again, find no clear tendency with differences close to zero at three sites but a strong overestimation at B2 and an underestimation at B3.
For the cut-out speed (lower row of Fig. 6), we see a reversed pattern. While differences are mostly small over land with a slightly positive deviation for MERRA-2, differences over the ocean are larger. Here, a negative deviation, i.e., an underestimation of cut-out speed exceedance can be found for both ERA5 and MERRA-2. At a first glance, this seems remarkable for ERA5 as the corresponding average bias for offshore sites at 100 m is slightly positive (cf. Fig. 4a). However, this can be explained by looking at Fig. 3 where a larger overestimation of frequency of occurrence can be found in the range from 10 to 15 m s−1. Thus, the overall bias is slightly positive, while at the same time the frequency of stronger wind speeds is underestimated. For COSMO-REA6, no clear signal is apparent as the differences for cut-out speed exceedance over the ocean are positive for three sites, negative for one site and zero for the remaining one.
While this study presents results as deviations or differences from the observations due to the confidentially of some of the data, it provides a reasonable overview of the quality of wind speed reanalysis estimates at hub heights over Central Europe and the surrounding oceans. A total of 14 measurement series were compared with the global reanalyses ERA5 and MERRA-2 and the regional reanalysis COSMO-REA6 in order to evaluate their respective performances in representing wind speeds at the vertical heights relevant for wind energy production.
Our initial approach was focused on using a two-parameter Weibull distribution to reduce complexity as it is a common assumption that wind speeds are distributed accordingly. However, for the sites used in this study with observation heights between 60 and 200 m, we found that only at two of the 14 observation sites and only at some height levels can the observed wind speed be described by a Weibull distribution according to a Kolmogorov–Smirnov test. Therefore, we decided to base our analysis on the common metrics such as histograms, bias, RMSE and correlation.
The expectation was that COSMO-REA6, albeit based on an older model version and a simple data assimilation approach, would be able to better capture the spatial heterogeneity in the lower boundary layer compared to the global reanalyses due to its finer horizontal resolution of about 6 km. This was confirmed in several studies on this topic (e.g., Borsche et al., 2016; Frank et al., 2020b).
However, we find that over land, ERA5 performs better than COSMO-REA6 for most of the sites, although wind speed is underestimated in the morning hours due to a known data assimilation issue. A possible explanation for this finding is that the wind speed performance of COSMO-REA6 in relation to the observations has a strong diurnal cycle over land which is at least in part due to the suboptimal representation of nightly low level jets. ERA5 seems to be better able to capture this phenomenon which could be founded in the increased number of vertical model levels in the lower boundary layer. As the effect is increasing with height, our results therefore indicate that while horizontal resolution may play a crucial role in the quality of wind speed estimates close to the surface, wind speeds at hub heights seem to profit from a higher vertical model resolution.
MERRA-2, in contrast to the other two reanalyses, systematically overestimates wind speeds over land. As MERRA-2 is provided only on a few vertical levels and in 3-hourly time steps, we investigated different vertical and temporal interpolation approaches (not shown). However, none lead to better results than the ones presented here.
Over oceans, in the absence of pronounced surface heterogeneity, our expectation was that differences in the metrics between global and regional reanalyses would be neglectable. This is mostly confirmed by the results except for an underestimation of wind speeds by MERRA-2.
Our evaluation shows that each reanalysis outperforms the other reanalyses at least at one of the observation sites. This indicates that each reanalysis can potentially provide additional value to the representation of wind speeds in the lower boundary layer. Therefore, it might be beneficial to use a weighted combination of reanalysis products, i.e., a weighted multi-reanalysis ensemble, to estimate near-surface wind speeds. This should be investigated in a future study. If a user wants to employ a single reanalysis for wind energy applications over Central Europe, our current suggestion would be to use ERA5 over land and COSMO-REA6 over the ocean (due to its slightly better representations of cut-in and cut-out speeds).
For the development of future wind speed data sets for renewable energy applications, regional reanalyses might not only focus on enhancing horizontal resolution but also on increasing the number of vertical levels to be able to better represent boundary layer processes. With respect to statistical post-processing approaches to correct reanalysis estimates, we suggest to apply a (multi-reanalysis) post-processing in order to account for systematic errors in the reanalyses and generate high quality climatological wind speed estimates. Such an approach is currently developed in the FAIR project (Frank et al., 2020a) with the goal to provide a publicly available, high-quality wind data set for renewable energy applications.
Online access Tall Tower Dataset: https://b2share.eudat.eu/records/136ecdeee31a45a7906a773095656ddb (last access: 22 December 2020) (Ramon and Lledó, 2020). Access to Offshore Wind Measurements by Orsted: https://orsted.com/en/our-business/offshore-wind/wind-data (last access: 12 January 2021) (Orsted, 2021). Access to FINO data: http://fino.bsh.de (last access: 11 January 2021) (BSH, 2021). The ERA5 reanalysis is available via the Copernicus Climate Data Store: https://cds.climate.copernicus.eu (last access: 21 August 2020) (Copernicus Climate Data Store, 2020). MERRA-2 data is provided by the Goddard Earth Sciences Data and Information Services Center: https://disc.sci.gsfc.nasa.gov/ (last access: 3 November 2020) (GMAO, 2020). COSMO-REA6 is available via DWD's Climate Data Center: https://opendata.dwd.de/climate_environment/REA/COSMO_REA6/ (last access: 15 January 2020) (DWD/HErZ, 2020).
The supplement related to this article is available online at: https://doi.org/10.5194/asr-18-115-2021-supplement.
SB prepared the data, designed the methodology and carried out the analysis under the supervision of JDK and SW. SB prepared the manuscript. SB, JDK and SW reviewed it iteratively.
The authors declare that they have no conflict of interest.
Publisher's note: Copernicus Publications remains neutral with regard to jurisdictional claims in published maps and institutional affiliations.
This article is part of the special issue “Applied Meteorology and Climatology Proceedings 2020: contributions in the pandemic year”.
This work has been conducted in the framework of the mFund programme FAIR. The authors want to thank BayWa r.e. GmbH for the generous provision of their data.
This research has been supported by the Bundesministerium für Verkehr und Digitale Infrastruktur (grant no. 19F2103C).
This paper was edited by Eric Bazile and reviewed by two anonymous referees.
Bollmeyer, C., Keller, J. D., Ohlwein, C., Wahl, S., Crewell, S., Friederichs, P., Hense, A., Keune, J., Kneifel, S., Pscheidt, I., Redl, S., and Steinke, S.: Towards a high-resolution regional reanalysis for the European CORDEX domain, Q. J. Roy. Meteorol. Soc., 141, 1–15, https://doi.org/10.1002/qj.2486, 2015. a
Borsche, M., Kaiser-Weiss, A. K., and Kaspar, F.: Wind speed variability between 10 and 116 m height from the regional reanalysis COSMO-REA6 compared to wind mast measurements over Northern Germany and the Netherlands, Adv. Sci. Res., 13, 151–161, https://doi.org/10.5194/asr-13-151-2016, 2016. a, b
Brümmer, B., Lange, I., and Konow, H.: Atmospheric boundary layer measurements at the 280 m high Hamburg weather mast 1995–2011: mean annual and diurnal cycles, Meteorol. Z., 21, 319–335, https://doi.org/10.1127/0941-2948/2012/0338, 2012. a, b
BSH – Bundesamt für Seeschifffahrt und Hydrographie: FINO-Datenbank, available at: http://fino.bsh.de, last access: 11 January 2021. a
Conradsen, K., Nielsen, L. B., and Prahm, L. P.: Review of Weibull Statistics for Estimation of Wind Speed Distributions, J. Clim. Appl. Meteorol., 23, 1173–1183, https://doi.org/10.1175/1520-0450(1984)023<1173:ROWSFE>2.0.CO;2, 1984. a
Copernicus Climate Data Store: ERA5 – Fifth generation of ECMWF atmospheric reanalyses of the global climate, available at: https://cds.climate.copernicus.eu, last access: 21 August 2020. a
Drechsel, S., Mayr, G. J., Messner, J. W., and Stauffer, R.: Wind Speeds at Heights Crucial for Wind Energy: Measurements and Verification of Forecasts, J. Appl. Meteorol. Clim., 51, 1602–1617, https://doi.org/10.1175/JAMC-D-11-0247.1, 2012. a
DWD/HErZ – Deutscher Wetterdienst – Climate Data Center/Hans-Ertel Centre for Weather Research: COSMO-REA6 regional reanalysis, available at: https://opendata.dwd.de/climate_environment/REA/COSMO_REA6/, last access: 15 January 2020. a
Frank, C. W., Kaspar, F., Keller, J. D., Adams, T., Felkers, M., Fischer, B., Handte, M., Marrón, P. J., Paulsen, H., Neteler, M., Schiewe, J., Schuchert, M., Nickel, C., Wacker, R., and Figura, R.: FAIR: a project to realize a user-friendly exchange of open weather data, Adv. Sci. Res., 17, 183–190, https://doi.org/10.5194/asr-17-183-2020, 2020a. a, b
Frank, C. W., Pospichal, B., Wahl, S., Keller, J. D., Hense, A., and Crewell, S.: The added value of high resolution regional reanalyses for wind power applications, Renew. Energy, 148, 1094–1109, https://doi.org/10.1016/j.renene.2019.09.138, 2020b. a, b, c, d, e, f
Gelaro, R., McCarty, W., Suárez, M. J., Todling, R., Molod, A., Takacs, L., Randles, C. A., Darmenov, A., Bosilovich, M. G., Reichle, R., Wargan, K., Coy, L., Cullather, R., Draper, C., Akella, S., Buchard, V., Conaty, A., da Silva, A. M., Gu, W., Kim, G.-K., Koster, R., Lucchesi, R., Merkova, D., Nielsen, J. E., Partyka, G., Pawson, S., Putman, W., Rienecker, M., Schubert, S. D., Sienkiewicz, M., and Zhao, B.: The Modern-Era Retrospective Analysis for Research and Applications, Version 2 (MERRA-2), J. Climate, 30, 5419–5454, https://doi.org/10.1175/JCLI-D-16-0758.1, 2017. a
GMAO – Global Modeling and Assimilation Office: MERRA-2 reanalysis data available through Goddard Earth Sciences Data and Information Services Center (GES DISC), available at: https://disc.sci.gsfc.nasa.gov/, last access: 3 November 2020. a
Gryning, S.-E. and Floors, R.: Carrier-to-Noise-Threshold Filtering on Off-Shore Wind Lidar Measurements, Sensors, 19, 592, https://doi.org/10.3390/s19030592, 2019. a
Heppelmann, T., Steiner, A., and Vogt, S.: Application of numerical weather prediction in wind power forecasting: Assessment of the diurnal cycle, Meteorol. Z., 26, 319–331, https://doi.org/10.1127/metz/2017/0820, 2017. a
Hersbach, H., Bell, B., Berrisford, P., Hirahara, S., Horányi, A., Muñoz-Sabater, J., Nicolas, J., Peubey, C., Radu, R., Schepers, D., Simmons, A., Soci, C., Abdalla, S., Abellan, X., Balsamo, G., Bechtold, P., Biavati, G., Bidlot, J., Bonavita, M., De Chiara, G., Dahlgren, P., Dee, D., Diamantakis, M., Dragani, R., Flemming, J., Forbes, R., Fuentes, M., Geer, A., Haimberger, L., Healy, S., Hogan, R. J., Hólm, E., Janisková, M., Keeley, S., Laloyaux, P., Lopez, P., Lupu, C., Radnoti, G., de Rosnay, P., Rozum, I., Vamborg, F., Villaume, S., and Thépaut, J.-N.: The ERA5 global reanalysis, Q. J. Roy. Meteorol. Soc., 146, 1999–2049, https://doi.org/10.1002/qj.3803, 2020. a
Jourdier, B.: Evaluation of ERA5, MERRA-2, COSMO-REA6, NEWA and AROME to simulate wind power production over France, Adv. Sci. Res., 17, 63–77, https://doi.org/10.5194/asr-17-63-2020, 2020. a, b
Jourdier, B. and Drobinski, P.: Errors in wind resource and energy yield assessments based on the Weibull distribution, Ann. Geophys., 35, 691–700, https://doi.org/10.5194/angeo-35-691-2017, 2017. a
Jung, C. and Schindler, D.: Wind speed distribution selection – A review of recent development and progress, Renew. Sustain. Energ. Rev., 114, 109290, https://doi.org/10.1016/j.rser.2019.109290, 2019. a
Justus, C. G. and Mikhail, A.: Height variation of wind speed and wind distributions statistics, Geophys. Res. Lett., 3, 261–264, https://doi.org/10.1029/GL003i005p00261, 1976. a
Kaiser-Weiss, A. K., Kaspar, F., Heene, V., Borsche, M., Tan, D. G. H., Poli, P., Obregon, A., and Gregow, H.: Comparison of regional and global reanalysis near-surface winds with station observations over Germany, Adv. Sci. Res., 12, 187–198, https://doi.org/10.5194/asr-12-187-2015, 2015. a
Kalverla, P. C., Duncan Jr., J. B., Steeneveld, G.-J., and Holtslag, A. A. M.: Low-level jets over the North Sea based on ERA5 and observations: together they do better, Wind Energ. Sci., 4, 193–209, https://doi.org/10.5194/wes-4-193-2019, 2019. a
Kaspar, F., Niermann, D., Borsche, M., Fiedler, S., Keller, J., Potthast, R., Rösch, T., Spangehl, T., and Tinz, B.: Regional atmospheric reanalysis activities at Deutscher Wetterdienst: review of evaluation results and application examples with a focus on renewable energy, Adv. Sci. Res., 17, 115–128, https://doi.org/10.5194/asr-17-115-2020, 2020. a
Kohler, M., Metzger, J., and Kalthoff, N.: Trends in temperature and wind speed from 40 years of observations at a 200-m high meteorological tower in Southwest Germany, Int. J. Climatol., 38, 23–34, https://doi.org/10.1002/joc.5157, 2018. a
Lilliefors, H. W.: On the Kolmogorov-Smirnov Test for Normality with Mean and Variance Unknown, J. Am. Stat. Assoc., 62, 399–402, https://doi.org/10.1080/01621459.1967.10482916, 1967. a
Lilliefors, H. W.: On the Kolmogorov-Smirnov Test for the Exponential Distribution with Mean Unknown, J. Am. Stat. Assoc., 64, 387–389, https://doi.org/10.1080/01621459.1969.10500983, 1969. a
Macke, A., Seifert, P., Baars, H., Barthlott, C., Beekmans, C., Behrendt, A., Bohn, B., Brueck, M., Bühl, J., Crewell, S., Damian, T., Deneke, H., Düsing, S., Foth, A., Di Girolamo, P., Hammann, E., Heinze, R., Hirsikko, A., Kalisch, J., Kalthoff, N., Kinne, S., Kohler, M., Löhnert, U., Madhavan, B. L., Maurer, V., Muppa, S. K., Schween, J., Serikov, I., Siebert, H., Simmer, C., Späth, F., Steinke, S., Träumner, K., Trömel, S., Wehner, B., Wieser, A., Wulfmeyer, V., and Xie, X.: The HD(CP)2 Observational Prototype Experiment (HOPE) – an overview, Atmos. Chem. Phys., 17, 4887–4914, https://doi.org/10.5194/acp-17-4887-2017, 2017. a
Manly, B. F.: Randomization, bootstrap and Monte Carlo methods in biology, in: vol. 70, CRC Press, New York, 2006. a
Massey, F. J.: The Kolmogorov–Smirnov Test for Goodness of Fit, J. Am. Stat. Assoc., 46, 68–78, https://doi.org/10.1080/01621459.1951.10500769, 1951. a
Novack-Gottshall, P. and Wang, S. C.: KScorrect: Lilliefors-Corrected Kolmogorov–Smirnov Goodness-of-Fit Tests, r package version 1.2.4, available at: https://CRAN.R-project.org/package=KScorrect (last access: 18 June 2021), 2018. a
Orsted: Offshore wind data, available at: https://orsted.com/en/our-business/offshore-wind/wind-data, last access: 12 January 2021. a
Parsons, F. and Wirsching, P.: A Kolmogorov–Smirnov goodness-of-fit test for the two-parameter weibull distribution when the parameters are estimated from the data, Microelect. Reliabil., 22, 163–167, https://doi.org/10.1016/0026-2714(82)90174-3, 1982. a
Ramon, J. and Lledó, L.: The Tall Tower Dataset [data set], available at: https://b2share.eudat.eu/records/136ecdeee31a45a7906a773095656ddb, last access: 22 December 2020. a
Ramon, J., Lledó, L., Torralba, V., Soret, A., and Doblas-Reyes, F. J.: What global reanalysis best represents near-surface winds?, Q. J. Roy. Meteorol. Soc., 145, 3236–3251, https://doi.org/10.1002/qj.3616, 2019. a
Ramon, J., Lledó, L., Pérez-Zanón, N., Soret, A., and Doblas-Reyes, F. J.: The Tall Tower Dataset: a unique initiative to boost wind energy research, Earth Syst. Sci. Data, 12, 429–439, https://doi.org/10.5194/essd-12-429-2020, 2020. a, b
Rehman, S.: Tower distortion and scatter factors of co-located wind speed sensors and turbulence intensity behavior, Renew. Sustain. Energ. Rev., 34, 20–29, https://doi.org/10.1016/j.rser.2014.03.007, 2014. a
Simmer, C., Adrian, G., Jones, S., Wirth, V., Göber, M., Hohenegger, C., Janjić, T., Keller, J., Ohlwein, C., Seifert, A., Trömel, S., Ulbrich, T., Wapler, K., Weissmann, M., Keller, J., Masbou, M., Meilinger, S., Riß, N., Schomburg, A., Vormann, A., and Weingärtner, C.: HErZ: The German Hans-Ertel Centre for Weather Research, B. Am. Meteorol. Soc., 97, 1057–1068, https://doi.org/10.1175/BAMS-D-13-00227.1, 2016. a
St. Martin, C. M., Lundquist, J. K., Clifton, A., Poulos, G. S., and Schreck, S. J.: Atmospheric turbulence affects wind turbine nacelle transfer functions, Wind Energ. Sci., 2, 295–306, https://doi.org/10.5194/wes-2-295-2017, 2017. a
Takle, E. S. and Brown, J. M.: Note on the Use of Weibull Statistics to Characterize Wind-Speed Data, J. Appl. Meteorol., 17, 556–559, https://doi.org/10.1175/1520-0450(1978)017<0556:NOTUOW>2.0.CO;2, 1978. a
Van Ulden, A. P. and Wieringa, J.: Atmospheric Boundary Layer Research at Cabauw, Springer Netherlands, Dordrecht, 39–69, https://doi.org/10.1007/978-94-017-0944-6_3, 1996. a
Veronesi, F. and Grassi, S.: Comparison of hourly and daily wind speed observations for the computation of Weibull parameters and power output, in: Proceedings of the IEEE, 2015 3rd International Renewable and Sustainable Energy Conference (IRSEC), 10–13 December 2015, Marrakech, Morocco, 1–6, https://doi.org/10.1109/IRSEC.2015.7455043, 2015. a
Wulfmeyer, V., Turner, D. D., Baker, B., Banta, R., Behrendt, A., Bonin, T., Brewer, W. A., Buban, M., Choukulkar, A., Dumas, E., Hardesty, R. M., Heus, T., Ingwersen, J., Lange, D., Lee, T. R., Metzendorf, S., Muppa, S. K., Meyers, T., Newsom, R., Osman, M., Raasch, S., Santanello, J., Senff, C., Späth, F., Wagner, T., and Weckwerth, T.: A New Research Approach for Observing and Characterizing Land–Atmosphere Feedback, B. Am. Meteorol. Soc., 99, 1639–1667, https://doi.org/10.1175/BAMS-D-17-0009.1, 2018. a
https://www.fino-offshore.de/en/index.html (last access: 11 January 2021).
https://orsted.com/en/our-business/offshore-wind/wind-data (last access: 12 January 2021).