 | 03 May 2021
Urban heat islands in the Arctic cities: an updated compilation of in situ and remote-sensing estimations
Victoria Miles
Andrey Soromotin
Oleg Sizov
Mikhail Varentsov
Pavel Konstantinov
Persistent warm urban temperature anomalies – urban heat islands (UHIs) – significantly enhance already amplified climate warming in the Arctic. Vulnerability of urban infrastructure in the Arctic cities urges a region-wide study of the UHI intensity and its attribution to UHI drivers. This study presents an overview of the surface and atmospheric UHIs in all circum-Arctic settlements (118 in total) with the population larger than 3000 inhabitants. The surface UHI (SUHI) is obtained from the land surface temperature (LST) data products of the Moderate Resolution Imaging Spectroradiometer (MODIS) archive over 2000–2016. The atmospheric UHI is obtained from screen-level temperature provided by the Urban Heat Island Arctic Research Campaign (UHIARC) observational network over 2015–2018. Several other UHI studies are included for comparisons. The analysis reveals strong and persistent UHI during both summer and winter seasons. The annual mean surface UHI magnitudes vary from −0.6 ∘C (Hammerfest) to 4.3 ∘C (Murmansk). Thus, the observed UHI is likely an important climatic factor that must be included in future adjustment of urban construction, safety, and environmental quality codes.
- Article
(8916 KB) - Full-text XML
- BibTeX
- EndNote


Series of extreme climate events (forest and tundra fires, summer heat waves) in high northern latitudes attracts public attention to persistent and amplified Arctic warming. The surface air temperature is set to break a record in 2020, exceeding +35 ∘C in June–July in many places north of the polar circle. Warmer winter and summer temperatures bear significant risk of permafrost degradation, changes of hydrological balance as well as ecological threats in the region. Hjort et al. (2018) provide a detailed map of geo-technical risks for urban and transport infrastructure in relation to climate change. Khrustalyov and Davidova (2007) provide more specific estimations of reliability of building foundations in several Russian Arctic cities on permafrost in connection with global warming projections. They concluded that additional temperature rises by 0.5 ∘C (by 2050) may cause the foundation reliability coefficient to decrease by 20 %; soil bearing capacity in the Arctic cities has already decreased by 20 % to 40 % (Streletskiy et al., 2012). Economic costs in a multi-billion class are associated with warmer temperatures (Streletskiy et al., 2019). Additional warm anomalies in the urbanized areas – urban heat islands (UHIs) – are not accounted for in the vulnerability and climate change studies. Studies of Siberian (Miles and Esau, 2017; Konstantinov et al., 2018), Fennoscandian (Varentsov et al., 2018; Suomi, 2018; Miles and Esau, 2020), and circum-Arctic (Esau et al., 2020) cities disclose that at present urban Arctic may have temperature anomalies that are expected by 2050 on the region-wide scale. The Arctic cities however remain severely understudied. A comprehensive recent meta-analysis and review of the global UHI studies by Zhou et al. (2018) clearly demonstrates this knowledge gap. Our study presents the surface UHI in all Arctic cities as well as an updated compilation of the remotely sensed and in situ defined UHI for several selected cities and towns.
We utilize a high spatial resolution (1 km) land surface temperature (LST) data product MOD11A2 over 2000–2016 from the MODerate-resolution Imaging Spectroradiometer (MODIS) archive. The spatial (1 km) and temporal (8 d composites) resolution of this data product is sufficient to estimate surface UHI by different methods. We developed an independent surface UHI dataset. This dataset is free to use and can be downloaded from the Arctic Data Center as described in Miles (2020). The dataset covers all Arctic cities and towns with the population of more than 3000 inhabitants. Urban et al. (2013) evaluated accuracy of the MODIS and other LST datasets against in situ observations in northern high latitudes. The study concludes that the MODIS data have a high accuracy with the mean difference ranging from 0.82 K (woodland) to 1.79 K (shrubland). The surface UHI by Chakraborty and Lee (2019) utilizes the same MODIS archive but a different detection method, which miss or render irrelevant many Arctic urban areas.
In situ data in our compilation are taken from a Urban Heat Island Arctic Research Campaign (UHIARC; available from http://urbanreanalysis.ru/uhiarc.html, last access: 2 May 2021) network and published urban climate studies. The UHIARC is a dense observational network of screen-level (i.e. placed approximately at 2 m above ground) temperature loggers (iButton) and automatic weather stations (Davis Vantage Pro2) in several mid-sized cities (Apatity, Murmansk, Vorkuta, Salekhard, Nadym, Novy Urengoy, Norilsk) that was run between 2015 and 2018 (Konstantinov et al., 2018). Reported accuracy of both types of the temperature sensors is 0.5 K. The UHI intensity in the UHIARC is determined as a mean difference between urban and rural temperature observations. Varentsov et al. (2018) compared the UHI from UHIARC and the surface UHI from MODIS LST as well as from meteorological modeling in the Apatity city.
The surface UHI identification method has been detailed in Miles and Esau (2017, 2020). Using the MODIS LST data, we determine the surface UHI with a buffer-zone method (BF-UHI) as
where the maximum temperature of the city polygon is , and the mean temperature of minimally developed land (natural land use – land cover (LULC) types) outside the city is 〈TR〉; the angular brackets represent spatial averaging. Figure 2 illustrates the method in the case of Vorkuta (Russia). The buffer-zone method is robust and popular in comparative urban climate studies (e.g., Zhao et al., 2014; Li et al., 2017). The obtained surface UHI magnitude is insensitive to the amount of urban and rural pixels (Tan and Li, 2015). The Chakraborty and Lee (2019) method (SUE-UHI) defines ΔT as the difference between the averaged LST over all urban and all non-urban LULC pixels (excluding water pixels) within the same densely populated “urban” area. The SUE-UHI method provides lower surface UHI intensity (magnitude) than the BF-UHI method because the latter utilizes not the mean but the maximum urban temperature.
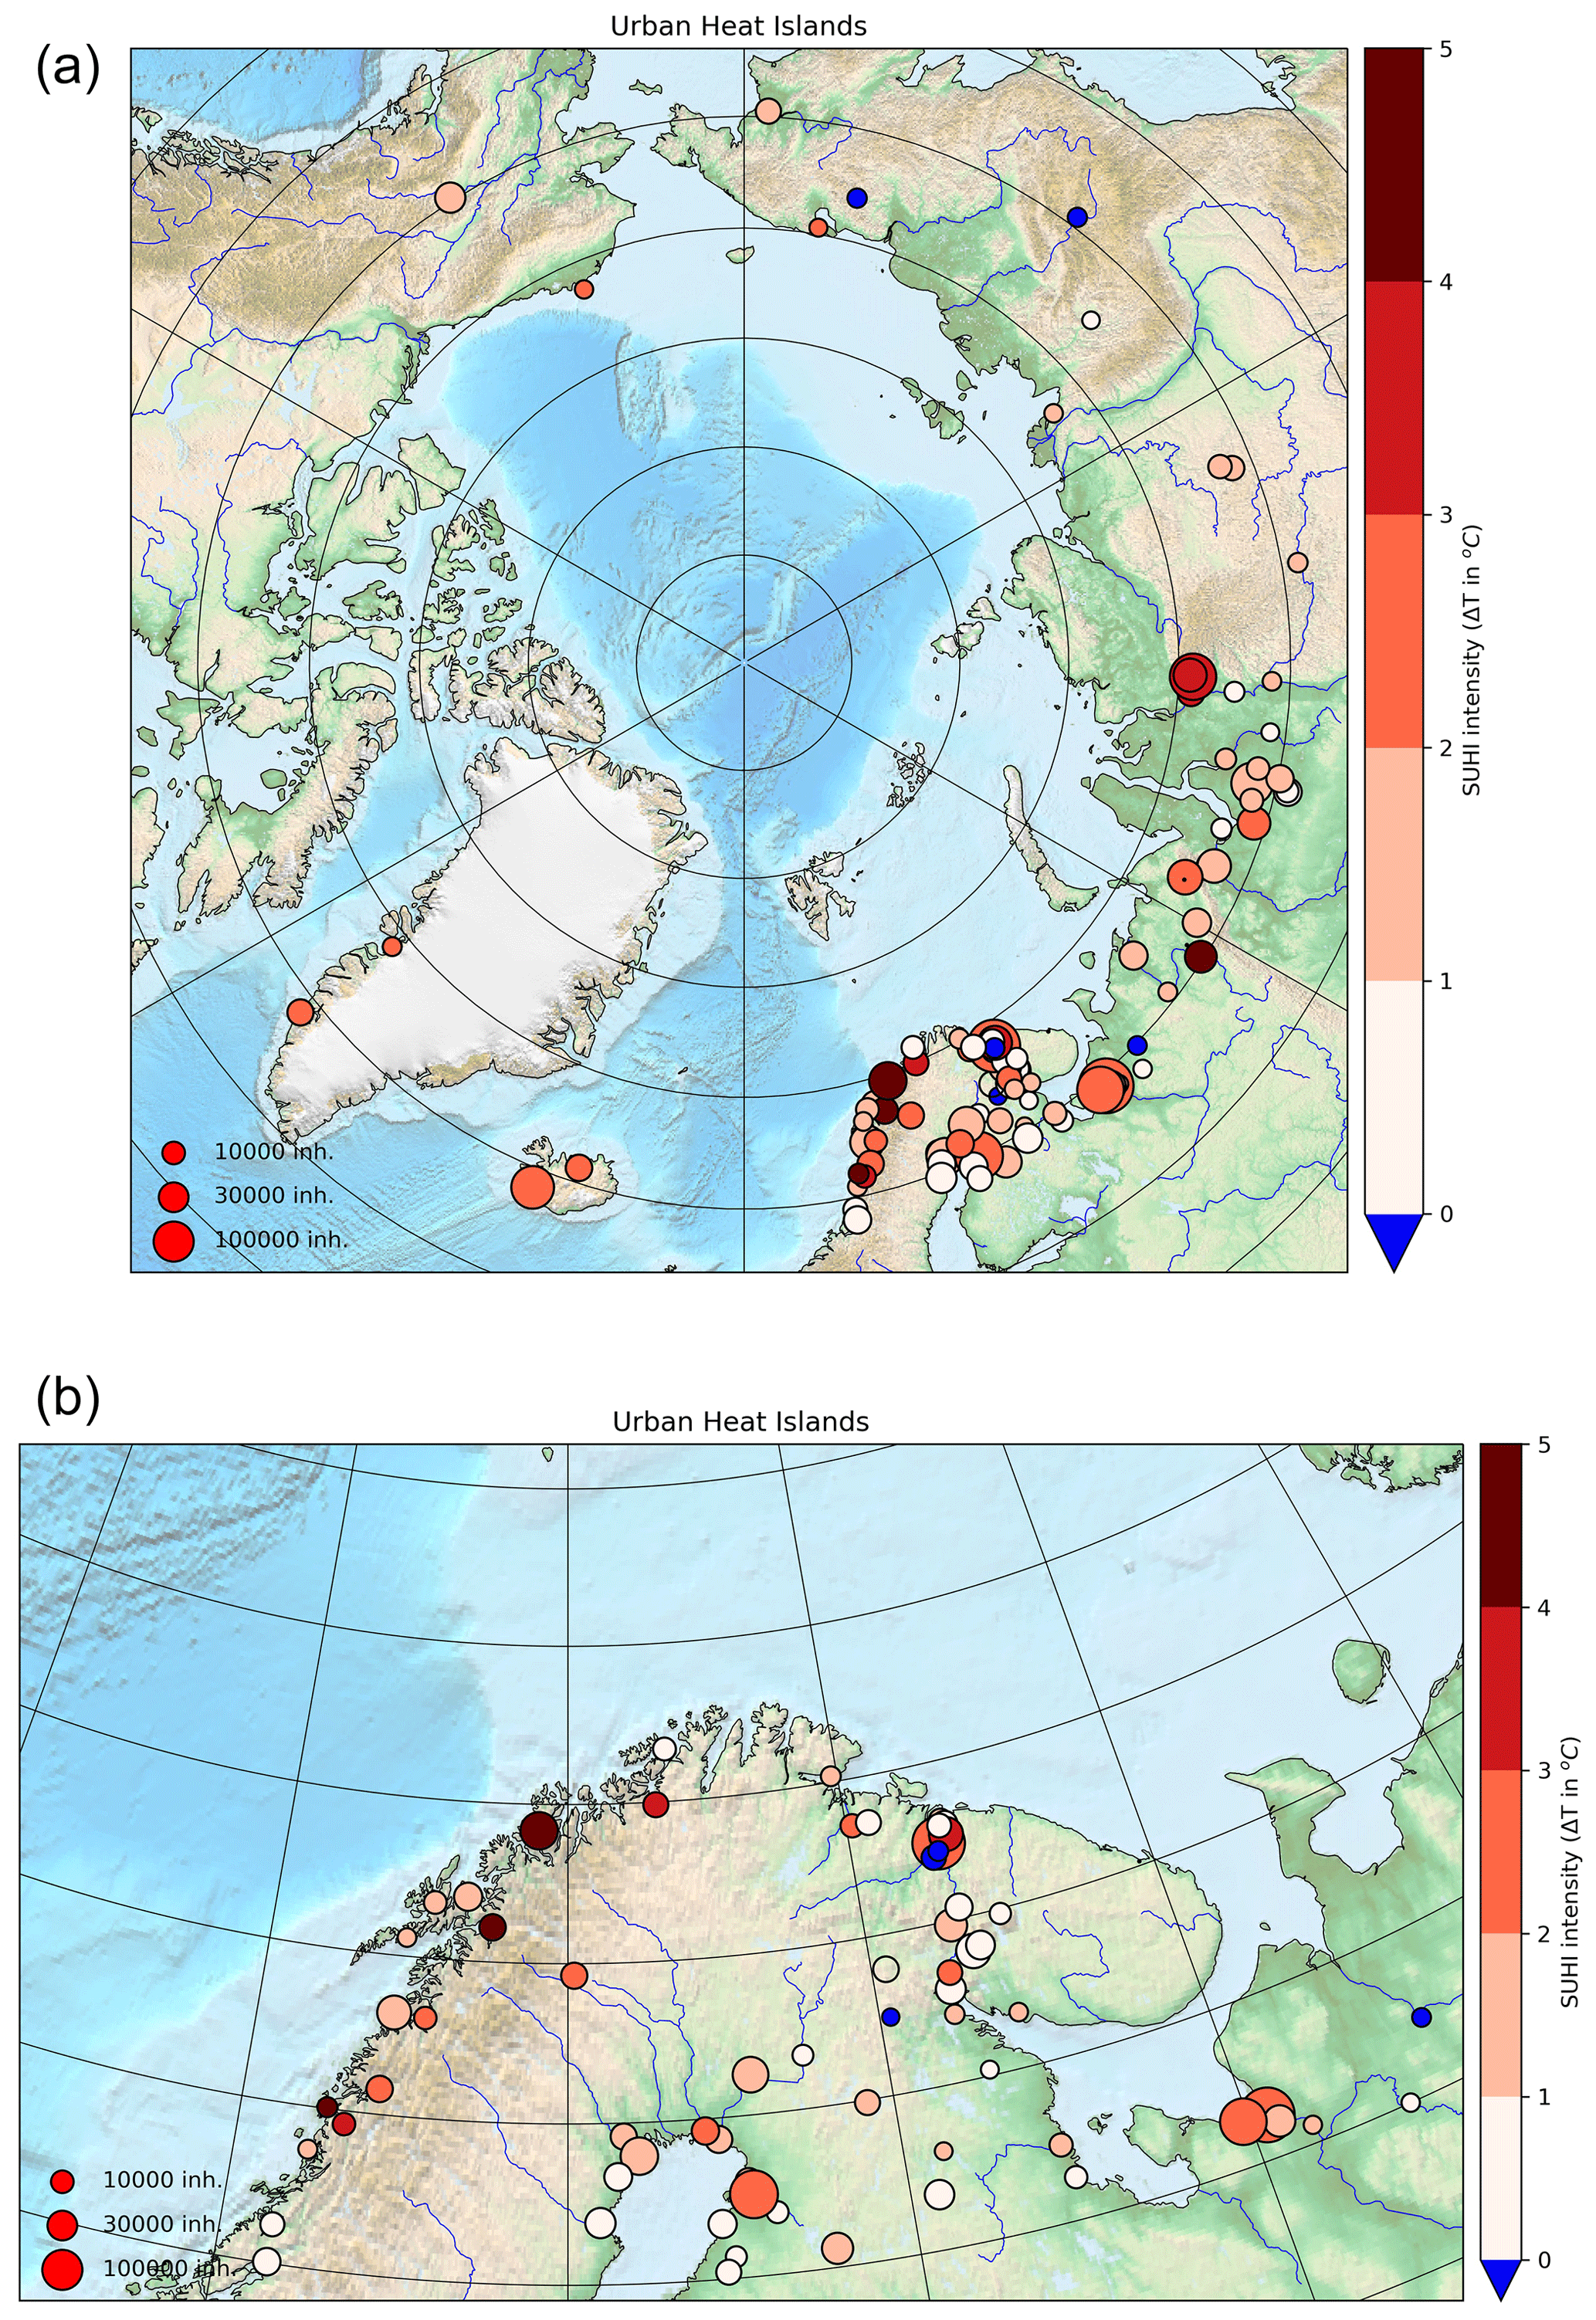
Figure 1Annual mean magnitude of the surface urban heat islands (the surface UHI intensity) in (a) 118 circum-Arctic cities with more than 3000 inhabitants, and (b) 57 Fennoscandian cities. Data: MODIS LST for 2000–2016.

Figure 2Example of the surface urban heat island in Vorkuta (Russia). Left panel: georeferenced satellite image of the city with superimposed urban boundary by the dashed line; right panel: superimposed mean winter LST in the same area. Red colours show higher temperature, blue colours – lower temperature. The warmest central urban pixels (1×1 km2) are clearly identifiable. Data: averaged MODIS LST for December–February 2000–2016. Source: Esri, Digital globe, GeoEye, Earthstar Geographics, CNES/Airbus DS, USDA, USDS, AeroGrid, IGN, and the GIS user community.
Our choice of the BF-UHI method requires certain justification. Indeed, urban climate literature provides several methods to identify and quantify the urban temperature anomalies; a choice of a specific method depends upon purposes of the study. Our BF-UHI method – the difference between the maximum urban temperature and the mean rural buffer temperature – is more adequate for estimations of evaluate environmental risks, e.g., the geotechnical hazard risk due to permafrost thaw (Hjort et al., 2018), and to guide construction codes in the urban areas. The BF-UHI method has a strong physical support. Local meteorological studies indicate that the UHI has a spatial structure of a urban dome with maximum temperatures located in the geometrically central areas. A dome-shaped temperature anomaly could be approximated with a single-parameter exponential dependence on the urban radius vector, r, (e.g., Hidalgo et al., 2010; Fan et al., 2017; Esau et al., 2019). This single parameter is the maximum urban temperature anomaly, . This universal scaling dependence allows for comparing the UHI intensities in a consistent way for such a spatially diverse objects as cities. This scaling is also valid for Vorkuta. One can see in Fig. 2 that majority of cold pixels are located on the outskirts of the city. Many cities in the Arctic are in the coastal zone. We noticed that the ocean has a cooling effect on the urban edges that may lead to underappreciation of the apparent UHI intensity. In the case of Bodø, the ocean has an impact on two urban edge pixels with the mean summer LST of 5.6 ∘C. Averaging over urban pixels will almost eliminate the UHI in Bodø, whereas the real UHI is strong in this city with the summer maximum LST in the central pixel of 10.3 ∘C. The average difference between the maximum and average LST within the urban polygon for all studied cities is 0.7 ∘C. Furthermore, the BF-UHI method is beneficial when applied to smaller cities with just a few urban pixels. It does not depreciate the surface UHI when the city polygon embeds non-urban swaths as it has been pointed out by Smoliak et al. (2015). Conversely, it does not favor any specific type of non-urban surface that might be found around, e.g., it does not favor urban forest as a dominant non-urban surface within urban boundaries.
The Arctic UHI shows rather large magnitudes of the annual mean and seasonal mean LST anomalies. We present an overview of such anomalies in the following discussion. The largest cities show the mean winter SUHI magnitude of 5.5 ∘C. Most cities (75 %) have the anomalies between 0.5 and 2.5 ∘C. The SUHI magnitude however depends on the land use – land cover type composition around the cities (Esau and Miles, 2018). Figure 1 presents the geographical distribution of the SUHIs in all 118 included settlements in the region. Table 1 provides more details for the UHI in several cities. We observe that different methods give rather different magnitudes of the atmospheric and surface UHI for each of the listed cities. However, all methods identify considerably warmer temperatures in the urban areas. Moreover, smaller towns also reveal prominent surface UHIs.
Table 1The UHI intensity in several selected Arctic cities. Data from Esau et al. (2020) and Miles and Esau (2020) updated. NA stays not “Not Applied” specifying absence of data. LULC provides information about the dominant aggregated land use – land cover (LULC) type in the buffer zones following the classification of Esau and Miles (2018). The BF-UHI values are given for 2000–2016 period; other values are given as in the respective cited works.
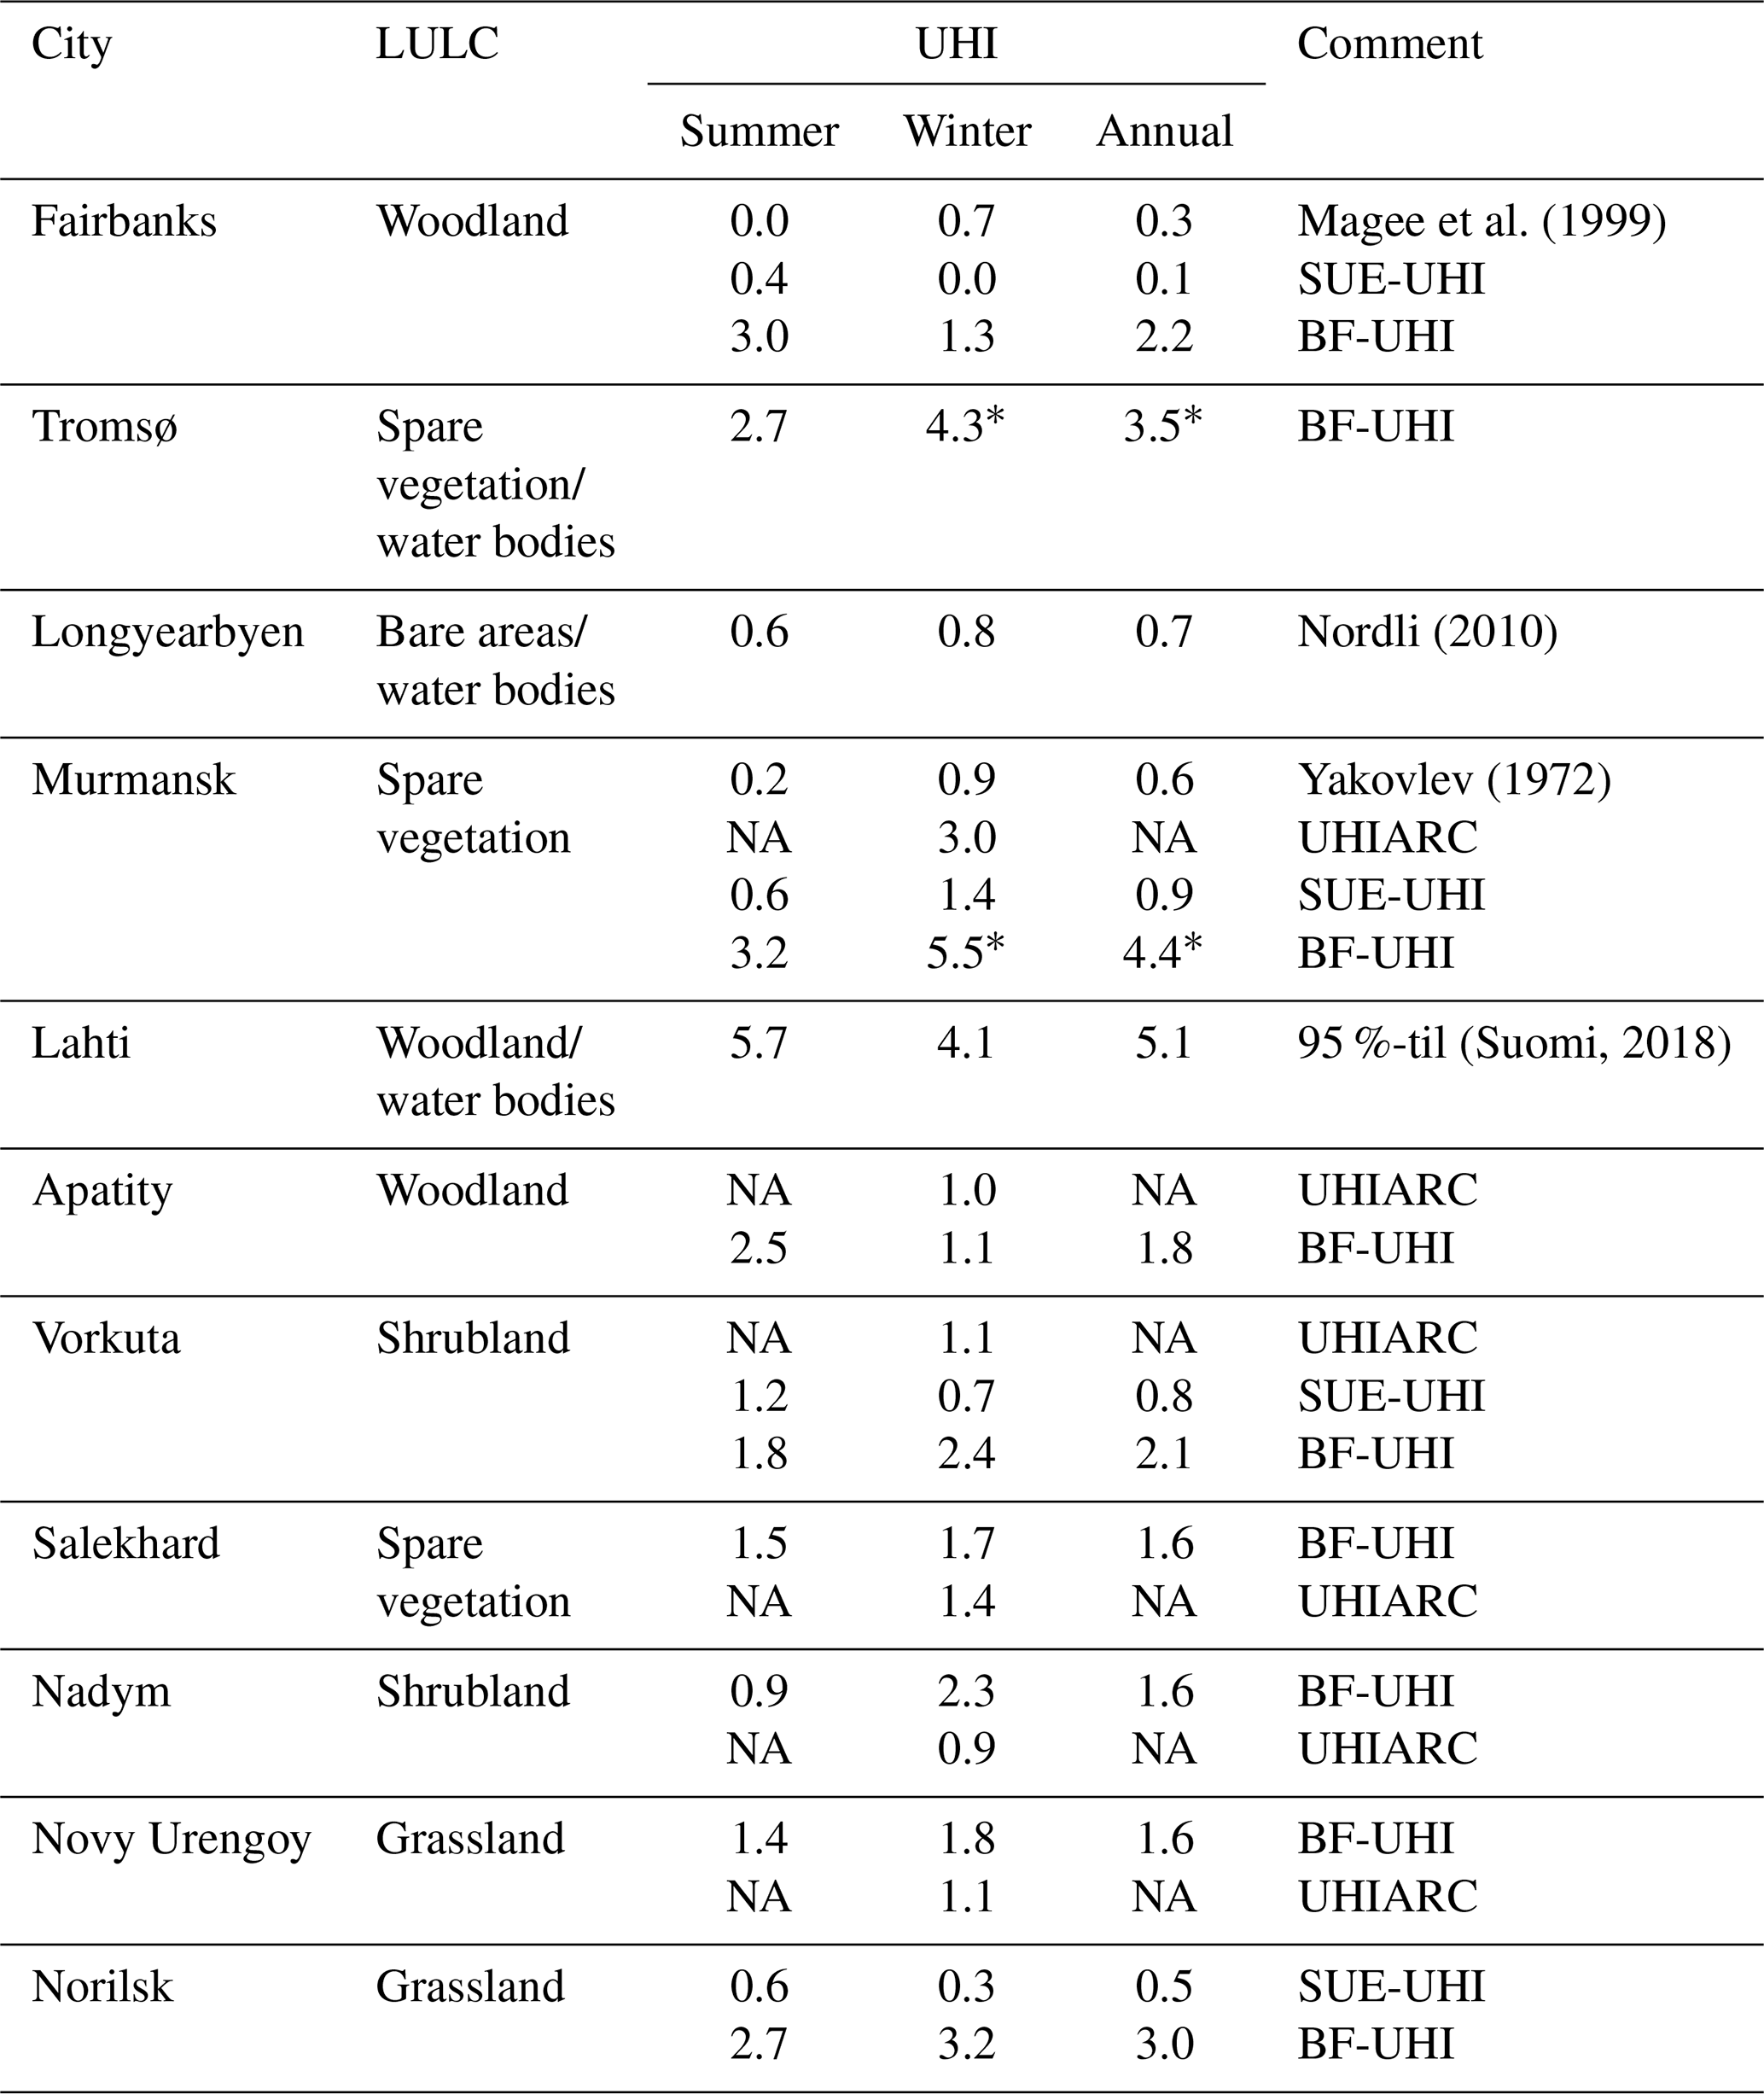
* The large SUHI is due to warm open water sea surfaces in the buffer zone.
The seasonal (winter to summer) differences in the SUHI magnitude are not as large as it could be expected extrapolating the results for temperate climate cities (Zhou et al., 2013). Studies of the temperate cities attribute the large SUHI to absorption and storage of incoming solar radiation by darker and dryer urban surfaces. Thus, the SUHI magnitude maximizes in summer when the radiation peaks. The incoming solar radiation is intense in the summertime, snow-free Arctic. Snow cover and low solar angles in the wintertime Arctic make it insignificant energy source. Simultaneously, low temperatures require intensive heating with the anthropogenic heat release of 50 W m−2 or more (Varentsov et al., 2018), which in combination with the trapping surface-layer inversions (Davy and Esau, 2016) is sufficient to support the observed UHI magnitudes. The SUHI magnitude does not show a strong direct correlation with the city population; the coefficient of determination is 0.62–0.65 (Miles and Esau, 2017, 2020).
Our overview reveals no simple homogeneous dependence between SUHI intensity and geographical or climate factors in the Arctic. Even urban agglomerations, such as those around Murmansk, Apatity and Oulu (Fig. 1b), are composed of towns with very different SUHI. Explanatory power of the Manoli et al. (2019) model is also low in the Arctic climate. The in situ UHIARC observations suggest that trapping of urban heat in shallow atmospheric boundary layers plays an important role in shaping the urban temperature anomalies (Davy and Esau, 2016; Konstantinov et al., 2018). Extensive literature reviews that were compiled for our study (with attention to the Arctic cities) as well as one more general found in Zhou et al. (2018) reveal scarcity and fragmentation of the in situ UHI studies in cold climates.
We derived the surface UHI (SUHI) in all Arctic cities and towns with more than 3000 inhabitants. The study reveals that the SUHI magnitudes are rather large – comparable with those in significantly larger low- and mid-latitude cities. A comprehensive meta-review could be found in Brozovsky et al. (2020). We conclude that environmental and urban design factors scaling the Arctic SUHI intensity require more detailed studies as no obvious dependences reported to the temperate climate cities could be easily identified. At the same time, the MODIS dataset provides a consistent and continues information in space and time for all Artic places making the results intercomparable. These +0.5 to +4.3 ∘C annual mean LST anomalies should be added on the top of already amplified climate warming in the circum-Arctic region. In fact, the urban climate measured by the LST corresponds to the expected regional temperature change by 2040–2080 and beyond (Esau et al., 2020).
The complete dataset for this study is available from Miles (2020) or through https://doi.org/10.18739/A2TB0XW4T.
IE initiated the study, wrote the manuscript, and prepared the figures. VM designed the study, prepared Fig. 2, prepared and analysed the MODIS dataset and contributed to writing the manuscript. AS validated the analysis. OS collected the MODIS dataset. MV contributed with literature review and UHIARC analysis. PK contributed with literature review and UHIARC analysis.
The authors declare that they have no conflict of interest.
This article is part of the special issue “Applied Meteorology and Climatology Proceedings 2020: contributions in the pandemic year”.
Authors appreciate insightful comments from reviewers that helped us to improve the study and its presentation. Authors thanks Alexander Baklanov (WMO) for constructive discussions and long time support of the study.
This research has been supported by the Belmont Forum (grant no. 1729) and two related grants from the Norwegian Research Council (grant no. 311986) and the Russian Foundation for Basic Research (grant no. 20-55-71004).
This paper was edited by Arianna Valmassoi and reviewed by three anonymous referees.
Brozovsky, J., Gaitani, N., and Gustavsen, A.: A systematic review of urban climate research in cold and polar climate regions, Renew. Sustain. Energ. Rev., 138, 110551, https://doi.org/10.1016/j.rser.2020.110551, 2020.
Chakraborty, T. and Lee, X.: A simplified urban-extent algorithm to characterize surface urban heat islands on a global scale and examine vegetation control on their spatiotemporal variability, Int. J. Appl. Earth Obs. Geoinform., 74, 269–280, https://doi.org/10.1016/j.jag.2018.09.015, 2019.
Davy, R. and Esau, I.: Differences in the efficacy of climate forcings explained by variations in atmospheric boundary layer depth, Nat. Commun., 7, 11690, https://doi.org/10.1038/ncomms11690, 2016.
Esau, I. and Miles, V.: Exogenous drivers of surface urban heat islands in northern West Siberia, Geogr. Environ. Sust., 11, 83–99, https://doi.org/10.24057/2071-9388-2018-11-3-83-99, 2018.
Esau, I., Miles, V., Varentsov, M., Konstantinov, P., and Melnikov, V.: Spatial structure and temporal variability of a surface urban heat island in cold continental climate, Theor. Appl. Climatol., 137, 2513–2528, https://doi.org/10.1007/s00704-018-02754-z, 2019.
Esau, I., Varentsov, M., Laruelle, M., Miles, M. W., Konstantinov, P., Soromotin, A., Baklanov, A. A., and Miles, V. V.: Warmer Climate of Arctic Cities, in: The Arctic: Current Issues and Challenges, edited by: Pokrovsky, O., Kirpotin, S., and Malov, A., NOVA Publishers, New York, NY, USA, 2020.
Fan, Y., Li, Y., Bejan, A., Wang, Y., and Yang, X.: Horizontal extent of the urban heat dome flow, Sci. Rep., 7, 11681, https://doi.org/10.1038/s41598-017-09917-4, 2017.
Hidalgo, J., Masson, V., and Gimeno, L.: Scaling the Daytime Urban Heat Island and Urban-Breeze Circulation, J. Appl. Meteorol. Clim., 49, 889–901, https://doi.org/10.1175/2009jamc2195.1, 2010.
Hjort, J., Karjalainen, O., Aalto, J., Westermann, S., Romanovsky, V. E., Nelson, F. E., Etzelmüller, B., and Luoto, M.: Degrading permafrost puts Arctic infrastructure at risk by mid-century, Nat. Commun., 9, 5147, https://doi.org/10.1038/s41467-018-07557-4, 2018.
Khrustalyov, L. N. and Davidova I. V.: Forecast of climate warming and account of it at estimation of foundation reliability for buildings in permafrost zone, Earth Cryosphere, 11, 68–75, 2007.
Konstantinov, P., Varentsov, M., and Esau, I.: A high density urban temperature network deployed in several cities of Eurasian Arctic, Environ. Res. Lett., 13, 075007, https://doi.org/10.1088/1748-9326/aacb84, 2018.
Li, X., Zhou, Y., Asrar, G. R., and Zhu, Z.: The surface urban heat island response to urban expansion: A panel analysis for the conterminous United States, Sci. Total Environ., 605–606, 426–435, https://doi.org/10.1016/j.scitotenv.2017.06.229, 2017.
Magee, N., Curtis, J., and Wendler, G.: The Urban Heat Island Effect at Fairbanks, Alaska, Theor. Appl. Climatol., 64, 39–47, 1999.
Manoli, G., Fatichi, S., Schläpfer, M., Yu, K., Crowther, T. W., Meili, N., Burlando, P., Katul, G. G., and Bou-Zeid, E.: Magnitude of urban heat islands largely explained by climate and population, Nature, 573, 55–60, https://doi.org/10.1038/s41586-019-1512-9, 2019.
Miles, V.: Arctic surface Urban Heat Island (UHI), MODIS Land Surface Temperature (LST) data, 2000–2016, Arctic Data Center, https://doi.org/10.18739/A2TB0XW4T, 2020.
Miles, V. and Esau, I.: Seasonal and Spatial Characteristics of Urban Heat Islands (UHIs) in Northern West Siberian Cities, Remote Sens., 9, 989, https://doi.org/10.3390/rs9100989, 2017.
Miles, V. and Esau, I.: Urban Climate Surface urban heat islands in 57 cities across different climates in northern Fennoscandia, Urban Clim., 31, 100575, https://doi.org/10.1016/j.uclim.2019.100575, 2020.
Nordli, Ø.: The Svalbard Airport, Bull. Geogr.-Phys. Geogr. Ser., 3, 5–25, 2010.
Smoliak, B. V., Snyder, P. K., Twine, T. E., Mykleby, P. M., and Hertel, W. F.: Dense Network Observations of the Twin Cities Canopy-Layer Urban Heat Island, J. Appl. Meteorol. Clim., 54, 1899–1917, https://doi.org/10.1175/jamc-d-14-0239.1, 2015.
Streletskiy, D. A., Shiklomanov, N. I., and Nelson, F. E.: Permafrost, Infrastructure, and Climate Change: A GIS-Based Landscape Approach to Geotechnical Modeling, Arct. Antarct. Alp. Res., 44, 368–380, https://doi.org/10.1657/1938-4246-44.3.368, 2012.
Streletskiy, D. A., Suter, L. J., Shiklomanov, N. I., Porfiriev, B. N., and Eliseev, D. O.: Assessment of climate change impacts on buildings, structures and infrastructure in the Russian regions on permafrost, Environ. Res. Lett., 14, 025003, https://doi.org/10.1088/1748-9326/aaf5e6, 2019.
Suomi, J.: Extreme temperature differences in the city of Lahti, southern Finland: Intensity, seasonality and environmental drivers, Weather Clim. Extrem., 19, 20–28, https://doi.org/10.1016/j.wace.2017.12.001, 2018.
Tan, M. and Li, X.: Quantifying the effects of settlement size on urban heat islands in fairly uniform geographic areas, Habitat Int., 49, 100–106, https://doi.org/10.1016/j.habitatint.2015.05.013, 2015.
Urban, M., Eberle, J., Hüttich, C., Schmullius, C., and Herold, M.: Comparison of Satellite-Derived Land Surface Temperature and Air Temperature from Meteorological Stations on the Pan-Arctic Scale, Remote Sens., 5, 2348–2367, https://doi.org/10.3390/rs5052348, 2013.
Varentsov, M., Konstantinov, P., Baklanov, A., Esau, I., Miles, V., and Davy, R.: Anthropogenic and natural drivers of a strong winter urban heat island in a typical Arctic city, Atmos. Chem. Phys., 18, 17573–17587, https://doi.org/10.5194/acp-18-17573-2018, 2018.
Yakovlev, B. A.: The climate of Murmansk, Gidrometeoizdat, Leningrad, 108 pp., 1972.
Zhao, L., Lee, X., Smith, R. B., and Oleson, K.: Strong contributions of local background climate to urban heat islands, Nature, 511, 216–219, https://doi.org/10.1038/nature13462, 2014.
Zhou, B., Rybski, D., and Kropp, J. P.: On the statistics of urban heat island intensity, Geophys. Res. Lett., 40, 5486–5491, https://doi.org/10.1002/2013GL057320, 2013.
Zhou, D., Xiao, J., Bonafoni, S., Berger, C., Deilami, K., Zhou, Y., Frolking, S., Yao, R., Qiao, Z., and Sobrino, J.: Satellite Remote Sensing of Surface Urban Heat Islands: Progress, Challenges, and Perspectives, Remote Sens., 11, 48, https://doi.org/10.3390/rs11010048, 2018.