 | 17 Jun 2021
Full flowering phenology of apple tree (Malus domestica) in Pūre orchard, Latvia from 1959 to 2019
Gunta Kalvāne
Zane Gribuste
Andis Kalvāns
The Pūre orchard is one of the oldest apple orchards in the Baltic, where thousands of varieties of fruit trees from throughout the world are grown and tested. Over time, a huge knowledge base has been accumulated, but most of the observational data are stored in archives in paper format. We have digitized a small part of the full flowering phenological data of apple trees (Malus domestica) over the period of 1959 to 2019 for 17 varieties of apple trees, a significant step for horticulture and agricultural economics in Latvia. Climate change has led to significant changes in the phenology of apple trees as all varieties, autumn, summer and winter, have begun to flower earlier: from 2002 to 2019, on average full flowering was recorded to have taken place around 21 May, whereas for the period 1959–1967 it occurred around 27–28 May.
To develop better-quality phenological predictions and to take account of the fragmentary nature of phenological data, in our study we assessed the performance of three meteorological data sets – gridded observation data from E-OBS, ERA5-Land reanalysis data and direct observations from a distant meteorological station – in simple phenological degree-day models. In the first approximation, the gridded E-OBS data set performs best in our phenological model.
- Article
(1168 KB) - Full-text XML
- BibTeX
- EndNote


Agriculture, including horticulture, plays an important role in the economy of Latvia and Europe as a whole. Ongoing and predicted climate change has had and will have a significant impact on agricultural management, policies, yields and, of course, phenology. Phenological changes in the growth period of the varieties of apple tree (Malus domestica) studied have been recorded in eastern and northern Europe (Kalvāne, 2011; Rivero et al., 2017; Romanovskaja and Bakšienė, 2020; Woznicki et al., 2019; Kondratenko and Kondratenko, 2015), where the present study area is located, as well elsewhere in Europe and throughout the world (Chmielewski et al., 2004; Legave et al., 2008; Menzel et al., 2020; Miller-Rushing et al., 2007).
In the study we have (1) digitized a small part of the full flowering phenological data of apple trees (Malus domestica) over the period from 1959 to 2019 for the Pūre orchard, one of the oldest apple orchards in the Baltics; (2) described phenological trends for 17 apple varieties in Latvia, classifying them according to their harvesting maturity: summer, autumn and winter apple varieties; (3) assessed (with the understanding that the main driver of flowering is meteorological parameters) three sets of meteorological data (gridded E-OBS, ERA5-Land reanalysis and direct meteorological observations) in phenological models.
Horticulture in Latvia has immense potential, provides information on the impact of climate change, including for modelling of future climate scenarios based on phenological data, and can contribute to the further development of the Latvian economy.
This study uses data on apple phenology collected and compiled by researchers of the Pūre Horticultural Research Centre from 1959 to 2019 (consisting of field notes and reports through 2002, including data gaps; after 2002 data recorded digitally). The full flowering phase was recorded when 80 % all flowers are open examining the state of up to 5 trees for each cultivar. The observations are along a transect every two to three days.
Full flowering phenology of 17 apple cultivars, which were classified according to the readiness of fruit harvest, summer, autumn and winter apple cultivars.
The data set however was not a complete time series – it has two major gaps from 1968 to 1975 and 1988 to 2001. The breaks in data series were due to political reasons, and changes in the authorities responsible for Pūre orchard. We grouped the available observations into three sub-periods: I, 1959–1967; II, 1976–1987; III, 2002–2019. Data processing was done in the R environment (R Core Team, 2020), particularly using the tidyverse set of packages (Wickham et al., 2019).
The direct meteorological observations (air temperature) were obtained from the Stende Meteorological Station (data source: Latvian Environment, Geology and Meteorology Centre). In addition the E-OBS grided meteorological dataset (Cornes et al., 2018), version 21.0e and ERA5-Land reanalysis (Muñoz Sabater, 2019) for the orchard location was examined.
The results of the two model fitting scenarios are presented here. First, we compared three sources of 2 m air temperature: gridded daily temperature from the E-OBS data set version 21.0e (Cornes et al., 2018), ERA5-Land reanalysis (Muñoz Sabater, 2019) and direct observations from nearest meteorological station located at Stende, about 25 km NW of the Pūre orchard. Full flowering dates of four apple tree varieties with the most overlapping observations (18) were used. We considered observations from 1981 to 2019, excluding 2010 to 2012, when data from the Stende station were not available.
Second, we examined the air temperature data sources to find that which yielded the best results for estimation of model parameters for full flowering dates and the full set of available phenological data, regardless of variety.
A simple degree-day phenological model was used assuming the sinusoidal fluctuation of daily temperature, largely following the methodology used by Kalvāns et al. (2015). The phase onset was expected to take place upon reaching the sum of a certain active temperature (above base temperature Tb) – degree-days (DD) – accumulated from 1 January of the respective year (see Kalvāns et al., 2015, DDcos model description for more details). For each modelling scenario, 100 instances of the GenSA calibration algorithm (Xiang et al., 2013) with random initial parameters in the R environment (R Core Team, 2020) were invoked using approximately half of the randomly sampled observation data for model calibration and the other half for model skill estimation. The model was optimized for the root mean squared error (RMSE). In addition, mean error (MA) and mean absolute error (MAE) were calculated.
3.1 Phenological changes of Malus domestica
Changes in meteorological parameters in Latvia have had an impact on both wild and crop phenology (Kalvāne and Kalvāns, 2021) including at the Pūre orchard. Air temperatures in Latvia increased by 0.7 ∘C between 1961 and 2010; the most significant changes were found for the winter and spring seasons (Avotniece et al., 2017), which have had the most direct impact on plants' phenological development. For the reference period from 1981 to 2010 the average air temperature was 6.37 ∘C with warming trend of 0.4 ∘C in 10 years. The average precipitation was 671 mm/yr and rather evenly spread across the seasons. The average spring (March, April, May) temperature was 5.2 ∘C, with warming trend about 0.2 ∘C in 10 years. The coldest month on average was February (−2.91 ∘C), while July was the warmest (17.3 ∘C). The changes in precipitation regime are rather obscure.
Although apple ripening times vary by cultivar, the full flowering time for all varieties occurs almost simultaneously: in the last week of May, over an interval of 4–5 d. Comparing the median full flowering dates in the sub-periods, it appears that in recent decades, the full flowering of apple trees has taken place earlier: the full flowering took place on 28 May (148 d of the year) in the first sub-period (1959–1967), while it took place on 21 May (142 d of the year) for 2002–2019 (Fig. 1).
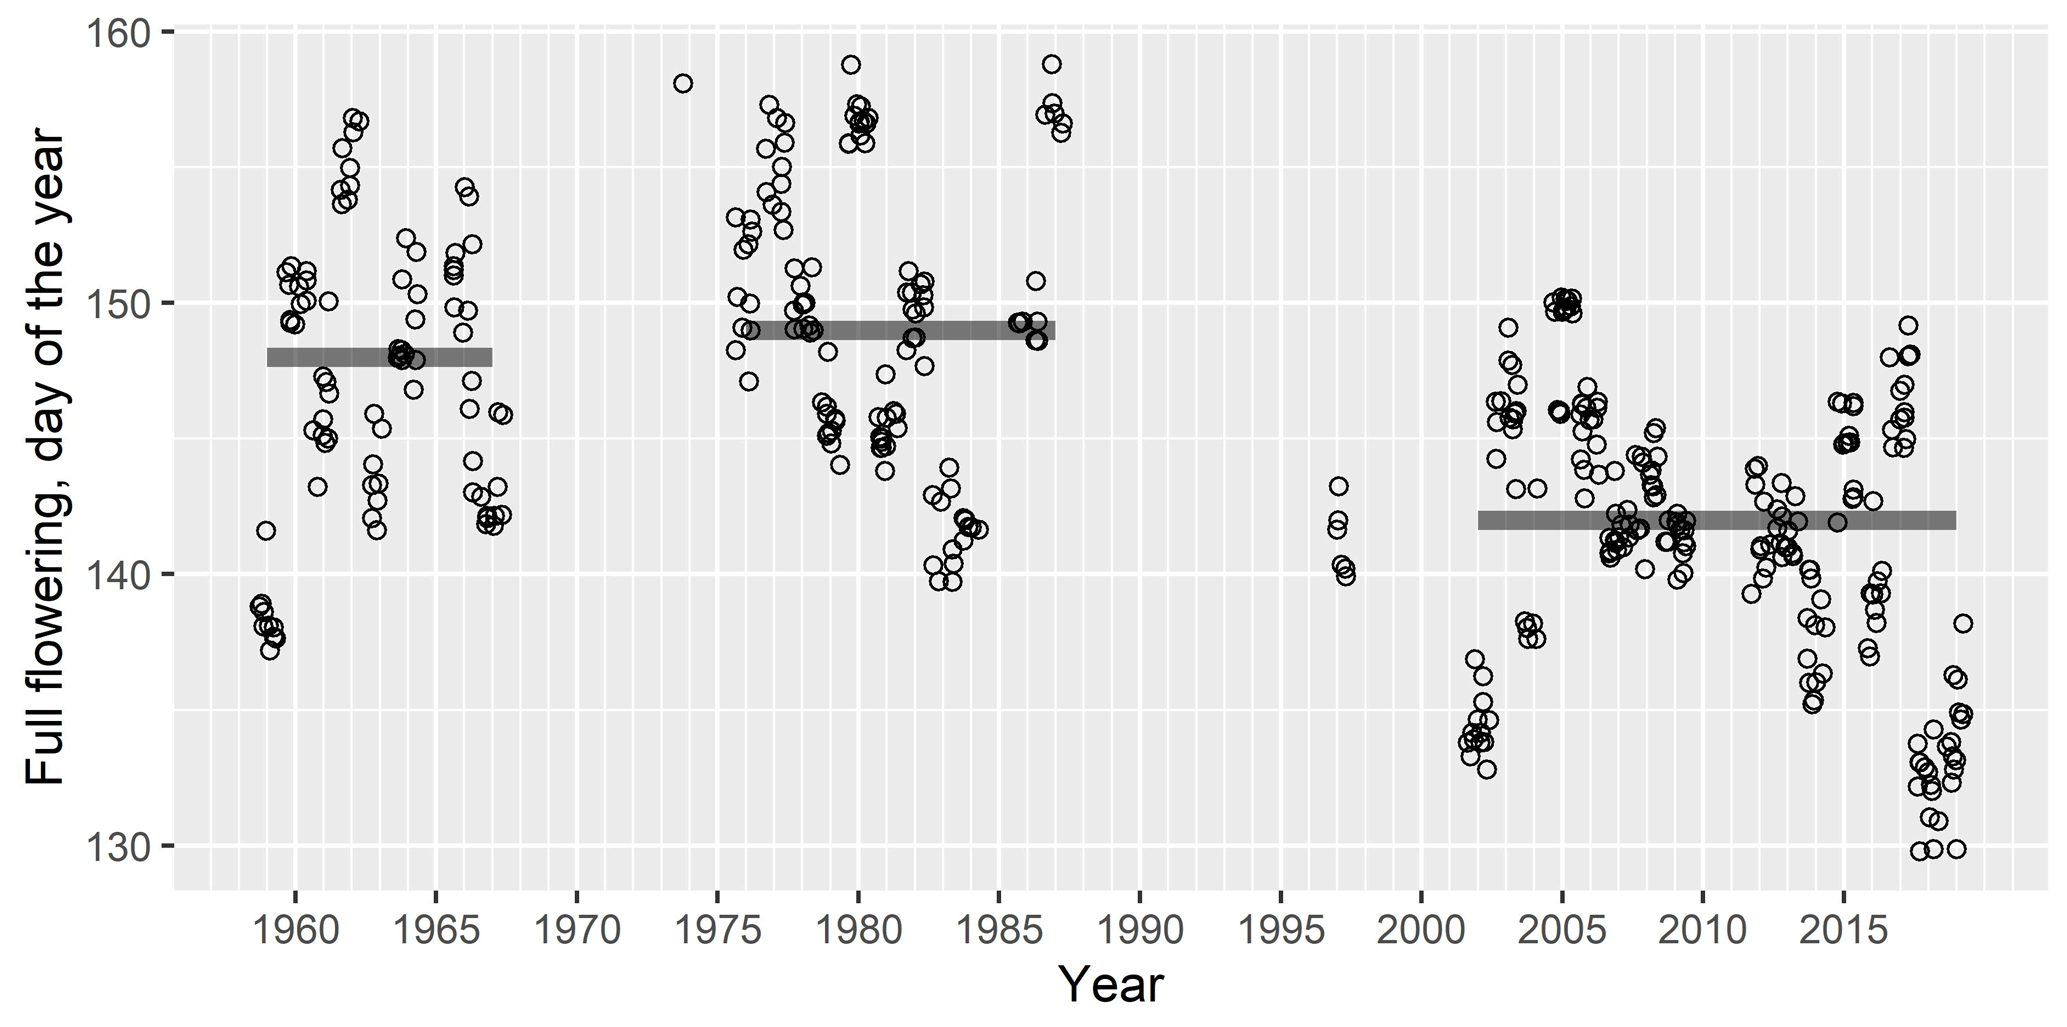
Figure 1Short- and long-term fluctuations in full flowering of Malus domestica at the Pūre orchard (1959–2019). Circles – observations of different varieties; horizontal lines – median values for each sub-period; gaps in data set are due to lack of observations for specific time periods.
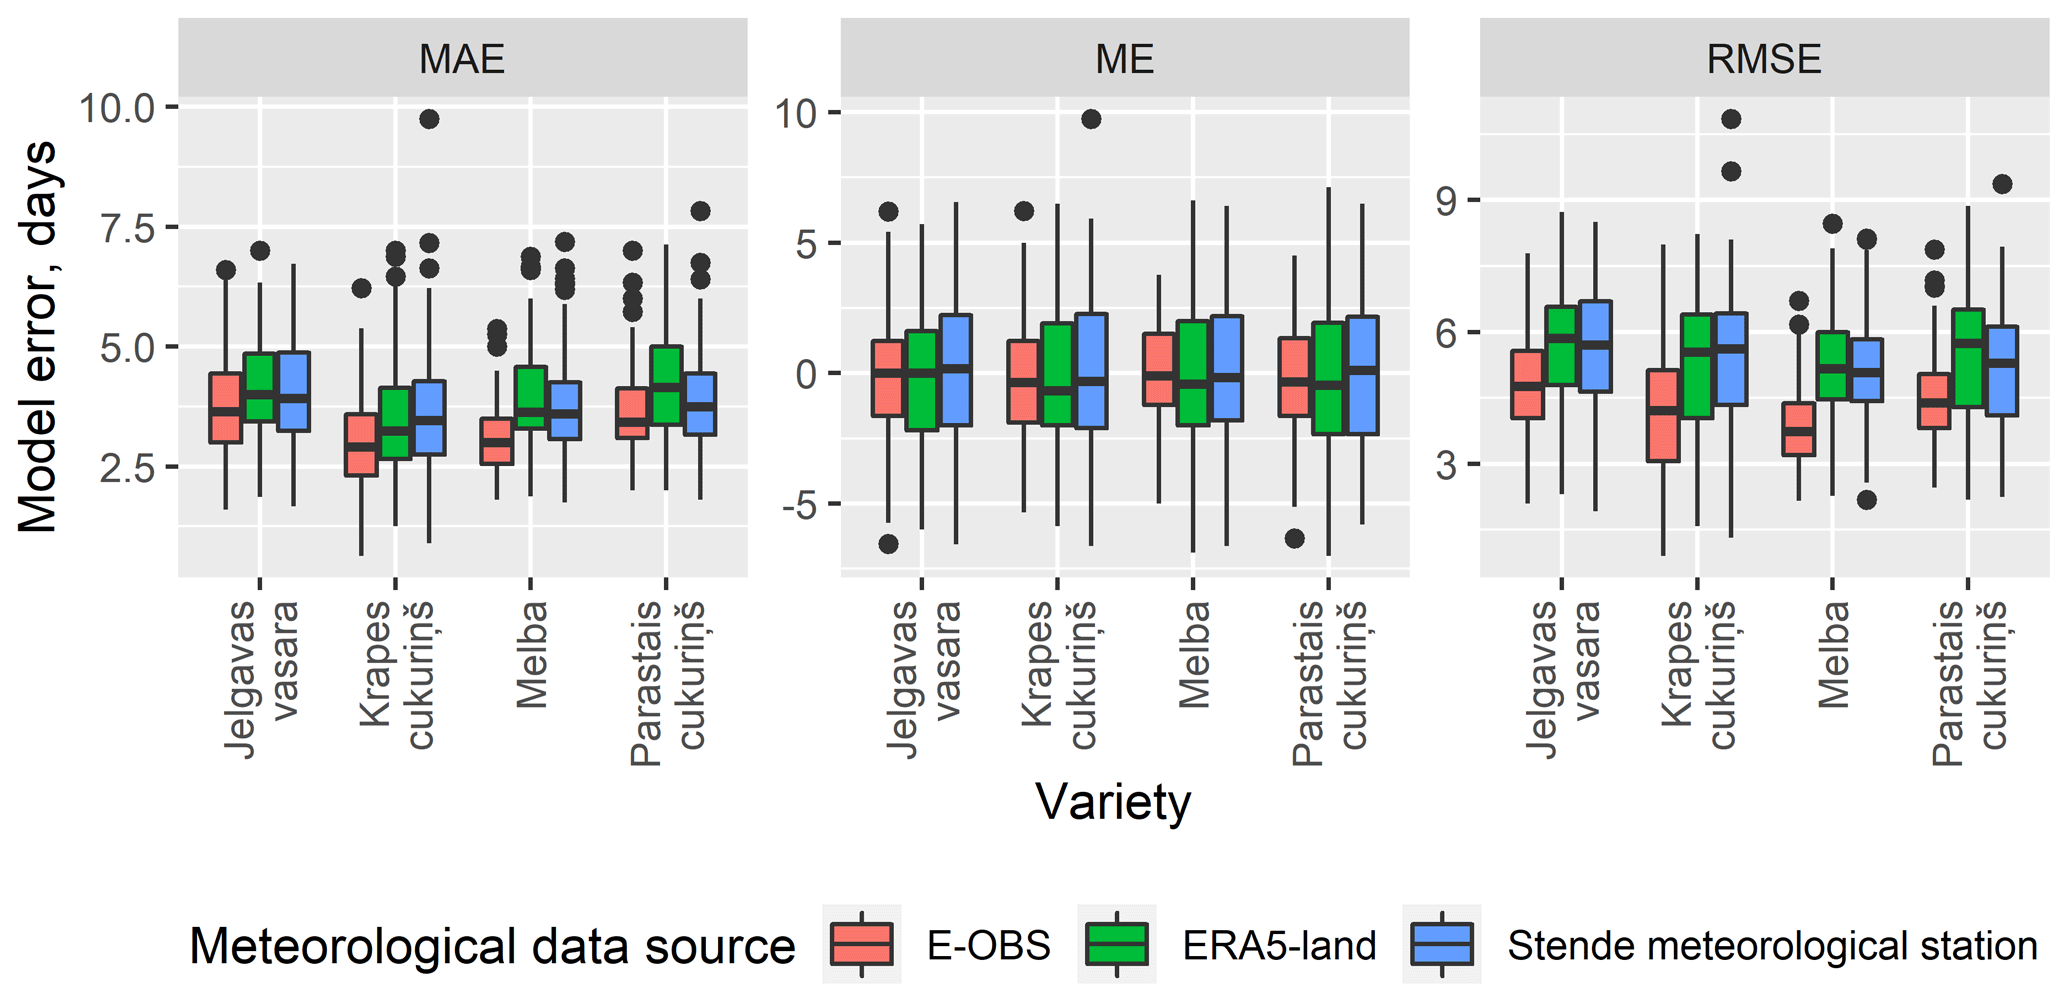
Figure 2Results of model calibration ensemble for four apple tree varieties (Jelgavas vasaras, Krapes cukurins, Melba and Parastais cukurins – all summer apples) with the most overlapping observations and three air temperature data sources: MAE – mean absolute error; ME – mean error; RMSE – root mean squared error. Model was calibrated to minimise the RMSE.
There was large year to year variation of full bloom dates, particularly, warmest years stand out from the average, as observed elsewhere as well (Miller-Rushing et al., 2007). Significant long-term changes have been observed. The trend of earlier full flowering is noted across all apple varieties, and in the last period (2002–2019), it is much more pronounced: the change (slope value) is −0.32 d/yr (p-value < 0.001).
Plant development in the territory of Latvia is mainly driven by air temperature as well as precipitation regime. We performed a correlation analysis of monthly average air temperature and precipitation amount with full flowering times. Although apple flowering at the Pūre orchard occur in May, full flowering is even affected by the March temperature regime (for some winter varieties), although obviously the April and May temperature regimes play a greater role.
The chilling effects on apple tree flowering was not examined, however, no significant impact of delayed chilling on spring phenology of bird cherry (Padus racemosa) – a species in the same family as apple tree – in the study region was found previously (Kalvāns et al., 2015). Given the prevalence of moderate (around freezing) temperatures during autumn and winter it is unlikely that the inadequate chilling would influence the spring phenology.
3.2 Phenological modelling for orchard
We performed an application-driven comparison of three meteorological data sources: E-OBS, ERA-5-Land and temperature observations from the 25 km distant meteorological station at Stende. The phenological model driven by the E-OBS daily minimum and maximum temperature performed better in term of RMSE, MAE and ME than the same model driven by other data sources.
The difference between the median RMSE for three meteorological data sources was up to 1.3 d or 22 %, and the E-OBS data set outperformed the ERA5-Land observations from nearby Stende meteorological station (Fig. 2).
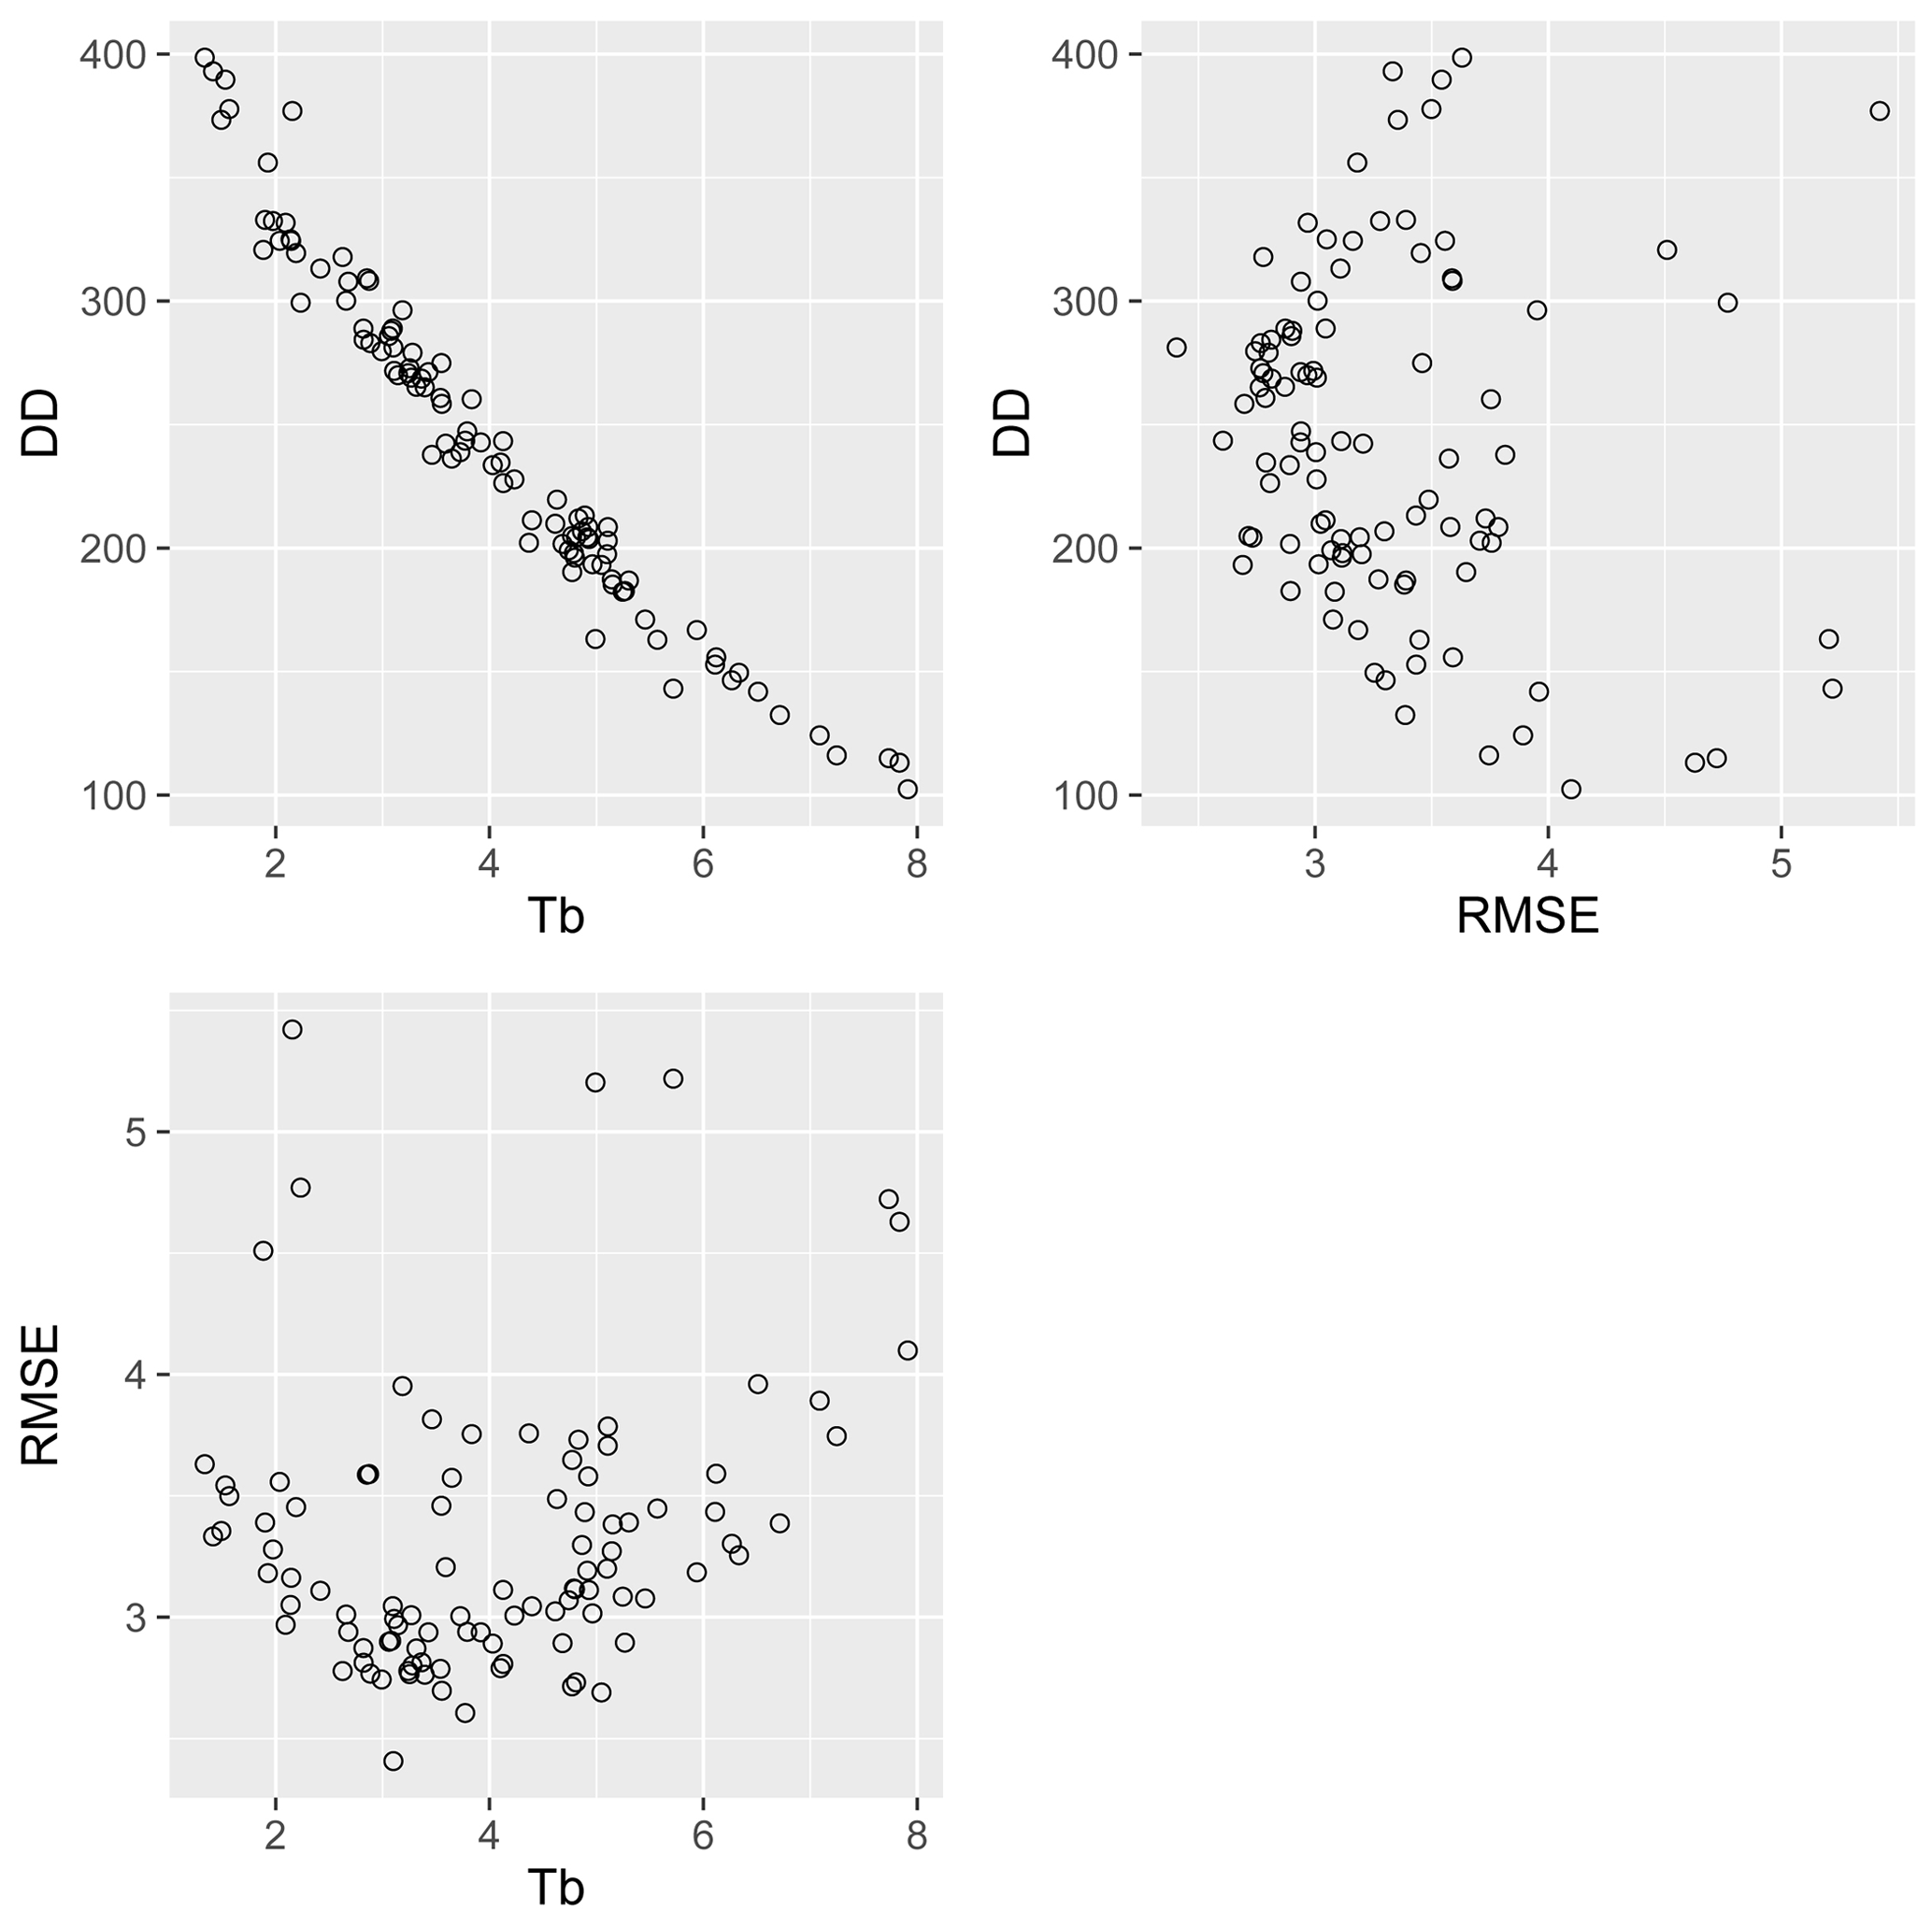
Figure 3Distribution of fitted model parameters (Tb – base temperature and DD – degree-days) and associated RMSE (root mean squared error): results from individual calibration runs using randomly selected half of the observations for model calibration and the other half for validation.
We found that the most appropriate base temperature (Tb) for the phenological degree-day model, assuming sinusoidal distribution of daily temperature (see the DDcos model of Kalvāns et al., 2015, for more details), was between 2.6 to 5.0 ∘C, with temperature sum of 300 to 203 degree-days (Fig. 3). Applying the model to full data set the least RMSE was obtained with base temperature (Tb) 3.1 ∘C and 281 degree-days (DD).
Changes in the phenology of fruit trees are found across Europe – bud development, leafing and flowering are starting earlier, extending the growing season (European Environment Agency, 2017; Fujisawa and Kobayashi, 2010; Legave et al., 2015).
The phenology of apple tree flowering at the Pūre orchard, Latvia, has changed significantly – the full flowering phase for the 17 most horticulturally and economically important species began earlier in recent decades than at the beginning of the observation period, in the 1960s (in the period from 2002 to 2019, the slope value is −0.32 d/yr). Considering that the location of the orchard and the observation methodology have not changed, we can assume that the most important influencing factor is climate change.
It is well established that air temperature is the main driving factor in spring phenology (Chmielewski et al., 2004; Woznicki et al., 2019). We tested three meteorological data sources – E-OBS gridded observation data, ERA5-Land reanalysis data and meteorological station data – to see which would yield the most accurate phenological model. All these datasets have previously been used in phenological models (for example, ERA5 reanalysis by Oses et al., 2020; Stöckli et al., 2011 and E-OBS by Czernecki et al., 2018; Wang et al., 2016). We obtained best results using the E-OBS gridded meteorological data set. However, our analysis was limited to a single site using only the daily minimum and maximum temperature, not considering precipitation. Thus, the finding is not universal, however it provides guidance for future work for selecting data sources for meteorology-driven spatially distributed modelling tasks.
We found that, for the phenological degree-day model of apple tree full flowering, the optimal base temperature (Tb) was 3.1 ∘C and cumulative heat sum (DD) 281 degree-days. However base temperature values between 2.6 and 5.0 ∘C (corresponding to 300 and 203 degree-days) produced comparably good results. The obtained results allow for better assessment of the impact of climate change and for better modelling of future climate scenarios and can contribute to the development of adaptation mechanisms and strategies in the context of climate change.
The examined apple tree flowering phenology data and R-script is available at Zenodo repository (Drudze et al., 2021).
GK was responsible for conceptualization of the research, literature review and drafting the manuscript, and securing funding for the research. ZG was responsible for the digitization, systematization of the phenological data set, and initial exploratory analysis. AK was responsible for phenological modelling, preparing illustrations, and overall data management.
The authors declare that they have no conflict of interest.
The results contain modified Copernicus Climate Change Service information. Neither the European Commission nor ECMWF is responsible for any use that may be made of the Copernicus information or data it contains.
This article is part of the special issue “Applied Meteorology and Climatology Proceedings 2020: contributions in the pandemic year”.
We thank Inese Drudze, a researcher of the Horticultural Research Centre, for collecting, storing and authorising use of the phenological data from Pūre. The E-OBS dataset version 21.0e is from the EU-FP6 project UERRA (http://www.uerra.eu, last access: 6 September 2020), the Copernicus Climate Change Service and data providers of the ECA&D project (https://www.ecad.eu, last access: 6 September 2020). Muñoz Sabater (2019) was downloaded from the Copernicus Climate Change Service (C3S) Climate Data Store.
This research has been supported by the Latvian State Education Development Agency via the Post-doctoral Research Aid program (grants no. 1.1.1.2/VIAA/2/18/265 and 1.1.1.2/VIAA/3/19/524).
This paper was edited by Josef Eitzinger and reviewed by two anonymous referees.
Avotniece, Z., Aņiskeviča, S., and Maïinovskis, E.: Climate change scenarios in Latvia [Klimata pārmaiòu scenāriji Latvijai], Riga, available at: https://www4.meteo.lv/klimatariks/files/kopsavilkums.pdf (last access: 1 April 2021), 2017 (in Latvian).
Chmielewski, F. M., Müller, A., and Bruns, E.: Climate changes and trends in phenology of fruit trees and field crops in Germany, 1961–2000, Agr. Forest Meteorol., 121, 69–78, https://doi.org/10.1016/S0168-1923(03)00161-8, 2004.
Cornes, R. C., van der Schrier, G., van den Besselaar, E. J. M., and Jones, P. D.: An Ensemble Version of the E-OBS Temperature and Precipitation Data Sets, J. Geophys. Res.-Atmos., 123, 9391–9409, https://doi.org/10.1029/2017JD028200, 2018.
Czernecki, B., Jakub, N., and Jabłonska, K.: Machine learning modeling of plant phenology based on coupling satellite and gridded meteorological dataset, Int. J. Biometeorol., 62, 1297–1309, 2018.
Drudze, I., Kalvāne, G., Gribuste, Z., and Kalvāns, A.: Apple phenology data set and R script, related to publication “Full flowering phenology of apple tree (Malus domestica) in Pūre orchard, Latvia from 1959 to 2019”, Zenodo [data set], https://doi.org/10.5281/zenodo.4912025, 2021.
European Environment Agency: Phenology of plant and animal species., available at: https://www.eea.europa.eu/data-and-maps/indicators/plant-phenology-2/assessment (last access: 1 April 2021), 2017.
Fujisawa, M. and Kobayashi, K.: Apple (Malus pumila var. domestica) phenology is advancing due to rising air temperature in northern Japan, Glob. Change Biol., 16, 2651–2660, https://doi.org/10.1111/j.1365-2486.2009.02126.x, 2010.
Kalvāne, G.: Phenological changes and their influencing factors [Fenoloìiskās izmaiòas un ietekmējošie faktori], Latvijas Universitātes Akadēmiskais apgāds, Rīga, 2011 (in Latvian).
Kalvāne, G. and Kalvāns, A.: Phenological trends of multi-taxonomic groups in Latvia, 1970–2018, Int. J. Biometeorol., 65, 895–904, doi.org/10.1007/s00484-020-02068-8, 2021.
Kalvāns, A., Bitāne, M., and Kalvāne, G.: Forecasting plant phenology evaluating the phenological models for Betula pendula and Padus racemosa spring phases, Latvia, Int. J. Biometeorol., 59, 165–179, 2015.
Kondratenko, T. Ye., and Kondratenko, P. V.: Phenology of apple tree (Malus domestica Borkh.) in Kyiv Oblast in the context of climate change, Plant Varieties Studying and Protection, 1–2, 49–53, https://doi.org/10.21498/2518-1017.1-2(26-27).2015.55911, 2015 (in Ukrainian).
Legave, J. M., Farrera, I., Almeras, T., and Calleja, M.: Selecting models of apple flowering time and understanding how global warming has had an impact on this trait, J. Hortic. Sci. Biotech., 83, 76–84, https://doi.org/10.1080/14620316.2008.11512350, 2008.
Legave, J. M., Guédon, Y., Malagi, G., El Yaacoubi, A., and Bonhomme, M.: Differentiated responses of apple tree floral phenology to global warming in contrasting climatic regions, Front. Plant Sci., 6, 1054, https://doi.org/10.3389/fpls.2015.01054, 2015.
Menzel, A., Yuan, Y., Matiu, M., Sparks, T., Scheifinger, H., Gehrig, R., and Estrella, N.: Climate change fingerprints in recent European plant phenology, Glob. Change Biol., 26, 2599–2612, https://doi.org/10.1111/gcb.15000, 2020.
Miller-Rushing, A. J., Katsuki, T., Primack, R. B., Ishii, Y., Sang, D. L., and Higuchi, H.: Impact of global warming on a group of related species and their hybrids: Cherry tree (Rosaceae) flowering at Mt. Takao, Japan, Am. J. Bot., 94, 1470–1478, https://doi.org/10.3732/ajb.94.9.1470, 2007.
Muñoz Sabater, J.: ERA5-Land hourly data from 1981 to present, Copernicus Climate Change Service (C3S) Climate Data Store (CDS), https://doi.org/10.24381/cds.e2161bac, 2019.
Oses, N., Azpiroz, I., Marchi, S., Guidotti, D., Quartulli, M., and Olaizola, I. G.: Analysis of Copernicus' ERA5 climate reanalysis data as a replacement for weather station temperature measurements in machine learning models for olive phenology phase prediction, Sensors, 20, 1–22, https://doi.org/10.3390/s20216381, 2020.
R Core Team: R: A language and environment for statistical computing, available at: https://www.R-project.org/ (last access: 13 June 2021), 2020.
Rivero, R., Sønsteby, A., Heide, O. M., Måge, F., and Remberg, S. F.: Flowering phenology and the interrelations between phenological stages in apple trees (Malus domestica Borkh.) as influenced by the Nordic climate, Acta Agr. Scand. B-S. P., 67, 292–302, https://doi.org/10.1080/09064710.2016.1267256, 2017.
Romanovskaja, D. and Bakšienė, E.: The Influence of Climate Change on Plant Phenological Phases in Lithuania, Vilnius University Proceedings, 100, p. 25. https://doi.org/10.15388/Klimatokaita.2020.17, 2020.
Stöckli, R., Rutishauser, T., Baker, I., Liniger, M. A., and Denning, A. S.: A global reanalysis of vegetation phenology, J. Geophys. Res., 116, G03020, https://doi.org/10.1029/2010JG001545, 2011.
Wang, C., Tang, Y., and Chen, J.: Plant phenological synchrony increases under rapid within-spring warming, Sci. Rep.-UK, 6, 25460, https://doi.org/10.1038/srep25460, 2016.
Wickham, H., Averick, M., Bryan, J., Chang, W., McGowan, L., François, R., Grolemund, G., Hayes, A., Henry, L., Hester, J., Kuhn, M., Pedersen, T., Miller, E., Bache, S., Müller, K., Ooms, J., Robinson, D., Seidel, D., Spinu, V., Takahashi, K., Vaughan, D., Wilke, C., Woo, K., and Yutani, H.: Welcome to the Tidyverse, J. Open Source Softw., 4, 1686, https://doi.org/10.21105/joss.01686, 2019.
Woznicki, T. L., Heide, O. M., Sønsteby, A., Måge, F., and Remberg, S. F.: Climate warming enhances flower formation, earliness of blooming and fruit size in plum (Prunus domestica L.) in the cool Nordic environment, Sci. Hortic., 257, 108750, https://doi.org/10.1016/j.scienta.2019.108750, 2019.
Xiang, Y., Gubian, S., Suomela, B., and Hoeng, J.: Generalized simulated annealing for global optimization: the GenSA Package, R J., 5, 13–28, 2013.