 | 22 Mar 2022
From sandcastles to bridges: how can we help forecasters to deal with uncertainties?
Anders Doksæter Sivle
Jelmer Jeuring
Mai-Linn Finstad Svehagen
At MET Norway, a small interdisciplinary team - the Sandbox - spends part of their working hours trying to improve the communication between the meteorologists and their audience. In this article we invite the reader to join us on a journey along the Sandbox process during 2021. The focus of our work that year was on the communication of forecast uncertainty. We share what we have been working on throughout the (mostly virtual) sessions, and how we achieved a set of tools, recommendations, and a knowledge repository for forecasters to consult during their operational duty. The Sandbox story is aimed to inspire others in the meteorological community to explore the potential of creative interdisciplinary work as a method to bridge gaps between research, operational practice, and user uptake.
- Article
(3306 KB) - Full-text XML
- BibTeX
- EndNote


How can we improve the communication between the meteorologists and their audience? How do we ensure that weather forecasts are understood by the public? And why is it important to be aware of how both the meteorologist and the public understand and relate to uncertainties? At MET Norway, a small interdisciplinary team – the Sandbox – are spending part of their working hours trying to improve the communication between the meteorologists and their audience. This is important because science and technology is evolving rapidly, as well as people's perceptions and capacity to use weather information. Thus, communication must be flexible and adapt quickly to be efficient (Morss et al., 2017). In this article we invite the reader to join us on a journey along the Sandbox process, which is inspired by the Google Design Sprint process (Google, 2019). We share our experiences from the thematic work done in the Sandbox throughout 2021, which was focused solely on the communication of forecast uncertainty. The Sandbox has been using multi-day physical meetings, which are well suited for in-depth collaboration and creative brainstorming. However, because of the Covid-19 situation we decided to primarily work online this year, which allowed us to experiment with online collaboration tools. We briefly reflect on the pros and cons of various formats at the end of the article. Before taking off, let us first take a brief look back on what role the Sandbox has at MET Norway, and how it has contributed to improve our forecast communication over the years.
Now the Sandbox consists of seven forecasters, researchers, and communication advisors with backgrounds from both natural and social sciences. In total, approximately half a man-year is used annually, typically by participation in a few 3 d meetings each year. Over the past 6 years, this has been a proven format to address interdisciplinary and cross-departmental challenges. For example, the team has been working with ideas related to establishing an editorial team (Sivle et al., 2017), an internal pre-warning alert system (Fig. 1), a podcast (Sivle et al., 2019), an automatic text generator (Granerød, 2020), and using the TV-meteorologists as climate communicators (Sivle et al., 2021a). All these ideas have been developed to become part of the operational services at MET Norway. Suggestions from the Sandbox are delivered directly to the management, who then decides what to follow up on. If the leadership decides to proceed with an idea, normally a small development project is set up, and resources are made available based on the size of the project.
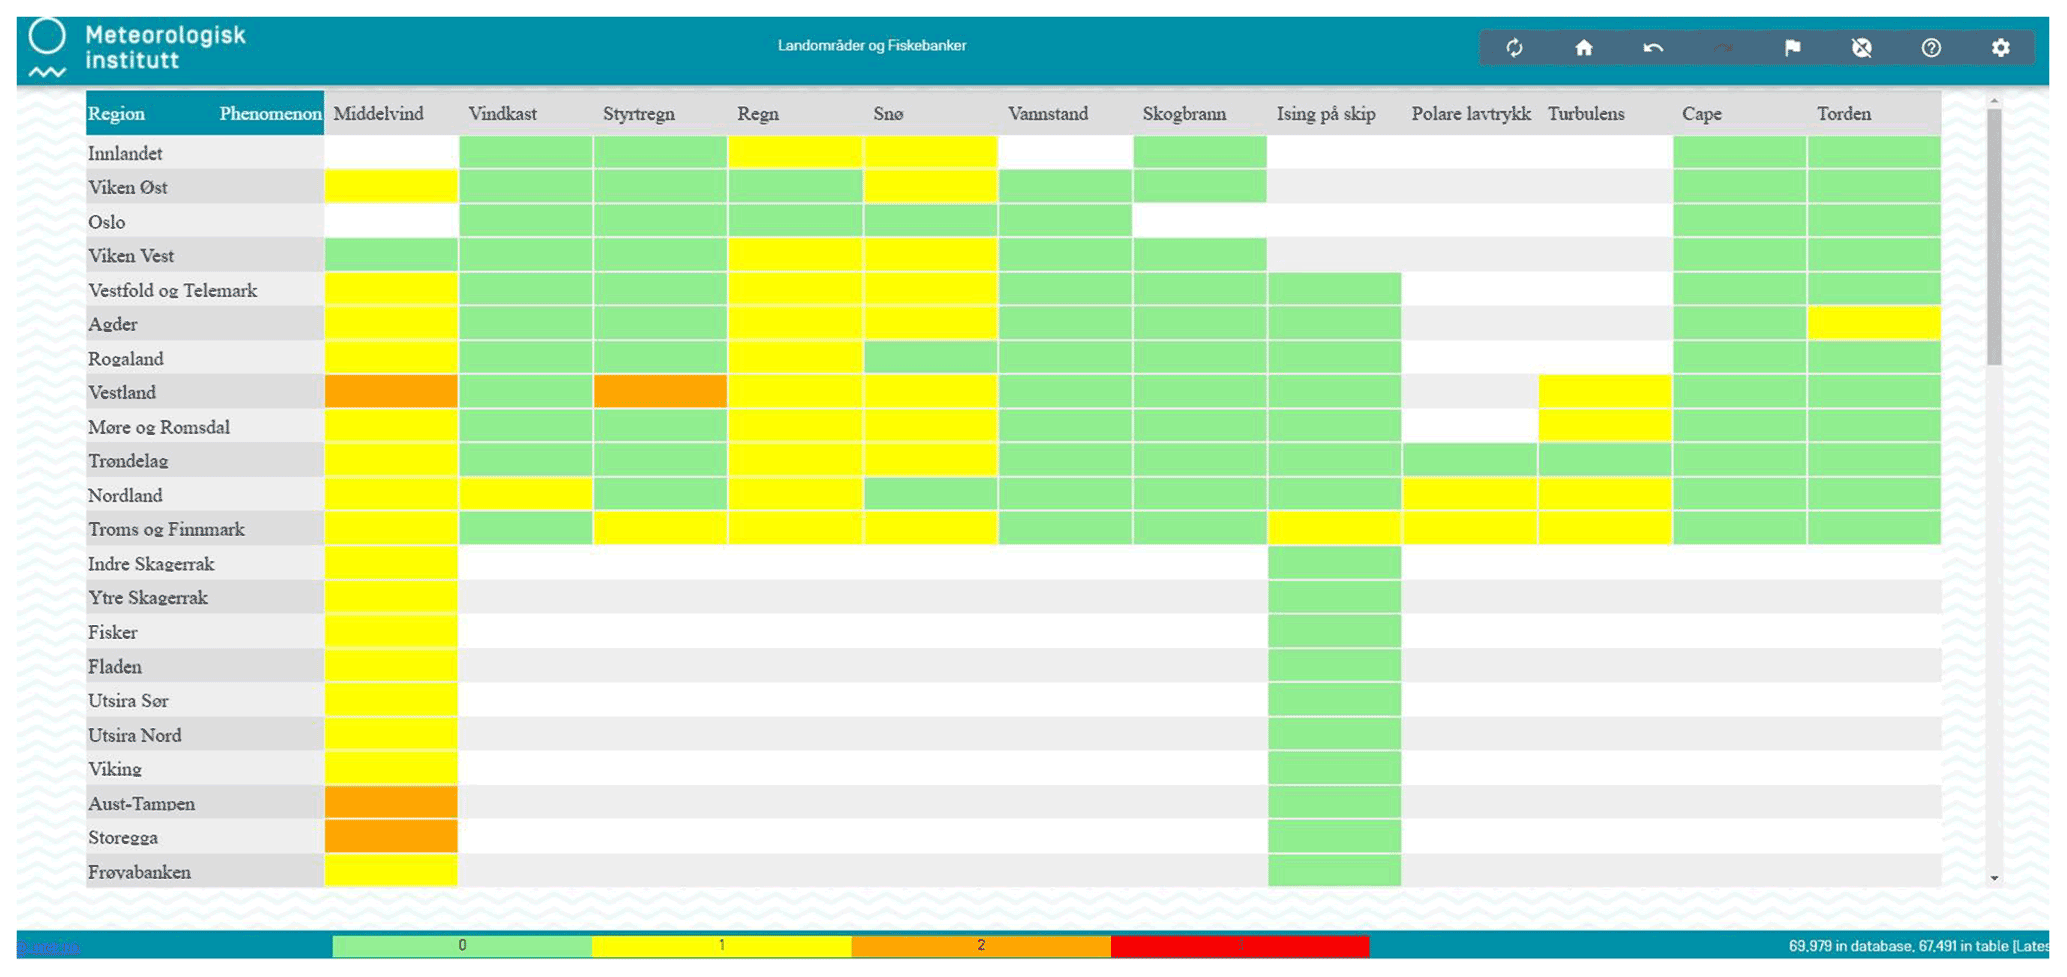
Figure 1The internal pre-warning alert system at MET Norway (in Norwegian). A table shows selected meteorological parameters and regions. A green colour means that the forecaster can focus on another parameter/region that day, whereas other colours suggest more in-depth exploration. Screenshot by author.
Sometimes we – the Sandbox – work with an idea in one meeting, other times for several months. Throughout 2021, the team focused on one project the whole year (see also Sivle et al., 2021b). In this project, two well-known and related challenges to the meteorological community were explored: (i) how can we help meteorologists in the transition from mainly using deterministic model data, to mainly using probabilistic data from ensemble prediction systems (EPS)? and (ii) how can we aid and develop more effective communication with respect to forecast uncertainty?
We had good reasons for selecting this topic. On one hand, forecast uncertainty has been of interest within the meteorological community especially in recent years (e.g., see Demuth et al., 2020). On the other hand, several of the team members were involved in activities or projects related to the topic, meaning that it could be easier to achieve synergy, and thus bring ideas forward with a greater potential impact. In the following, we will describe how we worked with the challenge of uncertainty during the year and give a glimpse into both the process and the outcomes of the Sandbox activities.
2.1 January: brainstorming and planning
The first meeting of the year was held over 2 d in January. The work was set up as a 1 year project, with a mix of five 2 d meetings working with a specific topic, and monthly 2 h meetings and ad hoc tasks in between to follow-up. If possible, the plan was to meet in person in each of the three regional offices (Oslo, Bergen, and Tromsø), to avoid travelling but still meet some of the other team members. Not spending time travelling, we had more working hours that could be used by ourselves (for example to increase the team this year from four to seven members), or to bring other people into the group for a short period of time when needed (see below).
The primary objective of the first meeting was to brainstorm ideas related to the two selected challenges (use of EPS and uncertainty communication). We also discussed how to work together, with respect to methods as well as the Covid-19 restrictions (Fig. 2 shows the working tools that we used). At the end of the meeting, we had agreed upon a thematic plan which included a set of concrete aims and deliverables, to be worked on during subsequent meetings.
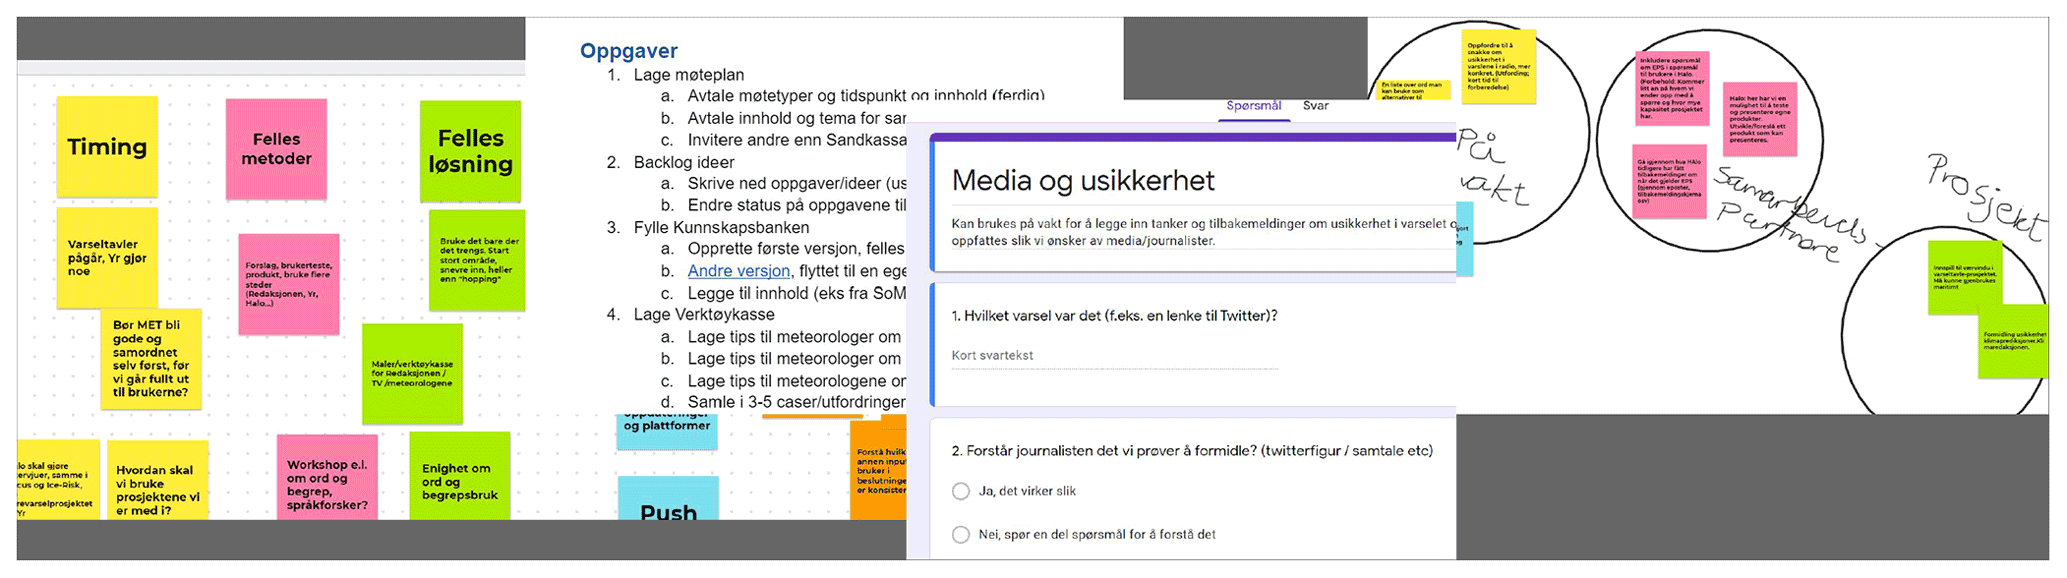
Figure 2Various Google tools (Meet, Jamboard, Docs, Slides, Sheets, Chat and Gmail) were used when working virtual (in Norwegian). Screenshots by author, from Google Workspace (2021).
For the 2 d meetings, the selected themes were: Insight into the existing mind-sets and tools/data the forecasters have (March meeting), communication and language (May meeting), technical insight in strengths and weaknesses of ensemble models and products (September meeting), and communication and visualization (November meeting). The main deliverables of the project were to provide (1) a communication toolbox and (2) a repository of knowledge regarding the operational use of ensemble data and communication of uncertainty. The toolbox and repository were planned to be made available for forecaster training and operations, as well as to form a basis to develop future research and outreach activities. Other deliverables were to offer more uncertainty information through various channels (Yr weather service, and social media), and to contribute to a session on forecast uncertainty at the annual conference of the European Meteorological Society (EMS).
2.2 March: operational insights
The second 2 d meeting was dedicated to learning about perceptions and use of EPS-data among forecasters at MET Norway. Ahead of the meeting, we prepared and conducted a survey with questions related to their use and knowledge of EPS-data, their needs (e.g., new products, or training), how they interpret and handle uncertainty in their forecasting process and how they communicate uncertainties to their users. The response rate was very satisfactory, with 90 respondents in total (almost 100 %). In addition, we had access to responses from another survey among the operational forecasters, conducted 1 year earlier (February 2020), with 50 respondents. That survey focused on the use of EPS as well, but in a warning context. We used the second meeting of the year to analyse and read through the responses from these surveys.
The two surveys showed us that most respondents used EPS-data operationally. Typically, the control run was used as a starting point, and then EPS-data (ensemble members, probabilities) was used in addition, in specific situations – for example, when assessing severe or extreme weather conditions. The survey conducted by us showed that only three out of ten forecasters always use EPS data. Several reasons were mentioned for not always using EPS-data (Fig. 3). In addition to practical constraints (time, no need), these include a perceived need for extra training and a lack of knowledge about strengths and weaknesses of EPS data. Colloquiums and internal training courses were the preferred options for those who wanted more knowledge about EPS, while some forecasters also liked self-study. The findings from our Norwegian context which indicate that many forecasters are interested in using EPS data and products but perceive a need for extra training and guidance in using such data in a confident way, align with studies done in the US (Demuth et al., 2020).
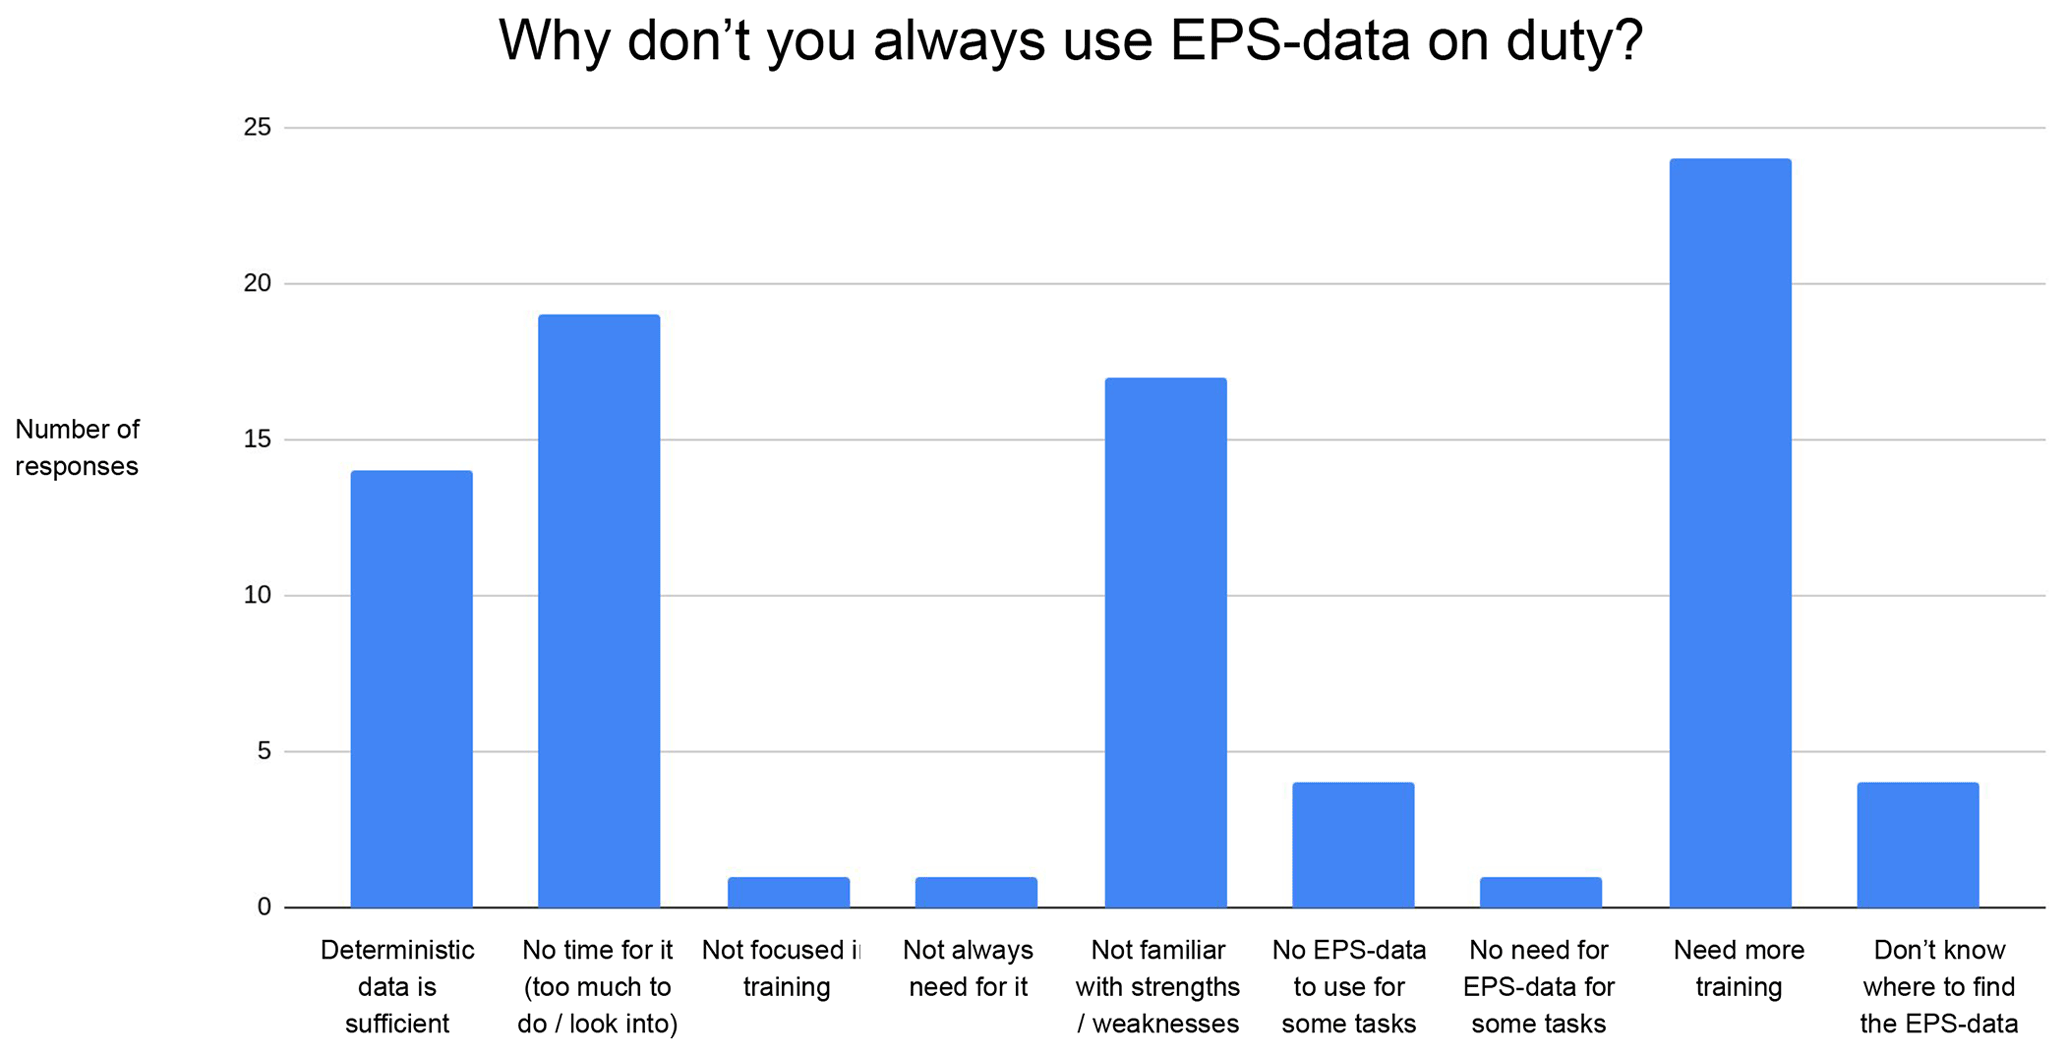
Figure 361 operational forecasters at MET Norway answered this question in the survey (multiple answers were allowed). A need for more training and to learn about strengths and weaknesses with EPS-data/products are perceived as important by many.
Based on the responses, we decided to create an overview of all EPS-data/products and training material already available at MET Norway, as a starting point for providing practical guidance to our forecasters. It turned out to be a relatively long list of data/products, and a somewhat shorter list of training material. We realized that asking for new and tailored EPS-products was not the way forward, as a lot already existed. Like what was found by Demuth et al. (2020), it became clear from our survey, that the forecasters themselves were unsure about the value of even more EPS products (Fig. 4). Rather, it was a good opportunity for us to give input to the operational forecasters based on our insights gathered so far. First, we agreed with another working group at MET Norway (forecasters working with use of EPS related to warnings) that they would take responsibility for the follow-up, the list of products and training of forecasters. Also, the materials were uploaded to a shared Google Drive, as a first step of creating a repository of knowledge. Third, a summary of the insights from the surveys was also presented to the forecasters in an annual training course they had at that time of the year. When these tasks were done or assigned to others, the Sandbox moved on to focus more closely on what it means to communicate forecast uncertainty.
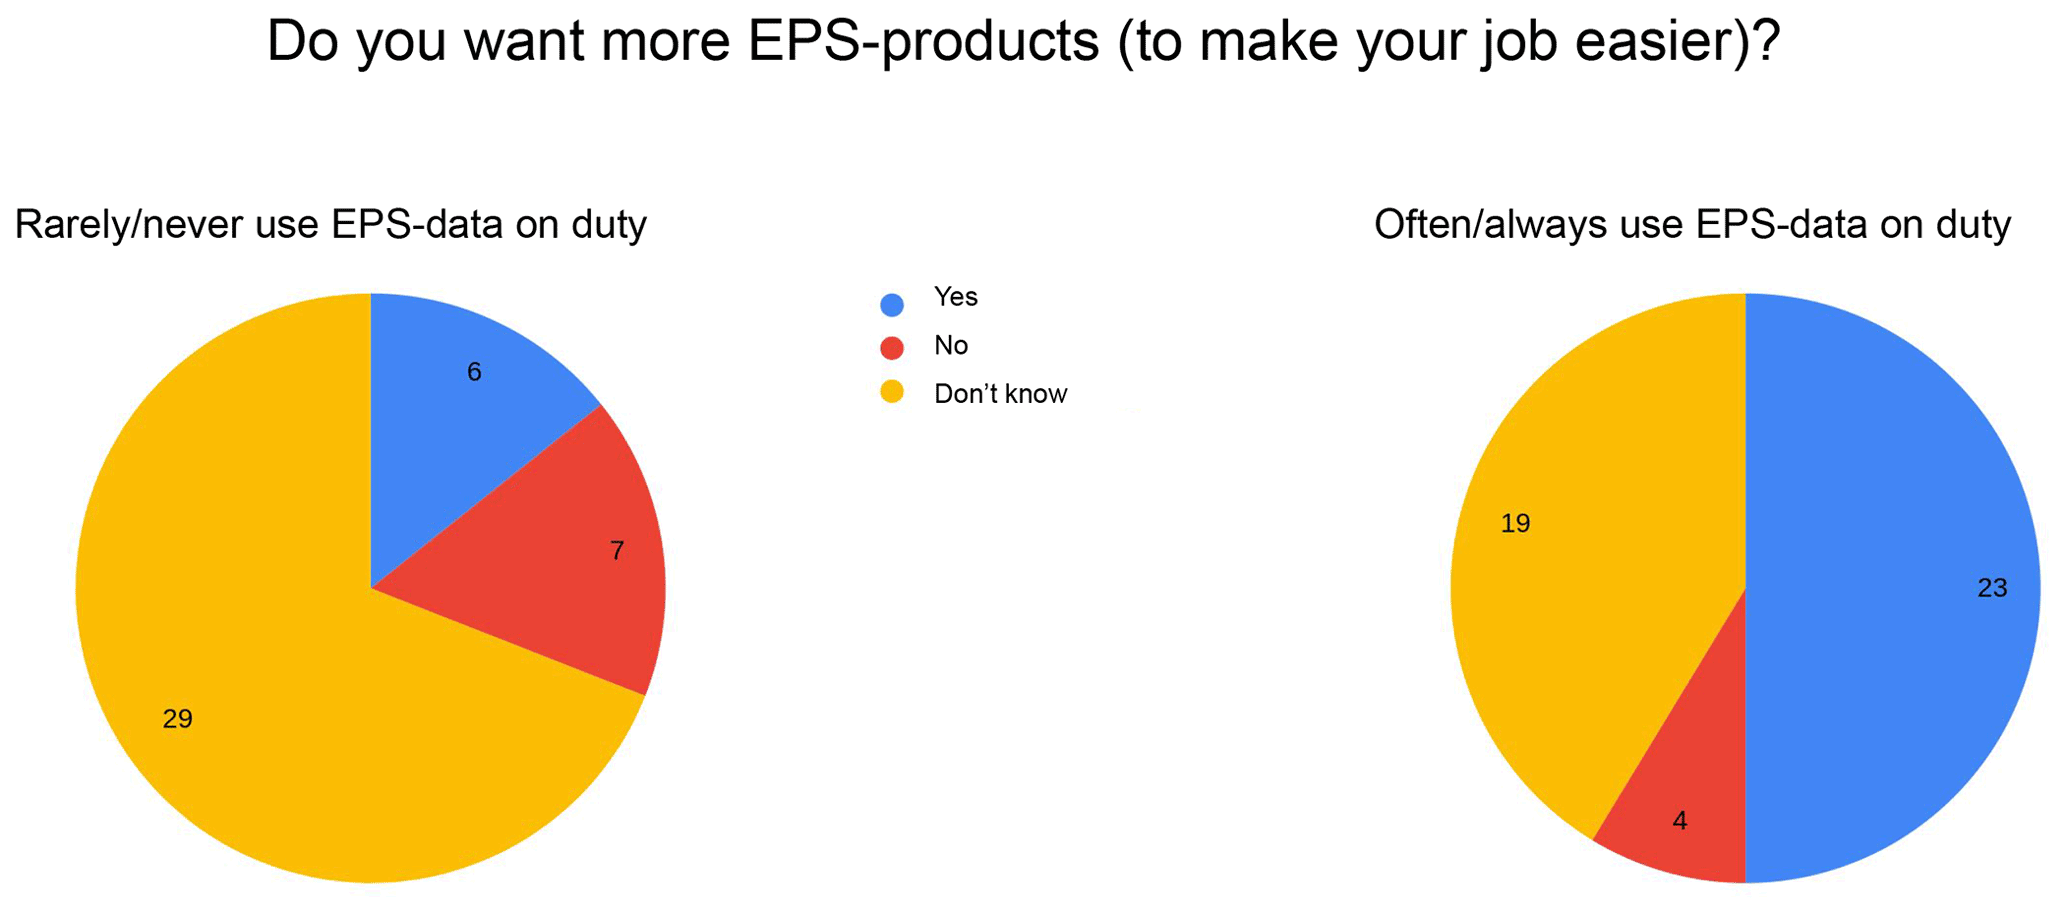
Figure 488 operational forecasters at MET Norway answered this question in the survey. In the analysis, we compared the answers from the forecasters that rarely use EPS-data on duty with them that normally use such data. It looks that if you are used to using EPS, you are also more open to new EPS-products.
In the surveys we had already gathered insight into the forecaster's mindset, related to this topic. To get more in-depth knowledge, we decided to also invite the forecasters to share their experiences of talking to journalists about forecast uncertainty. However, this was not as successful as we hoped since we only got four responses. One potential reason for this is that the forecasters have tight deadlines and are often also contributing to ongoing research or development projects. To get more data to work with in the coming 2 d meeting in May, planned to focus on uncertainty and language, we decided to move in a different direction. MET Norway has access to a media monitoring tool. This tool can be set up to monitor a range of selected words/expressions in newspapers and radio, and automatically report back the results. To get a broader view of how often different words were used, we set up such reports on a weekly report basis monitoring a selection of words or expressions. We started researching news media articles focusing on passages where our forecasters were interviewed, and forecast uncertainty was mentioned. Immediately, we saw that precautions, and a wide range of words describing uncertainty, were very common when talking about the weather forecast.
To prepare for the meeting in May, we realised that inviting external participants would be helpful to get better insight into the domain. Hence, we decided to invite two journalists with interest in weather and language from different media houses (NRK and NTB), and one linguist from the University of Bergen also interested in the topic, to complement our knowledge with their perspectives.
2.3 May: language
The third 2 d meeting of the year was focusing on language and uncertainty. In addition to our team, three external participants joined for about 1 h each, to present insight from the media perspective and to provide us a theoretical framework related to “hedging” (e.g., see Kaltenböck et al., 2010).
By inviting external experts, we aimed to collect some recommendations/advice from outside the weather context, on how to speak or write about uncertainty. The presentations provided us with new and broader perspectives and the discussions during these sessions resulted in two new activities. First, we expanded the information repository with a summary document about uncertainty language, illustrated with a range of tools, training material and various articles with explanations and inspiration. However, to narrow down our own work, and hence the size of a set of recommendations that would be usable for forecasters on duty, we decided to focus on the case of convective precipitation. This is a notoriously challenging phenomenon to forecast (e.g., see ECMWF, 2019), and includes various forms of uncertainty (timing, location, intensity) that are challenging to convey in communication.
Before the summer season we shared a draft document with the forecasting team, for them to see if it could be helpful and to give us feedback. To reach out with our message, the document was shared both in emails and in department meetings. We also shared the document with the three external participants in our meeting to get their feedback on the language advice section. We do not know for sure if it was because of our document with recommendations, but some communication in social media written by our forecasters during the summer seemed very much inspired by our advice, as it included the use of understandable analogies of atmospheric processes (Fig. 5).
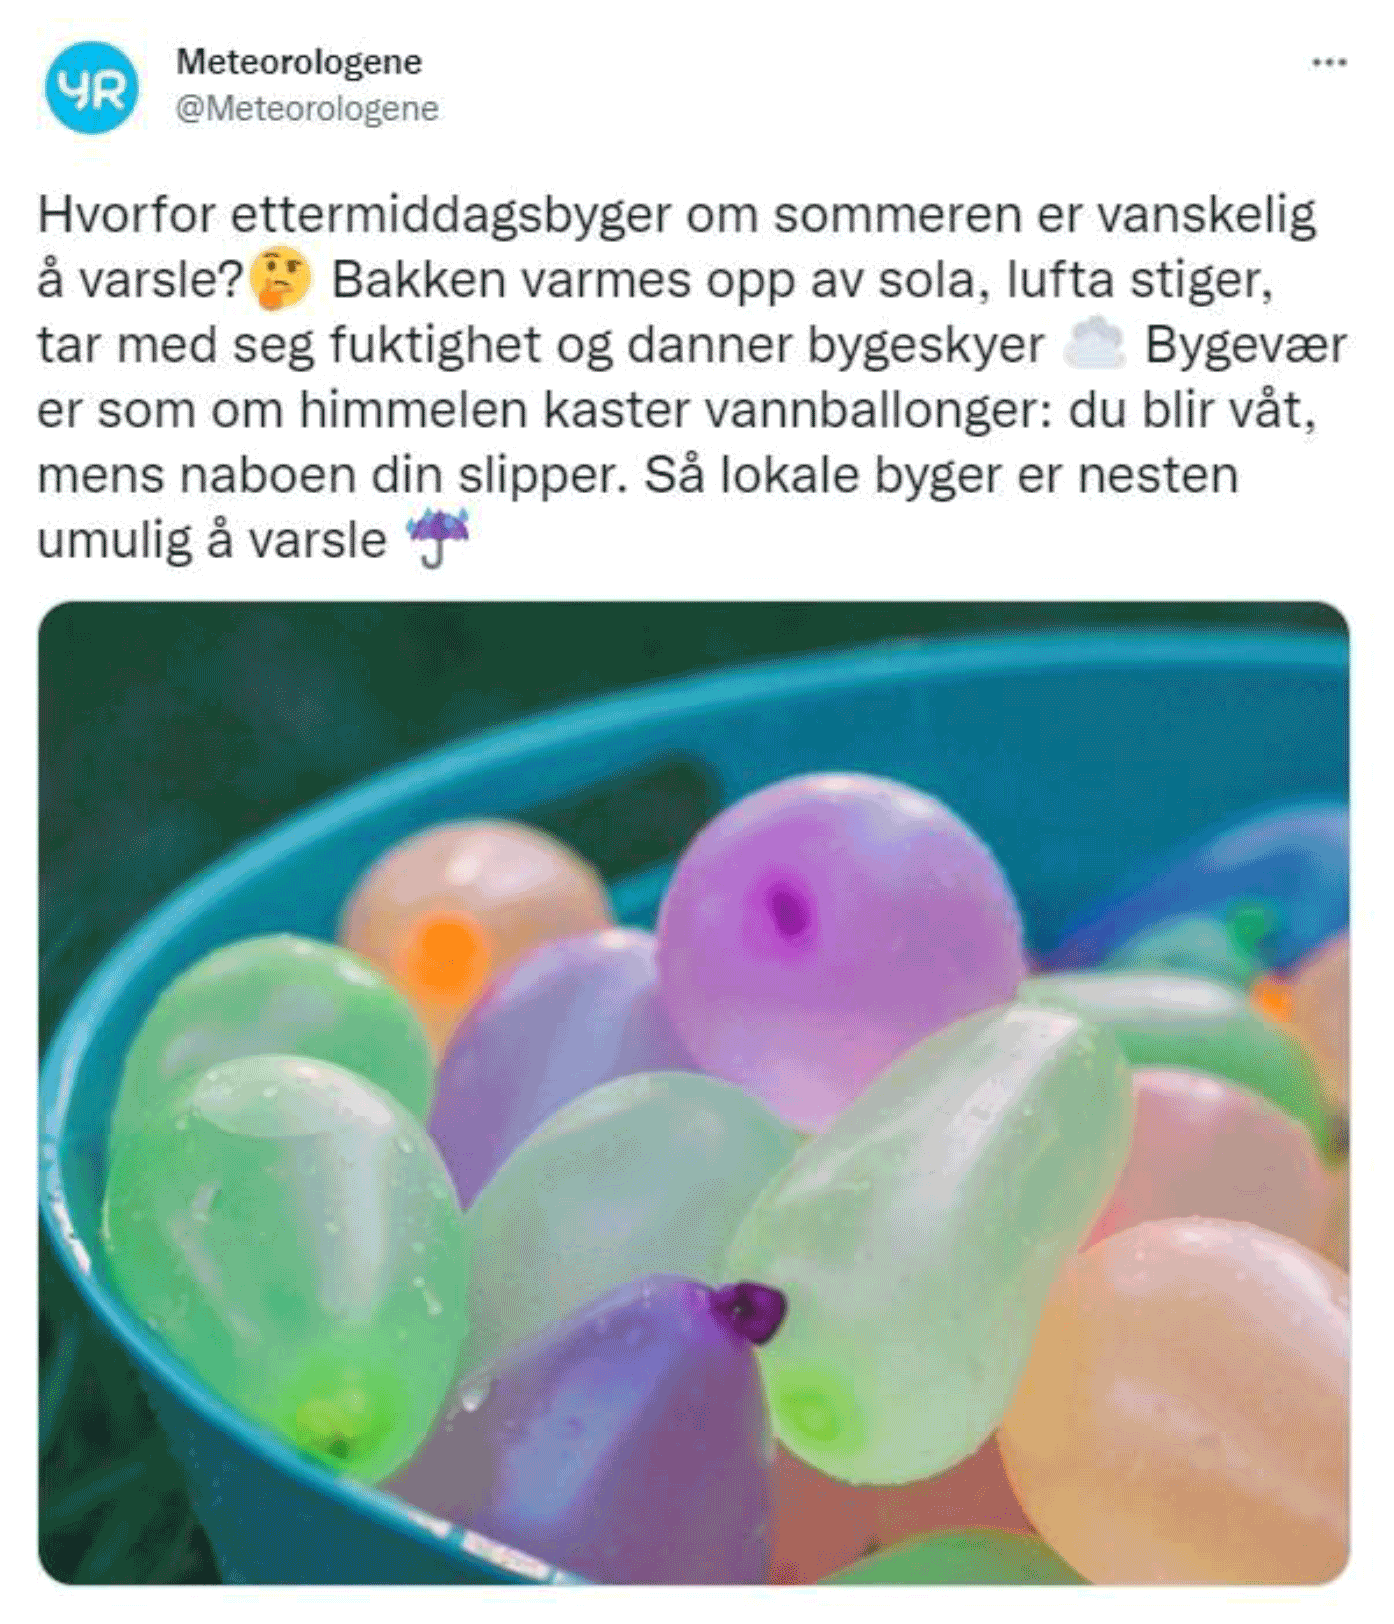
Figure 5A tweet about local rain showers, comparing them with throwing water balloons. “Why are these afternoon showers so difficult to predict? The sun heats up the ground and the air bring moist to the sky forming rain clouds. Rain Showers like this are as unpredictable as randomly throwing water balloons: you get wet, but your neighbour does not. These showers are local and almost impossible to forecast.” (our translation). Screenshot by author, from Twitter (2021).
We received over the summer some feedback from the forecasters on duty. While the feedback was limited, it was nevertheless useful and relatively easy to pick up by ongoing Sandbox activities. For example, it was commented that the document was too long to read through while on duty. Also, the advice was perceived as being a mixing of generic uncertainty advice and specific advice directed towards convective precipitation. Thus, we had to do some prioritising and tailoring.
2.4 September: graphics
The fourth meeting of the year was originally planned to focus on technical aspects of EPS-data. However, since that task was assigned to another team, we changed our focus to work on graphical communication, like what we did with language in the May meeting.
Our experience with the format of the May meeting was very satisfying, and we decided to send invitations once again to a few external participants. We were joined by a content team meteorologist from the UK and two visualisation and uncertainty researchers from Switzerland. In addition, we invited one internal researcher from MET Norway with strong interest in visualization of EPS data, and the leader of MET Norway's editorial team, to share insights about w hat works in communication of uncertain weather forecasts.
Next to the presentations, we challenged our visual creativity in a series of drawing exercises. The drawings, which should reflect novel ways of visualising uncertainty, were adjusted after each session with input and inspiration from invited guests. At the end of the meeting, we collected, categorized, and summarized the drawings and ideas we had come up with. In total, we ended up with seven categories/advices that could be important to consider when making graphics related to uncertainty communication. We also had collected some ideas for visualisations that could be tested in different projects.
It was decided that the language advice and the advice for making graphics had strong similarities, and could be merged into one set of advice, containing examples both from language and graphics. Based on the feedback on the document we shared with the forecasters before the summer, we also agreed to make the final set of advice general for weather communications, not focused on for example convective precipitation. Then, we had one final 2 -d meeting to go to wrap everything up.
2.5 November: consolidation and evaluation
In the fifth and final meeting of the year, we aimed to wrap up and summarize the work done during the year, and to evaluate the process and the outcomes. Taking stock, we achieved most of the goals, even though some of the activities were changed based on new insights or opportunities.
The first goal for the year was to establish a repository of knowledge where we collected information about the use of EPS-data and communication of uncertainty to the forecasters (and possibly other interested parties). In the end, a shared Google Drive was created on which we have collected literature, tips/advice coming from both our previous sessions and from external input, an overview of EPS-data/products available at MET Norway, training material and examples of meaningful communication. The knowledge repository is meant to be continuously followed-up and developed and depends on someone being given a responsibility to follow it up. This will not be the Sandbox, since our role is to create ideas, not to develop them into operational services.
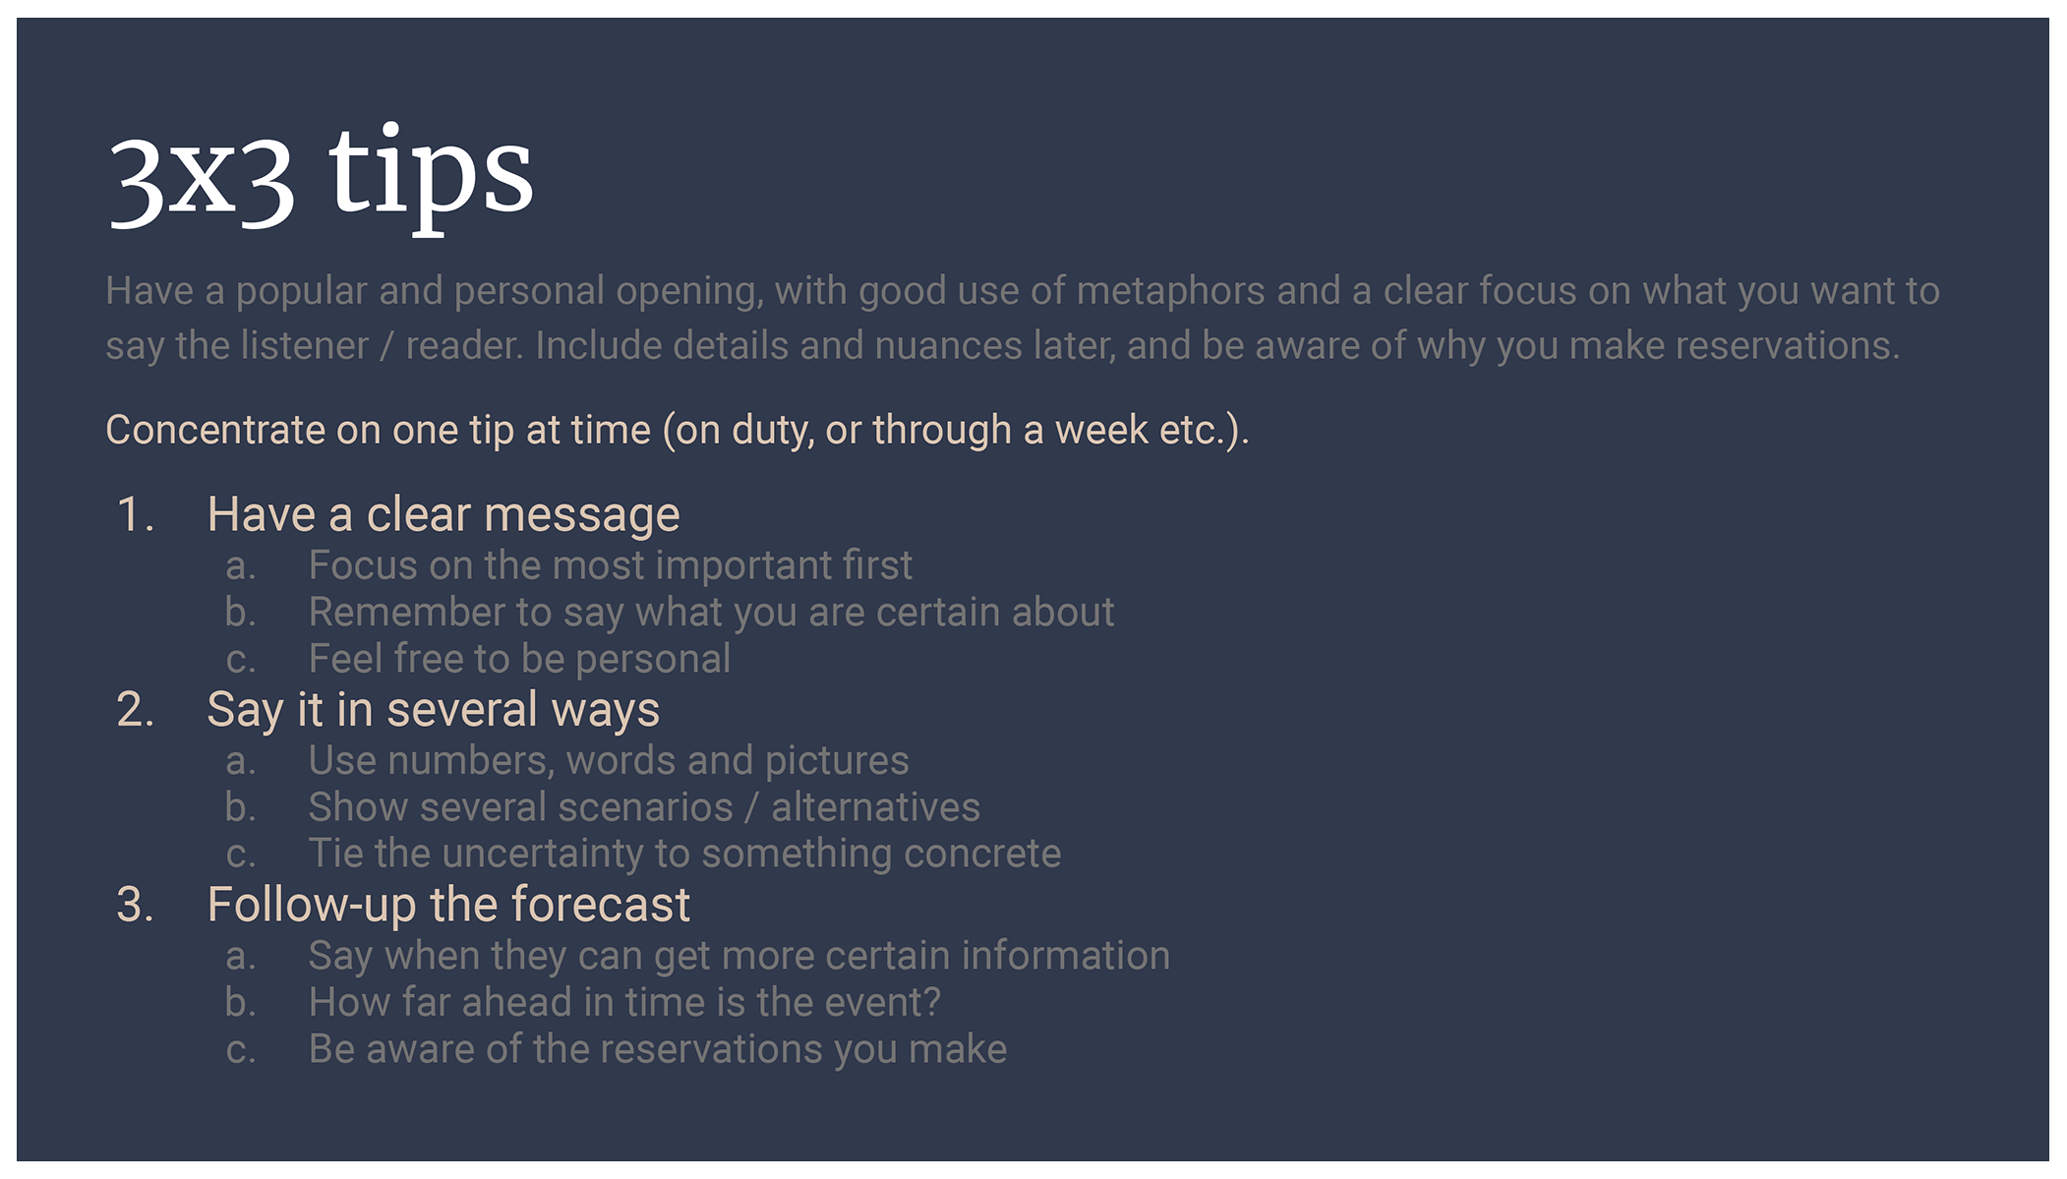
Another goal was to create a toolbox with advice related to communication of uncertainty. This was done and resulted in three sets of slides (of different length/level of detail) with advice and examples on how to use language and make graphics. The third presentation is a one-pager with the 3×3 tips summarized in a printer-friendly format (like Fig. 6). In addition, two documents with more elaborate information related to development of graphics and communication of uncertainty in convective weather (language advice, articles etc.) can be found in the repository of knowledge. Like the repository, the toolbox is meant to be living and evolving, and needs someone to have responsibility to follow them up.
In addition to these main goals, several activities were undertaken throughout the year that helped to meet our goals, often as part of related projects we were involved in. For example, more probabilistic information was included at the Yr weather service (https://www.yr.no/nb, last access: 21 March 2022), and two new public outreach articles explaining weather forecasting and uncertainty were published (one in the online encyclopedia https://snl.no/, last access: 21 March 2022, and one at the Yr website https://hjelp.yr.no/hc/en-us, last access: 21 March 2022).
Almost equally important was the networking with various researchers and meteorologists during the year, in linguistics, psychology and visualisation. Part of the team were also co-conveners on a new session, “dealing with uncertainties”, at the annual EMS conference in September 2021. This was a new session for the conference and based on its success has now been taken up as a returning session.
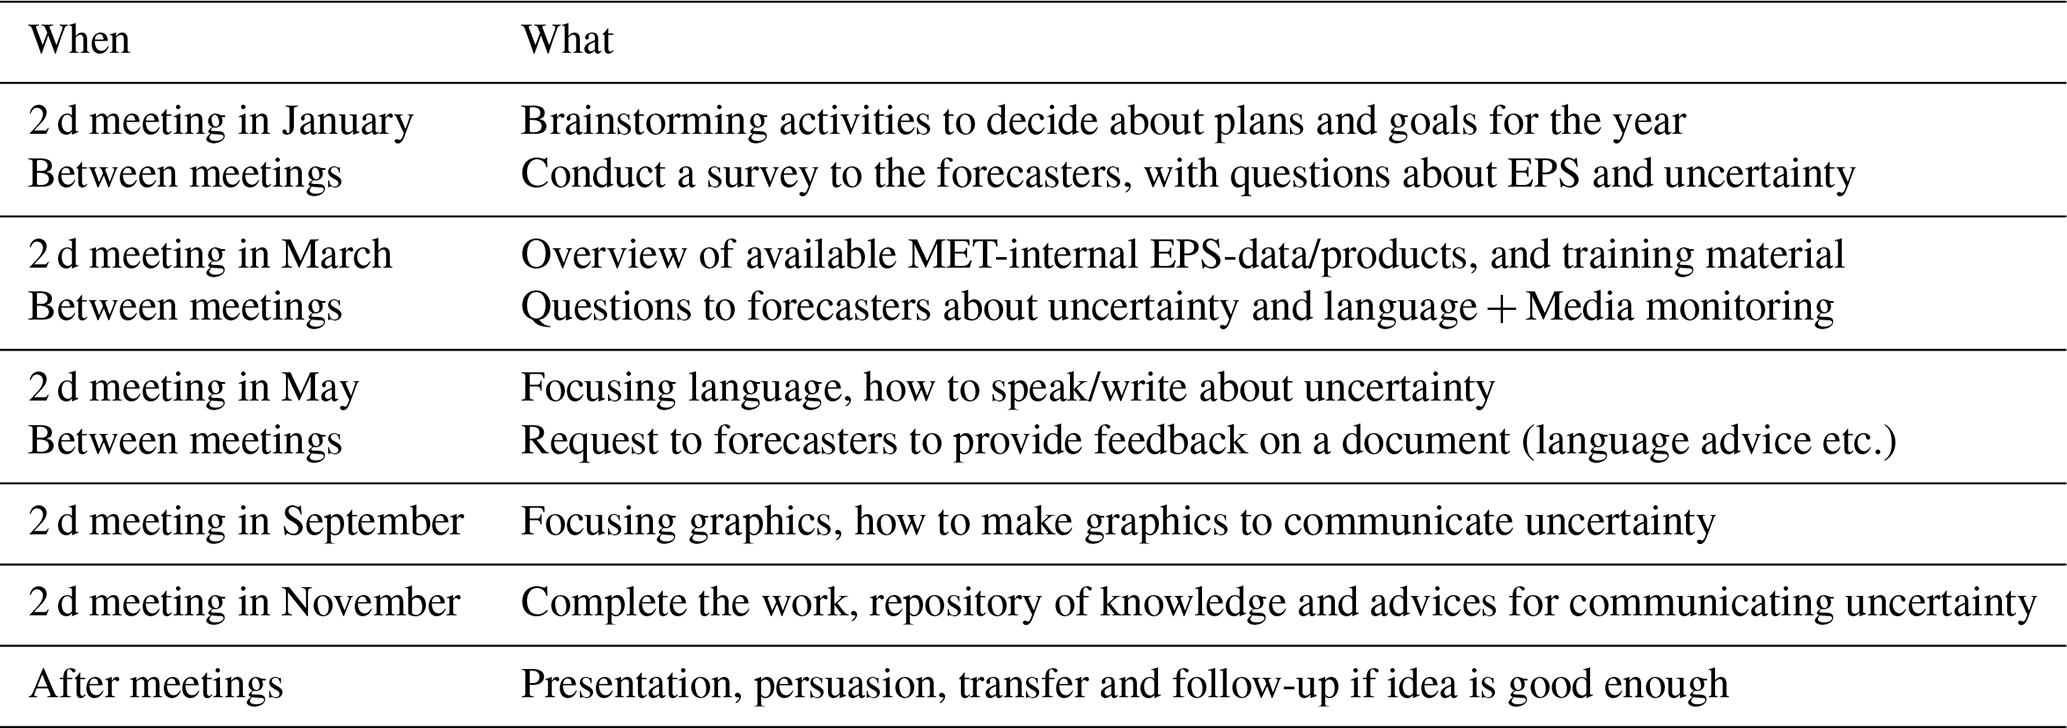
The plan changed during the year, but in the end the Sandbox journey looked like what is shown in Table 1.
Looking back on the work process in 2021, we have gained a mixed bag of experiences. The positive thing is that we have delivered in accordance with the project plan. Having short follow-up meetings once a month and then five sessions in 2 d has been a good way of working in virtual meetings. The downside is that when we meet mainly digitally, it is more difficult to work creatively, and perhaps it is especially difficult to come up with ideas that are a little out of the box. On the other hand, the short follow-up meetings work very well digitally, and the gatherings where we have many external participants also work when they participate digitally. It has also worked quite well to put the work close to a topic where several of us are involved/engaged in other work/projects, so that we get synergies and can more easily take ideas out for testing.
At least part of the work with EPS and uncertainties will – if recognized as useful by the forecasters – be followed up on, and further developed. A key constituent in the most successful ideas/projects so far is to give the Sandbox members most engaged in the idea, a central role in following up the idea/project. In our experience it is more demanding to begin a new project from scratch, where participants have no ownership in the idea. Several presentations of the work were held at the start of 2022, both to inform the leadership about the work, but also to try to find persons to be responsible for uptake and maintenance of both the repository of knowledge and the communication material. The initial signals from the leadership regarding the work and to follow up are positive.
When it comes to the format of the Sandbox: meeting in person locally was not possible before the last meeting in the autumn (November). We learned where digital meetings are sufficient, and where we should aim for physical sessions. The wish for 2022 is to continue about the same as this year, but we also hope to organise one or two in-person meetings.
Only time will tell if our suggestions and output have helped forecasters in using EPS data to improve the use of forecast uncertainty in communicating weather forecasts. A possible follow-up for us would be to convey a survey asking the public how they relate to the uncertainty and how we communicate uncertainty in weather forecasts. Regardless, we hope this short paper can be of inspiration to others, by showing the importance and possibilities of creative and interdisciplinary teamwork to improve communication between meteorologists and their audience. For us, our work in the Sandbox will continue in 2022, focusing on weather warnings.
Data sets are available upon request.
ADS prepared the manuscript with contributions from JJ and MLFS.
The contact author has declared that neither they nor their co-authors have any competing interests.
Publisher's note: Copernicus Publications remains neutral with regard to jurisdictional claims in published maps and institutional affiliations.
This article is part of the special issue “21st EMS Annual Meeting – virtual: European Conference for Applied Meteorology and Climatology 2021”.
Thanks are extended to the Norwegian Meteorological Institute, and to the team members of the Sandbox, for making this study possible. Many thanks also to the reviewers and the editor who were willing to read through and comment on the manuscript.
This paper was edited by Tanja Cegnar and reviewed by Jay Trobec and one anonymous referee.
Demuth, J. L., Morss, R. E., Jankov, I., Alcott, T. I., Alexander, C. R., Nietfeld, D., Jensen, T. L., Novak, D. R., and Benjamin, S. G.: Recommendations for Developing Useful and Usable Convection-Allowing Model Ensemble Information for NWS Forecasters, Weather Forecast., 35, 1381–1406, 2020.
ECMWF: Modelling convective precipitation – progress and challenges, https://www.ecmwf.int/en/about/media-centre/science-blog/2019/modelling-convective-precipitation-progress-and-challenges (last access: 21 January 2022), 2019.
Google: The Design Sprint, https://www.gv.com/sprint/ (last access: 3 January 2022), 2019.
Google Workspace: Productivity and collaboration tools for all the ways we work, https://workspace.google.com/intl/no/ (last access: 11 March 2022), 2021.
Granerød, M.: Nye havvarsler, https://www.met.no/nyhetsarkiv/nye-havvarsler (last access: 3 January 2022), 2020.
Kaltenböck, G., Mihatsch, W., and Schneider, S. (Eds.): New Approaches to Hedging, Emerald Group Publishing Limited, Howard House, UK, ISBN 978-0-85724-247-1, 2010.
Morss, R. E., Demuth, J. L., Lazrus, H., Palen, L., Barton, C. M., Davis, C. A., Snyder, C., Wilhelmi, O. V., Anderson, K. M., Ahijevych, D. A., Anderson, J., Bica, M., Fossell, K. R., Henderson, J., Kogan, M., Stowe, K., and Watts, J.: Hazardous weather prediction and communication in the modern information environment, B. Am. Meteorol. Soc., 98, 2653–2674, 2017.
Sivle, A. D., Pedersen, K., Thomsen, U. O., and Hagen, B.: The Editorial Team: improving communication between meteorologists and the public, in: EMS Annual Meeting, 4–8 September 2017, Dublin, Ireland, EMS2017-460, https://meetingorganizer.copernicus.org/EMS2017/EMS2017-460.pdf (last access: 29 December 2021), 2017.
Sivle, A. D., Skjerdal, M. S., Roggentin, R., Berger, A. C., and Andersen, A. S. H.: Værpodden: A podcast from MET Norway focusing on weather and outdoor life, in: EMS Annual Meeting, 9–13 September 2019, Copenhagen, Denmark, EMS2019-289, https://meetingorganizer.copernicus.org/EMS2019/EMS2019-289.pdf (last access: 29 December 2021), 2019.
Sivle, A. D., Berger, A. C., Svehagen, M. L. F., Hygen, H. O., and Jeuring, J.: The benefits of using TV-meteorologists as climate change communicators, in: EMS Annual Meeting, 6–10 September 2021, Virtual event, EMS2021-130, https://meetingorganizer.copernicus.org/EMS2021/EMS2021-130.html (last access: 3 January 2022), 2021a.
Sivle, A. D., Jeuring, J., Svehagen, M. L. F., Ovhed, M., Hagen, B., Gislefoss, K., and Borander, P.: The Sandbox: How can we help forecasters to deal with uncertainties?, in: EMS Annual Meeting, 6–10 September 2021, Virtual event, EMS2021-81, 2021, https://meetingorganizer.copernicus.org/EMS2021/EMS2021-81.html (last access: 3 January 2022), 2021b.
Twitter: Meteorologene, https://twitter.com/meteorologene/status/1408409930105769990 (last access: 11 March 2022), 2021.