 | 27 Jun 2022
Homogenization of Norwegian monthly precipitation series for the period 1961–2018
Elinah Khasandi Kuya
Herdis Motrøen Gjelten
Ole Einar Tveito
The primary goal of the analysis was to establish a high-quality precipitation reference dataset, which is both consistent and homogeneous, for calculation of the new standard climate normals (1991–2020). Climatol homogenization method was applied to detect inhomogeneities in 325 Norwegian precipitation series, during the period 1961–2018. Results from homogeneity testing found inhomogeneities in 29 % of the 325 series, however, only 25 % were classified as inhomogeneous after conferring with metadata and therefore adjusted. Relocation of the precipitation gauge and automation were the main causes of all the inhomogeneities in the Norwegian series, explaining 71 % and 12 % respectively of all detected breaks. Results further showed benefits of incorporating metadata to the automatically detected inhomogeneities. Linear trend analysis showed increasing trends in the period 1961–2018 except in autumn where a decreasing trend was observed. The homogeneity analysis produced a 58-year long homogenous dataset for 325 monthly precipitation sums with regional temporal variability and spatial coherence that is better than that of non-homogenized series. The dataset is more reliable in explaining the large-scale climate variations and was used to calculate the new climate normals in Norway.
- Article
(1894 KB) - Full-text XML
- BibTeX
- EndNote


Climate normals play an important role in weather and climate studies and require high quality data that are both consistent and homogenous. Long-term climatological time series is regarded as homogeneous if the measurements have been consistently done using the same practices, with the same undamaged instruments at the same place and time and in the same environment. In this way the variations in the time series are only a result of variations in weather and climate. But the reality is that many climatic observations have been altered by a variety of external changes such as changes in instruments, observers, observation methods and practices, the station's geographical location and in the environment surrounding the station. Such changes can introduce sudden shifts (homogeneity breaks) to the time series, others, e.g., environmental changes, lead to gradual biases over time. This can mask the genuine climatic variations and can lead to erroneous interpretations about the evolution of climate (Peterson et al., 1998). Since these shifts and biases are often of the similar magnitude as the climate signal (Menne and Williams, 2009), analyzing and correcting for such external influences to achieve a homogeneous climatic time series is therefore necessary before making a climate assessment.
Several applications have been developed to detect inhomogeneities in climate series (WMO, 2020) including the new emerging techniques HOMER (Mestre et al., 2013), ACMANT (Domonkos, 2015; Domonkos and Coll, 2017), AHOPS (Rustemeier et al., 2017) and Climatol (Guijarro, 2018). The homogeneity approaches often benefit from consulting metadata to validate the breaks and possible outliers.
Homogenization of long-term precipitation series for mainland Norway has previously been done by Hanssen-Bauer and Førland (1994) using the Standard Normal Homogeneity Test (SNHT) (Alexandersson, 1986). The study analyzed 165 Norwegian precipitation series whereby 70 % of the series were found to be inhomogeneous. The most recent homogenization analysis on precipitation was done within the MIST-2 project, a collaboration between the Norwegian Meteorological Institute (MET Norway) and Statkraft SF (Lundstad, 2016) to homogenize daily precipitation series in Norway. Five precipitation series representing different energy consumption regions in Norway were successfully homogenized applying three different homogenization software's with different time resolution; HOMER (Mestre et al., 2013), MASH (Szentimrey, 1999, 2014) and RHtest (Wang and Feng, 2013, 2014).
The overarching goal of this study therefore is to perform a homogeneity analysis of Norway's monthly precipitation series in order to establish a high-quality precipitation reference dataset for calculating the Norwegian Meteorological Institute (MET Norway) new standard climate normal for the period 1991–2020.
2.1 Precipitation dataset
370 series of observed monthly precipitation sums were used in the homogenization analysis (Fig. 1). The raw precipitation time series included 325 series from mainland Norway, 44 Swedish series and one Finnish series. The Swedish and Finnish series were included in the analysis only as reference series to support the homogenization of the Norwegian precipitation series. The series were extracted from ClimNorm (a network activity under the Nordic Framework for Climate services) precipitation dataset (Tveito et al., 2020). Since the goal was to have a homogeneous data set for the period of new normals, i.e., 1991–2020, the analyzed period was extended back in time because longer time series gives a more robust result when homogenizing. The homogeneity analysis was performed in 2019. For this reason, the analysis covered a period from 1961–2018. When calculating the new normals, data from 2019 and 2020 were added to the homogenized dataset. While 548 series (including 50 from Sweden and two from Finland) were available during the study period, the 370 series upheld the criteria of 80 % data coverage (no more than ten missing years). To compute the climate normals such that it is representative of the 1991–2000 time period and the country, stations with short series were reconstructed. 33 % of the 370 series were merged and were reconstructed from up to four original series. The criteria for merging time series were based on a maximum horizontal distance of 10 km, and after the first automatic screening all merged series were manually checked (Tveito et al., 2020).
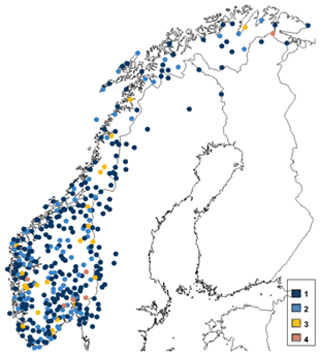
Figure 1Location of stations used in the study. The colors denote if the series is merged and if so, how many series are included in the merged series.
2.2 Climatol homogenization approach and application
Climatol (Guijarro, 2018, 2019) was used to detect inhomogeneities in Norway's monthly precipitation series. The method provides automatic quality control (outlier correction), homogenization (break detection and correction) and missing data attribution. In addition, Climatol is excellent for the detection and adjustment of inhomogeneities of large and dense networks like in this study and has the option to incorporate metadata information. Version 3.1.1 of the Climatol R package was used in this analysis. Climatol is highly dependent on difference series between a candidate series and its reference series and is based on the Standard Normal Homogenization Test (SNHT; Alexandersson and Moberg, 1997) for break detection. The difference series is estimated as a weighted average of the nearest and best correlated reference series. Correlation between the series is fundamental, because the higher the correlation, the higher the reliability of the homogenization and in-filling of missing data.
Climatol works with three types of data normalization applying the most appropriate ratios or differences depending on the climatological variable. Here normalizations were achieved by using the normal ratio to the mean method (dividing by the mean climatological values of the series). The process begins by normalizing all the original data and computing a reference series for each candidate series by averaging up to ten data series (if available) at every time step in the detection stages and four data series during the final series reconstruction. While these numbers of reference series can be changed by the user, the default ten series was used in this analysis. In this study, Climatol's homogenization approach, including the three-step homogenization stages described in Kuya et al. (2021) was adopted.
The results from exploratory analysis of the original data were used to determine the most suitable detection threshold values in this analysis. Diagnostic outputs were also used for quality control and to verify that there were no abnormal features in the data. The default threshold for outliers proved to be too low, as most outliers turned out to be legitimate measurements. Some outlying values were because of data entry error or processing error and were corrected. A higher outlier threshold was therefore chosen, so that none of the natural variability in the precipitation series was masked. Determining the most suitable SNHT value for this study included visualization of the histograms of maximum SNHT and those from different runs where the SNHT value was varied. After careful consideration, setting snht1 = snht2 = 22 seemed reasonable for this analysis. Other threshold values were also tested and as expected, tests with higher thresholds gave fewer detected breaks and tests with lower thresholds gave more breaks. The lower thresholds also gave more “outlier breaks”, that is, breaks occurring within a short time period of each other (a year or two apart or sometimes within the same year) caused by either especially high or low precipitation amounts. These are not actual homogeneity breaks, but a result of outliers. These test runs showed that one would have to choose a threshold low enough to include as many valid breaks as possible, but high enough to exclude most of the outlier breaks and falsely detected breaks. This supported the choice of 22 as a threshold.
After determining the user-specified threshold, detection of inhomogeneities was performed by first applying the SNHT on stepped overlapping windows, then on the whole series and finally generation of the final homogeneous series by filling all missing data by weighted ratios of nearby stations in the homogeneous sub-series. The detected breaks in the analysis were carefully examined against available metadata. The metadata was obtained digitally from MET Norway's database. The paper archive of station files at MET Norway was also used as a source. The detected breaks in the Swedish and Finnish series could not be verified because metadata was not available in this analysis.
Criteria for inhomogeneities
The criteria for accepting detected breaks were quite strict. For the inhomogeneity to be confirmed, Climatol's detected breakpoint had to be within five years of the metadata explaining the break. Breaks without metadata were accepted only if significantly high SNHT values were realized. Detected breaks within the first and last five years of the series were rejected (exceptions were however made for inhomogeneities that could be explained with obvious reasons and were four years from the end of the series. Such breaks should be re-evaluated again later when there are more data points on each side of the breaks). Close breaks, especially within five years of each other, were assessed carefully, and weight was placed on the break point with metadata (or the most obvious or dominant reason for a break). In addition, outlier breaks were rejected.
Results for homogeneity testing found 25 % of the Norwegian precipitation series as inhomogeneous. Climatol detected 121 breaks in the Norwegian precipitation series, but only 90 were accepted and homogenized after conferring with metadata. 16 of the Swedish precipitation series were classified as inhomogeneous and all breaks were accepted since metadata for these series were not available.
The main reason for inhomogeneities was relocation, explaining 71 % of the breaks in the Norwegian precipitation series. Figure 2a summarizes the causes for inhomogeneities in the Norwegian series. Figure 2b presents the annual adjustment factors (AFs) for all detected inhomogeneities in the Norwegian precipitation series, sorted by its causes. The distribution of AFs was quite symmetrical, and values ranged between 0.72 and 1.46. The different causes for breaks showed somewhat different patterns.

Figure 2(a) Reasons for inhomogeneities in the Norwegian precipitation series. They include relocation of the rain gauge, automation of the station, environmental changes, change of observer, and other unknown reasons. (b) Annual adjustment factors for all the detected inhomogeneities plotted against time grouped by their causes.
3.1 Analysis of inhomogeneities
3.1.1 Relocation
Relocation may cause breaks due to differences in either exposure or precipitation conditions between the two sites. The AFs were quite symmetrical around 1 with the mean value 1.008 which showed that there was no systematic tendency in the relocation AFs. Some large relocations of several kilometers led to very minor changes in the precipitation (break with just 1 % adjustment, or no break at all) while other small relocations of only a few meters led to major changes in precipitation with adjustments of 10 % or more. And vice versa. This illustrates that significant changes can be expected regardless of how far the precipitation gauge is moved, it all depends on the local conditions and environment at the site.
3.1.2 Automation
Station automation caused adjustments of the precipitation series with a mean value of 0.93, hence a net decrease in measured precipitation amount (an average decrease of 7 % in annual precipitation). This is in accordance with previous parallel measurements between manual and automatic gauges conducted by MET Norway, where the general tendency is that the measured precipitation amount is lower with automatic gauges on mainland Norway (e.g., Nygård, 2004). But this will of course vary depending on wind exposure, season, and amount of precipitation as snow in addition to whether the manual gauge was equipped with a windscreen. In very wind-exposed areas where a larger fraction of precipitation falls as snow, the automatic gauge may catch more precipitation than the manual gauge. It is important to note that in most cases the automation was coupled with a small or large relocation at the same time, and so the different precipitation conditions and wind exposure would also affect the AFs.
3.1.3 Environmental change
Changes in the local site cause a net 6 % increase in the annual precipitation after the change, which implies that most of the changes in the environment increased sheltering of the gauge. Two of the breaks with environmental change as the main reason resulted in a lower gauge catch, while four breaks gave an increased gauge catch
3.1.4 New observer
Changes in observers should ideally not influence precipitation measurements, but it may in some cases still cause changes in observation practices. The four accepted breaks with change of observer as the main reason all gave adjustments in the same direction, with an average of 11 % decrease in annual precipitation after the change.
3.2 Effects of using metadata
In addition to examining all detected break against available metadata, a comparison was made between the raw series, Climatol's automatically generated homogenized series and the homogenized series where metadata were used to verify breaks to assess the benefit of using metadata in the homogenization of Norway's precipitation series. The analysis was done only on the series with detected breaks. The two homogenized series (with and without metadata) had comparable linear trends: 2.864 % and 2.865 % per decade, and thus the difference induced by use of metadata was rather insignificant on a regional scale. The non-homogenized series exhibited a 1.8 % linear trend per decade. The difference was however large when analyzing single series. Results (not shown) of filtered values of the raw and homogenized series for an individual station showed that, while both homogenized series exhibited an increasing trend with time, in contrast to the raw series which has a decreasing trend, the temporal pattern in the two homogenized series were dissimilar. In this case the automatic adjustment may have masked some of the natural variability in the series when adjusting outlier breaks that were rejected when using metadata. This further proved the benefits of using metadata, as there can be pronounced differences in results when using metadata to accept and reject breaks.
3.3 Impacts of homogenization
Results presented show the impact and efficiency of homogenization on the Norwegian precipitation series. Comparison was made between the non-homogenized and the homogenized series. The series were converted into standardized anomalies using 1961–1990 as the reference period. The average of the annual and seasonal precipitation sums for all 325 Norwegian stations for both the non-homogenized and homogenized data was evaluated.
The results of mean annual total precipitation for the whole Norwegian network did not show too large differences between non-homogenized and homogenized series. This was however not surprising as only about 25 % of series analyzed were adjusted. Precipitation is a variable with large spatial and temporal variance, which makes break detection harder than for other variables such as temperature. Nevertheless, some differences were seen where homogenization led to higher deviation from the 1961–1990 average. Values of annual anomalies in the non-homogenized series ranged from −23 % to 27 %, while those of homogenized series ranged from −22 % to 32 %.
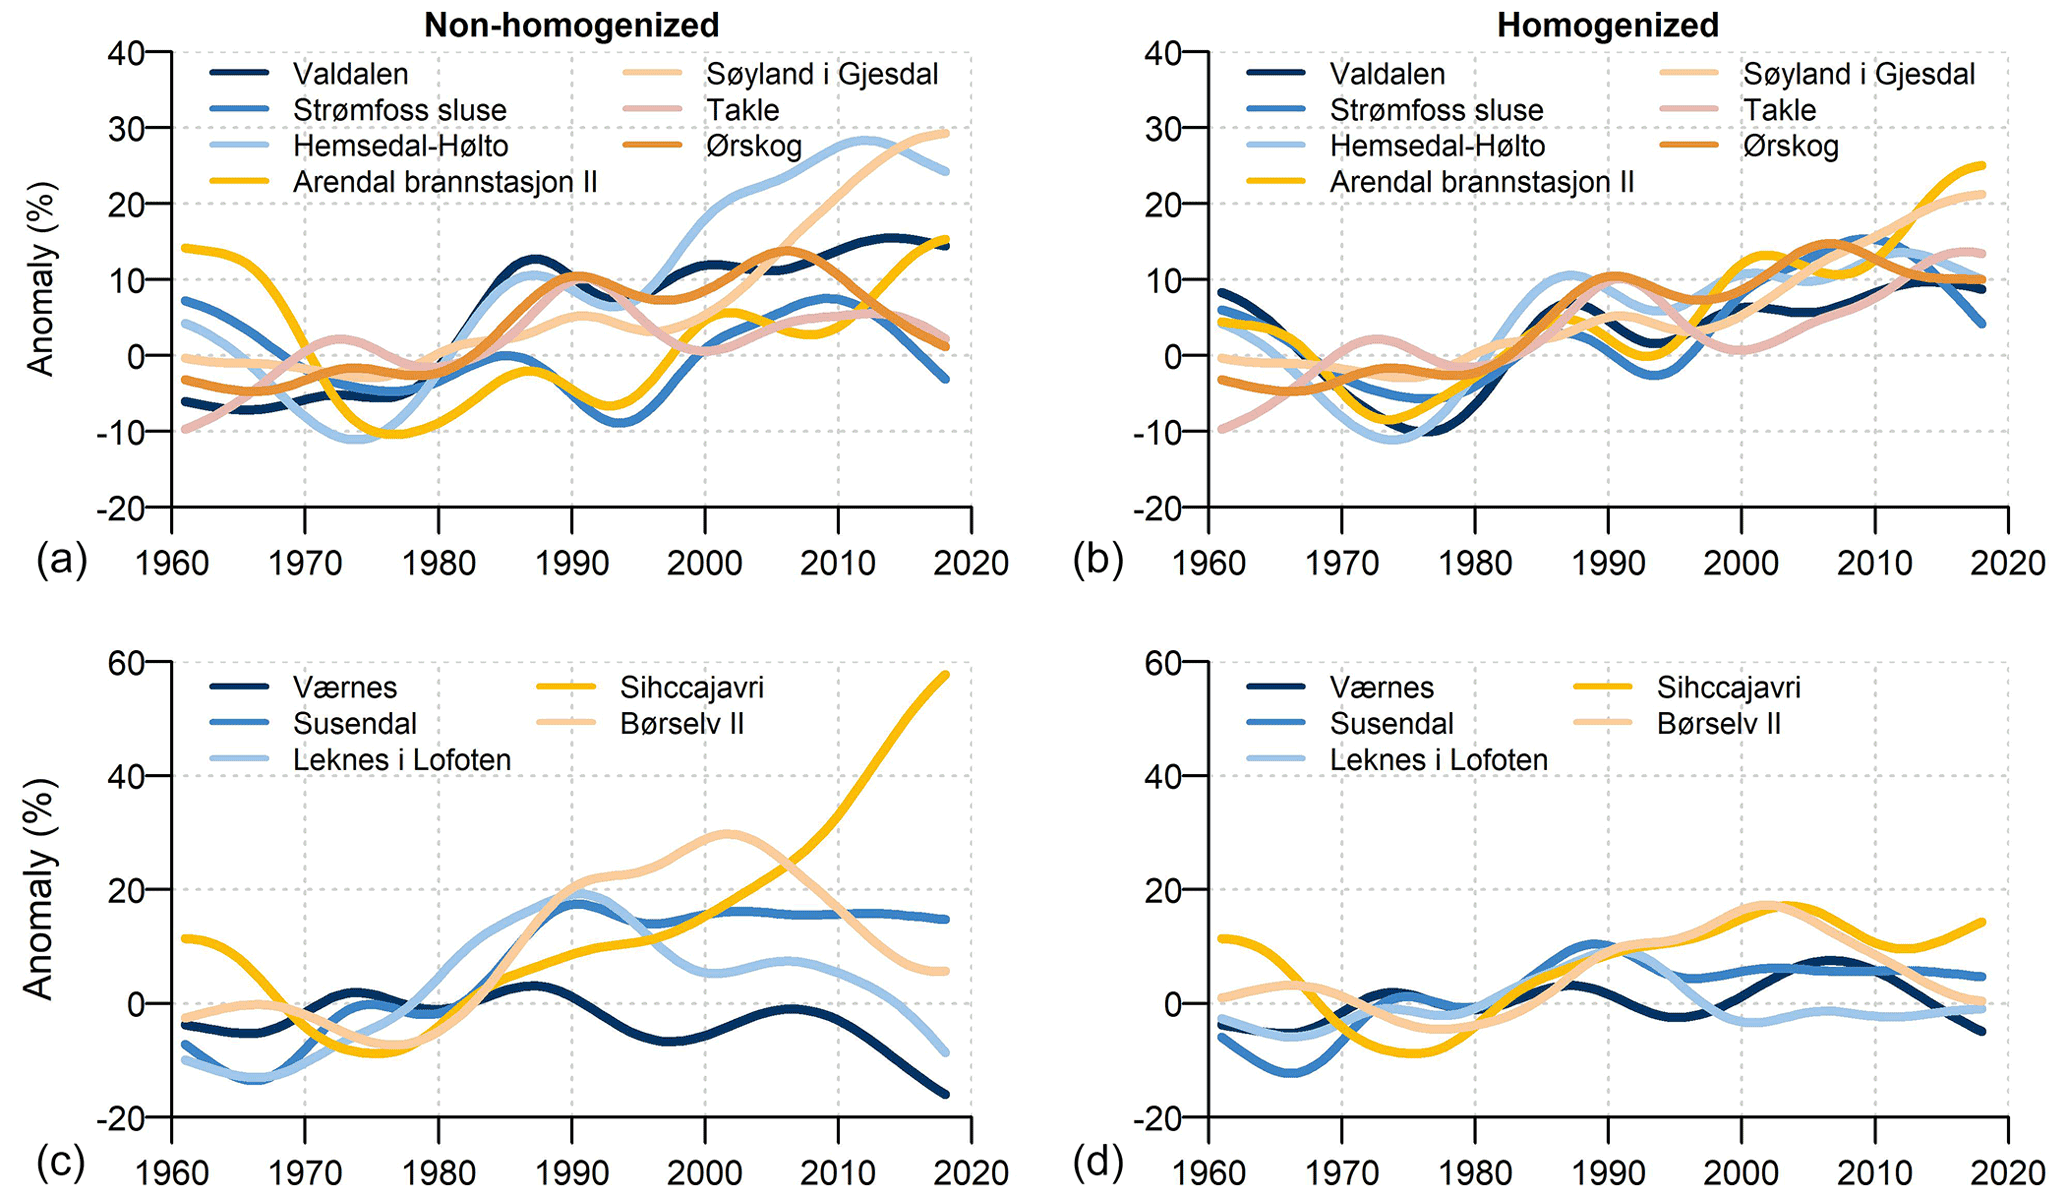
Figure 3Deviation of the annual precipitation series (1961–2018) in percent with respect to 1961–1990 mean for series in different climatic regions in Southern (a, b) and Northern Norway (c, d) before (a, c) and after (b, d) homogenization. The anomaly series has been filtered using a 10-year Gaussian density function.
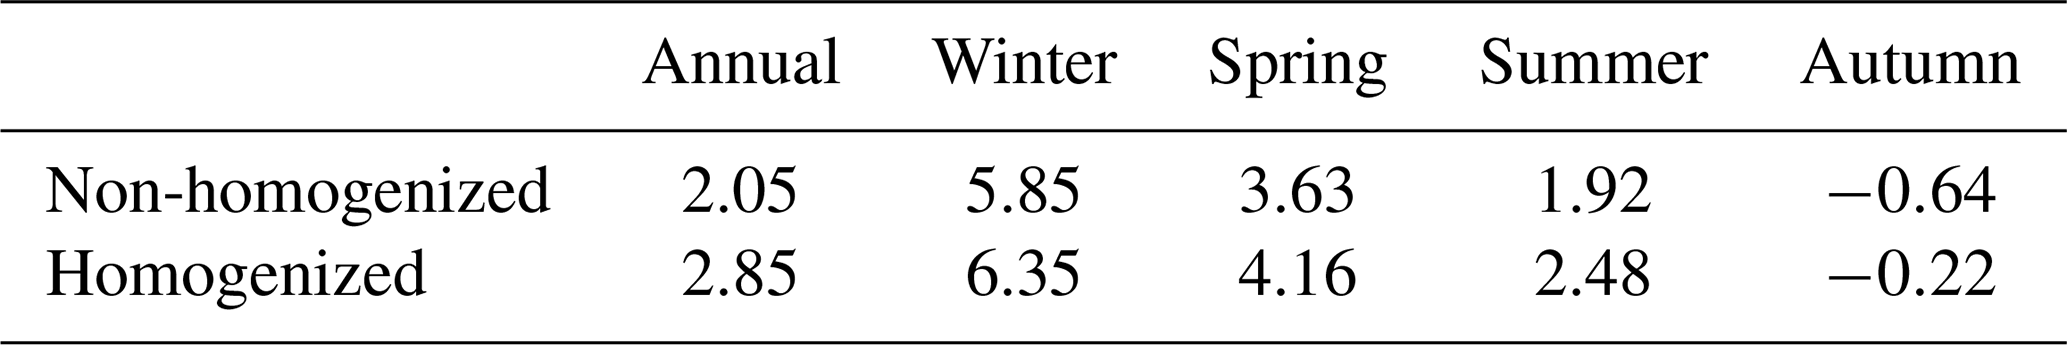
Both non-homogenized and homogenized time series for the annual and seasonal series showed increasing trends in the period 1961–2018 except in autumn where a decreasing trend is observed (Table 1). The 1961–1990 period was relatively wet in autumn compared to periods before and after. The homogenized series showed a higher trend compared to the non-homogenized series. 56 % of all the adjusted inhomogeneities had AFs below 1. As a result, the net effect of the adjustments led to reduced precipitation values, especially in the earlier parts of the series, causing a more pronounced increasing trend in the homogenized series. The greatest difference in trend size before and after homogenization was observed in the annual series, where linear trends changed by 0.8 % per decade. Most of the increase in the precipitation series has been during the last 30 years.
Table 1Linear trends (% per decade) of all annual and seasonal precipitation anomaly series (1961–2018) before and after homogenization.
To further understand the impact of homogenization on the precipitation series, the same calculations highlighted above were applied on some individual series representing different precipitation regions in Norway (Fig. 3). The range of anomalies with respect to the 1961–1990 reference period of the non-homogenized series is clearly wider than those of the homogenized series. Most series also show similar variability with time after homogenization. These results show that after homogenization, the spatial coherence of the temporal evolution of the series is better compared with the non-homogenized series. This proves that homogenization contributes to better temporal and spatial coherence of time series, while preserving the general statistical distribution of the raw time series.
Another comparison between the non-homogenized and homogenized series is presented in Fig. 4 where the difference between the two normal periods 1961–1990 and 1991–2020 is shown. The homogenized series exhibited smoother spatial patterns, meaning that the regional climate signal was well represented, with less local variations than in the maps based on the raw series. This is especially evident in the annual series.
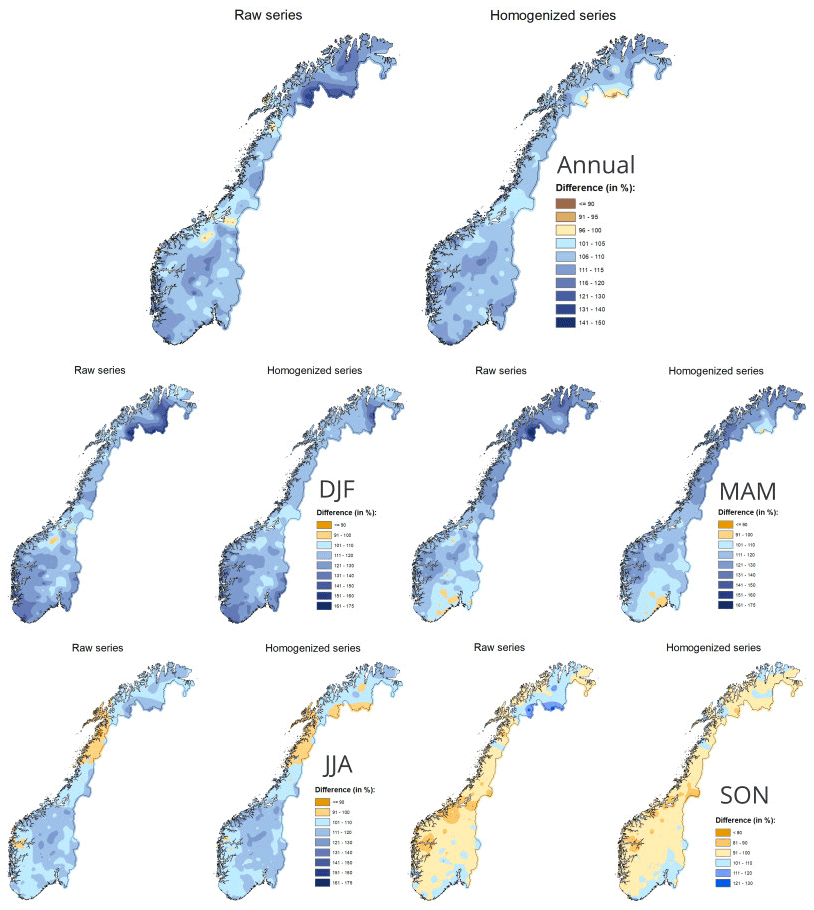
Figure 41991–2020 normal values in percent of the 1961–1990 normal for raw and homogenized annual and seasonal series.
In some regions the ratio between the two normal periods changed from above 100 % to below after homogenization. The greatest variation in the homogenized series was in the south-eastern region of Troms and Finnmark in Northern Norway where the highest decrease in both annual and seasonal precipitation was observed. From the map of annual series for example, the annual precipitation changed from over 140 % of the 1961–1990 mean before homogenization to under 100 % of the 1961–1990 mean after homogenization. This was also observed in the seasonal series. The results here are not surprising as most adjusted inhomogeneities in this region had large AFs above 1.2, hence the net effect of the adjustments led to increased precipitation values in the earlier parts of the series.
In conclusion, results based on the map after homogenization generally showed better regional coherence in comparison to the non-homogenized series. The homogeneous data are therefore more dependable in explaining the large-scale climate variations that should explain the change of “normal” climatologies.
The homogeneity analysis produced a 58-year long homogenous dataset for 325 monthly precipitation series, during the period 1961–2018. 370 series (including 44 from Sweden and one from Finland) from the ClimNorm precipitation dataset were used in the homogenization analysis. Application of Climatol homogenization method detected inhomogeneities in 29 % of the Norwegian precipitation series. A strict set of guidelines for inhomogeneity testing was followed to avoid over-adjusting of the dataset while still detecting as many real breaks as possible. Therefore, only 25 % of the series were classified as inhomogeneous after conferring with metadata and therefore adjusted. Precipitation is a variable with large spatial and temporal variance, which makes break detection harder than for other variables such as temperature. Breaks must be of a certain size to be noticeable over the general noise level, and thus many changes may not lead to detectable breaks.
The results of homogeneity testing showed that relocation of the precipitation gauge and automation were the main causes of inhomogeneities in the Norwegian series, explaining 71 % and 12 % respectively of all detected breaks. All but one of the accepted inhomogeneities could be confirmed with metadata. The homogenized series showed increasing trends in the period 1961–2018 except in autumn where a decreasing trend was observed. The highest trend was observed in the winter series while the greatest difference in trend size before and after homogenization was observed in the annual series. The most noticeable changes before and after homogenization were seen in the south-eastern region of Troms and Finnmark in Northern Norway, where the highest decrease in both annual and seasonal precipitation was observed. Nevertheless, results after homogenization showed better regional coherence in comparison to the non-homogenized series.
In general, homogenization greatly improved the quality of precipitation series by reducing the regional variability and improving both the temporal and spatial coherence of the dataset. The dataset was thus more reliable in explaining the large-scale climate variations and was used to calculate the new climate normals in Norway.
The homogenization software Climatol is openly accessible at https://cran.r-project.org/web/packages/climatol/index.html (CRAN, 2022). Information about other codes can be obtained from the corresponding author upon request.
All unhomogenized precipitation series can be accessed from MET Norway's archive of historical weather and climate data (https://seklima.met.no/; MET Norway, 2022a). The new normal precipitation series can be accessed through https://frost.met.no/ (MET Norway, 2022b). The homogenized precipitation data set will be accessible in MET Norway's archive at some point but can for now be accessed from the corresponding author upon request. The unhomogenized precipitation series from the Swedish Meteorological and Hydrological Institute and The Finnish Meteorological Institute can be accessed from the corresponding author upon request.
EKK wrote the manuscript with contributions from all authors. OET was responsible for providing the data series of the analyzed stations while EKK and HMG performed the homogeneity testing and analysis. OET calculated the new precipitation normals.
The contact author has declared that none of the authors has any competing interests.
Publisher's note: Copernicus Publications remains neutral with regard to jurisdictional claims in published maps and institutional affiliations.
This article is part of the special issue “21st EMS Annual Meeting – virtual: European Conference for Applied Meteorology and Climatology 2021”.
This paper was edited by Dan Hollis and reviewed by Athanassios Argiriou and one anonymous referee.
Alexandersson, H.: A homogeneity test applied to precipitation data, J. Climatol., 6, 661–675, 1986.
Alexandersson, H. and Moberg, A.: Homogenization of Swedish temperature data. Part I. Homogeneity test for linear trends, Int. J. Climatol., 17, 25–34, 1997.
CRAN: climatol: Climate Tools (Series Homogenization and Derived Products), CRAN [code], https://cran.r-project.org/web/packages/climatol/index.html, last access: 24 June 2022.
Domonkos, P.: Homogenization of precipitation time series with ACMANT, Theor. Appl. Climatol., 122, 303–314, https://doi.org/10.1007/s00704-014-1298-5, 2015.
Domonkos, P. and Coll J.: Homogenization of temperature and precipitation time series with ACMANT3: method description and efficiency tests, Int. J. Climatol., 37, 1910–1921, https://doi.org/10.1002/joc.4822, 2017.
Guijarro, J. A.: Homogenization of climatic series with Climatol, Version 3.1.1. Guide, https://www.climatol.eu/homog_climatol-en.pdf (last access: 23 June 2022), 2018.
Guijarro, J. A.: Climatol: climate tools (series homogenization and derived products), R package version 3.1.2, https://CRAN.R-project.org/package=climatol (last access: 23 June 2022), 2019.
Hanssen-Bauer, I. and Førland, E. J.: Homogenizing Long Norwegian Series, J. Climate, 7, 1001–1013, 1994.
Kuya, E. K., Gjelten, H. M., and Tveito, O. E.: Homogenization of Norwegian monthly precipitation series for the period 1961–2018, MET report 04/21, Climate, https://www.met.no/publikasjoner/met-report/met-report-2021/_/attachment/download/829d6a8e-1ec8-417d-8231-0268bddac4bb:7eb30ca105a6cf1d470453976bb8d729a64b25a4/METreport 04-21-Homogenization of precipitation 1961-2018.pdf (last access: 23 June 2022), 2021.
Lundstad, E.: Homogenization of daily precipitation in Norway, MET Report 12/2016, https://www.met.no/publikasjoner/met-report/met-report-2016/_/attachment/download/054313fb-d309-431d-92ac-91600ce0e23b:2ba1335a26fa938462e691818265b6936944c2cb/MET-report-12-2016.pdf (last access: 23 June 2022), 2016.
Menne, M. J. and Williams, C. N.: Homogenization of Temperature Series via Pairwise Comparisons, J. Climate, 22, 1700–1717, https://doi.org/10.1175/2008JCLI2263.1, 2009.
Mestre, O., Domonkos, P., Picard, F., Auer, I., Robin, S., Lebarbier, E., Böhm, R., Aguilar, E., Guijarro, J., Vertachnik, G., Klancar, M., Dubuisson, B., and Stepanek, P.: HOMER: a homogenization software – methods and applications, Idojaras – Quarterly Journal of the Hungarian Meteorological Service, 117, 47–67, 2013.
MET Norway: Seklima Observasjoner og værstatistikk, https://seklima.met.no/ (last access: 24 June 2022), 2022a.
MET Norway: Frost API, https://frost.met.no/index.html (last access: 24 June 2022), 2022b.
Nygård, H. D.: Nedbørmålingar frå Geonor T-200 samanlikna med manuelle målingar, MET Norway ObsReport 008, MET Norway, 2004.
Peterson, T. C., Easterling, D. R., Karl, T. R., Groisman, P., Nicholls, N., Plummer, N., Torok, S., Auer, I., Boehm, R., Gullett, D., Vincint, L., Heino, R., Tuomenvirta, H., Mestre, O., Szentimrey, T., Salinger, J., Førland, E. J., Hanssen-Bauer, I., Alexandersson, H., Jones, P. D., and Parker, D.: Homogeneity adjustments of in situ atmospheric climate data: a review, Int. J. Climatol., 18, 1493–1517, https://doi.org/10.1002/(SICI)1097-0088(19981115)18:13<1493::AID-JOC329>3.0.CO;2-T, 1998.
Rustemeier, E., Kapala, A., Meyer-Christoffer, A., Finger, P., Schneider, U., Venema, V., Ziese, M., Simmer, C., and Becker, A.: AHOPS Europe – a gridded precipitation data set from European homogenized time series, in: 9th Seminar for Homogenization and Quality Control in Climatological Databases, WMO, Geneva, 88–101, WCDMP-85, 2017.
Szentimrey, T.: Multiple Analysis of Series for homogenization (MASH), Proceedings of the second seminar for homogenization of surface climatological data, WCDMP-No. 41, WMO, Budapest, Hungary, 27–46, https://library.wmo.int/index.php?lvl=notice_display&id=11624#.YrTRCHZBz-i (last access: 23 June 2022), 1999.
Szentimrey, T.: Multiple Analysis of Series for Homogenization, MASHv3.03, Hungarian Meteorological Service, p. 64, 2014.
Tveito, O. E., Aniskevica, S., Cappelen, J., Engström, E., Gjelten, H. M., Jensen, C. D., Jokinen, P., Kuya, E. K., Lussana, C., Mändla, K., Mäkelä, A., Pärg, R., Zandersons, V., and Wern, L.: ClimNorm-temperature data set for regional analysis, MET Report 04/2020, https://www.met.no/publikasjoner/met-report/met-report-2020/_/attachment/download/e776da17-8444-424f-9347-592cc3a63c04:217c2f29d827ffa7f6854a31377745d6336f39d8/MET-report-04-2020.pdf (last access: 23 June 2022), 2020.
Wang, X. L. and Feng, F.: RHtests_dlyPrcp User Manual, Climate Research Division, ASTD, Ontario, Toronto, Environment Canada, http://etccdi.pacificclimate.org/RHtest/RHtests_dlyPrcp_UserManual_10Dec2014.pdf (last access: 23 June 2022), 2013.
Wang, X. L. and Feng, F.: RHtestsV4 User Manual. Climate Research Division, Atmospheric Science and Technology Directorate, Science and Technology Branch, Environment Canada, http://etccdi.pacificclimate.org/software.shtml (last access: 23 June 2022), 2014.
WMO – World Meteorological Organization: Guidelines on Homogenization, WMO-No. 1245, Geneva, Switzerland, https://library.wmo.int/doc_num.php?explnum_id=10352 (last access: 23 June 2022), 2020.