 | 10 Jul 2023
Investigation of the ENVI-met model sensitivity to different wind direction forcing data in a heterogeneous urban environment
Nils Eingrüber
Wolfgang Korres
Ulrich Löhnert
Karl Schneider
As the frequency of extreme heat events in cities is significantly increasing due to climate change, the implementation of adaptation measures is important for urban planning. Microclimate modelling approaches enable scenario analyses and evaluations of adaptation potentials. An ENVI-met microclimate model was setup for a heterogeneous urban study area in Cologne/Germany characterized by closed building structures in the eastern part and an urban park area in the western part. The goal of this paper is to evaluate the model sensitivity and performance to different wind direction forcing and demonstrate the importance of accurate wind forcing data for precise microclimate modelling evaluated with sensor measurements. To this end, we compared simulated air temperatures at 3 m height level using measured wind direction forcing data with simulated air temperatures using constant wind direction forcing from west, north, east and south direction. All other forcing data like wind speed were kept exactly the same as in the reference run. This sensitivity study was performed for a warm summer day in 2022. The model results of all five model runs (reference plus four scenarios) were compared to microclimatological measurements derived from one station of a dense meteorological sensor network located in the study area using the simulated mean air temperatures. We found significant temperature differences between the four sensitivity tests and the reference run as well as to the sensor measurements. Temperature differences between the reference run and the measurements were small and a high statistical model fit could be determined (Nash Sutcliffe Model Efficiency Coefficient/NSE = 0.91). The four model runs with constant wind directions showed significantly larger differences to measurement data and a worse statistical correlation between simulated and observed data (NSE between 0.62 and 0.15). For constant west winds, cooler air temperatures and higher wind speeds were found in the urban park and in the streets and courtyards east of the park. Constant east wind causes warmer air temperatures in the urban park area and lower wind speeds in the street canyons and inner courtyards. This shows that cooling effects in adjacent building blocks due to the greened urban park largely depend on the wind direction. The sensitivity tests show that the wind direction effect can result in local air temperature differences of up to 4 K on average. These results shows that even on summer days with low wind speeds, accurate wind direction data is highly relevant for accurate air temperature simulation. This finding can have important implications for urban planning and the design of green infrastructures in cities, e. g. for the design of fresh air corridors.
- Article
(2440 KB) - Full-text XML
- BibTeX
- EndNote


The increasing frequency and severity of extreme weather events such as heat, drought or flooding is a major problem in cities and a key challenge for urban planning (Yang et al., 2022). Adaptation strategies to mitigate climate change effects are needed on different spatial scales from national to local scale. Participation by all parts of the society is needed to address these challenges (Cortes et al., 2022). Model based scenario analyses are a suitable approach to test and evaluate the efficacy of adaptation strategies as measures must be based on sound scientific analyses (Chatzinikolaou et al., 2018). Physically-based microclimate models such as ENVI-met (Bruse, 2022) are therefore an important tool to investigate the potentials and limits of climate change adaptation measures of both existing urban structures and new city development (Perini et al., 2022; Liu et al., 2021; Kotharkar et al., 2020; Crank et al., 2018). A 3D model domain for a small scale (16 ha) urban study area in Cologne/Germany was setup and parameterized to assess different adaptation strategies to mitigate urban heat and health risks. The study area is heterogeneous in terms of the geometry of build-up areas and open spaces. It is characterized by dense development in the east as well as an urban park area with a pond in the western part. Assessing the suitability and potentials of different adaptation approaches based upon numerical simulation models requires a good understanding of the model sensitivity to key model inputs. Heat events occur particularly in low wind situations during summer high-pressure weather conditions. The local wind field can be quite variable in these situations, especially for this heterogeneous study area. Thus, the goal of this paper is to assess the sensitivity of our ENVI-met model setup with regard to the effects of forcing the model with different wind direction data. The sensitivity is assessed with respect to the simulated air temperatures. In this way, we want to analyse how the microclimatological conditions vary within the study area depending on changes in the flow field. Air temperatures at 3 m height level for a warm summer day (daily maximum temperature > 25 ∘C) in 2022 were simulated with ENVI-met using the actually observed wind direction data for model forcing in 30 min resolution. This reference run is compared to simulated model outputs of sensitivity tests with continuous wind direction forcing from west, north, east and south direction. This sensitivity study thus investigates the influences of the urban geometry and the big park area in the western part of the study area upon the simulated air temperature. Based on the comparisons of the model outputs of these four sensitivity tests and the reference run to observed sensor measurement data, this paper aims to demonstrate the importance of accurate wind forcing data for precise microclimatological modelling and the simulation of the air temperature. The model quality is assessed for the reference run by comparing the simulated air temperatures with measured air temperatures obtained from a densely-distributed NETATMO weather station network setup in our study area. The NETATMO sensors are quality checked, calibrated and recalibrated continuously under laboratory conditions and in the field (Eingrüber et al., 2022). Utilizing inexpensive, but quality checked sensor networks provides an approach to facilitate citizen participation in developing suitable and acceptable adaptation measures. The statistical agreement of the modelled air temperatures of the reference run and of the four constant wind direction sensitivity runs with the measurements is analysed using various goodness-of-fit indicators to demonstrate that wind direction data is a highly relevant modelling parameter to accurately reproduce the microclimatological measurements of air temperature in this heterogeneous study area.
2.1 Model domain and model setup
An ENVI-met (Version 5.0) model domain was developed for a 16 ha study area in Western Germany in the southern city of Cologne. This residential area is characterized by closed building structures with predominant orthogonal street arrangements (see Fig. 1). The urban park “Volksgarten” in the western part of the study area is a mostly grassed area with groups of bushes and trees. The 3D gridded model domain was set up utilizing generally available urban-structural data from cadastral databases including the building geometry and building heights. Furthermore, based on open-source data of the city department of Cologne and own measurements in the study area, topographical data, soil types and soil profiles, traffic emission data based on the daily traffic values (DTV) of the streets, vegetation profiles such as urban trees in the park or the closeby avenue, green infrastructures and facade or roof greenings have been designed, parameterized and located within the gridded 3D model domain. Meteorological forcing data for the lateral boundary conditions of the model were taken from our research-grade Campbell weather station in the urban park area to drive the model (Eingrüber et al., 2021). At this station, wind speed as well as wind direction, precipitation, air temperature and relative humidity are measured continuously. Solar radiation is monitored by a 4-component net radiometer measurement system (CNR4 from Kipp & Zonen) with two pyranometers and two pyrgeometers measuring incoming and outgoing shortwave and longwave radiation. A diffusometer system with two pyranometers with and without a shadow ring was used to measure diffuse radiation and global radiation. The diffuse radiation is corrected by a factor of 1.12 according to the correction table of the manufacturer DELTA OHM. The direct solar radiation is calculated by subtracting the corrected diffuse radiation from the global radiation. The relative cloudiness level for high, medium and low level clouds is derived from ceilometer measurements of a meteorological station, operated by the University of Cologne, located in 1.6 km distance to the study area. The temporal resolution of all the measured forcing data to drive the model is 30 min. The model domain was gridded with a m spatial resolution and a temporal resolution of one second. Model outputs for each grid cell were stored in an hourly interval for a simulation duration of 22 h (08:00 local time (LT)) on 16 June 2022 to 06:00 LT on the following day) after a previous model spin-up phase of eight hours (00:00 to 08:00 LT). The simulation period was characterized by a high-pressure system over Western Germany leading to calm winds, low advection and thus predominantly locally forced summer conditions.
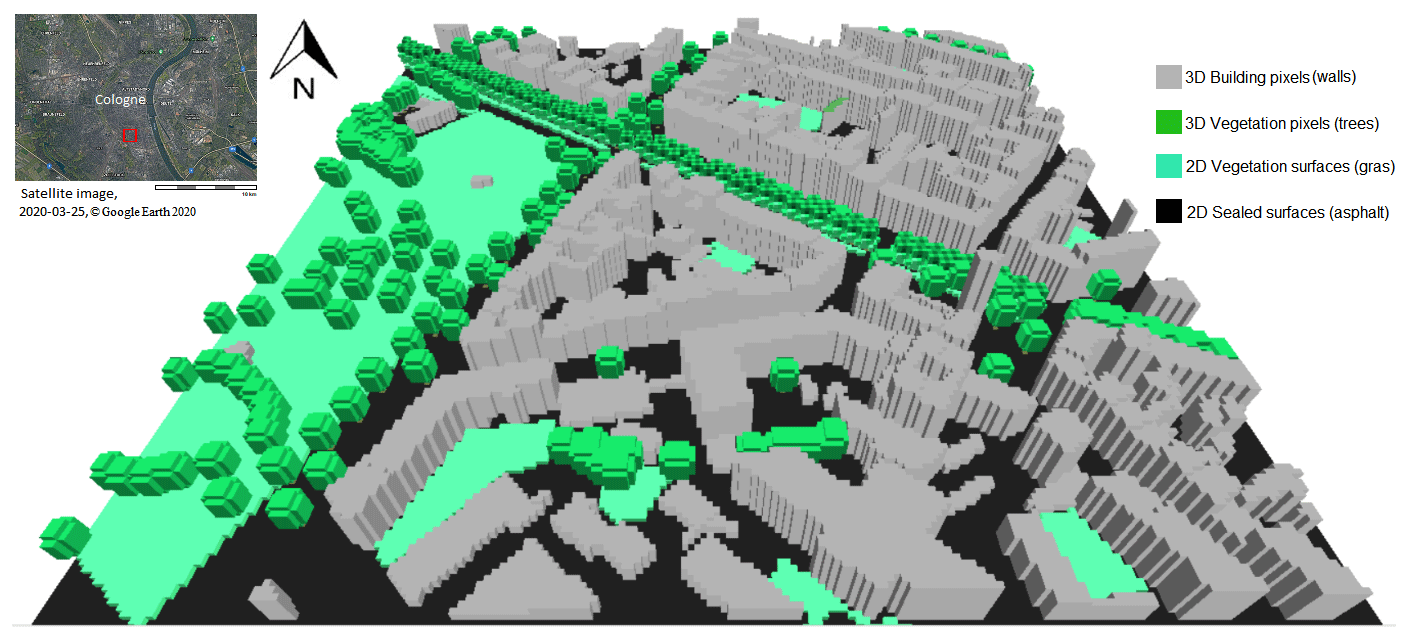
Figure 1Representation of the 3D gridded ENVI-met model domain for the 16 ha urban study area in Cologne/Germany.
2.2 Sensitivity analyses of wind direction
In addition to a model run driven by measured meteorological forcing data during the simulation time period for all variables (reference run), four sensitivity tests have been conducted to assess the impact of wind direction upon the modelled air temperature. The measured wind direction used in the reference run showed slightly varying wind directions mainly from SW with an average wind speed of 0.45 m s−1 and a maximum wind speed of 1.11 m s−1 in 5 m height. For the four sensitivity analyses, we used constant wind directions from 360∘ N, 90∘ E, 180∘ S and 270∘ W all times. All other forcing data in these sensitivity runs, and thus also the wind speed, were kept identical to the reference run. In this way, all other variables except the synthetically generated constant wind direction data are based on the truly station measured meteorological forcing data of the reference run in these four sensitivity tests. The output data of the five model simulations are compared to each other by mapping the air temperatures and the flow field in a pedestrian height level (grid cell plane of 1–3 m).
2.3 Validation and statistical evaluation
For validation of the model outputs of the five runs (sensitivity tests and reference run), we have used air temperature measurements of our NETATMO weather sensor network (Eingrüber et al., 2022). For this sensitivity study, we have selected the sensor A10 due to the fact that this sensor is located nearly in the center of our study area and directly at the street corner of the two main roads (Fig. 2e). Thus, this sensor is very well ventilated through the two orthogonal streets corridors and there are no obstacles for wind flow from the park to this sensor. This low-cost sensor was installed at a height level of 3 m above the ground and a distance of 1.7 m from the facade of the street corner building. A10 is installed above a grassy front garden close to the street side walk. The sensors of our NETATMO weather station network are radiation-shielded and regularly quality-checked under laboratory conditions and in the field to ensure long-term stability and consistency of the measurement system. They are recalibrated and rotated every six months. Three recalibration procedures have been carried out until now. The two-point calibrations against a high accuracy reference sensor showed a mostly constant RMSE ranging from 0.82 to 0.88 ∘C during the past 1.5 years. In addition, one NETATMO sensor is directly installed at the research-grade meteorological station (Campbell Sci.) in the urban park area to continuously assess the quality of the NETATMO sensors. The comparison of the air temperature measured over the whole observation period of 1.5 years by the NETATMO sensor and the Campbell Sci. station showed a very good performance of the NETATMO sensors (NSE = 0.97).
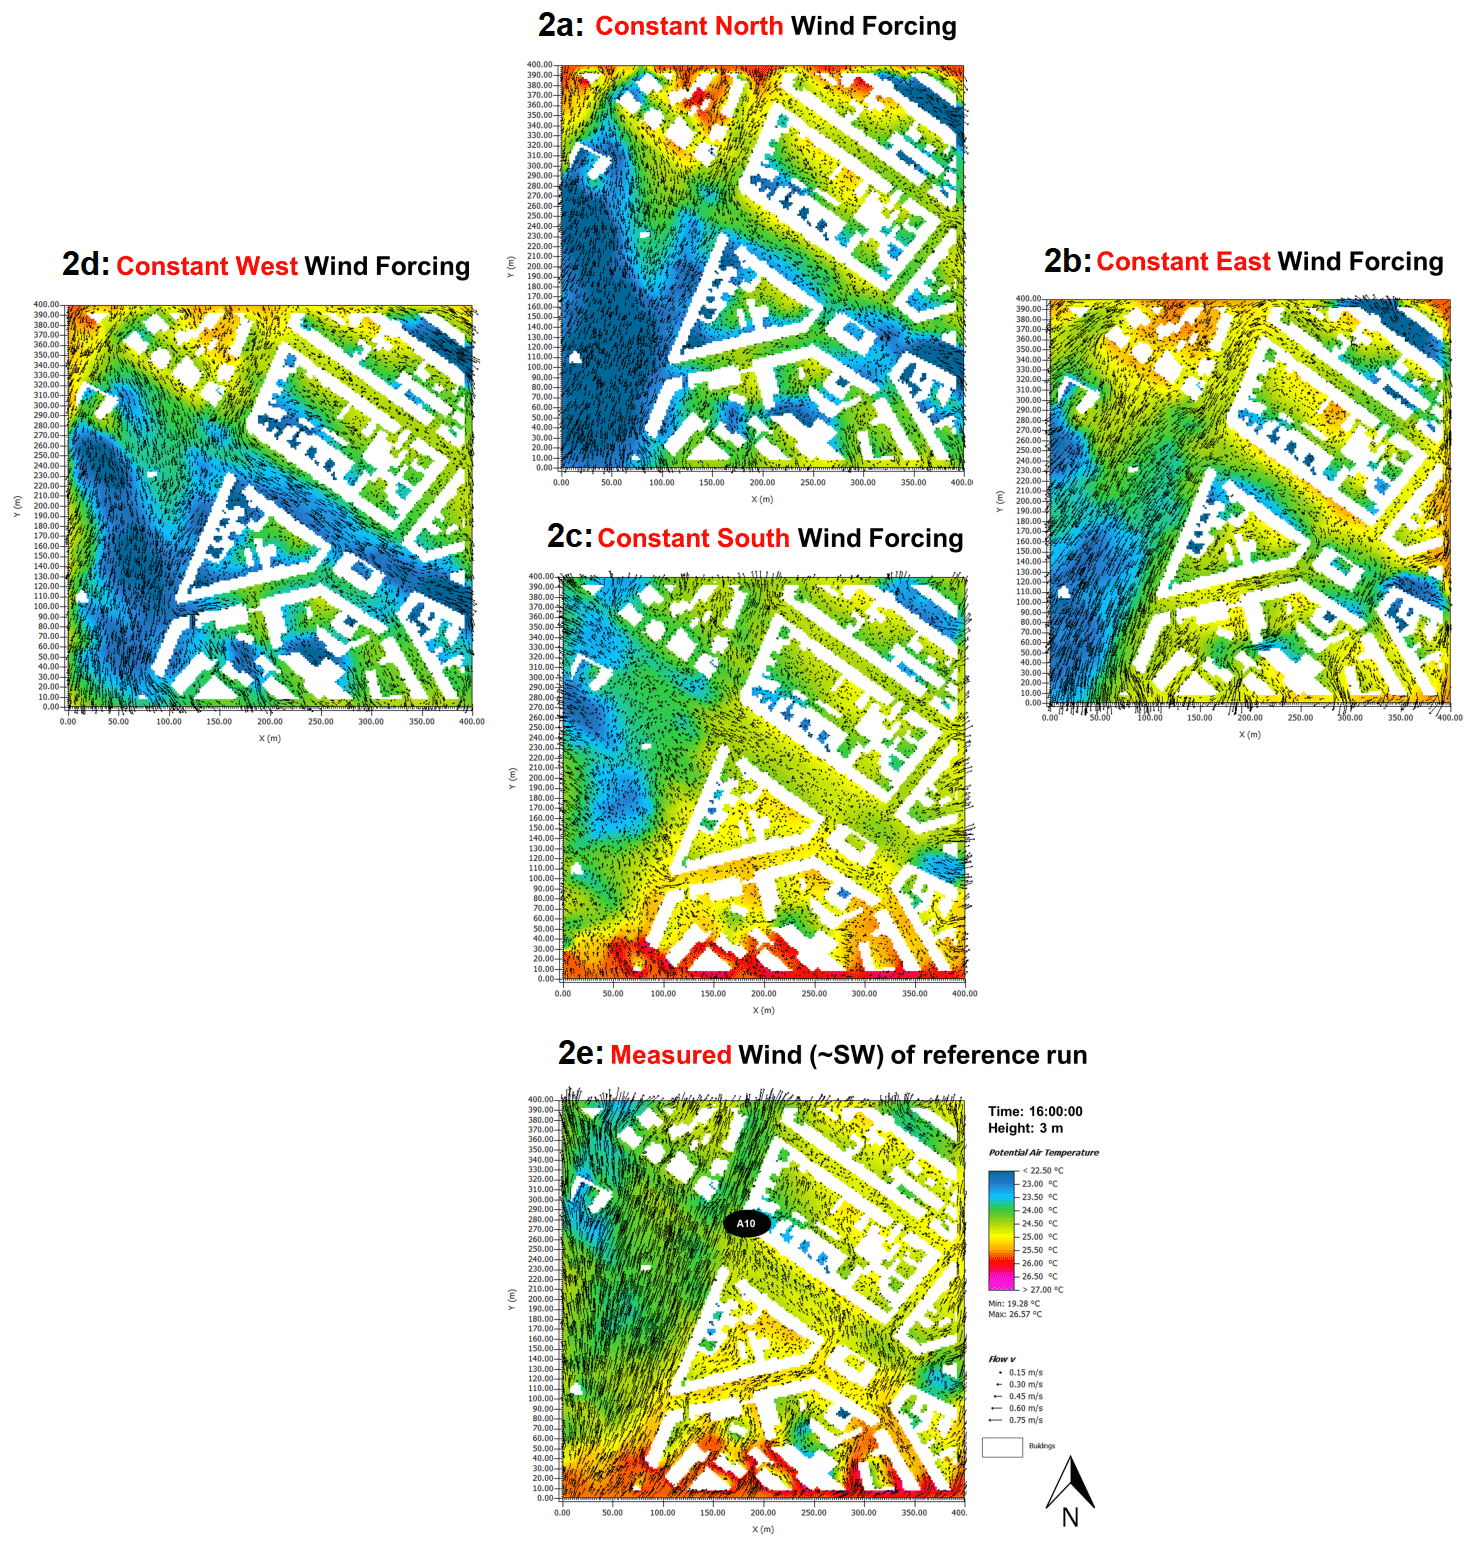
Figure 2Simulated air temperatures and resulting wind vectors at a height level of three meters at 16:00 LT (maximum temperature of that day) for the four sensitivity runs with constant N/E/S/W wind direction forcing and the reference run with the truly measured wind direction forcing data.
To evaluate the model outputs, differences between the simulated air temperatures of the five model simulations and the sensor temperature measurements were assessed based on descriptive statistical parameters like the simulated mean temperature as well as the standard deviation, maximum, minimum and amplitude value and by using t-tests with a significance level of α= 0.05. Furthermore, the ENVI-met modelled air temperatures of the reference run and the four sensitivity tests are compared to the NETATMO measurement data using two absolute goodness-of-fit indicators: the mean absolute error (MAE) and the root mean squared error (RMSE). In addition, the simulated air temperatures were checked against the measurements using three relative goodness-of-fit indicators: the Nash Sutcliffe Model Efficiency Coefficient (NSE), the coefficient of determination (R2), and Willmotts' Index of Agreement (d).
The simulated air temperatures and the wind vectors at 3 m height are exemplarily shown for the five model runs in Fig. 2 for 16:00 LT. At this time, the temperature reached its maximum on that day. For constant west wind forcing (Fig. 2d), cooler air temperatures and higher wind speeds in the urban park as well as in the adjacent downwind streets and inner courtyards east of the park can be observed in contrast to the northern building blocks. Similarly, for constant north wind forcing (Fig. 2a), slightly warmer air temperatures and lower wind speeds were found in the built up structures particularly in the northern part in comparison to the west wind test. Constant east wind forcing (Fig. 2b) causes higher wind speeds and warmer air temperatures in the urban park area but lower wind speeds in the street canyons and inner courtyards. Constant south wind forcing (Fig. 2c) test results in very low wind speeds in the entire model domain and warmer air temperatures in the southern built up areas. Also, the air temperatures in the urban park area are warmest under constant south wind forcing. The temperature distribution of the reference run with the actually measured wind direction forcing (Fig. 2e) is most similar to the distribution of the constant south wind forcing run. However, the wind speeds are much higher in the reference run than in all four sensitivity tests. This can be explained by the change in wind directions over time and thus more turbulent flow in the reference run as compared to the constant wind directions of the sensitivity tests. Overall, the wind fields and temperature distributions for the five simulations agree with the expected patterns. It becomes clear that cooling effects in the adjacent building blocks due to the greened urban park area can largely vary depending on the predominant wind direction. The obvious cooling effects especially in the eastern built up parts of the study area during west wind situations can be explained by wind corridor effects of the west-east oriented street canyons, which represent direct fresh air lanes from the cold air source of the urban park in the western part of the study area into the eastern districts.
Table 1 shows the measured and simulated mean temperatures, standard deviations, maximum, minimum and amplitude values for the grid cell containing the NETATMO sensor A10 for the sensor measurements and for the five model simulations (reference run and four sensitivity tests). For all four sensitivity tests, significant differences in the mean air temperature can be identified in comparison to the measured dataset. The mean air temperature of the reference run is closest to the measurement data while all four sensitivity tests show significantly lower means. Also, the standard deviation and the amplitude of the measured dataset are most similar to the reference run and much higher for the four sensitivity tests. Furthermore, the mean air temperature of the sensitivity run with constant south wind direction forcing (17.13 ∘C) is most similar to the reference run (18.24 ∘C), while the sensitivity test with constant west wind direction (14.93 ∘C) differs the most from the reference run and from the measurement data. When comparing the plotted time series of the five simulations to the measurements from the NETATMO sensor A10 (see Fig. 3), it becomes clear that the highest similarity of the daily course to the measurement data can be observed for the reference run. During the simulation period, the reference run slightly overestimates the measurements. At night, it slightly underestimates the measurements. All four sensitivity runs underestimate the measurements except for the time from 16:00 to 18:00 LT. The magnitudes of the underestimations of the four sensitivity runs are much larger than for the reference run and vary around 4 K. The highest negative deviations from the measurements can were found for the simulation with constant west wind forcing especially during night-time. In this situation, cool air from the western urban park directly flows into the street canyons of the adjacent eastern building blocks. This effect can also be seen during daytime in Fig. 2d. The results shown in the time series plots can be substantiated by statistical goodness-of-fit indicators (see Table 2). The highest agreement of the measured and the simulated air temperatures was found for the reference run with a NSE of 0.91. In contrast, the lowest NSE of 0.15 was found for the west wind forcing run. MAE and RMSE are also smallest for the reference run, quantifying the good model fit to the measurements for the reference run with the truly measured wind direction forcing data and the obvious deviations of all sensitivity runs. The sensitivity run with the highest agreement to the reference run and the measurement data is the south wind forcing run (NSE = 0.62).
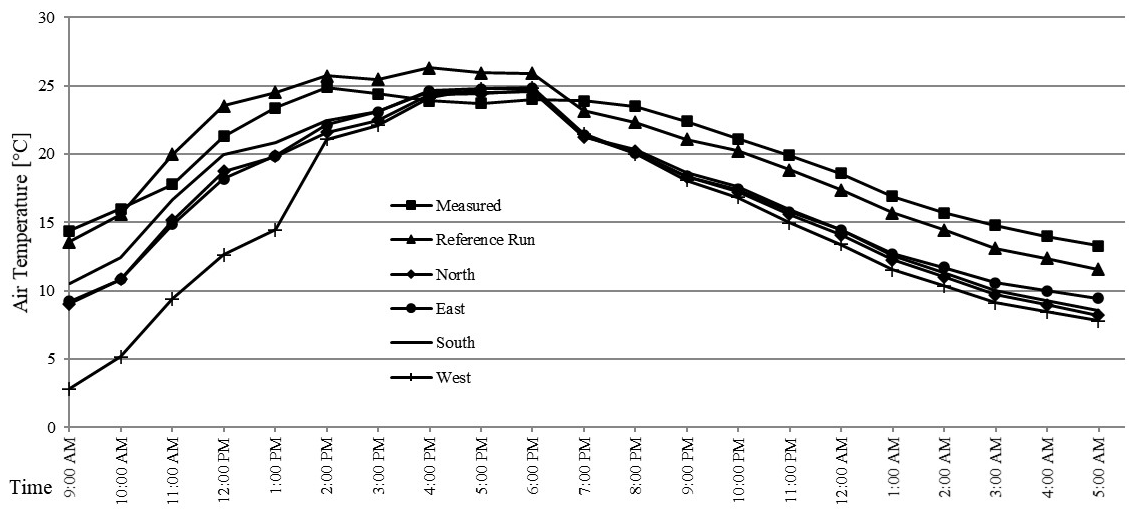
Figure 3Comparison of the air temperatures at the grid cell of the sensor A10 between NETATMO measurements and modelled data from the ENVI-met reference run and the four sensitivity tests.
Table 1Descriptive statistical parameters of the measured air temperatures at the grid cell of the NETATMO sensor A10 and the corresponding ENVI-met modelled air temperatures of the reference run and the four sensitivity runs based on hourly values for the 22 h simulation period from 16 to 17 June 2022.
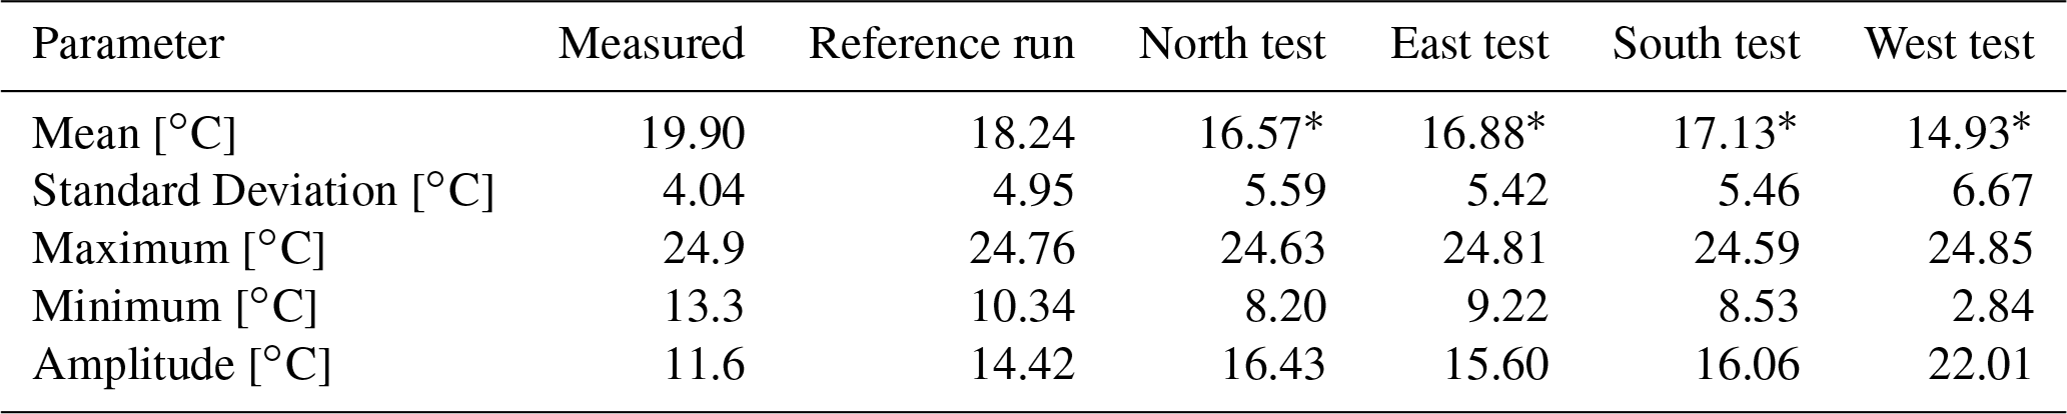
* Significant difference of modelled dataset to measured dataset for α= 0.05.
Table 2Statistical goodness-of-fit indicators between the measured air temperatures at the grid cell of the NETATMO sensor A10 and ENVI-met modelled air temperatures of the reference run and the four sensitivity runs for the simulation period.
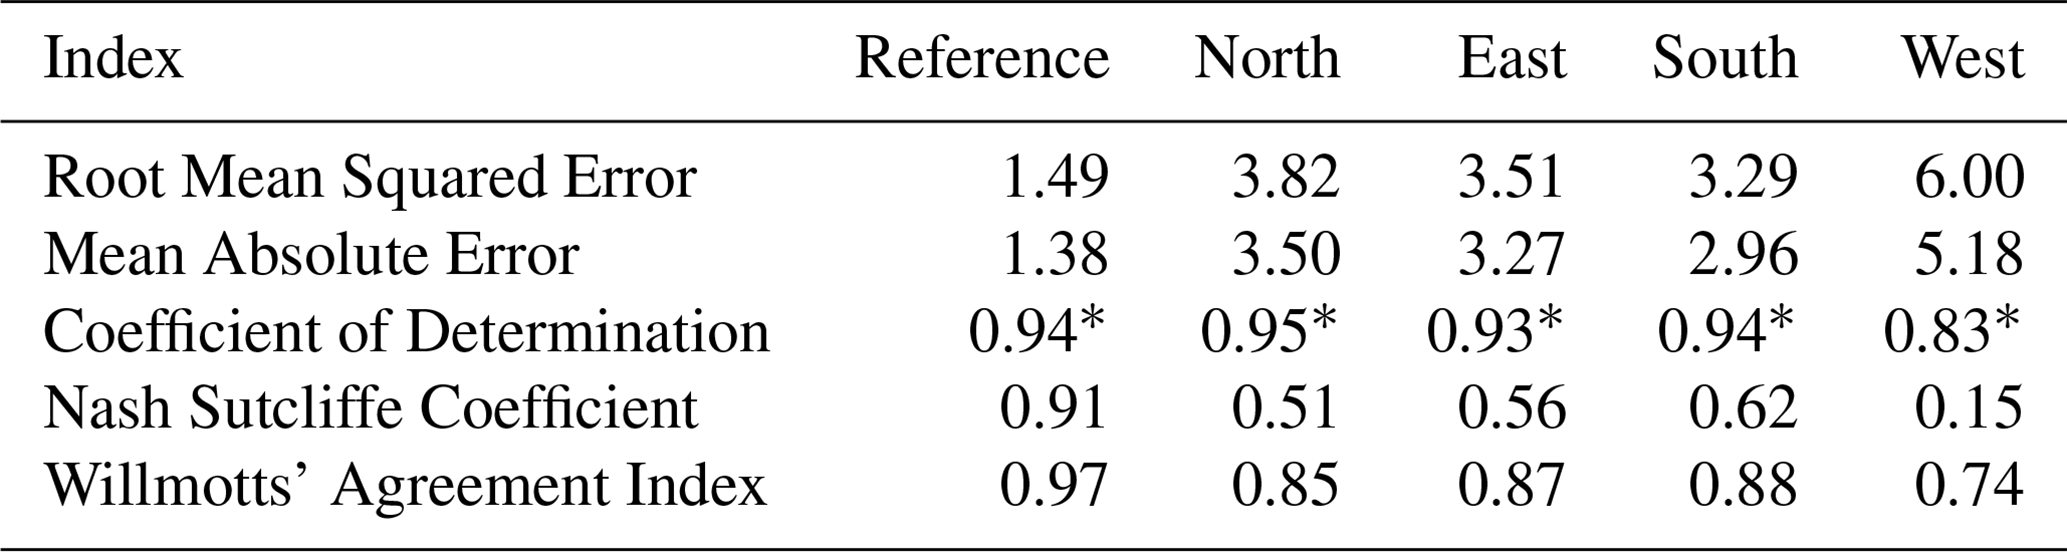
* Significant (p <α= 0.05).
The sensitivity analyses showed that significant differences in the air temperatures can be identified within our study area for the four different simulations with constant wind direction forcing (N, E, S, W) in comparison to the reference run with the truly measured wind direction forcing data. When comparing the simulated air temperatures to the NETATMO measurements, it was found that the daily mean temperature and standard deviation of the reference run is closest to the sensor measurements while significant deviations of about 4 K were identified for the four sensitivity tests. Also, the highest statistical correlation was observed between the reference run and the sensor measurements (NSE = 0.91), while worse statistical correlations between simulated and observed data were identified for the four sensitivity runs (NSE between 0.62 and 0.15). This clearly demonstrates that the ENVI-met simulated air temperatures are highly sensitive to the wind direction forcing data. Our results also show that the cooling potentials of climate change adaptation measures like green infrastructures can largely deviate upon meteorological conditions, which can result in significant local air temperature differences. The highest cooling effects were found in the eastern settlements of our study area for west wind situations due to the air transfer from the western urban park via street canyons and corridors as fresh air lanes to the east.
Overall, it can be concluded that (1) a good model performance was observed when forcing the model with the truly measured wind direction data. Thus, the external wind direction forcing of the model using precisely measured wind direction data is a very important model driver as the model is highly sensitive to wind direction input data. High quality measurements of wind direction are crucial to drive this microclimate model and get a good model fit. And (2) the cooling effects of green areas are largely directional and can differ significantly in our heterogeneous study area depending on the predominant wind direction. This can have important implications for urban planning and the design of greenings in cities. Further research will use this ENVI-met model to develop adaptation scenarios and simulate and analyse the effects and potentials of various climate change adaptation measures in this study area (e.g. by facade/roof greenings, light surfaces, shadow effects or urban water bodies) as well as taking into account climate change projections until 2099 of GCMs (Eingrüber and Korres, 2022). Comparisons of different model scenarios in order to mitigate future heat stress in cities and to improve the urban microclimate and thermal outdoor comfort are an important tool for decision making as the optimization of adaptation effects is a central future challenge in the context of global warming.
Data are currently not publicly available and will be published at a later state of the research.
NE developed the model domain and implemented the microclimatological measurements. KS and WK supported in the implementation of the modelling concept. NE performed the sensitivity tests, sensor validation and recalibration and statistical data analyses, as well as prepared the manuscript draft. WK, KS and UL participated in writing and supervising the work. All have read and accepted the manuscript for submission.
The contact author has declared that none of the authors has any competing interests
Publisher’s note: Copernicus Publications remains neutral with regard to jurisdictional claims in published maps and institutional affiliations.
This article is part of the special issue “EMS Annual Meeting: European Conference for Applied Meteorology and Climatology 2022”. It is a result of the EMS Annual Meeting: European Conference for Applied Meteorology and Climatology 2022, Bonn, Germany, 4-9 September 2022. The corresponding presentation was part of session UP2.1: Cities and urban areas in the earth-atmosphere system.
We would like to thank all citizen scientists and local cooperation partners within the study area who make it possible to carry out our measurements in private spaces. We acknowledge support for the Article Processing Charge from the DFG (German Research Foundation, grant no. 491454339).
This research has been supported by the DFG – German Research Foundation
(grant no. 491454339).
This open-access publication was funded by Universität zu Köln.
This paper was edited by Pavol Nejedlik and reviewed by Adam Jaczewski, Jana Krajcovicova, and one anonymous referee.
Bruse, M.: ENVI-met Version 5.0: updated model overview. University of Bochum, https://www.envi-met.com/, last access: 30 December 2022.
Chatzinikolaou, E., Chalkias, C., and Dimopoulou, E.: URBAN MICROCLIMATE IMPROVEMENT USING ENVI-MET CLIMATE MODEL, Int. Arch. Photogramm. Remote Sens. Spatial Inf. Sci., XLII-4, 69–76, https://doi.org/10.5194/isprs-archives-XLII-4-69-2018, 2018.
Cortes, A., Rejuso, A. J., Santos, J. A., and Blanco, A.: Evaluating mitigation strategies for urban heat island in Mandaue City using ENVI-met, Journal of Urban Management, 11, 97–106, https://doi.org/10.1016/j.jum.2022.01.002, 2022.
Crank, P. J., Sailor, D. J., Ban-Weiss, G., and Taleghani, M.: Evaluating the ENVI-met microscale model for suitability in analysis of targeted urban heat mitigation strategies, Urban Climate, 26, 188–197, https://doi.org/10.1016/j.uclim.2018.09.002, 2018.
Eingrüber, N. and Korres, W.: Climate change simulation and trend analysis of extreme precipitation and floods in the mesoscale Rur catchment in western Germany until 2099 using Statistical Downscaling Model (SDSM) and the Soil & Water Assessment Tool (SWAT model), Sci. Total Environ., 838, 155775, https://doi.org/10.1016/j.scitotenv.2022.155775, 2022.
Eingrüber, N., Korres, W., and Schneider, K.: Pathways for climate change adaptation in urban areas - first results from field measurements and ENVI-met modeling, EMS Annual Meeting 2021, online, 6–10 Sep 2021, EMS2021-374, https://doi.org/10.5194/ems2021-374, 2021.
Eingrüber, N., Korres, W., and Schneider, K.: Microclimatic field measurements to support microclimatological modelling with ENVI-met for an urban study area in Cologne, Adv. Sci. Res., 19, 81–90, https://doi.org/10.5194/asr-19-81-2022, 2022.
Kotharkar, R., Bagade, A., and Singh, P. R.: A systematic approach for urban heat island mitigation strategies in critical local climate zones of an Indian city, Urban Climate, 34, 100701, https://doi.org/10.1016/j.uclim.2020.100701, 2020.
Liu, Z., Cheng, W., Jim, C. Y., Morakinyo, T. E., Shi, Y., and Ng, E.: Heat mitigation benefits of urban green and blue infrastructures: A systematic review of modeling techniques, validation and scenario simulation in ENVI-met V4, Build. Environ., 200, 107939, https://doi.org/10.1016/j.buildenv.2021.107939, 2021.
Perini, K., Calise, C., Castellari, P., and Roccotiello, E.: Microclimatic and Environmental Improvement in a Mediterranean City through the Regeneration of an Area with Nature-Based Solutions: A Case Study, Sustainability, 14, 5847, https://doi.org/10.3390/su14105847, 2022.
Yang, J., Zhao, Y., Zou, Y., Xia, D., Lou, S., Guo, T., and Zhong, Z.: Improving the Thermal Comfort of an Open Space via Landscape Design: A Case Study in Hot and Humid Areas, Atmosphere, 13, 1604, https://doi.org/10.3390/atmos13101604, 2022.