 | 11 May 2026
The regional reanalysis COSMO-R6G2 as a successor to COSMO-REA6: evaluation for renewable energy applications
Michael Borsche
Frank Kaspar
Thomas Spangehl
Dehong Yuan
David Geiger
Lukas Pauscher
The regional reanalysis COSMO-REA6 has frequently been used for applications in the energy sector, but there were also known deficits for some relevant features. A successor is currently produced and this manuscript provides a first initial technical validation, with a focus on those features. The dataset is available under an open data licence and is expected to be of interest for energy-related applications. Relevant meteorological variables for the renewable energy generation like Global Horizontal Irradiance (GHI, often also referred as global radiation) and wind speed at altitudes between 10 and 258 m of the new regional reanalysis COSMO-REA6 Generation 2 (COSMO-R6G2) by Deutscher Wetterdienst (DWD) are investigated with a focus on Germany using the regional reanalysis COSMO-REA6 as a benchmark. COSMO-R6G2 shows slightly lower values of GHI compared to COSMO-REA6, thus increasing the bias already present in COSMO-REA6. In terms of wind speed, comparisons to data from measurement masts (e.g. at sites Hamburg, Lindenberg and Karlsruhe) show good quality of COSMO-R6G2 in flatlands. As deficits in the representation of the daily cycle of wind speed at hub height were identified for COSMO-REA6, these characteristics were analysed in more detail. COSMO-R6G2 underestimates the night-time maximum over mountainous regions stronger than COSMO-REA6, but differences over low terrain are small and broadly comparable to COSMO-REA6. In summary, this initial assessment shows that users can use COSMO-R6G2 as an extended successor of COSMO-REA6, but should carefully consider the results of all quality assessments and known weaknesses of the COSMO-based datasets.
- Article
(5103 KB) - Full-text XML
- BibTeX
- EndNote


The generation of renewable energy is inherently dependent on local meteorological conditions. Climatological time series with high spatial resolution are essential for the calculation of capacity factors. They allow the assessment of potential locations for renewable energy generation and are essential for planning and designing the future energy system. Regional reanalyses provide long time series with a high spatial resolution and a consistent state of the atmosphere. The “COSMO-REA6” (Bollmeyer et al., 2015) from Deutscher Wetterdienst (DWD), produced in 2015, has already been proven as a useful data set for applications of renewable energies (see review of Kaspar et al., 2020). The high quality of COSMO-REA6 for offshore wind farm planning in Germany's exclusive economic zone of the North Sea was recently demonstrated by Spangehl et al. (2023). In addition, there is considerable interest in high-quality wind and radiation information at national level for example for energy applications, as e.g. Bär et al. (2022). For wind energy applications, the wind speed at the turbine hub height is of particular relevance. A known weakness of COSMO-REA6 is its inaccurate representation of the diurnal wind-speed cycle around 100 m above ground (Borsche et al., 2016). This issue arises from a known weakness of the COSMO model in the boundary layer (Heppelmann et al., 2017). COSMO-REA6 tends to underestimate the night-time wind speed over flat and gently rolling terrain, but generally performs well in hilly regions. Previous studies have linked this bias to an inadequate representation of the nocturnal low-level jet (Brune et al., 2021).
Another known weakness of COSMO-REA6 is the overestimation of GHI (often also referred to as “global radiation”) during cloudy sky conditions and the underestimation during clear sky conditions (Frank et al., 2018), which led other authors to the recommendation of either using satellite-based data for the GHI in disfavour of the reanalyses (Urraca et al., 2018) or a post-processed version of COSMO-REA6 (Kenny and Fiedler, 2022). Frank et al. (2018) identified the fixed aerosol climatology as the likely main reason for the underestimation of the radiation during clear sky conditions. The overestimated radiation during cloudy sky conditions is explained by Frank et al. (2018) as a result of clouds being optically too thin, i.e. their transmissivity is overestimated.
COSMO-REA6 only extends to year 2019 as a consequence of the end of the global reanalysis “ERA-Interim” (Dee et al., 2011) in 2019 which was used as the lateral boundary conditions. The new generation “COSMO-REA6 Generation 2”, shortly “COSMO-R6G2” produced by Deutscher Wetterdienst succeeds COSMO-REA6 and extends its length using the global reanalysis “ERA5” (Hersbach et al., 2020) as lateral boundary conditions. The new generation of the regional reanalysis provides a long-term climatological data set, planned from 1995 up to the present day, but eventually starting in 1991 if technically feasible. In addition to the newer global boundary conditions, a more recent version1 of the COSMO weather prediction model is used for the new reanalysis generation.
Addressing current energy-related questions requires a comprehensive qualitative evaluation of the available data sets. Within the framework of its open data policy, DWD endeavours to make its data available at an early stage. Therefore, in the present study the quality of the energy-relevant meteorological parameters GHI and wind speed (at heights from 10 to 258 m above ground) are analysed over Germany for one selected year, in order to provide an early quality assessment while the full dataset is produced. For this purpose, the old and new generation of the COSMO reanalyses are compared and evaluated using station measurements. The GHI is compared to two generations of the satellite-based product SARAH (Surface Solar Radiation Data Set – Heliosat) (Pfeifroth et al., 2023a) and measurements from the ground-based network of weather stations of DWD (Kaspar and Mächel, 2023). The wind speed is compared with three meteorological measurement masts in Germany, located in Karlsruhe, Hamburg and Lindenberg. In addition, a data set consisting of 32 high-quality wind measurements distributed all over Germany is used to derive additional conclusions on systematic biases.
2.1 Regional reanalyses COSMO-REA6 and COSMO-R6G2
The regional reanalysis for Europe, COSMO-REA6, (Bollmeyer et al., 2015), was developed within DWD's Hans Ertel Centre for Weather Research (HErZ) and is available under an open data licence (https://opendata.dwd.de/climate_environment/REA/COSMO_REA6/, last access: 7 May 2026). The reanalysis is based on the numerical weather prediction (NWP) model COSMO, in which observations from various observing systems are assimilated by continuous nudging. At its boundaries, the model is driven by the global, coarse-resolution reanalysis ERA-Interim (approx. 80 km horizontal resolution, produced by the European Centre for Medium-Range Weather Forecasts (ECMWF), see Dee et al., 2011). This results in a regional reanalysis with a horizontal resolution of approximately 6 km over Europe. It has been made available by DWD in 2017. As the ERA-Interim reanalysis only covers the period until August 2019, the COSMO-REA6 Generation 2 (COSMO-R6G2) reanalysis is currently being produced by DWD using the ERA5 reanalysis from ECMWF/C3S (Hersbach et al., 2020) as boundary conditions. ERA5 has the advantage of being available from 1940 until present day. COSMO-R6G2 is planned to be continuously updated. In addition to the change of global boundary conditions, an improved version of the COSMO weather prediction model (v5.04d4) was used for the generation of the new reanalysis. This version includes the radiation scheme by Ritter and Geleyn (1992) for which a constant aerosol climatology was used. In addition, it includes a turbulent diffusion scheme which calculates the transport coefficients for momentum and heat in the atmosphere and the transfer coefficients at the ground. The production of COSMO-R6G2 is still ongoing, thus only a preliminary subset of data is used for this evaluation. As with the first generation, the horizontal resolution is 0.055°, which corresponds to approx. 6 km over Central Europe. The model operates on a hybrid terrain-following coordinate system. A configuration with 40 vertical levels is used for both reanalyses. The heights of the near-surface levels correspond to 10, 35, 69, 116, 178, 258, 357, 477 and 618 m above the sea and slightly lower heights in regions with higher elevation. The level located at ∼116 m lies closest to the typical wind-turbine hub height of wind turbines and therefore serves as the key layer for wind-energy comparisons in this study.
2.2 GHI reference data: SARAH-2, SARAH-3 and station data
For the evaluation, two generations of SARAH are used, which were produced as a contribution of DWD to EUMETSAT's Satellite Application Facility on Climate Monitoring (CM SAF). The products used in this paper are SARAH-2 (Pfeifroth et al., 2017, 2018) and SARAH-3 (Pfeifroth et al., 2023a) in an hourly temporal resolution calculated from the instantaneous data.
SARAH-2 data has already been proven valuable for energy applications (Pfenninger and Staffel, 2016), especially in photovoltaic use cases (Kenny and Fiedler, 2022; Kaspar et al., 2026).
The main difference between SARAH-2 and SARAH-3 is the quality improvement over snow and the use of new auxiliary data like water vapour and ozone-data from ERA5 (Pfeifroth et al., 2023a). According to the SARAH-3 validation report (Pfeifroth et al., 2023b), the GHI data shows a slightly positive bias. As a result, a small overestimation of the SARAH datasets can be expected.
As ground reference data, 114 stations of the DWD measurement network (available via the Open-Data-Server of DWD; https://opendata.dwd.de/climate_environment/CDC/observations_germany/climate/10_minutes/solar/, last access: 7 May 2026) are used. They measure the 10 min sum of GHI reaching the ground. Hardware maintenance, power failures or similar incidents lead to data gaps in these time series. For the evaluation of the GHI the year 2018 was picked because of the good overlap in the data availability from SARAH-2, SARAH-3, COSMO-REA6, COSMO-R6G2 and measurement stations in the DWD network. Just eight out of the 114 stations are available as a gap-free time series in 2018, but 79 additional stations provide data with less than 1 % missing data. In 2018, 68 stations measured with the ScaPP (Scanning Pyrheliometer and Pyranometer) device with less than 1 % missing values and 20 stations with a pyranometer (CM11 or CM21).
Evaluations conducted by the Lindenberg Observatory indicated that the quality of the ScaPP devices strongly depends on the time of the last device calibration (Behrens and Grewe, 2005). The pyranometer measurements therefore provide higher quality data. As the calibration time of the ScaPP devices is unknown and the distribution of the 20 pyranometer stations is not homogenous, the ScaPP data is included in a Germany-wide station comparison. However, no individual station comparison is done. As at some stations both sensors are operated, the total number of stations used here is 87. The evaluation is based on hourly values.
2.3 Wind speed reference data: tower measurements
In the DWD's ground monitoring network (Kaspar and Mächel, 2023), wind is measured at a typical height of 10 m, but in the context of wind energy, evaluation at greater heights is required. At these heights, measurements are available at significantly fewer locations. A distinction can be made between two categories: (a) Measurements at meteorological reference sites, such as observatories. Here, locations are typically selected that allow representative measurements for a larger region. (b) Measurements taken in the context of planned wind energy sites. These sites are therefore typically locations with favourable wind conditions. Both categories were used in our analysis.
The reanalysis data is evaluated against wind speeds measured at three meteorological masts in Germany located in Hamburg, Lindenberg and Karlsruhe. Locations are shown in Fig. 6.
The Hamburg Weather Mast is operated by the Meteorological Institute of the University of Hamburg. It is located in northern Germany close to the coast at 53.5192° N, 10.1029° E and 0.3 m a.s.l.). The mast has a height of 300 m and measures wind speed at 10, 50, 110, 175, 250 and 280 m a.g.l. (Ingo Lange, Wind- und Temperaturdaten vom Wettermast Hamburg des Meteorologischen Instituts der Universität Hamburg für den Zeitraum 2010 bis 2022, personal communication, 2023). Due to better data availability, we look at year 2017 in Hamburg. The measurement altitude 250 m had too many missing data in 2017 and is consequently omitted.
The mast at the Falkenberg Boundary Layer Field Site of the Lindenberg Meteorological Observatory operated by DWD is located at 52.1663° N, 14.1225° E and 73 m a.s.l. (Beyrich and Adam, 2007). The mast is 99 m tall and measures wind speed at 10, 20, 40, 60, 80 and 98 m height above ground level (a.g.l.). The data are recorded at a temporal resolution of 10 min, and for this study, only the values corresponding to full hours are used. The year 2018 was selected for the evaluation due to data availability. Measurements at 20 m were excluded because this level had too many missing values in 2018.
The Institute of Meteorology and Climate Research – Department Troposphere Research operates the measurement mast in Karlsruhe. It is located at 49.0925° N, 8.4258° E at 110.4 m a.s.l. It is located in the Rhine Valley, which has a channelization effect on the wind speed. The measurement heights are at 2, 20, 30, 40, 50, 60, 80, 100, 130, 160 and 200 m a.g.l. (Kohler et al., 2018). Due to better data availability, year 2017 was selected for Karlsruhe. The measurement altitudes 2 and 20 m had too much missing data in 2017 and are consequently omitted.
In addition to these 3 meteorological masts, data from 32 sites (lidar, mast and sodar measurements) are used to analyse the biases in the mean wind speed. They are located all over Germany in terrain of varying complexity, ranging from offshore sites to low mountain ranges, and were carried out in 2017 and 2018. Most of the measurements were performed for wind resource assessments or similar wind energy applications and can thus be considered as reliable. All other measurements had a setup that was similar to the requirements of the relevant IEC-standards (61400-50-1:2022 (IEC, 2022a) and 61400-50-2:2022 (IEC, 2022b)) and can, thus, also be considered high-quality measurements. The set of measurements include a collection of open data sets such as FINO 1 & 2 (Bundesamt für Seeschifffahrt und Hydrographie, 2024), mast measurements collected at a 140 m mast during the NEWA experiments (details on the site can be found in Kühn et al., 2018; Pauscher et al., 2018), the previously described masts from Hamburg (see above: Ingo Lange, personal communication, 2023) and Karlsruhe (Kohler et al., 2018). Exact details about the other measurement sites cannot be disclosed due to confidentiality arrangements. However, information on some of the sites can be found in Basse et al. (2020, 2021).
3.1 Global Horizontal Irradiance (GHI)
The total bias between the ground-based measurements from DWD's station network and the reanalysis and satellite data over Germany is depicted in Fig. 1. The satellite-based SARAH-products perform much better than the reanalyses. They slightly overestimate the radiation (in comparison to the station measurements) with a mean bias of 4.05 W m−2 (SARAH-2) and 3.50 W m−2 (SARAH-3). The 25 %-quantile of SARAH-2 is at 1.79 W m−2, the 75 %-quantile at 6.63 W m−2 and for SARAH-3 at 0.94 W m−2 and 6.31 W m−2. SARAH-3 shows a bias distribution shifted towards lower values and is performing slightly better than SARAH-2. The reanalyses generally underestimate radiation in comparison to the station measurements. The bias from COSMO-R6G2 is the highest bias of all four data sets with a mean bias of −17.14 W m−2, the 25 %-quantile at −20.76 W m−2 and the 75 %-quantile at −13.36 W m−2.
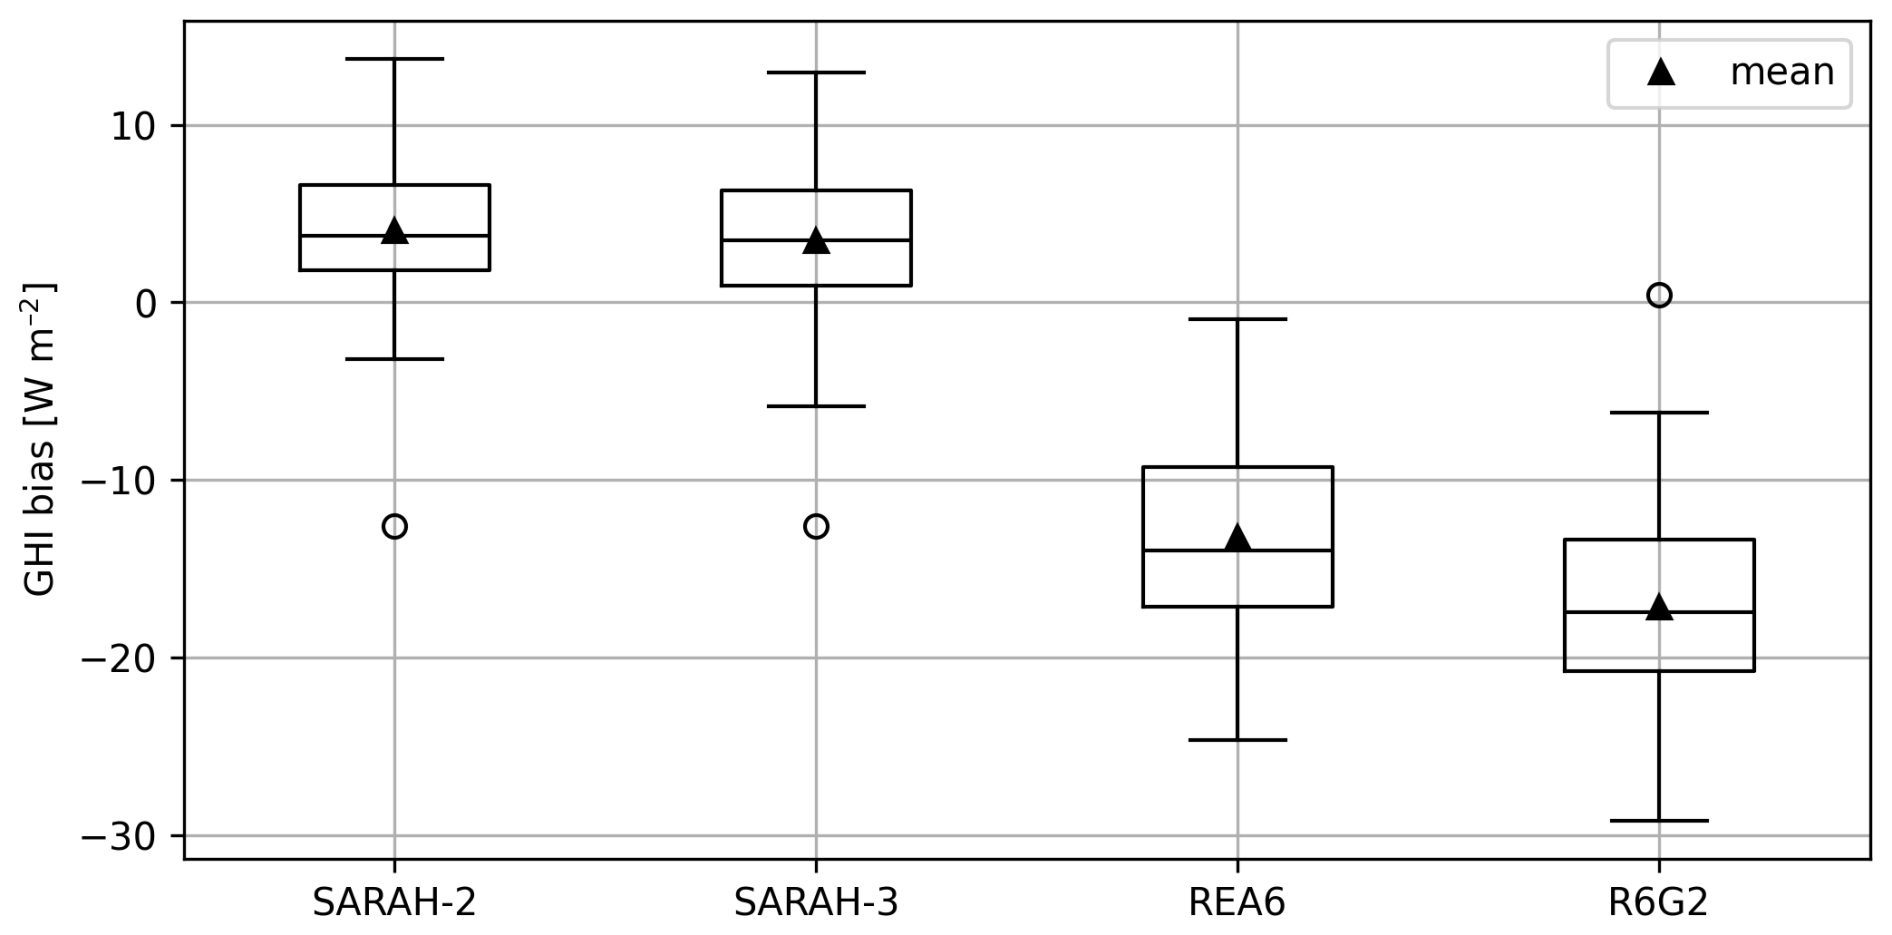
Figure 1Boxplots of the mean annual GHI bias of the satellite-based products SARAH-2 and SARAH-3 and the reanalyses COSMO-REA6 and COSMO-R6G2 for the year 2018. The bias is calculated based on all available stations. The horizontal lines represent the medians, the triangles the means and the circles the outliers.
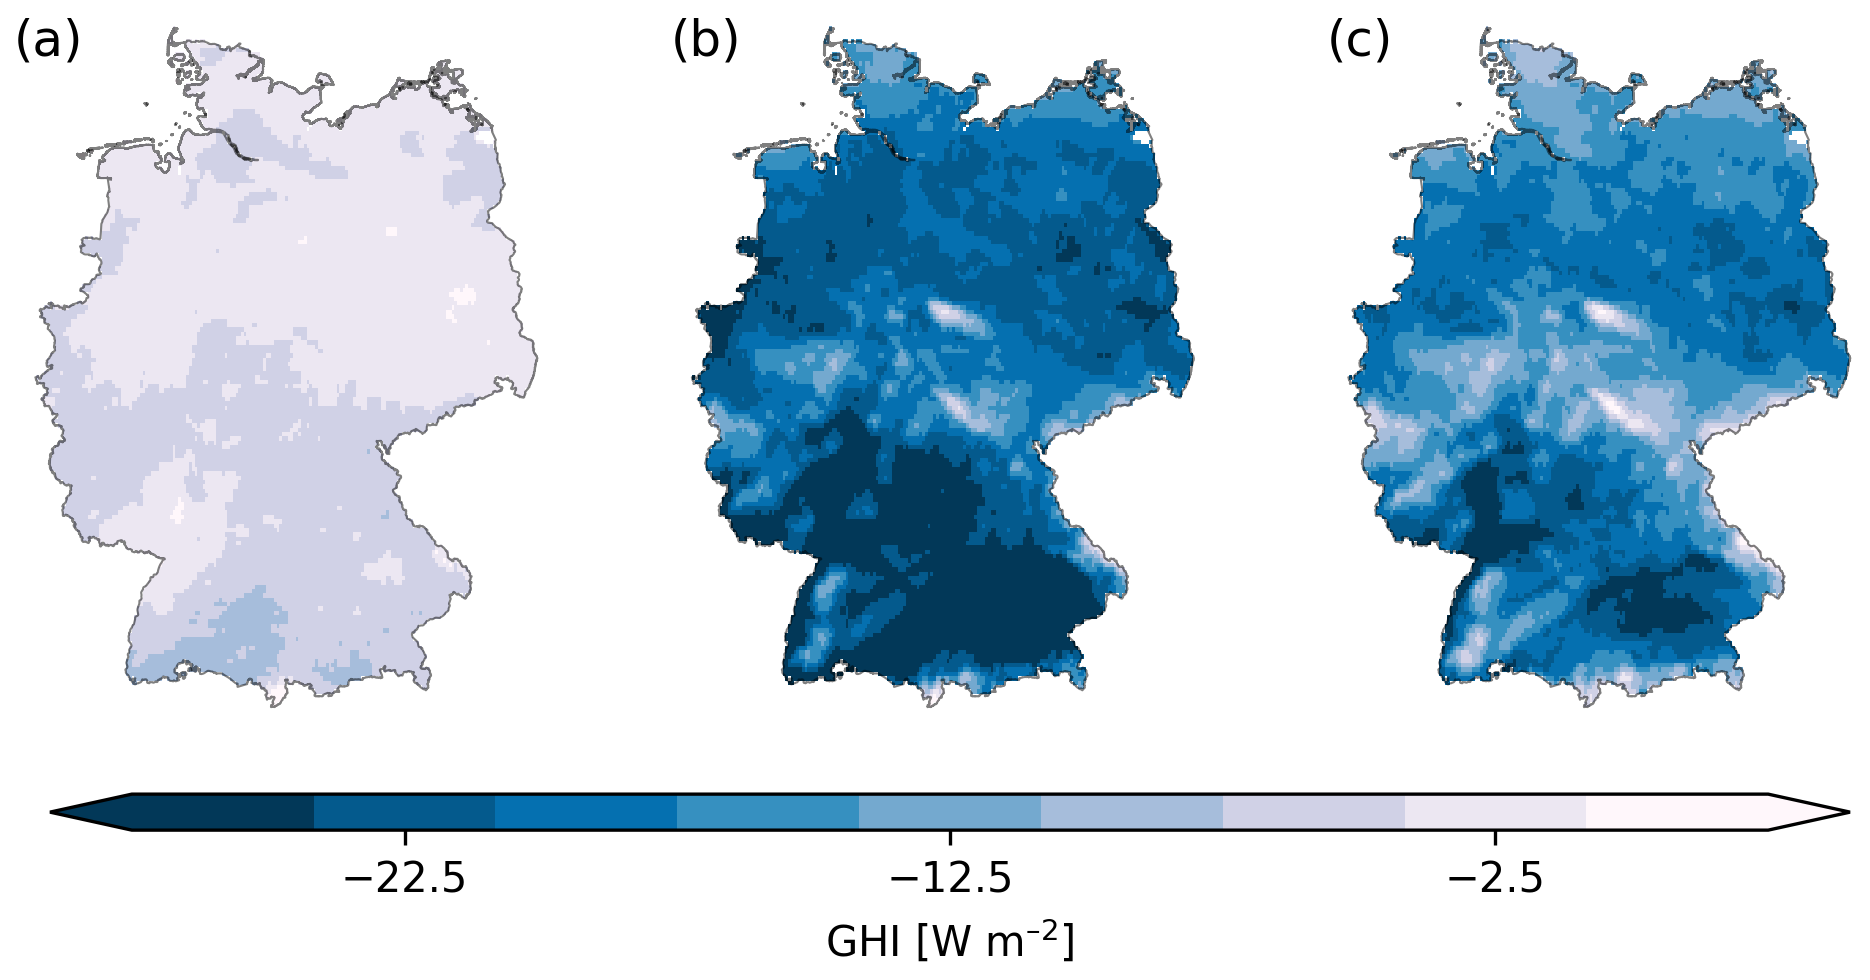
Figure 2Deviation between the annual GHI mean of COSMO-R6G2 and COSMO-REA6 (a), COSMO-R6G2 and SARAH-3 (b) and COSMO-REA6 and SARAH-3 (c) over Germany for the year 2018. The darker the blue, the larger the (negative) GHI bias.
Figure 2 compares the annual mean of the GHI from COSMO-R6G2 and COSMO-REA6 (a) as well as COSMO-R6G2 (b) and COSMO-REA6 (c) to SARAH-3. COSMO-R6G2 has slightly lower mean values than COSMO-REA6. Figures for summer and winter are shown in the Appendix (Figs. A1 and A2).
SARAH-3 has higher annual mean values than the reanalyses, as already shown in Fig. 1. COSMO-R6G2 has the strongest differences to COSMO-REA6 in southwestern Germany. SARAH-3 has smaller differences to the reanalyses over some mountainous regions in Germany like the Black Forest in the south-west, the Alpine region in southern Germany or the Harz mountains in the centre of Germany. The spatial pattern of differences between SARAH-3 and the reanalyses is similar for both reanalyses.
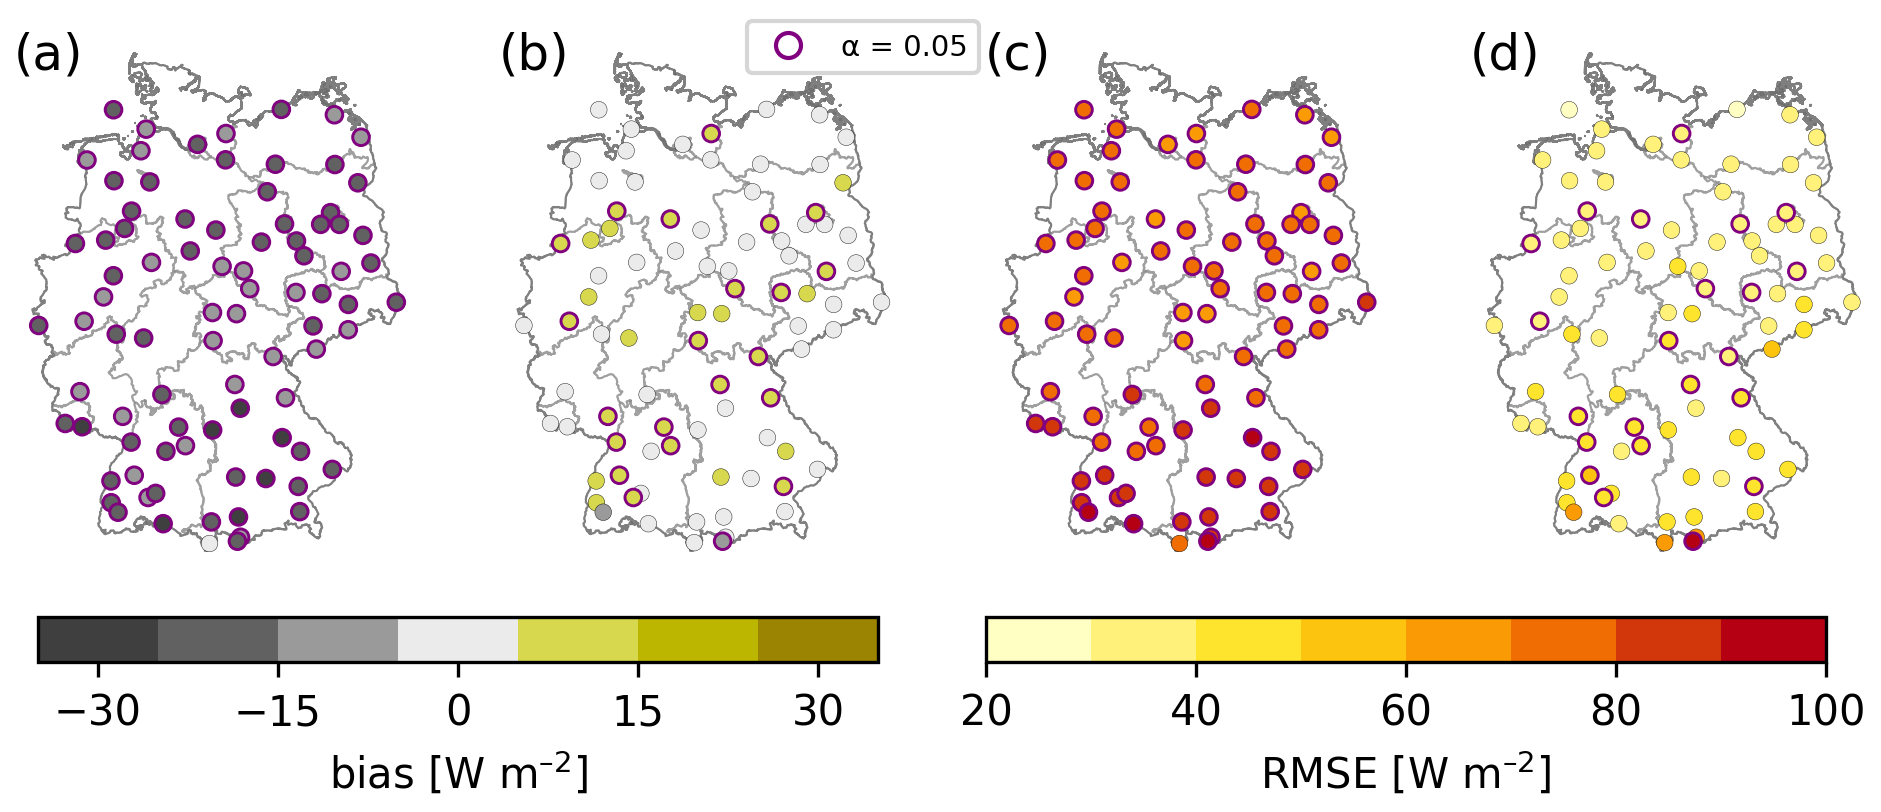
Figure 3Maps of the GHI bias of COSMO-R6G2 (a) and SARAH-3 (b) to the station measurements and RMSE of COSMO-R6G2 (c) and SARAH-3 (d) to the station measurements for the year 2018. In (a) and (b) yellow colours represent a positive bias and grey colours a negative bias. In (c) and (d) light yellow colours represents a low RMSE while reddish colours represents a high RMSE. The stations outlined in purple show statistically significant differences compared to the satellite/reanalysis data (paired bootstrap test, α=0.05).
Figure 3a shows the underestimation of COSMO-R6G2 and the spatial pattern of the bias with a higher negative bias in northern and southern Germany. Generally smaller positive biases are indicated for SARAH-3 (Fig. 3b). COSMO-R6G2 has high RMSE values up to 90 W m−2. The mean annual RMSE shows a similar pattern as the bias analyses. Southern Germany has higher RMSE values compared to northern Germany (Fig. 3c). SARAH-3 shows a similar distribution with much lower RMSE values up to 40 W m−2 in northern Germany and up to 50 W m−2 in southern Germany. Here, only a few stations in the Alps in southern Germany have higher RMSE for SARAH-3 (Fig. 3d). Stations with statistically significant differences from the reference data (t test) are marked in the figure: From the total number of 87 stations, the reanalysis (COSMO-R6G2) results in 85 cases that have a significantly different bias from the station data, in the case of SARAH-3 only 22. Consistently, Fig. 4 also indicates that the standard deviation of the bias is considerably smaller for the satellite-based data (SARAH-3). In addition, the normalized RMSE is shown.
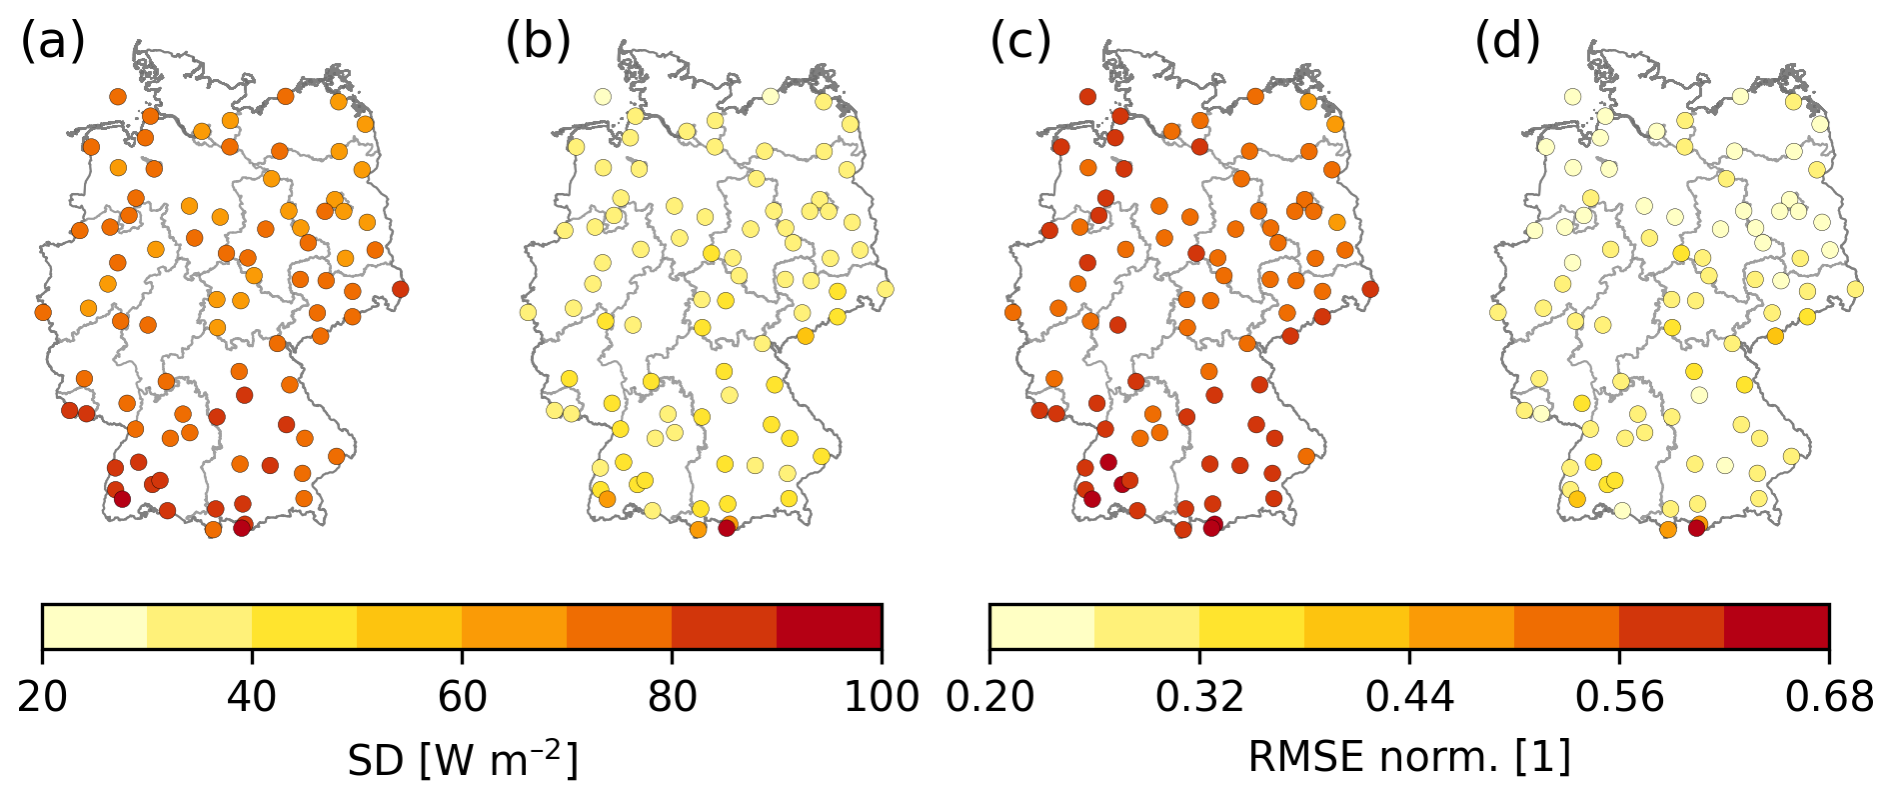
Figure 4Maps showing (a, b) the standard deviation (SD) of the global horizontal irradiance (GHI) biases between COSMO-R6G2 and SARAH-3 and the station measurements, and (c, d) the normalized root mean square error (RMSE norm.) for the year 2018. In (a) and (b), yellow colours indicate a low SD, while red colours indicate a high SD. In (c) and (d), light yellow colours indicate a low normalized RMSE norm., while reddish colours indicate a high normalized RMSE.
The observed diurnal variation helps explain why COSMO-R6G2 performs worse than COSMO-REA6 and, as expected, than the satellite-based GHI data. For this analysis all 20 stations that measured with pyranometers in 2018 and with less than 1 % missing values are considered. When analysing the daily variations of these measurements, a typical picture emerges, as shown for the Görlitz station (Fig. 5): this behaviour was seen at half of the stations surveyed. The satellite-based products reproduce the diurnal cycle observed at the stations well, whereas the reanalyses underestimate surface radiation throughout the entire day. The pattern of the diurnal cycle is well reproduced but the values, especially the maximum midday peak, are too low. COSMO-R6G2 performs worse than COSMO-REA6 and underestimates the midday values more than COSMO-REA6. The comparison is also shown for the summer season (June, July, August (JJA), dotted lines) and the winter season (December, January, February (DJF), dashed lines), which further complements the picture: For summer, the results align with the annual mean, with satellite-derived values being slightly lower than the station measurements at the midday peak. The daily cycle of COSMO-R6G2 is almost identical to the one of COSMO-REA6. Merely in the hours before noon, COSMO-R6G2 is slightly lower. In the winter months, the satellite dataset slightly overestimates the GHI measured at the station, especially in the morning. The reanalysis data shows a small difference before noon and a larger difference after noon.
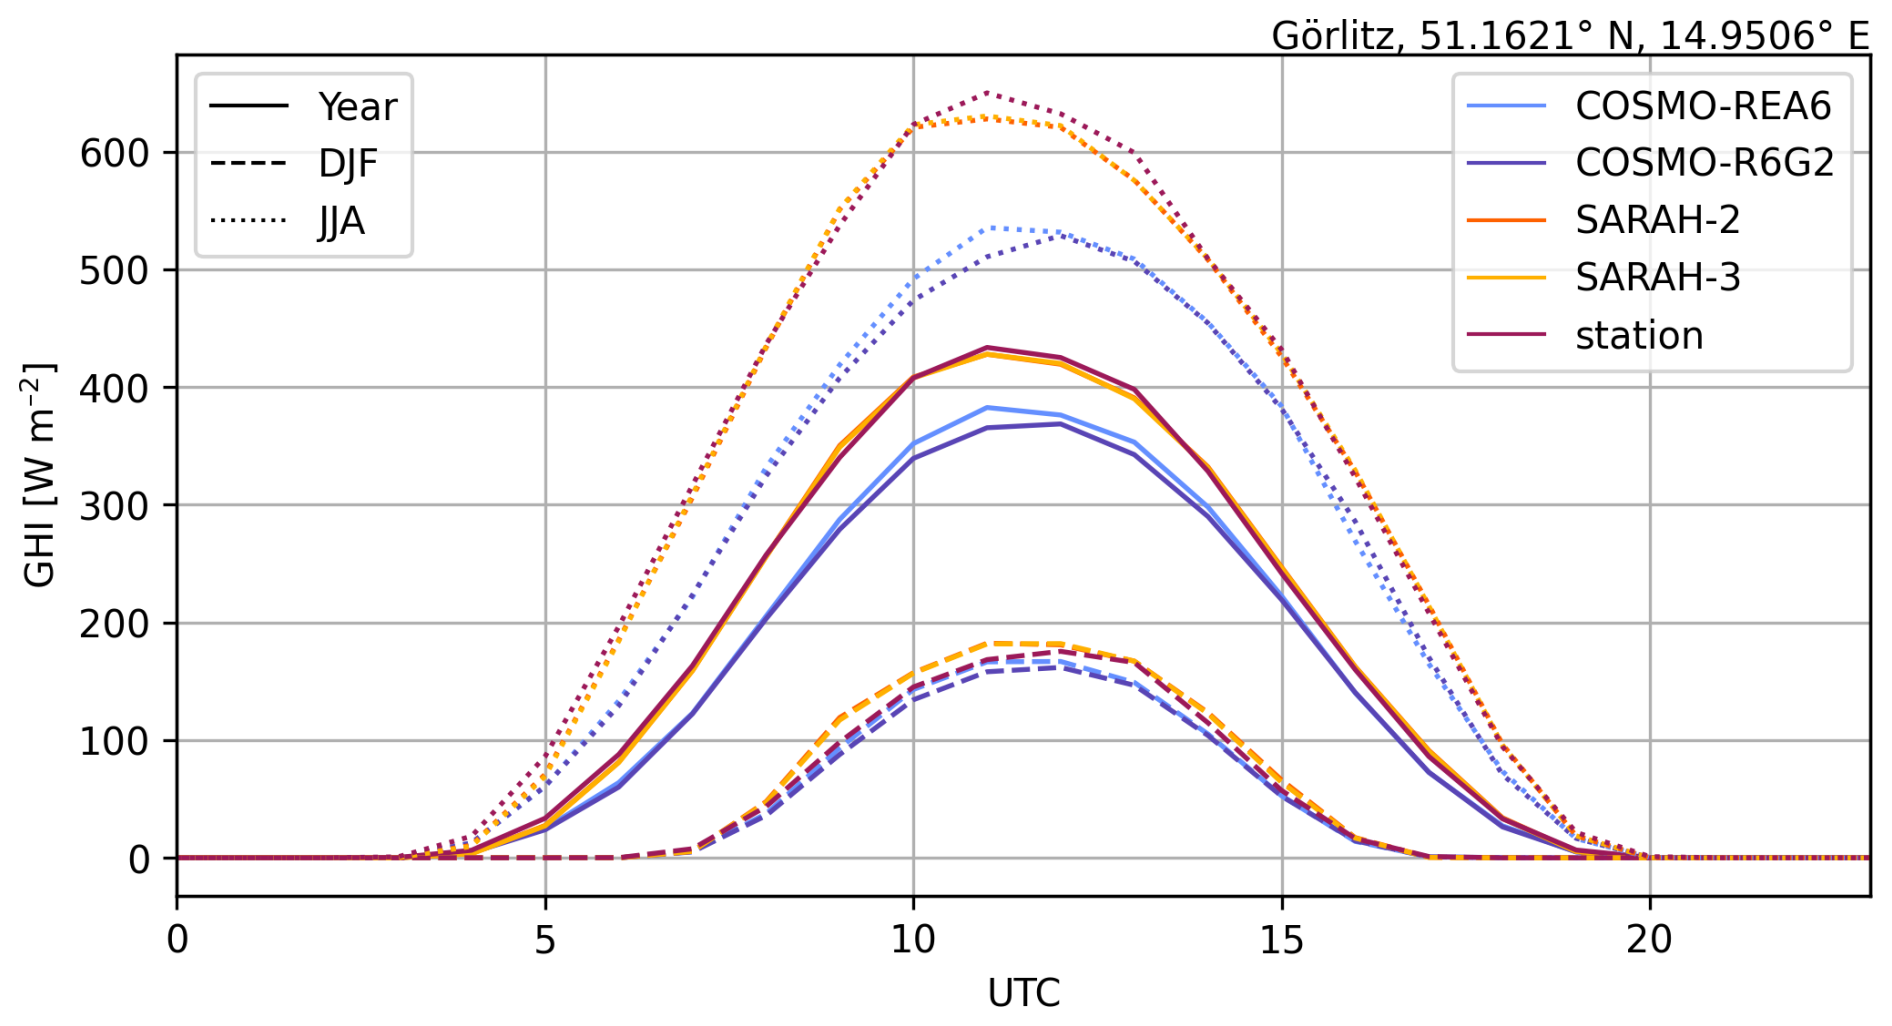
Figure 5Average diurnal cycle of the GHI from satellite datasets, SARAH-2 (yellow) and SARAH-3 (orange), reanalysis data, COSMO-REA6 (light blue) and COSMO-R6G2 (dark blue) and the station measurement (dark purple) at Görlitz in 2018. Solid lines are the annual mean, dashed lines are the mean over the winter months DJF (December, January, February) and dotted lines are the means over the summer months JJA (June, July, August).
The overestimation of the satellite products throughout the year was also observed at the other half of the 20 stations.
From our analyses we conclude, in line with earlier studies, that satellite-based data sets provide more realistic GHI data than COSMO-REA6. Unfortunately, the new generation of the COSMO-R6G2 reanalysis has an even higher bias over Germany compared to the previous generation. For energy-related applications we therefore recommend the use of suitable satellite products. In the version of the COSMO model used for the production of COSMO-R6G2, the same aerosol climatology is still used, so that the fundamental reasons for the underestimation of radiation in clear-sky situations (see Frank et al., 2018) remain the same as before. Frank et al. (2018) explained the overestimated radiation during cloudy sky conditions in COSMO-REA6 as a result of clouds being optically too thin.
3.2 Wind speed
Reanalysis data is often used to provide information on wind speed at hub height of wind turbines, as long-term direct measurements are sparse for that height. Therefore, our evaluation of wind speed is focused on heights of relevance for such applications. Model level 37 corresponds to 116 m a.g.l. over flat terrain, which is a good representation of the typical hub height of wind turbines in Germany. That model level is therefore primarily used in the following analyses. Figure 6 shows a comparison of the annual mean wind speed for 2018 between COSMO-REA6 and COSMO-R6G2 over Germany and reveals a distinct spatial structure: in the northern part of Germany, which is characterised by flat terrain, the differences of mean wind speed are very small. As the orography gets more complex towards southern Germany, the differences between the annual averages increase. With increasing surface elevation, the wind speed in COSMO-R6G2 has lower annual mean values compared to COSMO-REA6. In valleys such as the Rhine Valley or Lake Constance and in offshore areas of the North Sea and Baltic Sea, COSMO-R6G2 shows slightly higher annual averages than COSMO-REA6.
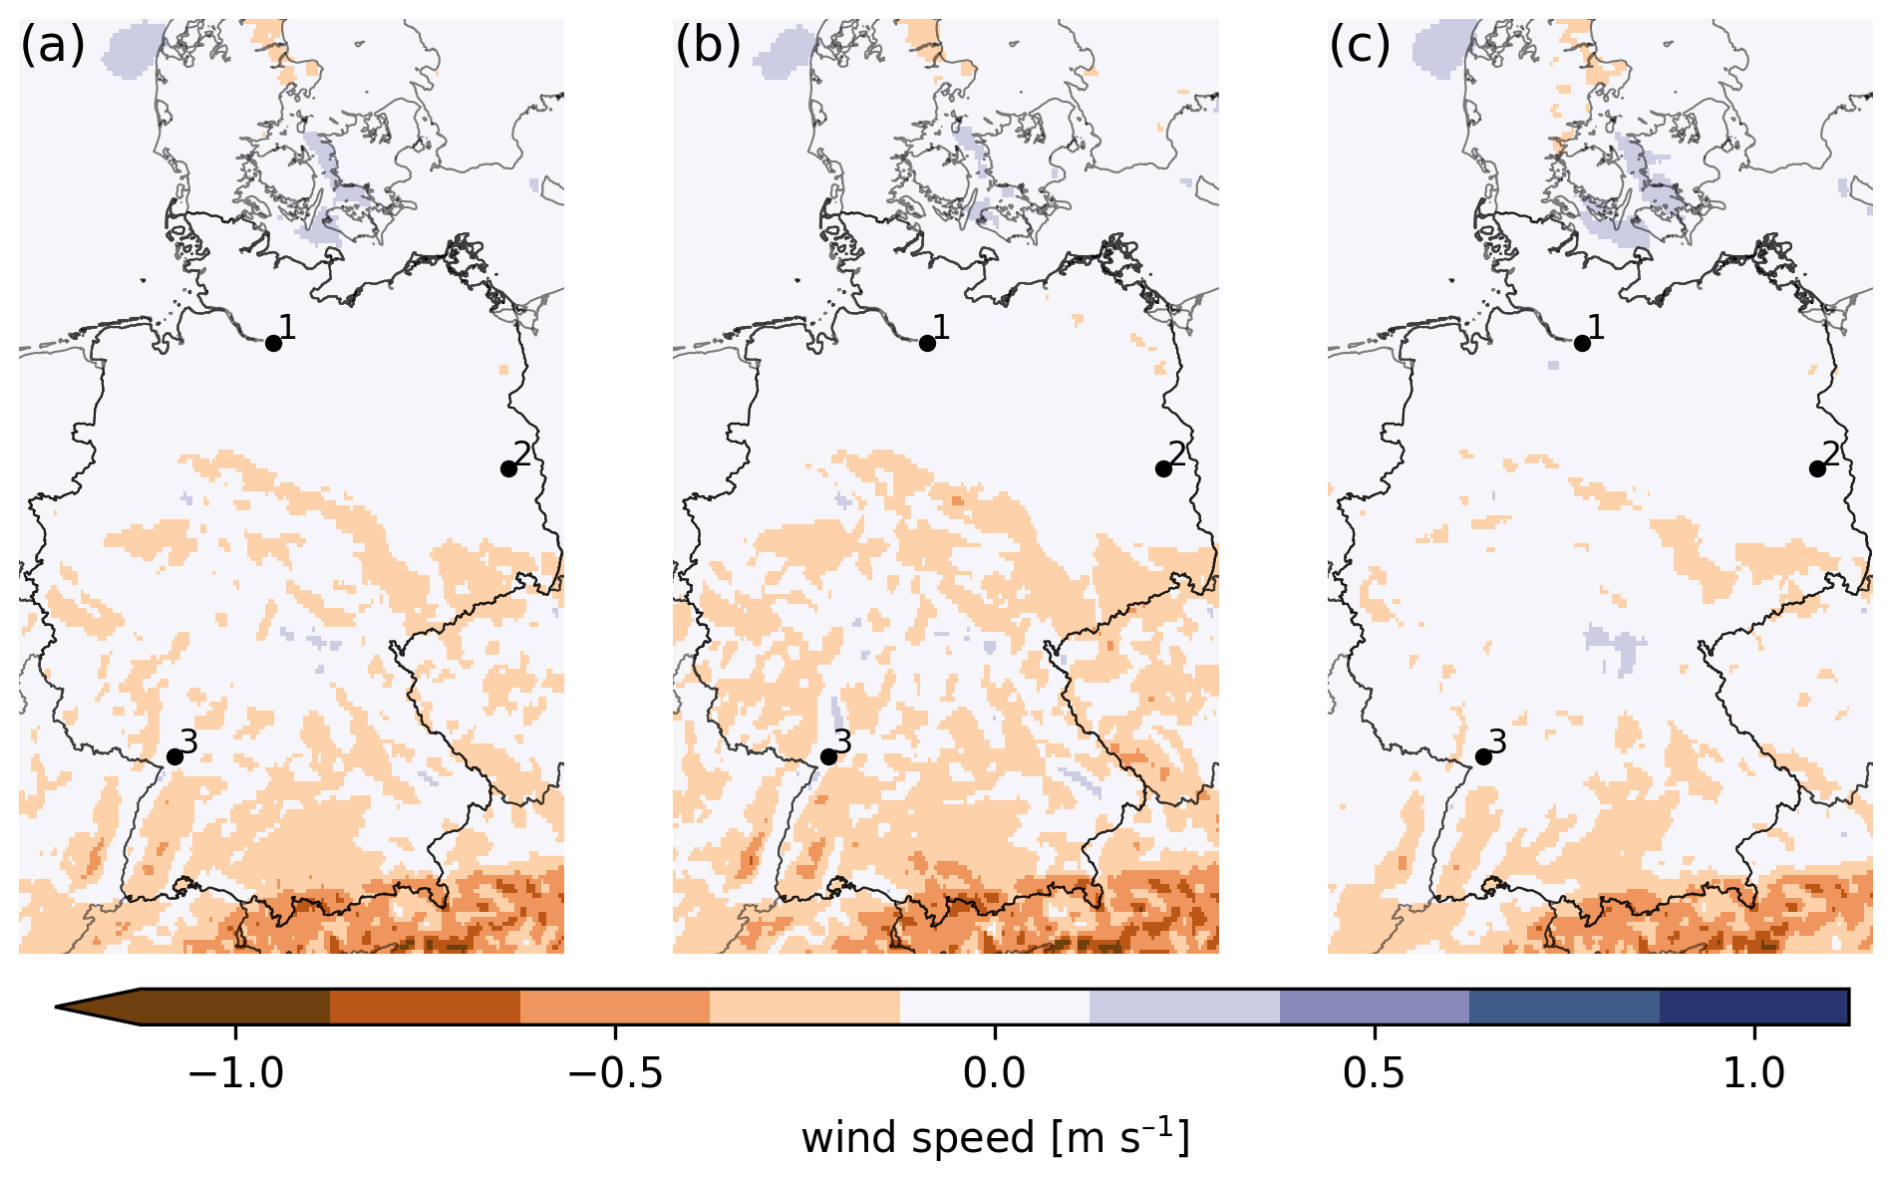
Figure 6Mean annual difference of wind speed at the model level at 116 m between COSMO-R6G2 and COSMO-REA6 averaged over the year 2018 (a), during the night (18:00–06:00 UTC) (b) and during daytime (06:00–18:00 UTC) (c). The locations of the measurement masts in Hamburg (1), Lindenberg (2) and Karlsruhe (3) are shown by dots.
A known weakness of COSMO-REA6 is the weak representation of the diurnal cycle and the associated nocturnal wind maximum at around 100 m (above ground) due to the improper positioning of the low-level jet. We therefore analyse the diurnal cycle and the day-night contrast in more detail. As a first step, the separation of the annual mean differences into daytime (06:00–18:00 UTC) and night time (18:00–06:00 UTC) indicates that the greater absolute differences between COSMO-R6G2 and COSMO-REA6 occur mostly during the night (Fig. 6), suggesting that the known weakness likely remains unresolved.
Measurements from three meteorological masts are used as reference data for the statistical evaluation of both models. The correlation between wind speeds of COSMO-R6G2 and COSMO-REA6 with the mast data collected at Karlsruhe (Rhine Valley in southern Germany) shows no significant difference between the two reanalysis generations with correlation coefficients of 0.85 for COSMO-REA6 and 0.84 for COSMO-R6G2 (Fig. 7). The correlation coefficients at the other two measurement sites are similar with 0.85 in Lindenberg and 0.87 in Hamburg. Both COSMO-R6G2 and COSMO-REA6 also reproduce well the seasonal cycle (figure not shown) as well as individual storm events depicted in Fig. 8 (Hamburg in October 2017). Hamburg, with its coastal location, shows the most pronounced storm events, but the storm events at the other locations are similarly reproduced (not shown).
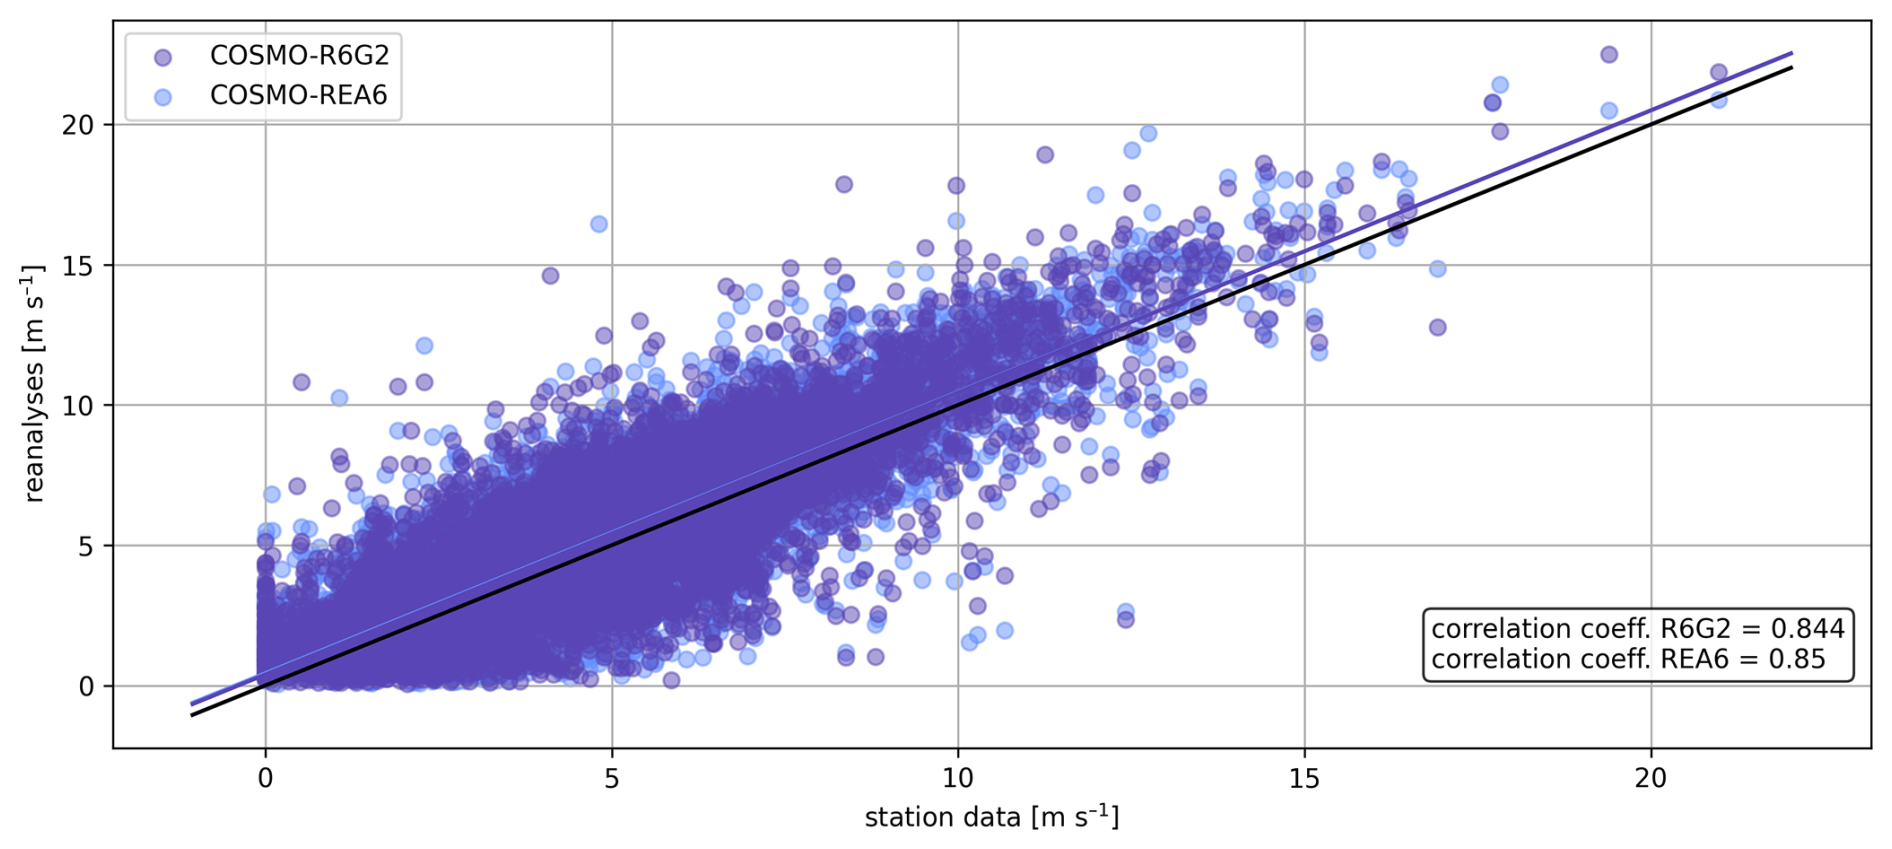
Figure 7Correlation between the wind speed measurements from the meteorological mast in Karlsruhe at a height of 100 m and the reanalysis data from COSMO-REA6 and COSMO-R6G2 at model level 37, which corresponds to 115 m in Karlsruhe.
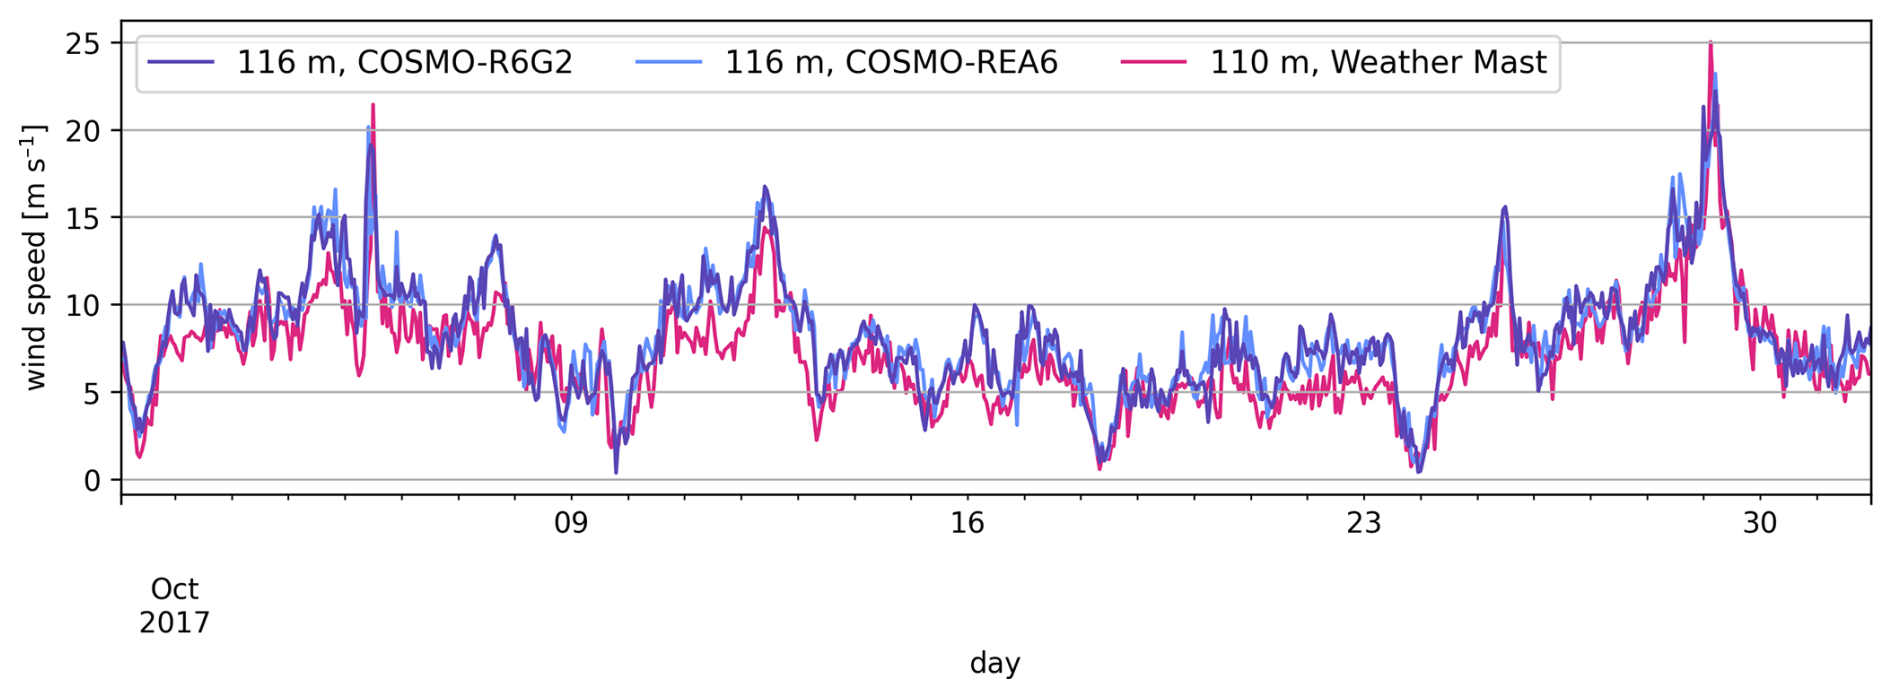
Figure 8Time series of the wind speed from the Hamburg Weather Mast and the reanalyses at the Hamburg site for October 2017. Two storm events were tracked in October 2017. Times in UTC.
The following analysis focuses on the diurnal cycle at various measurement altitudes. As already shown, the annual average deviations between COSMO-R6G2 and COSMO-REA6 are highest during the night and over higher heterogeneous orography. The Hamburg Weather Mast is located in the flat region of northern Germany near the German coast of the North Sea. The diurnal cycles are shown in Fig. 9. In comparison to the measurements, both reanalyses are able to produce the daily cycle in a similar quality. The mast measurements of the wind speed are lower compared to the reanalysis data, which could be due to mast effects (i.e. flow disturbances or shadowing from the mast structure) in the measurements at the lower heights. However, the reanalysis also overestimates the wind speed at higher altitudes. The diurnal cycle in the reanalyses is not as pronounced at 116 m as in the measurements at 110 m.
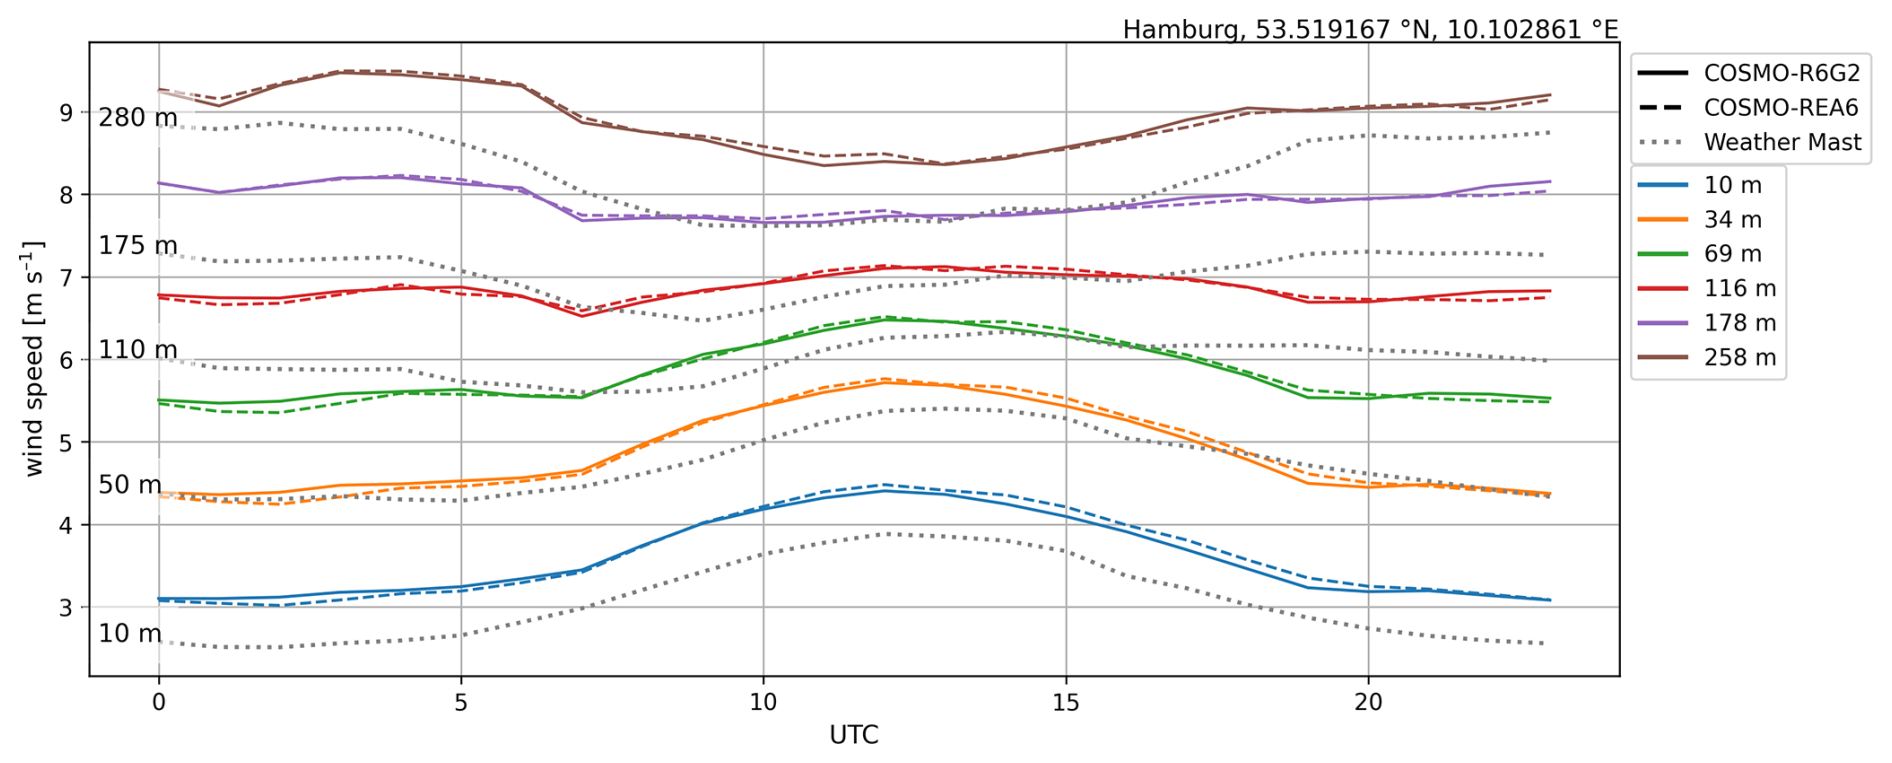
Figure 9Comparison of the diurnal cycle at different model level heights for COSMO-R6G2 (solid lines), COSMO-REA6 (dashed lines) and measurements (dotted lines) at the Hamburg Weather Mast for 2017. Times in UTC.
This is illustrated in Fig. 10, where the height profiles of the diurnal cycle amplitude (a) and (c) and the hour of maximum diurnal cycle (b) and (d) are shown. At heights of about 115 to 178 m, the amplitude of the diurnal cycle in COSMO-R6G2 is greater than in COSMO-REA6 and significantly smaller than the observations at the Hamburg Weather Mast. At low altitudes, COSMO-R6G2 has a smaller diurnal cycle amplitude compared to COSMO-REA6. At the model level at approximately 178 m above flat terrain, the amplitude is lowest in the reanalyses before it increases to a maximum at approximately 350 m, while the minimum in the measurements is at 110 m. Again, this illustrates that the known weakness in the representation of the daily cycle still remains. The hour of the maximum wind speed in the mean diurnal cycle is similar in COSMO-R6G2 and COSMO-REA6. Differences are seen for heights at about 115 m, where it appears 1 h earlier in COSMO-REA6 and for heights at about 258 m, where it appears 1 h later in COSMO-REA6 than in COSMO-R6G2 (Fig. 10b). The topography in Lindenberg is only slightly more heterogeneous than in Hamburg. Here, the differences between COSMO-R6G2 and COSMO-REA6 are also very small. Compared to observations the reanalyses underestimate the amplitude of the diurnal cycle (Fig. 10c) by ∼0.5 m s−1 at a height of ∼100 m. At the model level around 115 m, the hour of the day with the maximum is in COSMO-R6G2 about an hour earlier than in COSMO-REA6 (Fig. 10d).
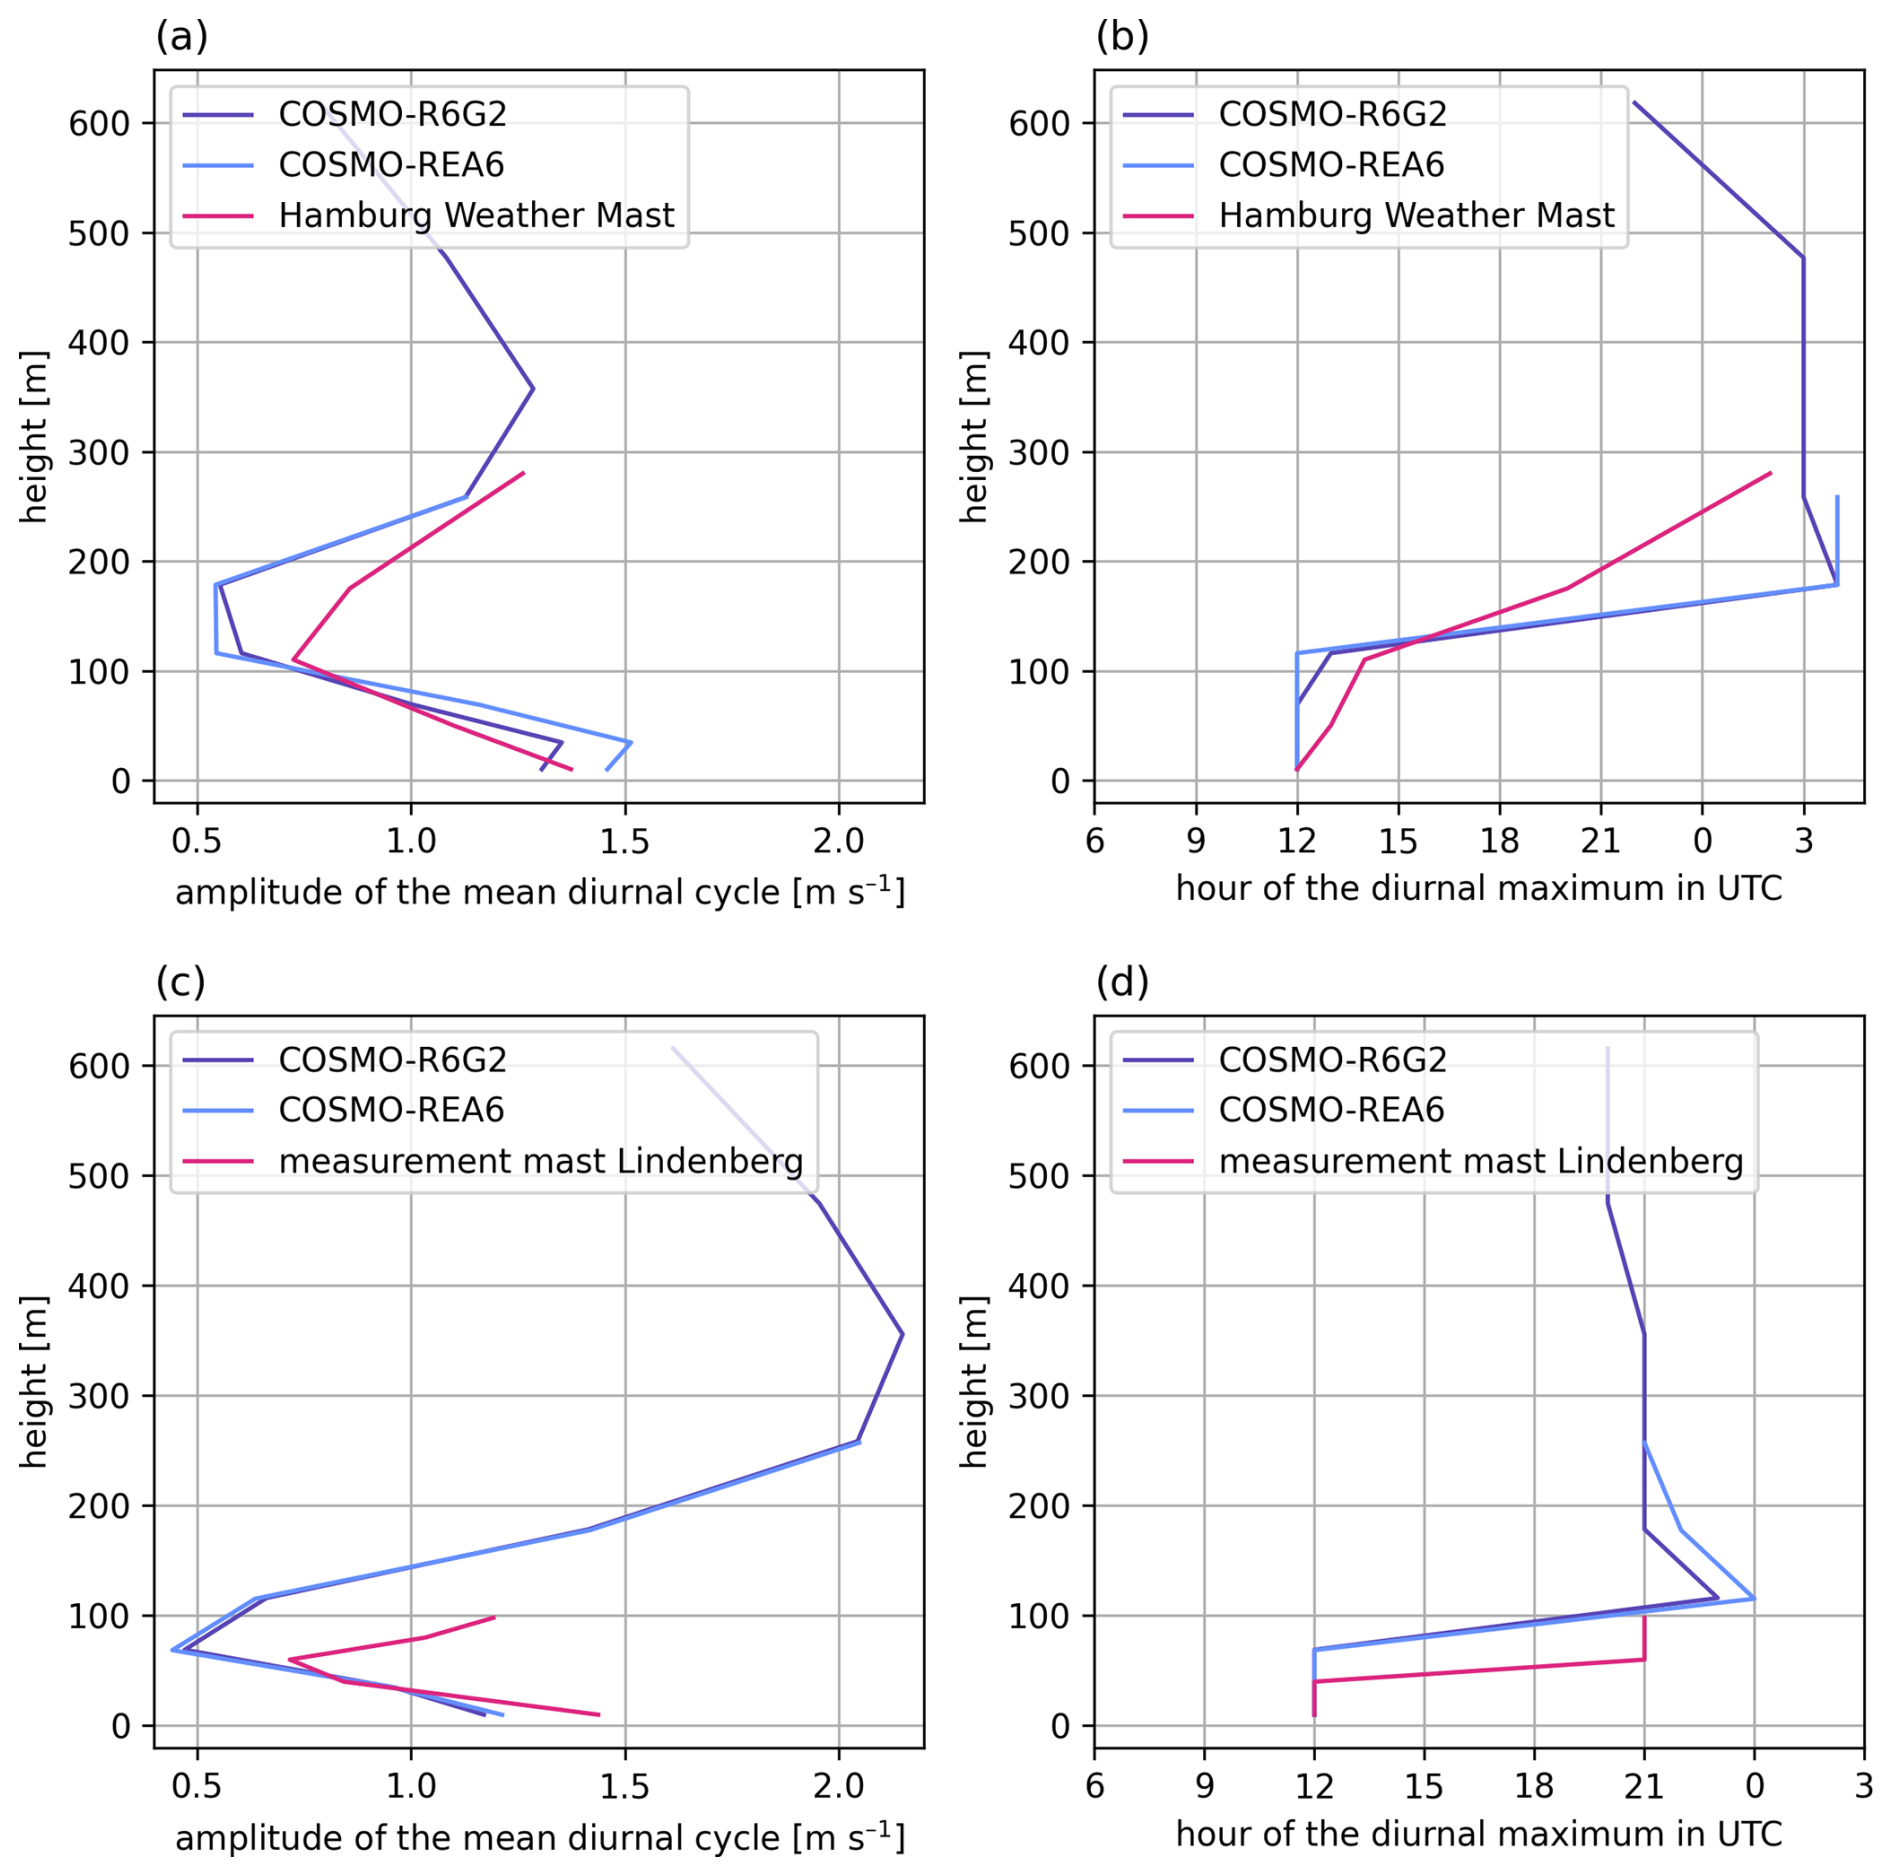
Figure 10Vertical profiles of COSMO-REA6, COSMO-R6G2 and the measurements from the Hamburg Weather Mast in 2017 (a, b) and the measurements from the mast Lindenberg in 2018 (c, d). The graphs on the left show the amplitude of the diurnal cycle with altitude. The graphs on the right show the hour of the maximum wind speed in the mean diurnal cycle with altitude. Times in UTC.
A similar characteristic can be seen for the Karlsruhe measurements (Fig. 11). The wind speed is not overestimated in the reanalyses which could be due to the channelization effect of the Rhine Valley. In the lower model levels, the wind speed of the reanalysis is greater than the observed values, which may however also be due to impacts of building or forests on the measurements. The height profiles of the amplitude of the mean diurnal cycle and the hour of the diurnal maximum of Karlsruhe show no further findings than the corresponding height profiles of Hamburg and Lindenberg or than Fig. 12 and are therefore not shown here.
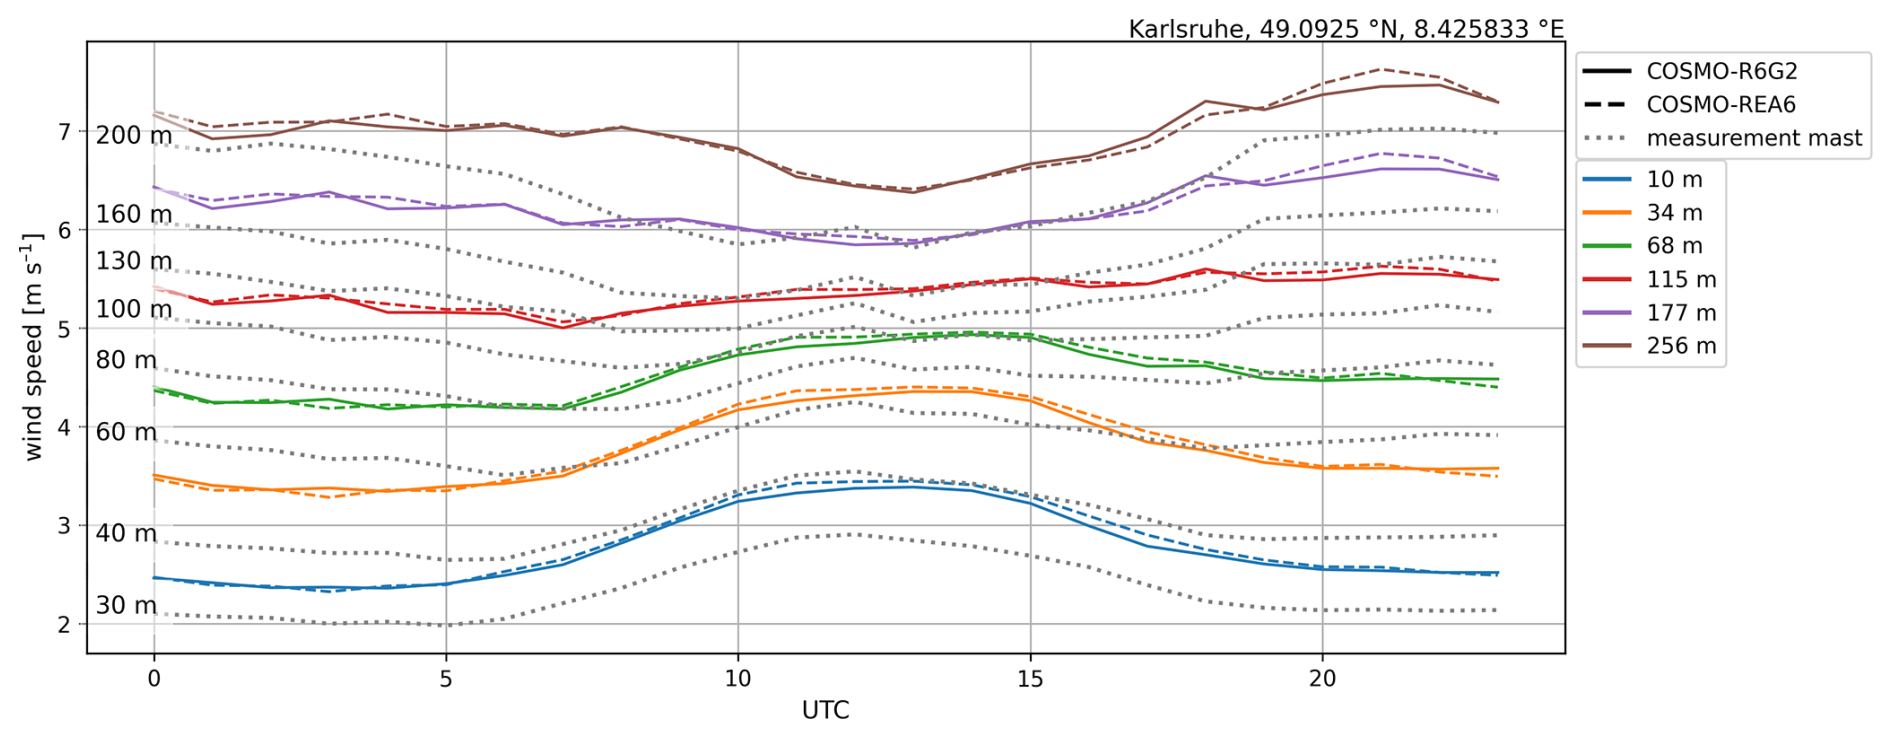
Figure 11Comparison of the diurnal cycle at different model level heights for COSMO-R6G2 (solid lines), COSMO-REA6 (dashed lines) and measurements (dotted lines) in Karlsruhe for 2017. Times in UTC.
The next step of our analysis is the relationship between the height of the surface in the reanalysis models and the difference between the mean wind speed in the two reanalyses. Figure 12 shows the differences for model level 37 (approximately 115 m a.g.l.) in 2018. Each dot depicts the mean difference of the wind speeds in COSMO-R6G2 and COSMO-REA6 of one of the grid cells of the area shown in Fig. 6. The differences between the reanalyses clearly increase with increasing surface height, as already indicated by annual averages (Fig. 6).
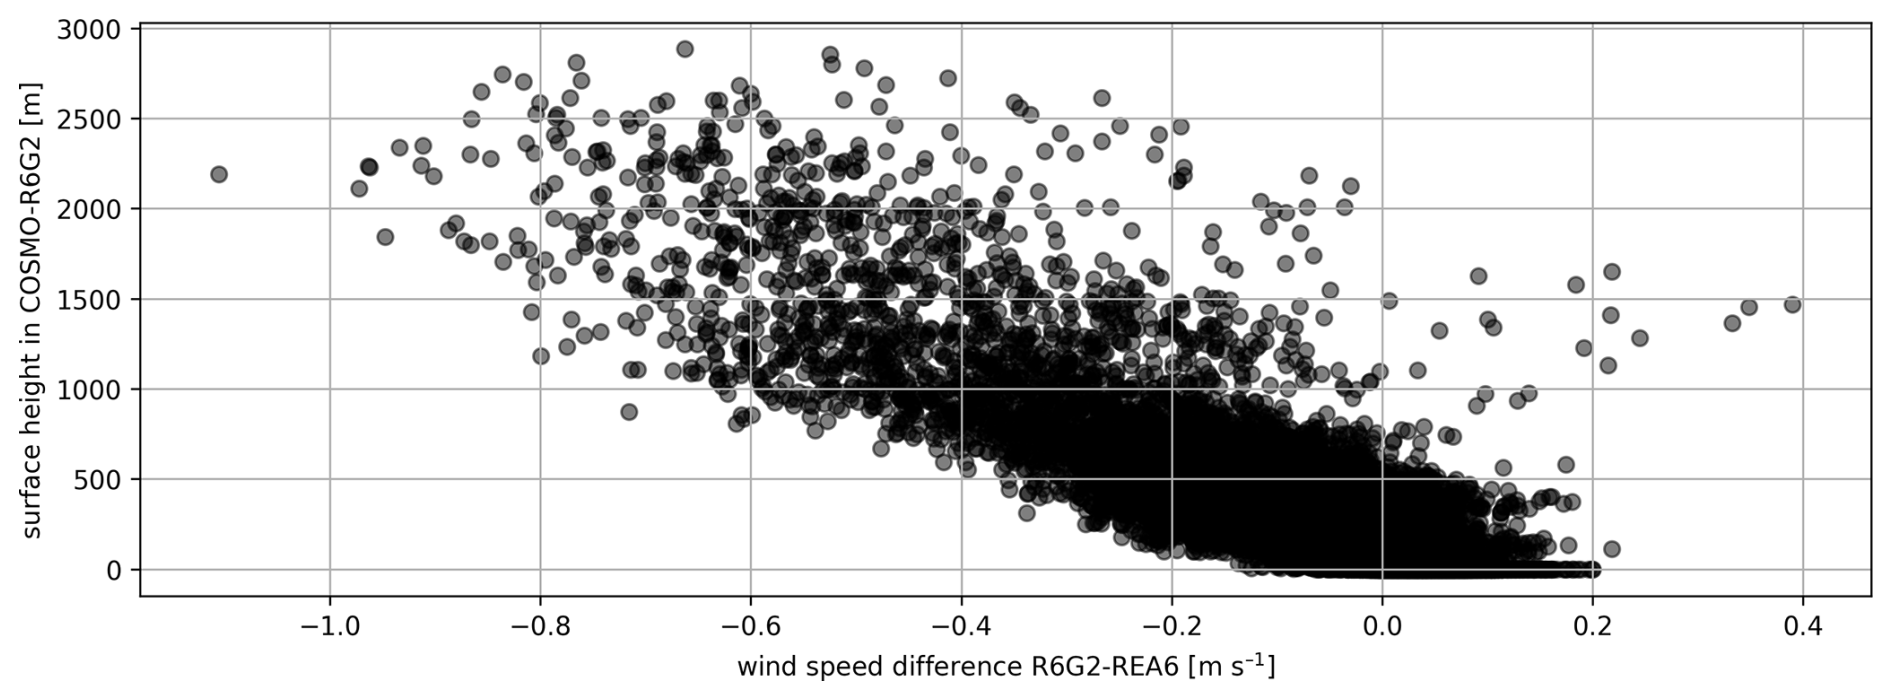
Figure 12Mean annual wind speed deviation between COSMO-R6G2 and COSMO-REA6 for 2018 vs. the surface height in COSMO-R6G2.
Over mountainous regions, COSMO-R6G2 typically has a lower mean wind speed compared to COSMO-REA6, while over flatlands COSMO-R6G2 frequently shows higher mean wind speed. COSMO-REA6 has known problems with reproducing the nocturnal maximum (Borsche et al., 2016). A brief look at the annual mean diurnal cycle in a region with a higher heterogeneous topography, here Neustadt (Titisee) located in the black forest, is depicted in Fig. 13a. In comparison to COSMO-REA6, wind speeds are lower in COSMO-R6G2 during the full daily cycle, but to a greater extend during the night. This characteristic becomes more pronounced for higher model levels. Regions like the Rhine Valley or Lake Constance, where the annual mean wind speed in COSMO-R6G2 is higher compared to COSMO-REA6, show higher wind speed during night time in COSMO-R6G2 (Fig. 13b). COSMO-R6G2 shows a more pronounced diurnal cycle in altitudes around 100 m.
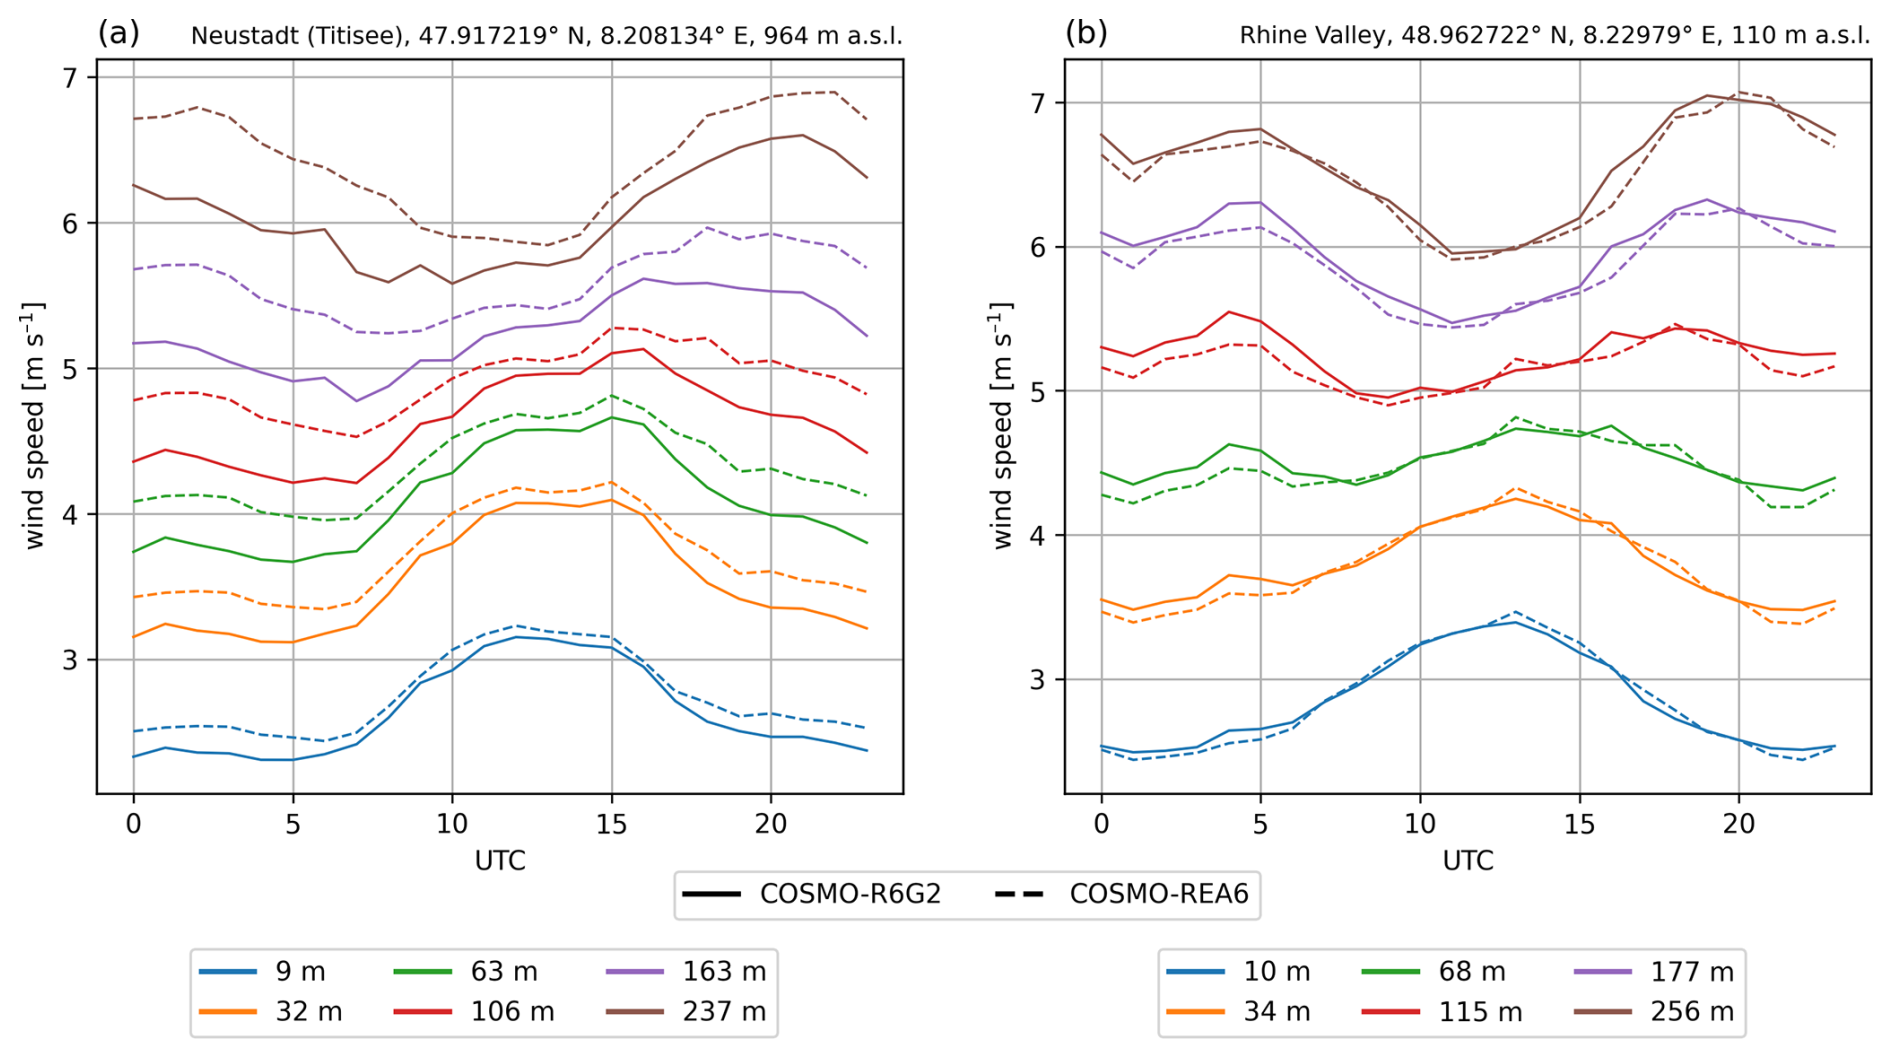
Figure 13Mean annual diurnal cycle of the wind speed at different model level heights at (a) Neustadt (Titisee) and in the (b) Rhine Valley from COSMO-R6G2 (solid line) and COSMO-REA6 (dashed line) in 2018. Times in UTC.
In a last step, a comparison with the collection of 32 measurement stations distributed over Germany is performed. For most sites no measurement was available at exactly the height of the investigated model level. Therefore, height differences between the model and the measurements are present. During the site selection, sites were excluded when the difference between the closest measurement height and the model level is greater than 25 m. Both models show in Fig. 14 a mean and median bias close to 0 m s−1 but a considerable spread with an interquartile range of 1.2 m s−1. While this comparison gives some indication of a good model performance, it should be noted that most of these measurements were performed for wind energy applications and, thus, at locally windy sites. Considering this, it is likely that both, COSMO-REA6 and COSMO-R6G2, tend to overestimate the average representative wind conditions in a grid cell at height close to 100 m. This is also in line with the observations in flat terrain from Hamburg and to some extend Karlsruhe, where an overestimation of the wind speed by the reanalyses was observed. If only stations located higher than 200 m a.s.l. are considered (19 stations), a slightly lower mean bias for COSMO-REA6 than for COSMO-R6G2 can be observed, however it is larger (and with opposite sign), when the median is used. When considering all stations, this difference becomes smaller (between both reanalyses and esp. for the median). However, only 4 out of the 32 stations show a statistically significant difference between the two generations (for year 2017, t test with α=0.05). The low (and partly contrasting) mean and median values suggest that spatial variability should be kept in mind when drawing conclusions for individual locations. These findings are in line with results of Geiger et al. (2026) who simulated the power production for all of Germany and found an overestimation of the simulated wind energy production from both COSMO-REA6 and COSMO-R6G2. Also, in their study, slightly lower wind energy production was simulated for COSMO-R6G2 than for COSMO-REA6.
Generally, all analysed wind-related differences between both dataset generations are small and suggest that both versions of the reanalysis are broadly comparable.
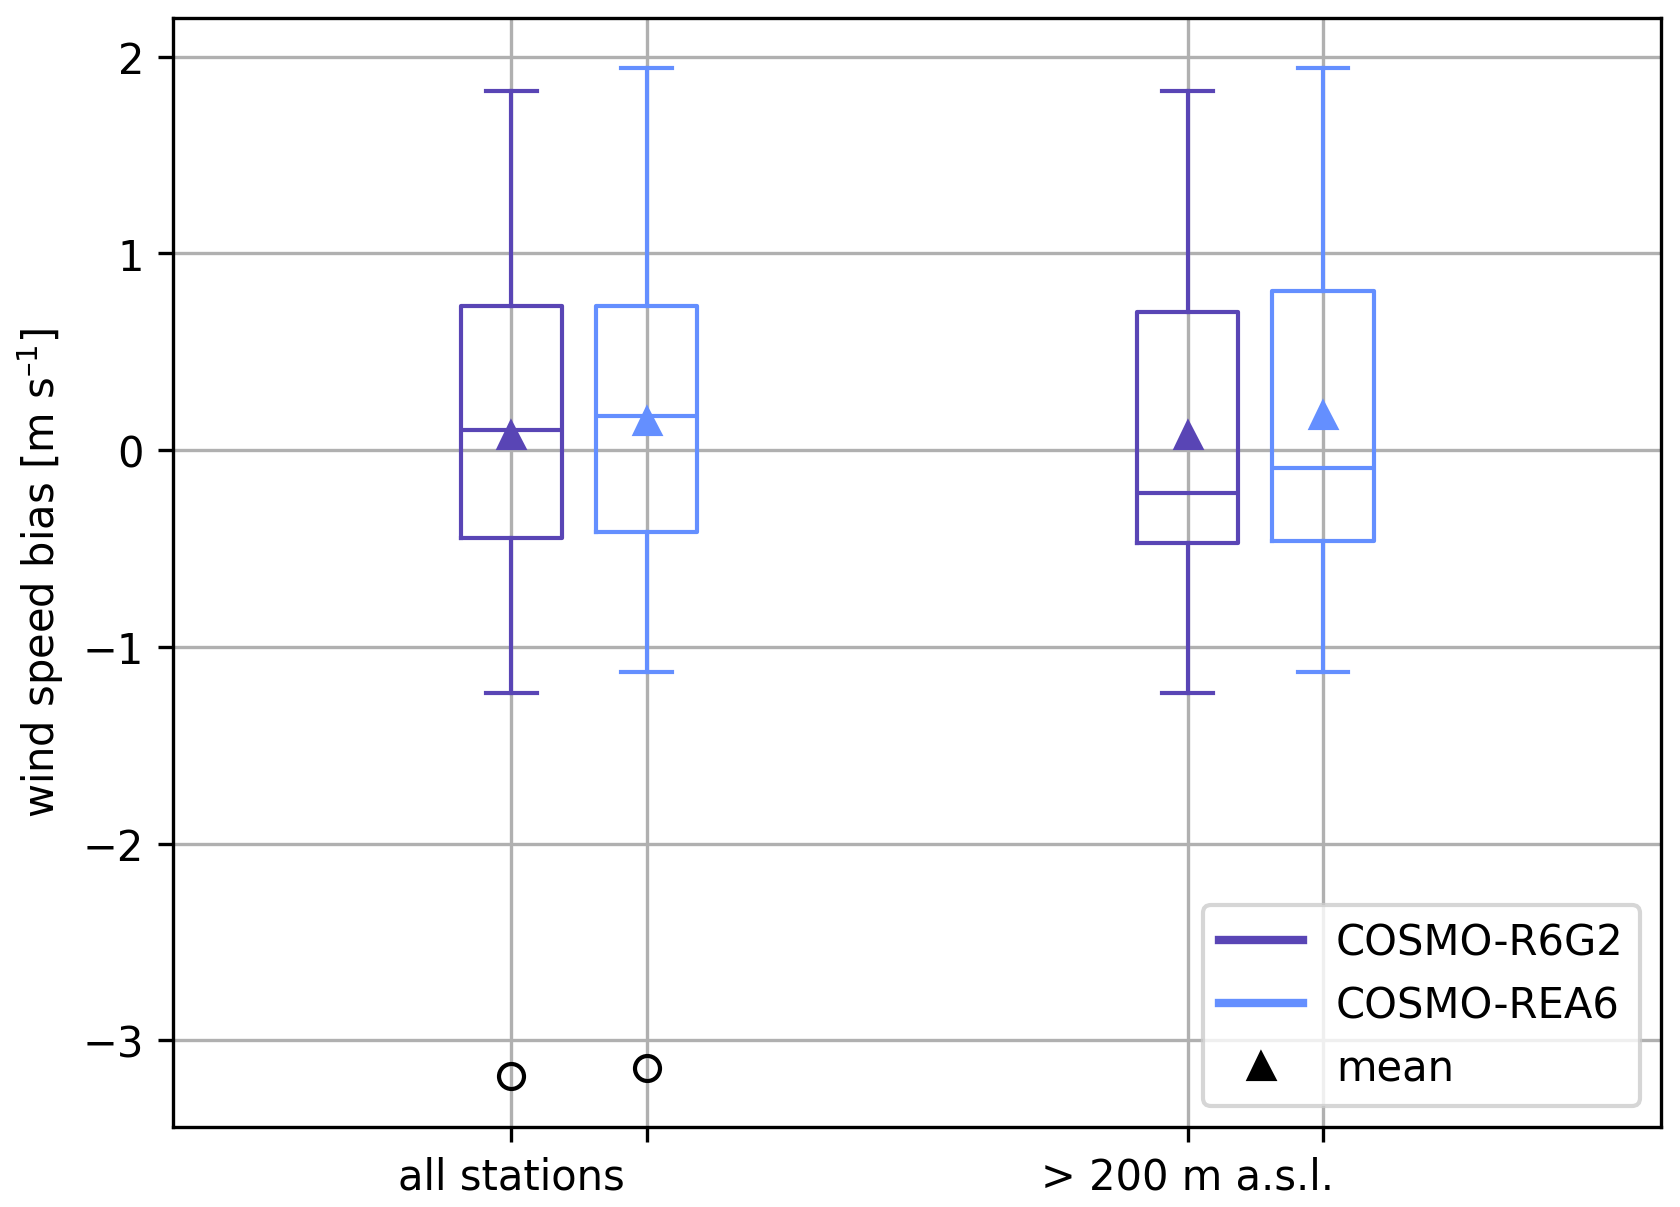
Figure 14Wind speed bias of COSMO-R6G2 (purple) and COSMO-REA6 (blue) to the wind measurements at 32 locations (left), respectively 19 stations >200 m above sea level (right These 19 stations are part of the full set, i.e., they do not represent an independent set of stations.
In this study, we analysed the performance of COSMO-R6G2 as a successor to COSMO-REA6 with focus on variables relevant for energy applications. Therefore, we focused on Global Horizontal Irradiance (GHI) and wind speed over Germany at a height of approximately 100 m above ground. The two reanalyses were compared to each other and evaluated against satellite-based radiation products and wind measurements. Due to limited data availability of the preliminary COSMO-R6G2 data set, the analysis of GHI focused on the year 2018. In case of wind speed, the years 2017 and 2018 were evaluated. For the evaluation of the reanalyses, satellite-based products (SARAH-2 and SARAH-3), radiation measurements from the station network of DWD, data from meteorological measurement masts, lidars and sodars were used. For the meteorological masts it can be assumed that they provide representative measurements, whereas the additional data might have a bias towards favourable wind conditions as they were often performed in the context of wind energy projects. The evaluation of wind speed therefore mainly focused on the first category.
Radiation (GHI) deficits follow similar patterns to those identified in studies on COSMO-REA6, especially an overestimation during cloudy sky conditions and an underestimation during clear sky conditions (see Fig. 3 in Frank et al., 2018). When compared to station measurements and satellite-based data, the new generation COSMO-R6G2 shows an even slightly stronger underestimation than COSMO-REA6. That underestimation is in both versions caused by the (still unchanged) aerosol climatology and a relevant improvement would require a more realistic aerosol climatology or a post-processing of the output with a bias correction as e.g., proposed by Frank et al. (2018) for COSMO-REA6. Despite the slightly lower performance, the quality of GHI of COSMO-R6G2 can be considered as roughly similar to the one of COSMO-REA6. As in the studies on the earlier versions of the data sets, it has been shown that the satellite-based products have a lower bias and RMSE than the reanalyses when compared with ground-based observations. If users are particularly interested in high-quality radiation data, the use of satellite-based radiation datasets (as e.g. SARAH-3) is recommended as the preferred choice. However, there might also be applications that require a set of several internally consistent meteorological parameters, so that the reanalyses are more suitable in these cases.
The comparison with wind measurements at selected masts showed that individual extreme wind events are realistically reproduced by COSMO-R6G2 in terms of their amplitude and timing. However, a known weakness related to wind speed in COSMO-REA6 was the underestimation of the nocturnal maximum at heights around 100 m. In regions with flat topography there are hardly any differences between COSMO-R6G2 and COSMO-REA6. The underestimation of the nocturnal maximum of COSMO-R6G2 above higher and heterogeneous topography is slightly greater than that of COSMO-REA6. As both reanalyses are based on a mesoscale model (based on the COSMO-EU model setup), it is not unexpected that some shortcomings remain over heterogeneous terrain. Potential reasons for the differences between COSMO-REA6 and COSMO-R6G2 are the modifications of the model itself as well as the updated boundary conditions, but complex improvements of various details between model versions make it difficult to pinpoint one single process responsible for the differences. Overall, while slightly lower performance statistics were calculated for some features, COSMO-R6G2 maintains a quality that matches the quality of COSMO-REA6. Over heterogeneous mountainous terrain, however, users should be aware of the known deficits of the COSMO model. Because most measurement were conducted in the context of wind energy applications and therefore typically at wind-favoured sites, grid-cell-representative mean winds are likely overestimated by both reanalyses (this aligns with the overestimation we identified for the flat-terrain sites Hamburg and Karlsruhe). One of the major advantages of COSMO-R6G2 is that, due to the extended length of ERA5 (used for the boundary conditions), the reanalysis will span a longer period compared to the predecessor COSMO-REA6. Overall, in this initial assessment no robust systematic improvement or degradation relative to observations was found (for all terrain types) and therefore both generations of the COSMO-reanalysis are broadly comparable. Users can use COSMO-R6G2 as an extended successor of COSMO-REA6, but should carefully consider the results of all quality assessments and known general weaknesses of the COSMO-based datasets. It is important to note that specific applications require a highly detailed assessment of product characteristics. For instance, in the energy sector, capacity factor calculations are typically based on wind turbine power curves (e.g., Kaspar et al., 2019), which exhibit a cubic (v3) relationship. Moreover, when analysing energy systems, quality differences between daytime and night-time conditions can be particularly significant. Therefore, application-specific quality assessments, as well as further intercomparisons between existing and emerging reanalysis datasets, are essential.
The assessment in this paper is based only on a limited time period and a limited number of statistical features. Our aim is to provide users with an early initial assessment to accompany the provision of the dataset under the open data policy at an early stage. It became apparent for the previous version that it was used in many energy-related activities and that these users often also carried out their own evaluation studies (see review of Kaspar et al., 2020). It is therefore to be expected that the user community will also provide additional quality assessments of the DWD reanalyses in the future. We explicitly welcome supplementary assessments and see them as a valuable benefit of the open data policy. A first edition of a reanalysis based on DWD's new ICON-based NWP-system has recently been published (Valmassoi et al., 2025; Kaspar et al., 2026) and based on initial quality assessments, improvements are also expected for energy-related parameters, but the current version only covers the period from 2010 onwards. Until an extended version of this dataset is available, COSMO-R6G2 represents a time-extended reanalysis dataset that ties in with the quality of the previous version.
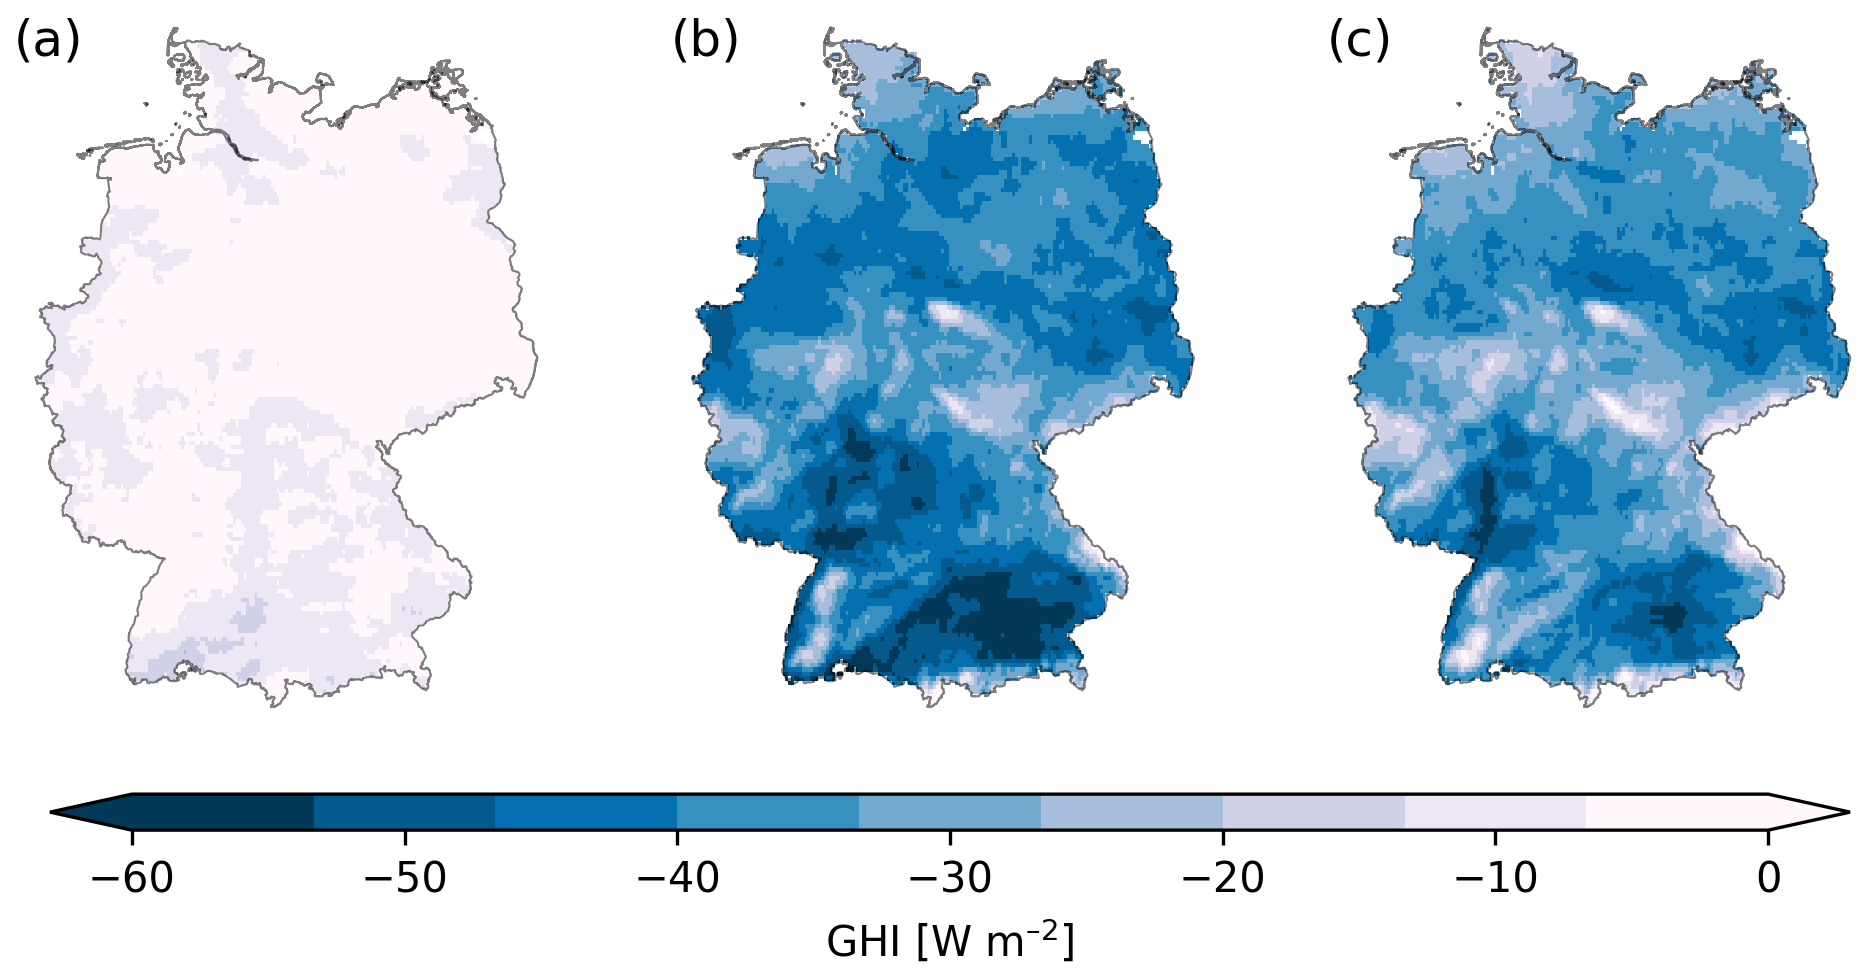
Figure A1Maps of the deviation between the GHI mean of COSMO-R6G2 and COSMO-REA6 (a), COSMO-R6G2 and SARAH-3 (b) and COSMO-REA6 and SARAH-3 (c) over Germany for summer of 2018. The darker the blue, the larger the (negative) GHI bias.
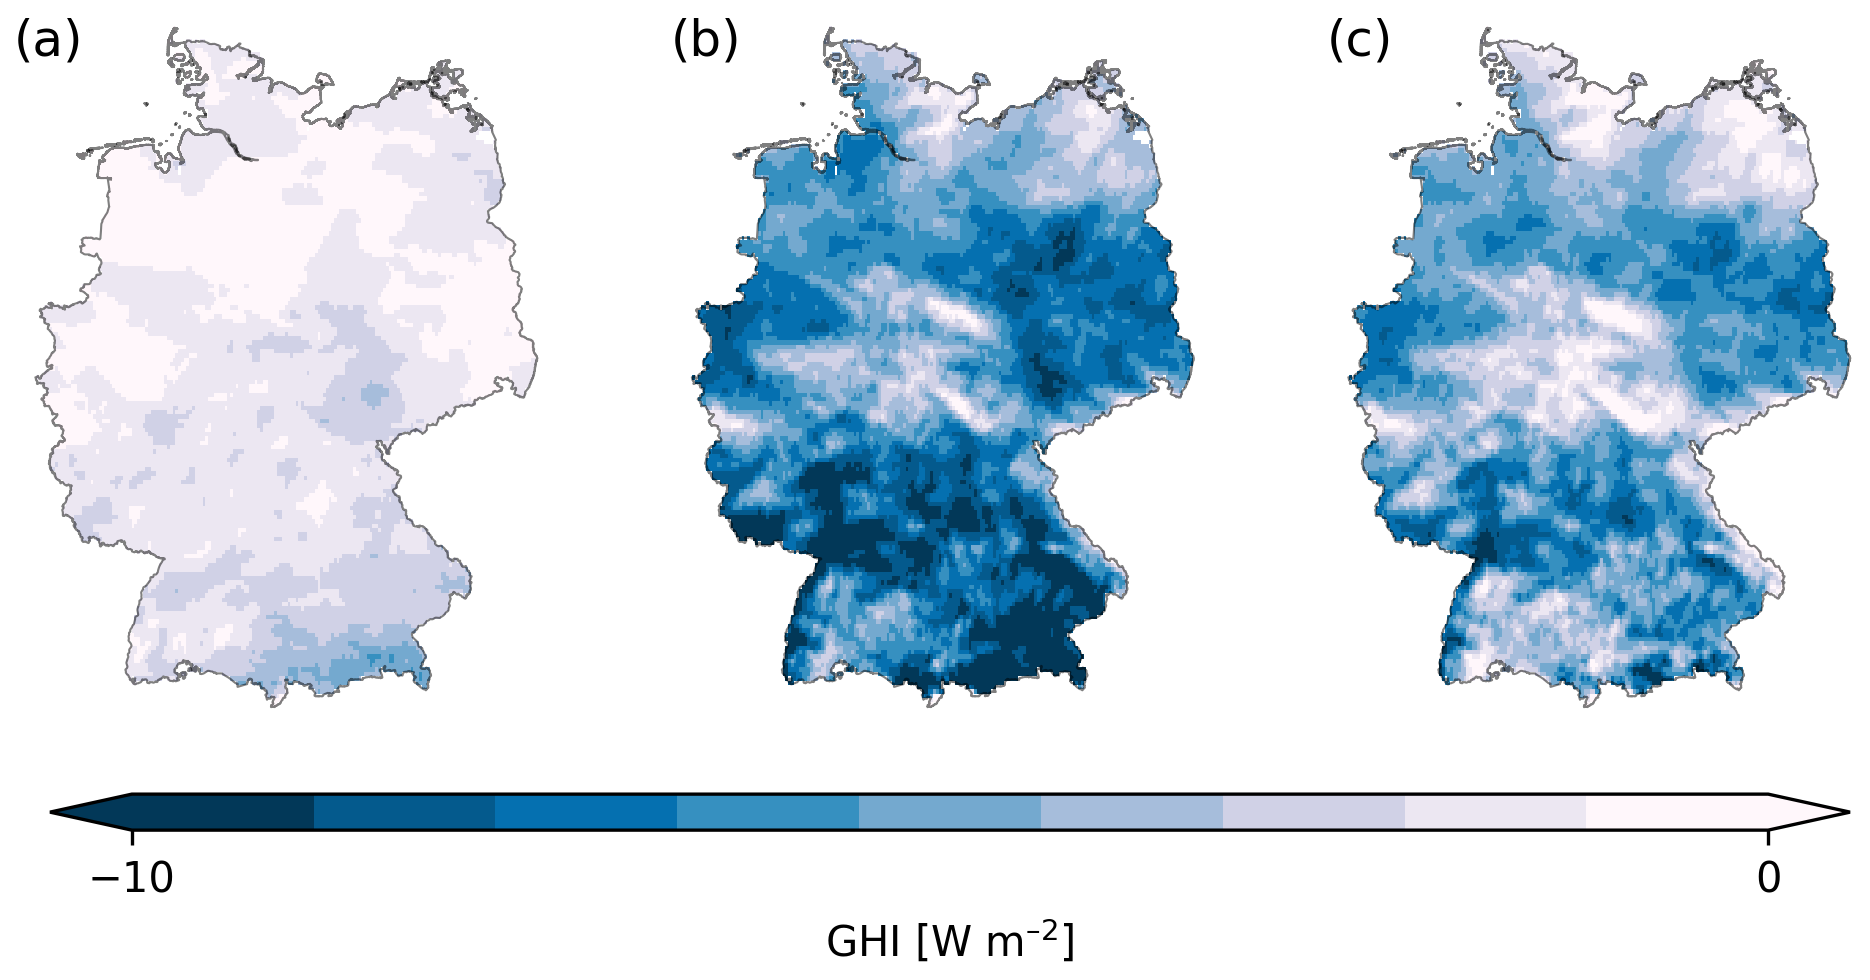
Figure A2Maps of the deviation between the GHI mean of COSMO-R6G2 and COSMO-REA6 (a), COSMO-R6G2 and SARAH-3 (b) and COSMO-REA6 and SARAH-3 (c) over Germany for winter of 2018. The darker the blue, the larger the (negative) GHI bias.
COSMO-R6G2 is available via DWD's Climate Data Centre (https://opendata.dwd.de/climate_environment/REA/COSMO_R6G2/, last access: 7 May 2026). COSMO-REA6 is also available via DWD's Climate Data Centre (https://opendata.dwd.de/climate_environment/REA/COSMO_REA6/, last access: 7 May 2026) and via the World Data Centre for Climate: https://doi.org/10.26050/WDCC/CR6_EU6 (Bollmeyer et at., 2015, 2024). ICON-DREAM is available via: https://doi.org/10.5676/dwd/icon-dream_v1 (Valmassoi et al., 2025). SARAH-3 data can be ordered via https://doi.org/10.5676/EUM_SAF_CM/SARAH/V003 (Pfeifroth et al., 2023a). SARAH-2 data can be provided on request. The radiation data from the network of DWD are available via DWD's Climate Data Centre (https://opendata.dwd.de/climate_environment/CDC/observations_germany/climate/10_minutes/solar, last access: 7 May 2026). The mast data can be requested via the contact persons listed on the University of Hamburg website (https://www.cen.uni-hamburg.de/icdc/data/atmosphere.html, last access: 7 May 2026). Wind measurements from Helgoland are available from https://doi.org/10.1594/PANGAEA.924184 (Rausch et al., 2020).
Measurements of the FINO masts are available from the website of the Bundesamt für Seeschifffahrt und Hydrographie (https://www.bsh.de/EN/TOPICS/Monitoring_systems/MARNET_monitoring_network/FINO/fino_node.html, Bundesamt für Seeschifffahrt und Hydrographie, 2024).
FB wrote the first draft of the manuscript. All other authors commented, amended and revised the manuscript. FB and FK composed the final version of the manuscript. MB produced the COSMO-R6G2 data. DY, DG and LP carried out the data curation for the 32 wind profiles.
The contact author has declared that none of the authors has any competing interests.
Publisher's note: Copernicus Publications remains neutral with regard to jurisdictional claims made in the text, published maps, institutional affiliations, or any other geographical representation in this paper. The authors bear the ultimate responsibility for providing appropriate place names. Views expressed in the text are those of the authors and do not necessarily reflect the views of the publisher.
This article is part of the special issue “EMS Annual Meeting: European Conference for Applied Meteorology and Climatology 2024”. It is a result of the EMS Annual Meeting 2024, Barcelona, Spain, 2–6 September 2024. The corresponding presentation was part of session UP3.6: Global and regional reanalyses.
We acknowledge the data provision of DWD's Meteorological Observatory Lindenberg, the Meteorological Institute at Universität Hamburg, the Institute of Meteorology and Climate Research – Department Troposphere Research in Karlsruhe and EUMETSAT's Satellite Application Facility on Climate Monitoring (CM SAF). Two anonymous reviewers gave detailed comments, which helped to improve the manuscript. We also thank Semjon Schimanke for his comments on the manuscript.
This study was supported within the framework of the “BMV Research Network” (Topic Area: Renewable Energies), where DWD provides a quality assessment of meteorological datasets to support the analysis of the potential of renewable energies within the German transport system. Parts of this work was carried out within the project MEDAILLON (grant nos. 03EI1059A, 03EI1059B, 03EI1059D), which is funded by the Federal Ministry for Economic Affairs and Energy (BMWE).
This paper was edited by Eric Bazile and reviewed by two anonymous referees.
Bär, F., Kaspar, F., Streek, P., Gersdorf, F., Auerbach, M., and Rieck, D.: Abschätzung des potenziellen jährlichen Energieertrags von PV-Anlagen an Lärmschutzeinrichtungen der Verkehrswege, BMDV-Expertennetzwerk, Technical Report, 2022.
Basse, A., Pauscher, L., and Callies, D.: Improving Vertical Wind Speed Extrapolation Using Short-Term Lidar Measurements, Remote Sens., 12, 1091, https://doi.org/10.3390/rs12071091, 2020.
Basse, A., Callies, D., Grötzner, A., and Pauscher, L.: Seasonal effects in the long-term correction of short-term wind measurements using reanalysis data, Wind Energ. Sci., 6, 1473–1490, https://doi.org/10.5194/wes-6-1473-2021, 2021.
Behrens, K. and Grewe, R.: A comparison of SCAPP radiation data with global, diffuse and direct solar radiation, in: WMO Technical Conference on Meteorological and Environmental Instruments and Methods of Observation (TECO-2005), vol. 1265, World Meteorological Organization, https://library.wmo.int/idurl/4/41919, 2005.
Beyrich, F. and Adam, W. K.: Site and Data Report for the Lindenberg Reference Site in CEOP – Phase I, Berichte des Deutschen Wetterdienstes, 230, Offenbach am Main, Germany, 55 pp., ISBN 978-3-88148-422-0, 2007.
Bollmeyer, C., Keller, J. D., Ohlwein, C., Wahl, S., Crewell, S., Friederichs, P., Hense, A., Keune, J., Kneifel, J. Pscheidt, I., Redle, S., and Steinke, S.: Towards a high-resolution regional reanalysis for the European CORDEX domain, Q. J. Roy. Meteor. Soc., 141, 1–15, https://doi.org/10.1002/qj.2486, 2015.
Bollmeyer, C., Keller, J., Ohlwein, C., Hense, A., Borsche, M., Niermann, D., Kaspar, F., and Schupfner, M.: Regional Reanalysis COSMO-REA6 – Standardised Parameters. World Data Center for Climate (WDCC) at DKRZ [data set], https://doi.org/10.26050/WDCC/CR6_EU6, 2024.
Borsche, M., Kaiser-Weiss, A. K., and Kaspar, F.: Wind speed variability between 10 and 116 m height from the regional reanalysis COSMO-REA6 compared to wind mast measurements over Northern Germany and the Netherlands, Adv. Sci. Res., 13, 151–161, https://doi.org/10.5194/asr-13-151-2016, 2016.
Brune, S., Keller, J. D., and Wahl, S.: Evaluation of wind speed estimates in reanalyses for wind energy applications, Adv. Sci. Res., 18, 115–126, https://doi.org/10.5194/asr-18-115-2021, 2021.
Bundesamt für Seeschifffahrt und Hydrographie: Forschungsplattformen in Nord- und Ostsee, FINO data, Bundesamt für Seeschifffahrt und Hydrographie [data set], https://www.bsh.de/EN/TOPICS/Monitoring_systems/MARNET_monitoring_network/FINO/fino_node.html (last access: 7 May 2026), 2024.
Dee, D. P., Uppala, S. M., Simmons, A. J., Berrisford, P., Poli, P., Kobayashi, S., Andrae, U., Balmaseda, M. A., Balsamo, G., Bauer, P., Bechtold, P., Beljaars, A. C. M., van de Berg, L., Bidlot, J., Bormann, N., Delsol, C., Dragani, R., Fuentes, M., Geer, A. J., Haimberger, L., Healy, S. B., Hersbach, H., Hólm, E. V., Isaksen, L., Kållberg, P., Köhler, M., Matricardi, M., McNally, A. P., Monge-Sanz, B. M., Morcrette, J.-J., Park, B.-K., Peubey, C., de Rosnay, P., Tavolato, C., Thépaut, J.-N., and Vitart, F.: The ERA-Interim reanalysis: Configuration and performance of the data assimilation system, Q. J. Roy. Meteor. Soc., 137, 553–597, https://doi.org/10.1002/qj.828, 2011.
Frank, C. W., Wahl, S., Keller, J. D., Pospichal, B., Hense, A., and Crewell, S.: Bias correction of a novel European reanalysis data set for solar energy applications, Solar Energy, 164, 12–24, https://doi.org/10.1016/j.solener.2018.02.012, 2018.
Geiger, D., Zink, C., Bär, F., Pfennig, M., Callies, D., Pape, C., Drücke, J., and Pauscher, L.: Assessing the performance of reanalysis and meso-scale model datasets for onshore wind power modelling in Germany, Adv. Sci. Res., 22, 131–148, https://doi.org/10.5194/asr-22-131-2026, 2026.
Heppelmann, T., Steiner, A., and Vogt, S.: Application of numerical weather prediction in wind power forecasting: Assessment of the diurnal cycle, Meteorol. Z., 26, 319–331, https://doi.org/10.1127/metz/2017/0820, 2017.
Hersbach, H., Bell, B., Berrisford, P., Hirahara, S., Horányi, A., Muñoz-Sabater, J., Nicolas, J., Peubey, C., Radu, R., Schepers, D., Simmons, A., Soci, C., Abdalla, S., Abellan, X., Balsamo, G., Bechtold, P., Biavati, G., Bidlot, J., Bonavita, M., De Chiara, G., Dahlgren, P., Dee, D., Diamantakis, M., Dragani, R., Flemming, J., Forbes, R., Fuentes, M., Geer, A., Haimberger, L., Healy, S., Hogan, R.J., Hólm, E., Janisková, M., Keeley, S., Laloyaux, P., Lopez, P., Lupu, C., Radnoti, G., De Rosnay, P., Rozum, I., Vamborg, F., Villaume, S., and Thépaut, J.-N.: The ERA5 global reanalysis, Q. J. Roy. Meteor. Soc., 146, 1999–2049, https://doi.org/10.1002/qj.3803, 2020.
IEC: 61400-50-1:2022 – Wind energy generation systems – Part 50–1: Wind measurement – Application of meteorological mast, nacelle and spinner mounted instruments, 2022a.
IEC: 61400-50-2:2022 – Wind energy generation systems – Part 50–2: Wind measurement – Application of ground-mounted remote sensing technology, 2022b.
Kaspar, F. and Mächel, H.: Beobachtung von Klima und Klimawandel in Mitteleuropa und Deutschland, in: Klimawandel in Deutschland, edited by: Brasseur, G. P., Jacob, D., and Schuck-Zöller, S., Springer Spektrum, Berlin, Heidelberg, https://doi.org/10.1007/978-3-662-66696-8_3, 2023.
Kaspar, F., Borsche, M., Pfeifroth, U., Trentmann, J., Drücke, J., and Becker, P.: A climatological assessment of balancing effects and shortfall risks of photovoltaics and wind energy in Germany and Europe, Adv. Sci. Res., 16, 119–128, https://doi.org/10.5194/asr-16-119-2019, 2019.
Kaspar, F., Niermann, D., Borsche, M., Fiedler, S., Keller, J., Potthast, R., Rösch, T., Spangehl, T., and Tinz, B.: Regional atmospheric reanalysis activities at Deutscher Wetterdienst: review of evaluation results and application examples with a focus on renewable energy, Adv. Sci. Res., 17, 115–128, https://doi.org/10.5194/asr-17-115-2020, 2020.
Kaspar, F., Bär, F., Borsche, M., Brinckmann, S., Drücke, J., Kuhl, E., Mikalsen, A. C., Möller, T., Ostermöller, J., Paxian, A., Schmidt, S., Spangehl, T., Trentmann, J., Valmassoi, A., Wandel, J., and Weber, H.: Climate Services in Support of the German Energy Transition: Examples that make a difference, J. Eur. Meteorol. Soc., 4, 100036, https://doi.org/10.1016/j.jemets.2026.100036, 2026.
Kenny, D. and Fiedler, S.: Which gridded irradiance data is best for modelling photovoltaic power production in Germany?, Solar Energy, 232, 444–458, https://doi.org/10.1016/j.solener.2021.12.044, 2022.
Kohler, M., Metzger, J., and Kalthoff, N.: Trends in temperature and wind speed from 40 years of observations at a 200-m high meteorological tower in Southwest Germany, Int. J. Climatol., 38, 23–34, 2018.
Kühn, P., Basse, A., Callies, D., Chen, Y., Döpfer, R., Freier, J., Griesbach, T., Klaas, T., and Pauscher, L.: “NEWA Forested Hill Experiment Kassel.” Fraunhofer IEE, Zenodo [data set], https://doi.org/10.5281/zenodo.3581412, 2018.
Pauscher, L., Callies, D., Klaas, T., and Foken, T.: Wind observations from a forested hill: Relating turbulence statistics to surface characteristics in hilly and patchy terrain, Meteorol. Z., 27, 43–57, https://doi.org/10.1127/metz/2017/0863, 2018.
Pfeifroth, U., Kothe, S., Müller, R., Trentmann, J., Hollmann, R., Fuchs, P., and Werscheck, M.: Surface Radiation Data Set – Heliosat (SARAH) – Edition 2, Satellite Application Facility on Climate Monitoring [data set], https://doi.org/10.5676/EUM_SAF_CM/SARAH/V002, 2017.
Pfeifroth, U., Trentmann, J., Hollmann, R., Selbach, N., Werscheck, M., and Meirink, J. F.: ICDR SEVIRI Radiation – based on SARAH-2 methods, Satellite Application Facility on Climate Monitoring [data set], https://wui.cmsaf.eu/safira/action/viewICDRDetails?acronym=SARAH_V002_ICDR (last access: 7 May 2026), 2018.
Pfeifroth, U., Kothe, S., Drücke, J., Trentmann, J., Schröder, M., Selbach, N., and Hollmann, R.: Surface Radiation Data Set – Heliosat (SARAH) – Edition 3, Satellite Application Facility on Climate Monitoring [data set], https://doi.org/10.5676/EUM_SAF_CM/SARAH/V003, 2023a.
Pfeifroth, U., Trentmann, J., and Drücke, J.: Validation Report: Meteosat Solar Surface Radiation and Effective Cloud Albedo Climate Data Records. SARAH-3, Satellite Application Facility on Climate Monitoring, is part of https://doi.org/10.5676/EUM_SAF_CM/SARAH/V003, 2023b.
Pfenninger, S. and Staffell, I.: Long-term patterns of European PV output using 30 years of validated hourly reanalysis and satellite data, Energy, 114, 1251–1265, https://doi.org/10.1016/j.energy.2016.08.060, 2016.
Rausch, T., Schuchard, M., Cañadillas, B., and Lampert, A.: One year measurements of vertical profiles of wind speed and wind direction from 40 to 500 m at Heligoland, German Bight, North Sea, Germany, Technische Universität Braunschweig, PANGAEA [data set], https://doi.org/10.1594/PANGAEA.924184, 2020.
Ritter, B. and Geleyn, J.-F.: A comprehensive radiation scheme for numerical weather prediction models with potential applications in climate simulations, Mon. Weather Rev., 120, 303–325, https://doi.org/10.1175/1520-0493(1992)120<0303:ACRSFN>2.0.CO;2, 1992.
Spangehl, T., Borsche, M., Niermann, D., Kaspar, F., Schimanke, S., Brienen, S., Möller, T., and Brast, M.: Intercomparing the quality of recent reanalyses for offshore wind farm planning in Germany's exclusive economic zone of the North Sea, Adv. Sci. Res., 20, 109–128, https://doi.org/10.5194/asr-20-109-2023, 2023.
Urraca, R., Huld, T., Martinez-de-Pison, F. J., and Sanz-Garcia, A.: Sources of uncertainty in annual global horizontal irradiance data, Solar Energy, 170, 873–884, https://doi.org/10.1016/j.solener.2018.06.005, 2018.
Valmassoi, A., Anlauf, H., Becker, A., Keller, J.D., Krebber, S., Zängl, G., Potthast, R., Cress, A., Fundel, F., Hanisch, T., Lange, M., Steinert, T., and Kaspar, F.: ICON-DREAM: ICON-dual resolution reanalysis for emulators, applications and monitoring – the ICON-dual resolution reanalysis version v1.0, Deutscher Wetterdienst [data set], https://doi.org/10.5676/dwd/icon-dream_v1, 2025.
The continuous improvements of DWD's NWP-models is documented in newsletters with change notifications. They also describe the impact of the individual changes on the quality of the results. The archive of these newsletters can be found here: https://www.dwd.de/DE/fachnutzer/forschung_lehre/numerische_wettervorhersage/nwv_aenderungen/nwv_aenderungen_node.html (last access: 7 May 2026).