 | 29 Jul 2025
Bridging the gap between ensemble forecasting and end-user needs for decision-making on high-impact events
Matteo Ponzano
Bruno Joly
Isabelle Beau
Elvis Renard
Gregory Fifre
Ensemble forecasting is widely recognised as a more powerful and informative approach than deterministic forecasting, especially for anticipating high-impact events and supporting decisions under uncertain weather evolution. However, many end-users still struggle to interpret probabilistic forecasts and apply them in operational contexts. Misunderstandings, improper usage, miscommunication, and/or inappropriate design can lead to suboptimal or delayed decisions. In response, Météo-France has developed tools that aim to better adapt ensemble forecast information to the needs of different users. This article presents two prototype applications designed in collaboration with stakeholders. The first supports heat stress events management during the Paris 2024 Olympic and Paralympic Games, based on the WBGT (Wet Bulb Globe Temperature) index. The second focuses on late frost affecting vineyards during spring, with regard to mitigation measures and financial cost/loss optimisation. In both cases, ensemble forecasts were used to generate impact-oriented products to enhance operational decision-making procedures. The tools were evaluated through retrospective testing and end-user feedback. The results suggest that probabilistic forecasts are helpful when adapted to specific contexts. They can provide earlier and more confident decisions, even for users without meteorological expertise. These tools are not intended to replace expert assessment, but rather to clarify when action may be needed. Generalising such approaches could help extend the benefits of ensemble forecasting for sectors in which its potential remains underused.
- Article
(2294 KB) - Full-text XML
- BibTeX
- EndNote


The initial ensemble prediction system (EPS) was developed in 1992 by the European Centre for Medium-Range Weather Forecasts (ECMWF) (Palmer et al., 1993; Molteni et al., 1996). Subsequently, several national meteorological services initiated the production of ensemble forecasts (Toth and Kalnay, 1993; Bowler et al., 2008; Descamps et al., 2015). Over the years, extensive research on initial condition perturbation and model physics has significantly enhanced the accuracy of operational EPSs. These developments have led to more reliable forecasts in terms of statistical representation (Palmer, 2019). Overall, probabilistic forecasting has brought fundamental progress over deterministic forecasting or “poor man's ensemble” (Ebert, 2001) by providing a more realistic representation of uncertainty. A poor man's ensemble is a set of independent numerical weather prediction model forecasts from several operational centres. Unlike deterministic forecasts, which present a single predicted outcome, probabilistic forecasting generates a range of possible scenarios with different likelihoods (Gneiting and Raftery, 2005). Probabilistic forecasting from the ensemble distribution then provides a greater ability to assess the occurrence of extreme events. In fact, rare events are associated with a lower probability of occurrence, which, in particular, for long-range forecasts, is difficult to accurately estimate (Leutbecher and Palmer, 2008; Buizza and Hollingsworth, 2002). This shift from a binary to a probabilistic perspective in weather forecasting applications is crucial, as it enables users to refine their assessment of risks of intense events rather than a simple yes-or-no prediction. Decision makers can plan their strategies according to the probability levels from the ensemble forecast instead of a single threshold-based prediction (Palmer, 2002). Furthermore, probabilistic forecasts can be compared with historical data, helping to assess their reliability and refine their accuracy (Gneiting et al., 2005; Hamill et al., 2004). This systematic approach enhances confidence in predictions. The economic benefits derived from the probabilistic forecast consistently exceed those based on deterministic forecasts (Richardson, 2000). Probabilistic forecasting not only provides the best estimate of future conditions, but also alternative scenarios, making it easier to optimise risk-based processes in low-predictability situations (Zhu et al., 2002; LeClerc and Joslyn, 2015).
Despite its clear advantages, simplistic probabilistic forecasting is still hardly interpretable by end-users. Indeed, research shows that comprehension varies significantly depending on the context, available time, relevance of the forecast to the decision at stake, and how the information is presented (Joslyn and Savelli, 2010; Morss et al., 2010; Doksæter Sivle and Kolstø, 2016). Meanwhile, most users effectively incorporate probabilities into their decisions (Ripberger et al., 2022; Demeritt et al., 2016), but some misinterpret them, leading to inconsistent decisions (Gigerenzer et al., 2005). Providing probabilistic forecasts should pay more attention to forecast communication and representation strategies (Fundel et al., 2019). In public weather services, ensemble forecasts are often converted to broad probability distributions, while operational frameworks are more oriented towards decision scenarios. Alternatively, ensemble statistics from EPS outputs are sometimes used to derive the “most likely” forecast, which is then presented to users in a deterministic format. Although this approach simplifies communication, it may discard the probabilistic nature of the forecast and result in a loss of consistent information. The cost-loss trade-off refers to the balance between the cost of taking preventive action and the potential loss incurred if no action is taken and an adverse event occurs. In decision-making, this concept helps to determine the optimal threshold of probability of occurrence by comparing the expected cost of false alarms to the expected loss for missed events. When decisions involve well-defined cost-loss trade-offs, basic probabilistic products may not be optimal. Research has shown that businesses achieve better results when probabilistic information is elaborated according to their specific risk assessments (Palmer, 2002; Steele et al., 2021). In sectors such as energy management, and emergency planning, decision makers integrate probabilistic forecasts more effectively when they fit with their operational constraints (Roulston et al., 2003; Dale et al., 2014; Neal et al., 2014; Young et al., 2021).
This article focuses on how probabilistic forecasting can be effectively communicated for high-stakes, time-sensitive decisions, particularly in business and risk management. To maximise the contribution of ensemble predictions, Météo-France collaborates with end-users to develop tailored probabilistic forecast products. The objective of this research is to refine risk communication strategies so that they better adapt to needs and lead to effective forecast-based action across various sectors. This is achieved by engaging in interdisciplinary research and user dialogue. However, for probabilistic forecasting to be fully integrated into operational workflow, it is essential to understand how users perceive uncertainty and how a tailored probabilistic product can address their specific needs. To explore these aspects, this paper first examines the perception of probabilistic forecasting among users. This preliminary study identifies the key factors that influence trust, understanding, and sources of miscommunication. The second section focuses on applications where probabilistic forecasts have been integrated into decision-support systems. Two case studies illustrate the operational value of probabilistic forecast products. Finally, in the last section, the broader implications of these findings are provided.
2.1 Context
Several prospective studies have been conducted at Météo-France to identify potential applications and barriers to the wider adoption of probabilistic forecasting. Both internal evaluations and academic research have shown that presenting numerical probabilities without contextual references often leads to misunderstanding or underuse by end-users (Kim et al., 2014; Morss et al., 2010; Windschitl and Weber, 1999). To address this, probabilistic forecasting should be simplified (Fundel et al., 2019), structured around specific use cases (Mylne et al., 2024), and tailored to user needs (Roulston et al., 2003; Palmer, 2002; Fischhoff et al., 2012). Studies conducted with social scientists in collaboration with Météo-France have analysed how professional users, such as those in the energy sector, interpret and integrate ensemble forecasts into their decision-making processes (Breton, 2023). Feedback from internal surveys in various economic sectors has highlighted key challenges in understanding and using probabilistic forecasts effectively. These findings have led to recommendations for improving product design and communication strategies. To complement these studies, additional interviews were conducted with developers (i.e., thematic experts working within Météo-France's operational studies and development units) and market managers to gain deeper insights into how probabilistic products are perceived and used. This section synthesises the key findings from these studies, along with new perspectives emerging from a comprehensive overview of current challenges and opportunities to make probabilistic forecasting more accessible and helpful.
2.2 Sectoral Differences in Forecast Usage
The way Météo-France users perceive and make use of ensemble forecasting depends primarily on two factors: the impact of weather on their operations and their ability to interpret probabilistic information (Breton, 2023). A key distinction exists between industries where meteorological variability represents a sporadic, high-impact cost (e.g., transportation and road management) and those where weather is a constant operational factor (e.g., energy production). In sectors where weather events require occasional but costly interventions, users often perceive forecasts as a source of indecision rather than a tool to support or optimise decisions. For example, road managers and transport operators primarily focus on rare extreme events that trigger operational responses. Since they seek clear-cut decision thresholds (“act” vs. “do nothing”), they tend to favour deterministic forecasts over probabilistic ones, which they may view as complex or ambiguous. In addition, these users often lack experience integrating probabilistic data into their decision-making processes. These behaviours may also reflect cognitive biases. For instance, users may rely on motivated reasoning, interpreting forecasts in ways that support their expectations or operational habits (Dieckmann et al., 2017), especially when their statistical skill is low or uncertainty is poorly communicated (Durbach and Stewart, 2011; Bramwell et al., 2006). Conversely, industrial activity in which weather is an integral part of daily operations, such as the energy sector, incorporate probabilistic forecasts into their strategies (Zhou et al., 2013; Pinson et al., 2007; Matos and Bessa, 2010). These users, who generally have higher statistical competence, are more inclined to engage with probabilistic weather forecasts and leverage forecast uncertainty to refine their planning. The comprehension of probabilistic forecasts may also depend on the users' familiarity through repeated exposure. A comparative study by Gigerenzer et al. (2005) showed a significantly better interpretation of rainfall probabilities in New York, where such forecasts have been available the longest, compared to European cities. The time horizon of the forecasts also plays a crucial role in determining user engagement. Industries involved in long-term planning, such as salt extraction for winter road maintenance, are more receptive to seasonal probabilistic forecasts for salt supply management over extended periods. Despite these variations, research indicates that most users intuitively acknowledge forecast uncertainty and that it increases with the prediction range (Joslyn and Savelli, 2010; Gigerenzer et al., 2005; Stephens et al., 2019). Even those who would rather use deterministic forecasts often implicitly use uncertainty estimates, for example, by interpreting forecast variability as a confidence indicator (Morss et al., 2008). However, surveys showed that users with limited experience in interpreting uncertainty tend to overreact to forecast updates, which can lead to costly last-minute decisions (Hohle and Teigen, 2015).
2.3 Barriers to Adoption and User Misinterpretations
A major challenge in the adoption of probabilistic forecasting is the difficulty in identifying appropriate probability thresholds for decision-making. The usefulness of ensemble forecasts depends on whether users can turn those probabilities into actions. At Météo-France, this is illustrated by the limited use of probabilistic forecast products for commercial users. One such product provides users with the ability to assess the likelihood of exceeding predefined thresholds for key meteorological variables, including temperature, precipitation, wind, and snow. Ensemble forecast distributions can be depicted using plume charts and interactive probability diagrams, making it easier to interpret forecast uncertainty. Forecasts of maximum and minimum temperatures can be visualised with colour bands corresponding to percentiles to illustrate forecast variability. Users can also view the probability of temperatures exceeding or remaining below a chosen threshold, such as 0 °C for frost risk or 30 °C for heat events. Similarly, precipitation forecasts are represented with interactive histograms, indicating the probability of rainfall exceeding specific thresholds. Wind and snow forecasts follow the same logic, allowing users to estimate the probability of strong winds or snow accumulation beyond a customisable limit. These forecasts are generated using the ECMWF-EPS model, covering forecast horizons up to 14 d lead time. Despite these features, surveys show that the tool is rarely used or well understood. The main challenge reported by users is not the complexity of probabilistic forecasts themselves, but rather the difficulty in determining which probability thresholds should guide their operational decisions related to specific risk tolerance. As a result, despite recognising the potential value of probabilistic forecasts, many users still find it simpler to rely on deterministic forecasts. Similar findings have been observed in other studies (Fundel et al., 2019; Juanchich and Sirota, 2016), highlighting the need for structured user guidance and targeted communication to facilitate the transition from deterministic to probabilistic decision-making.
2.4 Recommendations for Improved Communication and Tool Design
To address this, co-developing probabilistic forecast products with end-users would ensure the correspondence between risk thresholds and probability values (Murphy, 1977). Users' backgrounds and decision-making processes vary significantly, leading to different needs in terms of the type and amount of information required (Raftery, 2016). For industries requiring a binary decision, the integration of a cost-loss analysis framework can help define optimal probability thresholds for operational responses. More broadly, enhancing the adoption of probabilistic forecasts requires user training, tailored visualisation techniques, and interactive tools that allow decision-makers to experiment with ensemble forecasts in real-world scenarios.
2.5 Introducing the risk matrix approach
The way in which the ensemble forecast information is represented is crucial for the interpretation of probabilistic outputs. The aim is to ensure that ensemble forecasts help end-users clearly assess both the potential impacts on their activities and the associated uncertainties. A relevant method to achieve this is the use of a risk matrix, which has recently been shown to be relevant for this objective. It relies on the definition of a risk as a combination of the probability of an event and its potential severity (Markowski and Mannan, 2008). By integrating these two dimensions, the risk matrix helps synthesise the information from probabilistic forecasts, making it easier for decision-makers to anticipate, classify, and prioritise risks (Prata et al., 2019; Young et al., 2021; Neal et al., 2014).
Building on these insights, we now examine two use cases of probabilistic forecasting integration into decision-making: heat stress management during the Paris 2024 Olympic and Paralympic Games and frost risk management during spring season in French Southwestern viticulture. These two examples try to demonstrate how user-oriented probabilistic tools can enhance operational planning and risk mitigation in weather-sensitive activities.
3.1 Heat stress risk management for sport events
3.1.1 Background on heat stress and WBGT index
High temperatures during major sporting events, such as the Olympic Games, pose a significant risk to both athletes and spectators. When combined with high humidity, high temperatures can lead to heat stress events, ranging from dehydration to life-threatening conditions. Endurance sports or events with prolonged exposure to the sun are particularly affected (Brotherhood, 2008). In recent years, several international competitions have faced increasing heat-related challenges, prompting organisers to establish adaptation measures, including schedule adjustments, cooling strategies, and medical protocols. The impact of extreme heat is particularly critical in urban environments, where the heat island effect (Kim, 1992) can significantly increase temperature extremes.
Thermal comfort indices are widely used to report the impact of climatic conditions on human comfort and health (Parsons, 2007). These indices incorporate multiple physical parameters that influence thermal perception, such as humidity, wind speed, and solar radiation. During the past few decades, numerous thermal comfort indices have been developed (Johansson et al., 2014; Blazejczyk et al., 2012), including Humidex, UTCI (Universal Thermal Comfort Index), PET (Physiological Equivalent Temperature), and Heat Index. Among them, one of the most widely recognised and utilised is the WBGT index. Created in the 1950s for the US Navy (Yaglou and Minaed, 1957), the WBGT index is used to address safety concerns in military, industrial, professional, and sports applications (Budd, 2008). It is recommended by a large number of organisations (BS EN ISO 7243, 2017; ACGIH, 1995; Sawka et al., 2007; Bergeron et al., 2012), as well as by many international sports federations (Mountjoy et al., 2012). As an empirical measure of heat stress, the WBGT index estimates the combined effects of air temperature, humidity, and thermal radiation on the human body, whether indoors or outdoors. In high-performance sports, the WBGT index is a key tool for regulating training programs and competitions, helping to prevent exhaustion and heatstroke among athletes. Protocols are often established on WBGT thresholds to suspend or cancel sporting events. Given its widespread recognition as a reliable indicator of heat stress and its direct applicability to outdoor sporting events, the WBGT index was selected as the reference index for the Paris 2024 Olympic and Paralympic Games. For outdoor conditions, the WBGT index is calculated using the formula:
This equation integrates three key factors: the Wet Bulb Temperature (Tw), which represents ambient humidity and evaporative cooling; the Dry Bulb Temperature (Ta), which corresponds to the standard air temperature measured with the thermometer; and the Globe Temperature (Tg), which accounts for the influence of thermal radiation from external sources, such as the sun. As part of the development of the WBGT computation, the Ta and Tw parameters are directly taken from meteorological models. The Tg component is derived from formulas originally developed by (Dimiceli et al., 2011), ensuring a consistent approach to estimating the heat stress conditions.
3.1.2 Forecasting context for the Paris 2024 Games
For the Paris 2024 Olympic and Paralympic Games, held during the peak of the Northern Hemisphere summer, heat risk management was a key concern for athletes and the public. The Olympic Games took place from 26 July to 11 August 2024, followed by the Paralympic Games from 28 August to 8 September 2024. This event provided an excellent opportunity to test a probabilistic forecasting system designed for heat stress conditions. Before its implementation, a preliminary phase was conducted in collaboration between the organising committee and Météo-France forecasters to ensure that the product was designed and adapted to their specific needs. These discussions helped define key forecasting requirements, including relevant thresholds, forecast timescales, and optimal strategies for communicating probabilistic information.
3.1.3 Forecasting systems and data used
Given the high organisational standards of such international events, it was essential to anticipate situations where heat stress thresholds might be exceeded, considering both their geographical and temporal distribution. To meet these requirements, the probabilistic forecasting approach leverages data from ECMWF-EPS (CY48R1 cycle ECMWF, 2023) for its ability to provide long-range forecasts, combined with the high-resolution Météo-France AROME-EPS (Raynaud and Bouttier, 2017). The ECMWF-EPS operates four times a day and delivers forecasts up to 15 d ahead. It is a 51-member ensemble with a horizontal resolution of around 9 km. The AROME-EPS consists of 16 members and incorporates lateral boundary perturbations from the global ARPEGE global EPS (Descamps et al., 2015). Running four times daily, it provides hourly forecasts up to 51 h ahead, with a horizontal resolution of approximately 1.3 km.
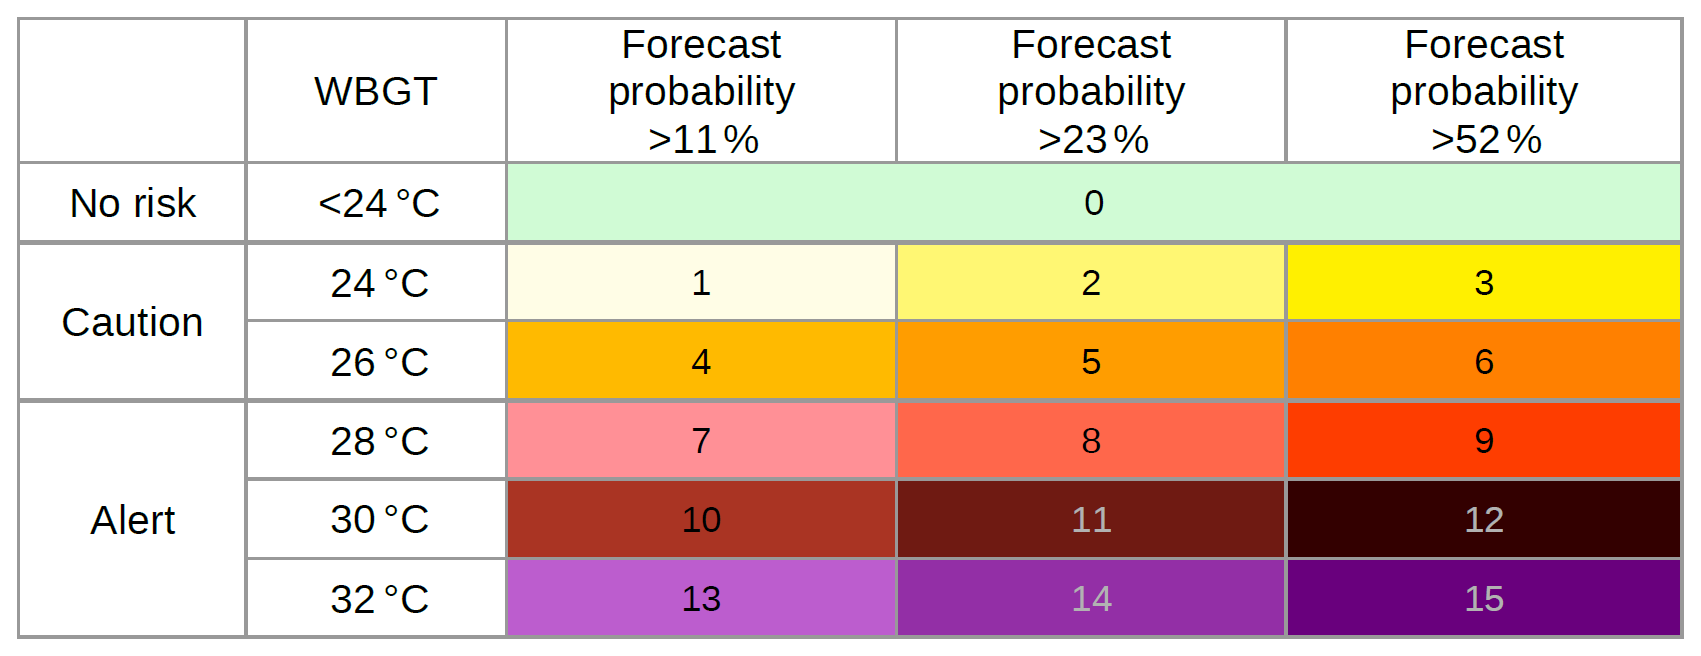
Figure 1Risk matrix for heat stress based on WBGT thresholds and probability exceedance. The colour gradient highlights increasing heat stress, with higher WBGT values and exceedance probability leading to greater risk. The probability thresholds of 11 %, 23 %, and 52 % reflect the discrete nature of the ECMWF-EPS ensemble prediction system, which includes 51 members. These values correspond approximately to 6, 12, and 27 members predicting the event, respectively.
3.1.4 Risk matrix design and operational use
Following discussions with operational meteorologists supporting major sporting events and liaising with the Paris 2024 organizing committee, the risk matrix was selected as the most suitable probabilistic forecasting tool for this context. Severity thresholds are defined based on WBGT exceedances to establish a graduated risk scale that aligns with the operational needs of event organisers (Fig. 1). This structure aims to enable early identification of high-risk scenarios, even several days in advance, when low-probability but high-severity events may occur. The heat risk classification was structured into three levels: no risk (safe conditions), caution (heat stress could affect performance and requires hydration and monitoring) and alert (severe risks requiring strict mitigation and possible event rescheduling). The matrix addresses this structure of risk graduation, but users remain free to adapt their responses based on constraints, risk tolerance, and experience. This flexibility is essential in complex settings where the cost of false alarms or missed events depends on the activity. WBGT risks matrices were produced at 00:00 and 12:00 UTC with the ECMWF-EPS runs up to 14 d ahead, alongside 03:00, 09:00, 15:00, and 21:00 UTC with the AROME-EPS runs to provide short-range forecasts up to 2 d ahead. For each forecast lead time, risk maps covering the entire mainland France domain were generated, with a specific focus on the Paris region (Fig. 2b). Additionally, meteograms based on the predicted risk were produced for ten key locations (Fig. 2c, d), offering a time evolution of the heat stress risk localised at specific grid points corresponding to major sports venues. Probability maps were also available, showing the chance of WBGT thresholds being exceeded for users interested in specific probability levels.
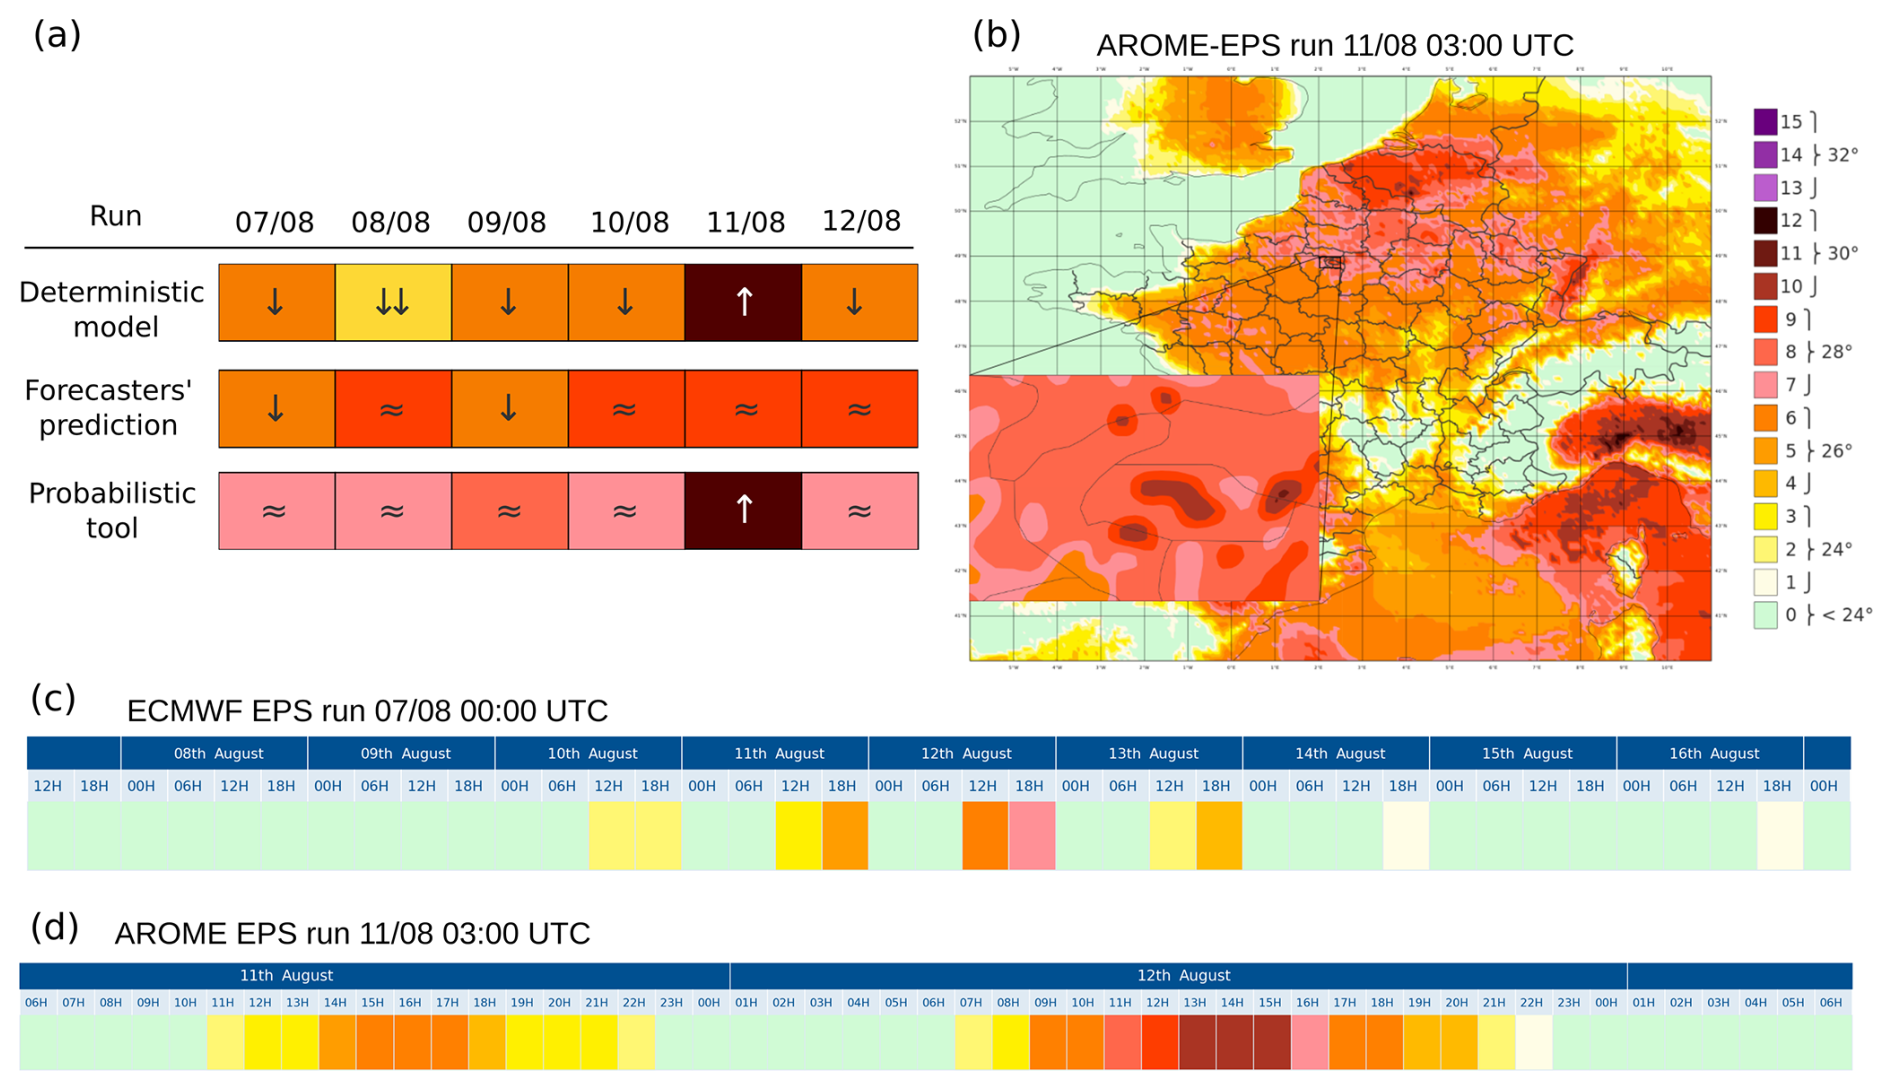
Figure 2(a) Forecasts of heat stress risk (WBGT) issued between 7 and 12 August 2024 for the same target date (12 August), based on three sources: deterministic model outputs, official forecasters' predictions, and the risk matrix tool. The ECMWF IFS and ECMWF-EPS were used for forecasts issued from 7 to 10 August, while AROME and AROME-EPS were used for forecasts from 11 and 12 August. Deterministic values from deterministic model and forecasters' prediction were converted into risk levels using the highest category defined in the risk matrix within the interval that includes the predicted WBGT value. Arrows indicate whether the forecast underestimated (↓), overestimated (↑), or correctly predicted (≈) the observed category, based on which interval of the risk matrix the observed WBGT fell into, independently of the probability thresholds. The double arrow () indicates that the forecast underestimated the observed value by two impact categories. (b) Risk level forecast for 12 August at 15:00 UTC using the AROME-EPS 11 August, 03:00 UTC run. A close-up on the Paris region highlights local risk variations. (c) Meteogram of risk levels forecast from the ECMWF-EPS 7 August, 00:00 UTC run for Paris, showing the expected evolution from 8 to 16 August. (d) Meteogram showing the hourly risk levels forecast for 12 August in Paris, based on the AROME-EPS 11 August, 03:00 UTC run, capturing the intraday variation of heat stress conditions. All forecast hours are expressed in local time.
3.1.5 Case studies analysis
Temporary WBGT stations were installed outdoors in selected Olympic venues to support operational monitoring. For the case study, we selected 12 August 2024, which was the hottest day of the year in Paris. Observations from this weather station network recorded WBGT values between 28 and 30 °C on 12 August. One station recorded a WBGT peak of 29.5 °C, indicating that the 30 °C threshold was almost reached. On that day, the risk matrix computed with AROME-EPS predicted the exceedance of the Alert threshold (WBGT >28 °C) across many regions in the afternoon (Fig. 2b). A close-up on the Paris area even indicated a likelihood of exceeding 30 °C WBGT in some locations. The meteograms derived from the ECMWF-EPS were also used by end-users to anticipate potential heat stress and maintain heightened vigilance in such a case. In the case study of the 12 August event, the meteogram (Fig. 2c) shows that the risk had been identified several days in advance, providing a valuable early warning for the organisers. The meteogram derived from AROME-EPS (Fig. 2d) was used to visualise the intra-day evolution of the forecast heat stress risk with hourly resolution, as the event approached. This detailed view complemented the medium-range forecast by providing short-range guidance for a day that had already been identified as high-risk in the ECMWF-EPS.
Figure 2a presents a retrospective comparative analysis of the forecast quality for 12 August, up to 5 d in advance. To assess forecast behaviour according to lead time, we simulated a decision-making framework in which the ECMWF-IFS model was used up to 2 d before the target day (d−2), and AROME was used from d−2 onward. The same approach was applied to assess the heat stress risk based on probabilistic outcomes from ECMWF-EPS and AROME-EPS, respectively. For the official forecasts, we analysed the archive of meteorological bulletins issued by forecasters from d−5 to the target day. These bulletins included a deterministic estimate of the expected WBGT value for the target day, which enabled a retrospective evaluation of the forecasters' predictions over the full lead time range. It is worth noting that the deterministic model consistently underestimated the WBGT-related heat stress risk, except for the forecast issued the day before the event. However, at such short lead times, this information would have offered limited time for operational adjustments. The official weather bulletins initially underestimated the severity of the event, before gradually adjusting their forecast to align with the intensity that was ultimately observed. A post-event discussion with forecasters indicated that, although the interface was made available to them in a demonstration format, they had not yet had sufficient time to become fully familiar with it. As a result, their assessments were primarily based on traditional meteorological model outputs. The probabilistic tool correctly anticipated the observed level of risk as early as 5 d before the event, with the forecast remaining stable throughout the period preceding the target day. This case study highlights the usefulness of the probabilistic tool in supporting decision-making, particularly for users such as event organisers who may not have advanced expertise in weather forecasting. By providing consistent early warnings, the tool helps to raise timely alerts and supports early planning. While it is not intended to replace expert meteorological judgement, it can serve as a valuable complement, supporting evidence-based decisions.
3.2 Frost risk management in Viticulture
3.2.1 Context
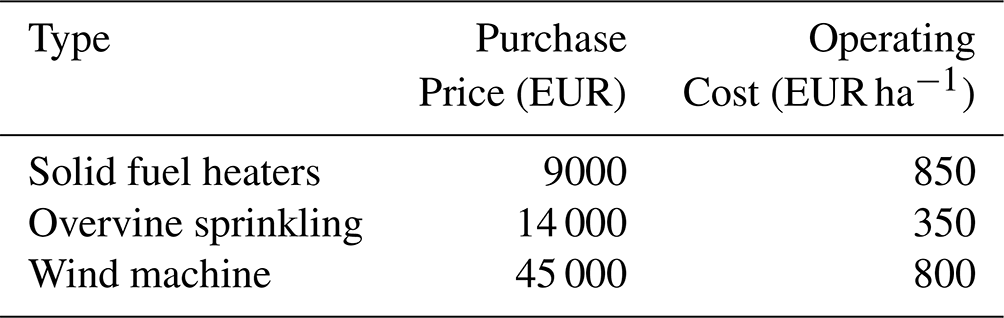
Spring frosts can have a significant impact on yields and vine growth (Poni et al., 2022). Recent events have shown that spring frosts can cause major economic losses (COM, 2021). Following a significant spring frost event in April 2017, wine production in France for that year dropped approximately 19 %, reaching 36.7 million hL, one of the lowest levels in decades (Organisation Internationale de la Vigne et du Vin (OIV), 2017). Various methods for protecting vineyards against frost are available (Poling, 2008). Table 1 provides a few examples of methods of protection and their estimated costs from a recent study (Hirschy et al., 2020). Some equipment, such as wind machines, requires a major upfront investment, while others, such as solid fuel heaters, need little advance planning.
Table 1Example of estimated costs depending on the methods used to protect vineyards against frost. From Hirschy et al. (2020).
3.2.2 End-user practices and perception
A 2022 survey of three major Bordeaux wine estates showed that most frost protection decisions are made within 24 h, usually to activate existing equipment. It found that users rarely use probabilistic forecasts in real time, relying instead on deterministic forecasts from public sources, i.e. a poor man's ensemble approach. On the day of action, observed temperature monitoring is considered the most reliable reference for triggering protection. While deterministic forecasts are simpler to interpret, they are less effective in anticipating low-probability, high-impact events such as late spring frost. From an economic standpoint, probabilistic forecasts offer added value, allowing for more precise risk estimation and improved efficiency of protection strategies considering the high costs involved. As shown in previous studies (e.g. Joslyn and LeClerc, 2012), incorporating the probability of occurrence into the risk-based decision-making process leads to more optimal outcomes. The wine estates consultation led to the conclusion that their lack of knowledge about probabilistic forecasting highlights a gap in communication and support. While they see its potential, they need guidance to use it effectively in daily decisions. Improving existing products and developing new ones should involve clients who trust the tools and are willing to collaborate.
3.2.3 Methodological framework for decision-support tool
Involving end-users early in the development of probabilistic forecasts can help them assess the economic impact of their decision to use or not use protective measures, especially through cost loss (C L) analysis. As discussed earlier, the cost-loss trade-off is an economic framework used to identify whether preventive action is financially preferable to risking potential losses from adverse events. This concept helps define the optimal probability threshold by comparing the expected cost of false alarms with the expected loss from missed events. Our frost risk prototype for viticulture uses a methodology similar to that for heatwaves, based on a risk matrix. However, we also introduce the possibility to optimise the probability thresholds in the matrix based on the economic value of forecasts. This optimisation requires a cost-loss model approach (Richardson, 2003). Ensemble forecasts lack reliability if they are not calibrated. For this reason, the forecast skill is incorporated into a decision framework to compute the probability threshold, as illustrated by Mylne (2002). This method requires two key elements: (i) the economic impact, including the cost of protection and potential losses without action; and (ii) a forecast archive to evaluate the model's predictive skill.
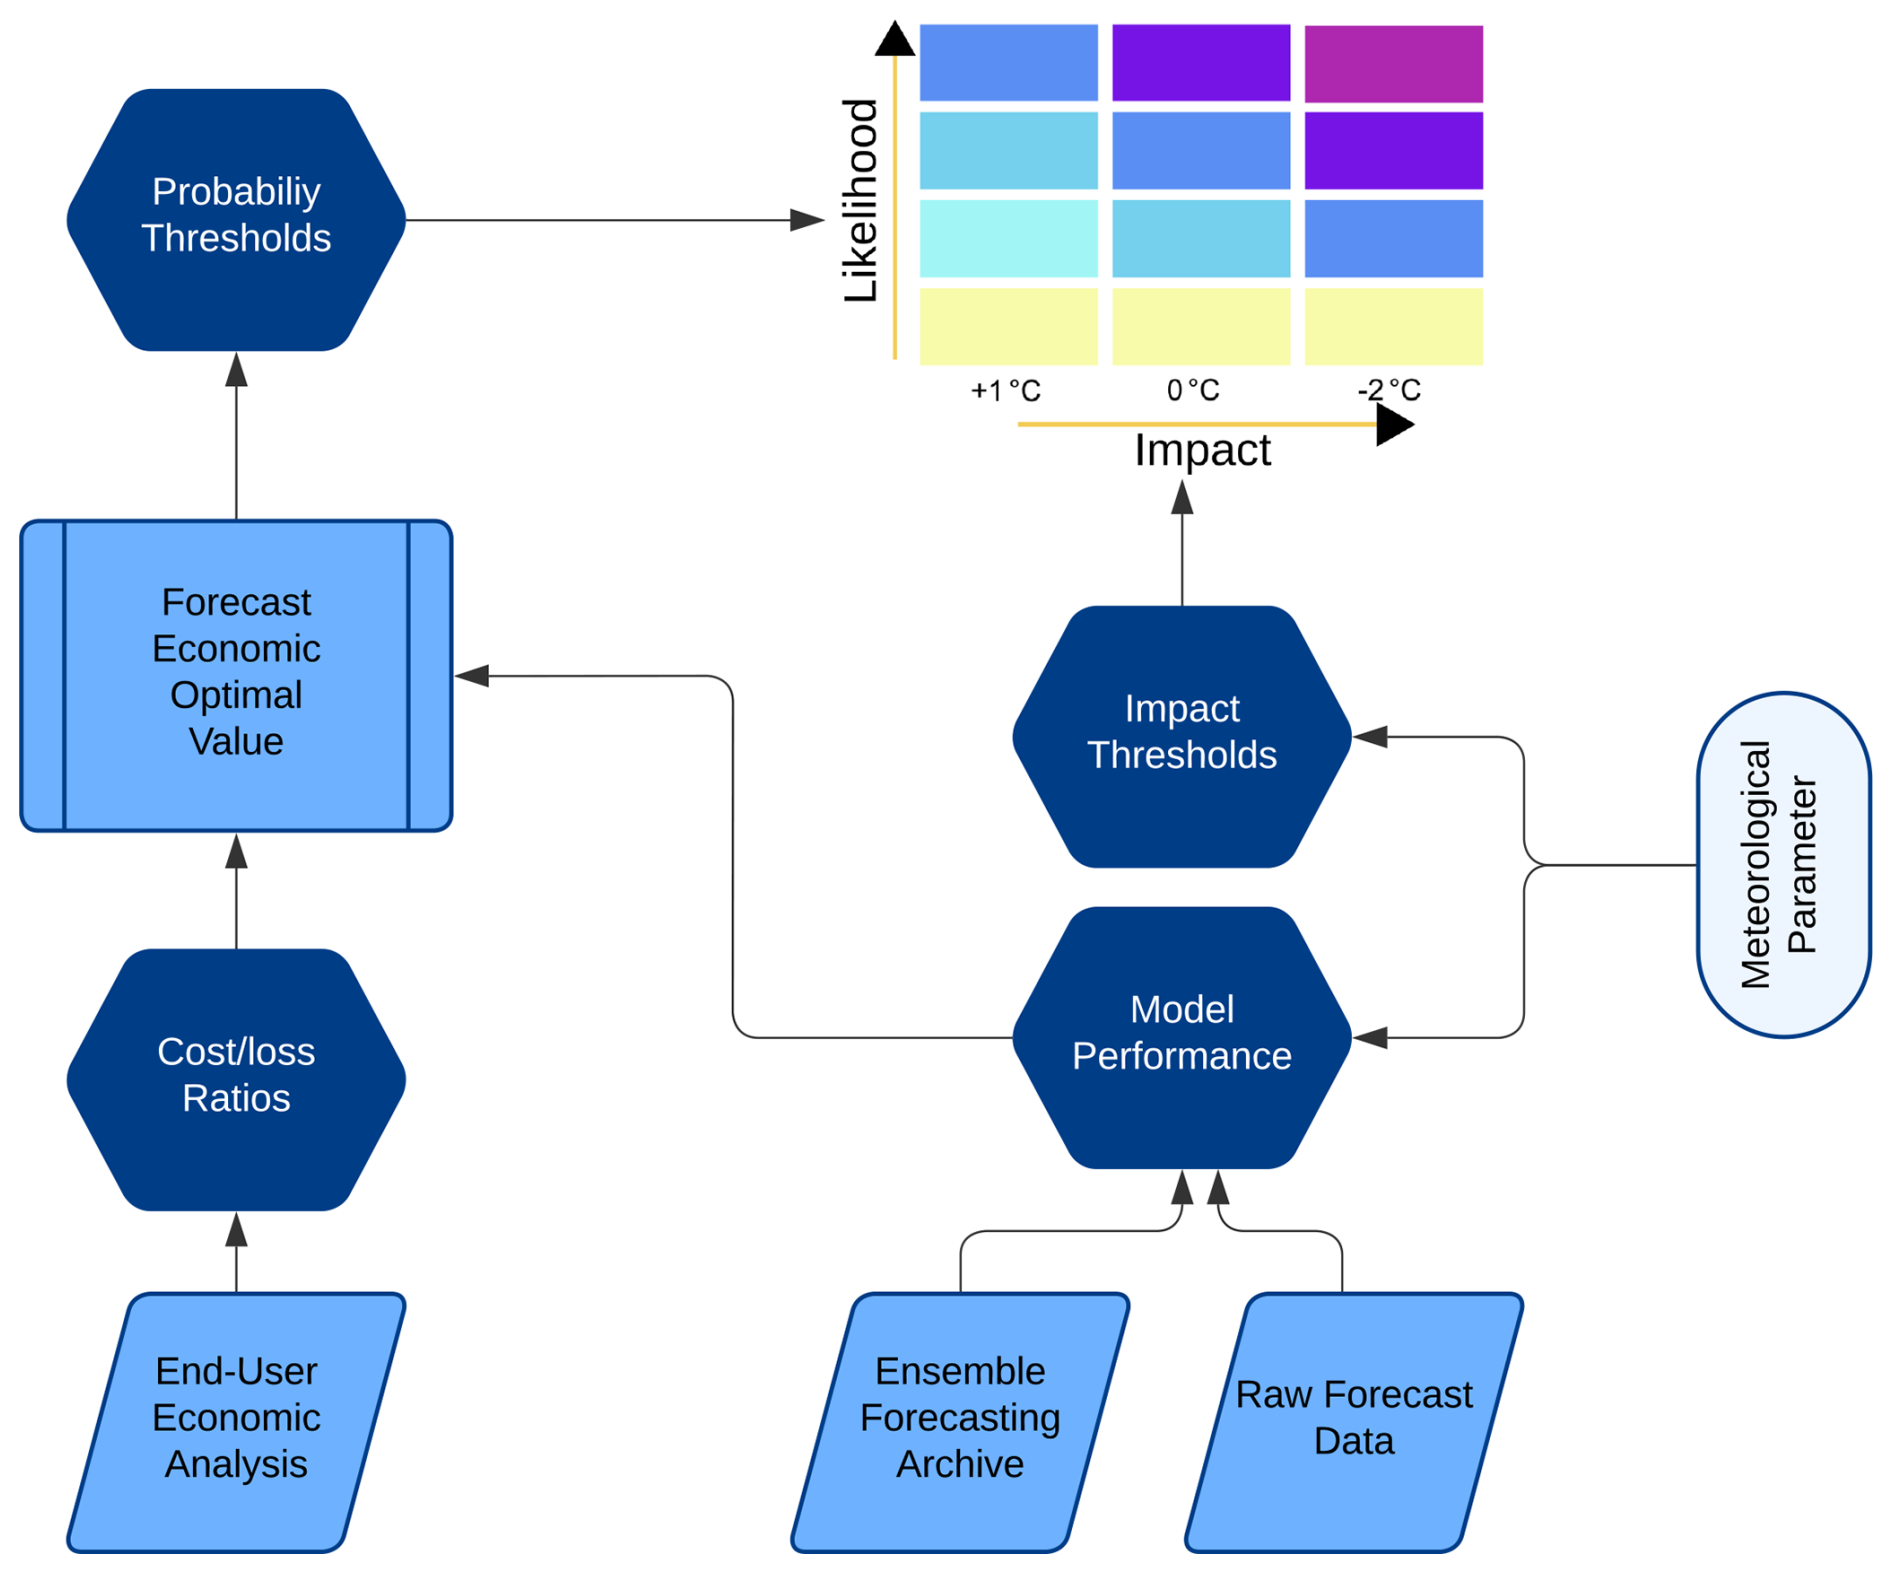
Figure 3This diagram illustrates the construction of a risk matrix for late frost events in vineyards, integrating ensemble forecasts, model calibration, and economic considerations. Impact thresholds define critical temperature levels for frost damage, which are used to establish the C L ratio. Archived ensemble forecasts assess model performance, ensuring that systematic biases are accounted for. If biases exist, the probability threshold for decision-making is adjusted, as it may not align with the theoretical C L ratio. The final risk matrix combines these calibrated probability thresholds with impact assessments to support optimised frost risk management.
The tool has been tested on two frost protection options: solid fuel heaters and overhead sprinkling systems. Only the results for the latter are presented here. The analysis focuses on the Bordeaux wine-growing area, specifically the Médoc appellation in the Gironde department. To incorporate economic loss, we consider the market value of annual vineyard production. We consider the annual gross revenue per hectare, serving as a proxy for the market value of vineyard production. In the Bordeaux region, this production value can vary greatly depending on the estate and the wine classification. Following discussions with stakeholders, we adopted a reference value of EUR 50 000 ha−1, which reflects an approximate average gross revenue for high-end vineyards in the Médoc appellation. This estimate is consistent with typical yields of 6000 bottles per hectare and average sale prices ranging from EUR 8 to 12 per bottle. This user profile corresponds to a producer situated between a large cooperative and a high-end grand cru estate. This assumption allowed us to focus on how probability thresholds affect decisions, without adding complexity from different user profiles. A more comprehensive analysis of the sensitivity of this framework to different user profiles could provide further insights, but it is beyond the scope of the present study. Based on expert consultation with an agricultural engineer, the following loss thresholds were adopted: 5 %, 10 %, and 30 % reduction in the value of vineyard production is assumed to occur at temperatures of 1, 0, and −2 °C, respectively. These temperature values were chosen as impact thresholds for the construction of the risk matrix. If a protection action is triggered, the associated costs, which are summarised in Table 1, are applied, with the equipment purchase amortised over a 20-year period.
3.2.4 Forecasting system and data used
The historical model dataset used for this study is provided by ARPEGE global EPS (Descamps et al., 2015). This 35-member EPS computes forecasts four times a day, providing outputs every 3 h up to 108 h lead time. The 2 m air temperature (T2m) is post-processed, as described in Taillardat and Mestre (2020). The minimum temperature likely to occur between d−1 18:00 UTC and d 18:00 UTC is derived from this dataset and interpolated over the kilometric AROME grid covering Western Europe (EURW1S100). A key benefit of this approach is that local effects are given greater consideration, a crucial aspect when dealing with phenomena that are highly localised, such as frost. The T2m forecast parameter was selected for each lead time up to 4 d ahead. The overall data span five years from 1 March 2019 to 31 May 2023, and cover three-month periods (March, April and May). A specific geographical area encompassing the Bordeaux wine-growing region was selected for the study, extending from 45.7 to 44.3° N and from −1.3° E to 0.8° W. The observation dataset was obtained from the Météo-France database, and it covers the same period as the forecast dataset. This dataset was supplied with data from 20 weather observation stations.
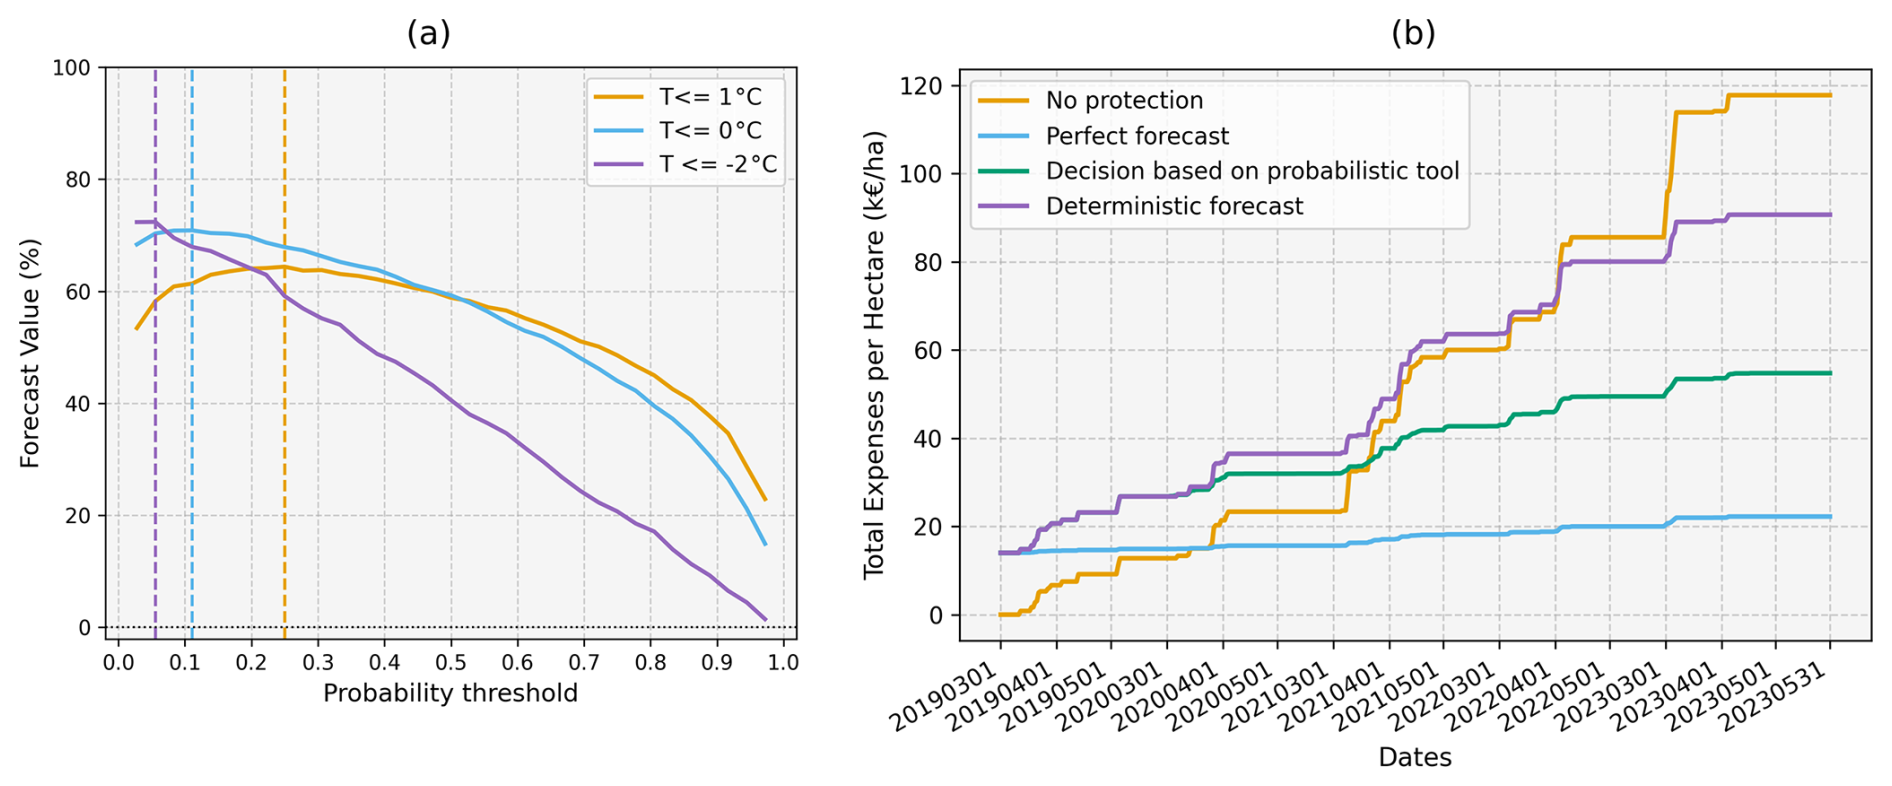
Figure 4(a) Relative forecast value, expressed as a percentage of the value of a perfect forecast, plotted against probability thresholds for three impact levels defined by T2m thresholds: 1 °C (orange), 0 °C (blue), and −2 °C (purple), for a 4 d lead time. Dashed lines indicate the probability thresholds that maximise the forecast value for each impact level. (b) Total expenses per hectare over the past five years, averaged over the 20-station domain, under four different protection strategies: no protection (orange), protection only when the event occurs (blue), protection triggered by a probabilistic forecast exceeding the decision threshold (green), and protection based on a deterministic forecast (purple). For clarity, the analysis shown is limited to the 0 °C impact threshold and its associated loss and probability threshold.
3.2.5 Risk matrix design and operational use
For each impact threshold, the corresponding probability threshold is determined by maximising the forecast value. This monetary value reflects the average savings gained by following the forecast instead of relying on climatology. The climatological expense corresponds to the cost incurred when protection measures are never implemented. In a context of rapid climate change, defining a stable reference climatology is increasingly difficult. A 5-year period (2019–2023) was tested, but proved too sensitive to interannual variability and the rarity of spring frost events. The 30-year reference (1994–2023) was therefore retained as a compromise to ensure robustness and operational interpretability. Following Mylne (2002), the forecast value is normalised with respect to a perfect forecast. The relative forecast value is calculated from a historical forecast dataset, taking into account the forecast lead time and the C L ratio specified by the user. Figure 4a presents the loss functions for the 4 d lead time. These probability thresholds are then used to build a risk matrix that reflects both forecast quality and the user's economic exposure for a given lead time. As a result, a different risk matrix can be built for each lead time. Preliminary tests (not shown) confirmed that, for lower-value contexts, such as cooperative vineyards, higher probability thresholds would be needed to justify the implementation of frost protection measures. Probability thresholds vary according to the impact thresholds selected. Consistently, the higher the impact, the higher the forecast value, and the lower the corresponding probability threshold. In this case, the relative forecast value is always positive, meaning the forecast provides greater benefit than climatology. As illustrated in Fig. 3, the design of the risk matrix follows a sequence of interconnected steps, some of which, such as C L analysis and impact estimation, require input data from the end-user. In the final matrix, the vertical axis represents the likelihood, based on the calibrated probability thresholds, while the horizontal axis represents the impact thresholds. The dashed lines in Fig. 4a indicate the three probability thresholds used to define the risk matrix for the forecast at day 4.
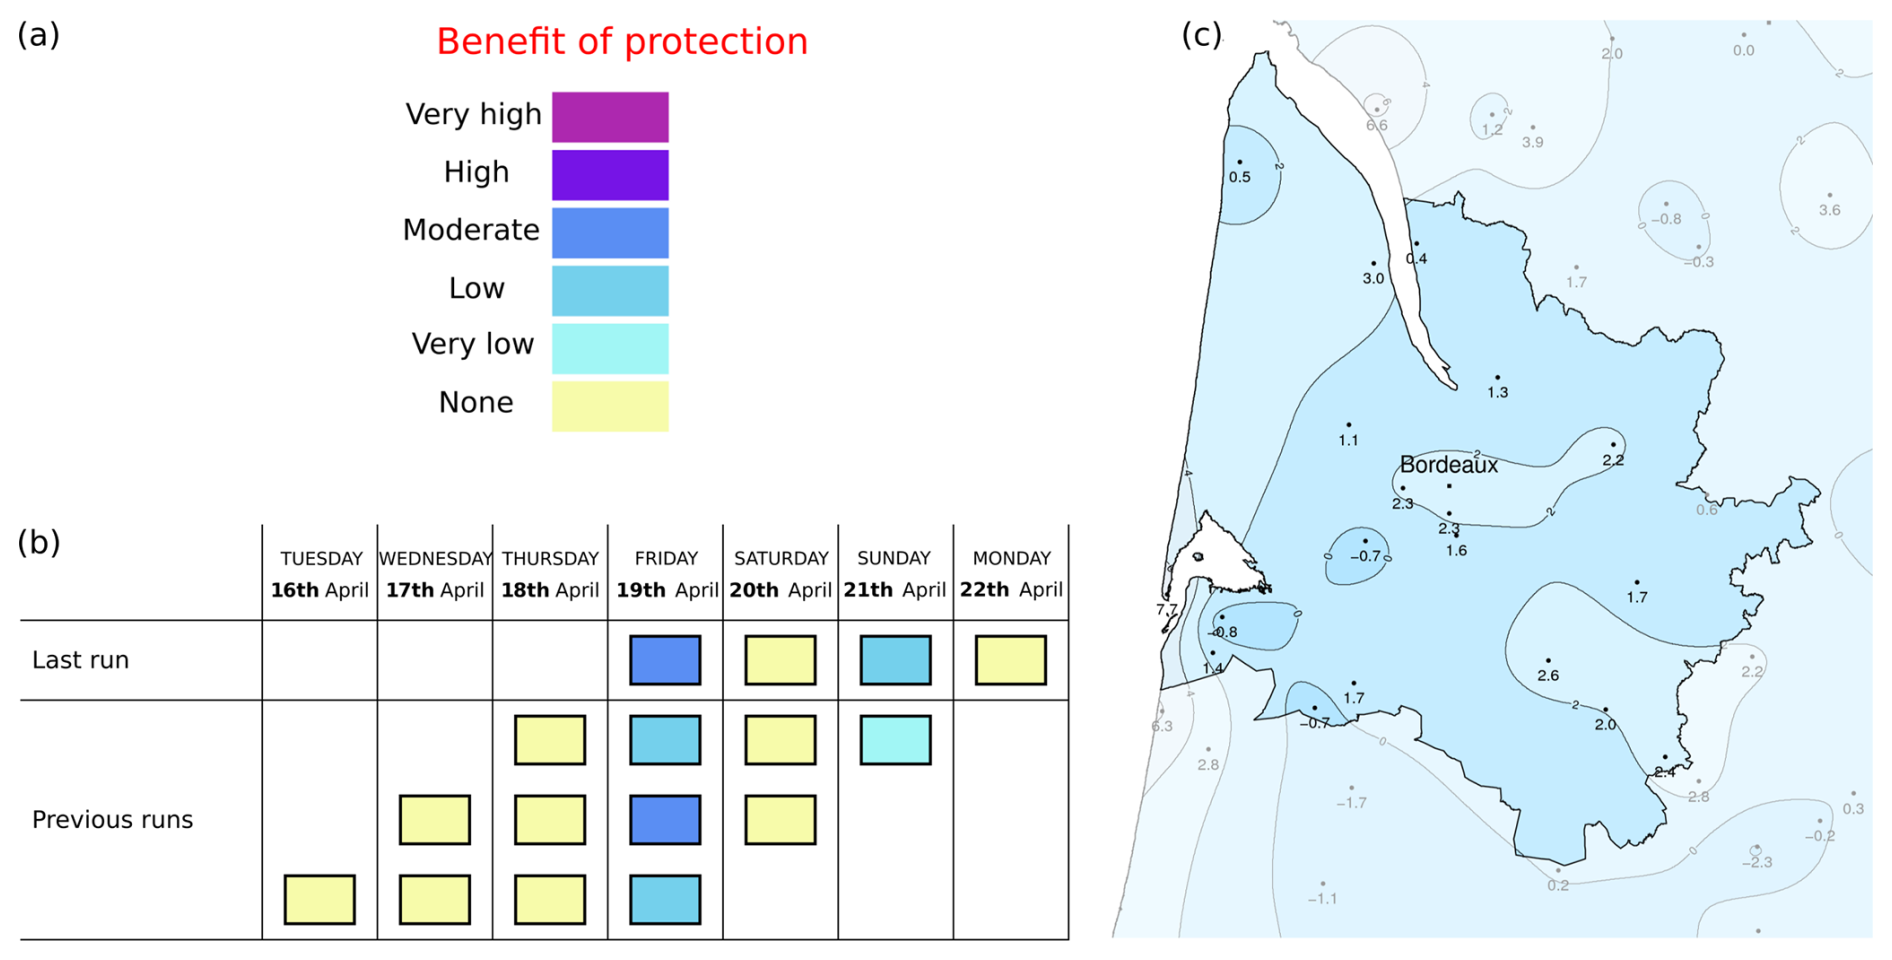
Figure 5(a) Risk levels of occurrence of frost. (b) Forecast of frost using the C L model approach. Method of protection is supposed to be overvine sprinkling. Forecast issued from the last run, as well as the three previous runs are shown. (c) T2m observed in Bordeaux region on 19 April 2024 using Météo-France weather station network (available at http://climascope.meteo.fr, last access: 18 July 2025, Météo-France, 2025).
3.2.6 Decision-Support tool evaluation
Total expenses per hectare over a five-year period can be computed using archived forecasts and a predefined C L framework (Fig. 4b). This evaluation is based on the 20 weather observation stations used in the cost–loss analysis, each representing a vineyard. The expenses shown in the figure correspond to cumulative total expenses per hectare over the five-year period, averaged across all stations. This approach illustrates the potential benefits of combining ensemble forecasts with decision-based loss functions. As expected, inaction leads to the highest cumulative expenses. While deterministic forecasts also result in elevated costs, particularly in the early years due to initial investments in protective equipment, probabilistic forecasts, when used with optimised decision thresholds, demonstrate substantial long-term savings. In this case study, the resulting expenses fall between those associated with a perfect forecast (unrealistic in practice) and a deterministic forecast. This method has the potential to improve user perception and trust in probabilistic products. However, it should be noted that the benefits of this approach emerge only over time; when events are infrequent, short-term advantages may not be immediately evident. Time horizons are perceived differently: a multi-year period may seem short in climatology but long for operational users like winegrowers. Although benefits may not appear immediately, regular use over time can greatly improve outcomes and resilience.
3.2.7 Case studies analysis
The probabilistic forecast diagnostic can be displayed as a list of coloured boxes (Fig. 5a), each corresponding to a level of benefit associated with activating frost protection. The colours are derived from the previously defined risk matrix (Fig. 3), where each cell reflects a combination of probability threshold and impact level. In this particular C L optimisation context, it was considered more relevant to communicate in terms of the expected benefit of taking action, rather than focusing on the abstract notion of risk. As discussed earlier in relation to the heat stress forecasting tool, the combination of probabilistic and impact-based thresholds does not yield a binary forecast, but rather a graded decision-support output. The aim is to provide end-users with clear and contextualised information, rather than a prescribed action/no-action decision. In the case of frost, it is well recognised that multiple parameters influence local vulnerability in vineyards, such as soil moisture, topography, or vegetation phenology, which are not fully integrated into this tool. The tool uses a six-level benefit scale, allowing users to adjust their risk tolerance based on experience and local conditions. To use this flexibility effectively, users would need to be familiar with the tool to interpret and adapt the information. Figure 5b shows how forecasts are displayed: the top row corresponds to the latest available forecast run, while previous runs are also shown to trace the evolution of the forecast across lead times. This retrospective view helps highlight whether the forecast has been consistent or volatile over time. For instance, the system successfully predicted a light frost event on 19 April 2024, up to 4 d in advance. The observed temperature field in Bordeaux region is shown in Fig. 5c. Forecasts remained stable across successive runs, reinforcing trust in the tool's reliability.
This study explored the development of customised probabilistic forecasting tools to guide operational choices for weather-dependent activities. Unlike general public forecasts, professional applications must reflect the economic stakes of the enterprise and fit within the users' decision-making processes. The two case studies presented, heat stress forecasting during the Paris 2024 Olympic and Paralympic Games, and late frost risk management in vineyards, clearly illustrate how ensemble forecasts can be transformed into structured risk information through the integration of impact thresholds, cost/loss reasoning, and calibrated probability levels.
Beyond the development of these illustrative prototypes, this work is part of a broader effort to assess the potential uses of ensemble forecasting products across diverse user profiles and sectors. Although this article presents only two examples, it is part of a broader exploration of operational use cases. A systematic review of user needs and decision contexts would better support the adaptation of ensemble products, especially considering risk perception and technical constraints such as resolution or aggregation.
The case studies highlighted key information design principles: the importance of simplicity, alignment with user-specific impacts, and the ability of users to adapt the level of risk according to their operational context and experience. Several limitations must be acknowledged. The case studies were based on hypothetical or retrospective applications, without real-time validation from users in operational settings. Additionally, the large and diverse pool of potential users makes it difficult to maintain close feedback loops. More broadly, the reluctance of some meteorological services to openly distribute ensemble forecasts remains a barrier to user familiarisation and adoption. Increased exposure to ensemble-based products across user groups would promote greater trust and help demystify probabilistic information.
Another structural limitation lies in the fact that both economic evaluations and the definition of probability thresholds are highly context-dependent. They vary depending on users' risk tolerance, operational constraints, and financial exposure. In the agricultural case, for example, potential losses could vary from one year to the next depending on the phenological stage of the crop at the time of the event. Generalising such approaches is, therefore, complex. One option would be to define standardised average profiles with representative C L ratios. However, a more flexible and user-centred alternative would be to develop an interactive platform, allowing users to input their own parameters, such as loss values, levels of risk at which action is triggered, or operational thresholds, and dynamically derive appropriate decision thresholds. In sectors like public safety or critical infrastructure, the loss may be extremely high or even unbounded, as failure is not acceptable. In such cases, users may choose to act based on very low probability levels, reinforcing the need for tools enabling cautious and adaptive decision-making.
To support broader adoption and accurate interpretation of probabilistic forecast products, it is also essential to provide users with clear and accessible documentation. The development of technical factsheets, explaining how the forecast is constructed, what the predicted event represents, and how the risk is framed can help reduce the need for direct input from forecasters while enhancing user understanding. As highlighted by the systematic review of Ripberger et al. (2022), while users often interpret probabilities correctly, confusion frequently arises from ambiguity about what the forecasted event actually refers to. This underlines the need for intuitive and transparent communication of definitions of events and associated risk.
Finally, the effective integration of probabilistic forecasts into practice will depend on strong coordination between those who design the tools and those who deliver them to users. Without this dialogue, even well-designed products may fail to reach their full potential. Advancing the role of ensemble forecasting in decision-making thus requires not only technical improvements, but also a commitment to user-centred development, transparent communication, and iterative feedback.
The code used in this study is internal to Météo-France and not publicly available. The datasets are based on publicly available sources and can be provided by the authors upon request.
MP led the development of the prototypes, performed all tests, created the main figures, and wrote the first draft of the manuscript. MP also conducted a synthesis of previous works on ensemble forecast applications, which forms the basis of this article. The overall structure and scientific framing of the article were jointly developed by MP, BJ, and IB, based on collective discussions within the project. ER and GF contributed to the development of the heat stress risk prototype, the creation of related figures, and the writing of the section describing the thermal stress index. All authors reviewed and commented on the manuscript.
The contact author has declared that none of the authors has any competing interests.
All scientific content, ideas, and analyses are the authors' own.
Publisher's note: Copernicus Publications remains neutral with regard to jurisdictional claims made in the text, published maps, institutional affiliations, or any other geographical representation in this paper. While Copernicus Publications makes every effort to include appropriate place names, the final responsibility lies with the authors.
This article is part of the special issue “EMS Annual Meeting: European Conference for Applied Meteorology and Climatology 2024”. It is a result of the EMS Annual Meeting 2024, Barcelona, Spain, 2–6 September 2024. The corresponding presentation was part of session ES2.2: Communicating science and dealing with Uncertainties.
This work was carried out as part of the mission to enhance the use and dissemination of ensemble forecasting within the Department of Meteorological Services at Météo-France. The authors would like to thank Eleanor Breton (research collaboration between the Conservatoire National des Arts et Métiers and the Centre d'Études de l'Emploi et du Travail, 2019–2022), Morgane Pujol (Laboratory for Cognitive Psychology, Centre for Language, Language and Ergonomics, University of Toulouse Jean Jaurès, 2021-2022), Théo Bannier (final-year engineering internship, National School for Meteorology, 2022), and Oihana Fermond (final-year engineering internship, National School for Meteorology, 2023) for their respective contributions to analysing client perspectives on probabilistic forecasting and identifying barriers to the use and communication of ensemble products, as well as for their work on risk matrix development in the context of late frost in vineyards. Finally, we thank all those involved in the interviews conducted in 2022–2023, particularly forecasters, market coordinators, and marketing professionals at Météo-France, for their valuable insights and participation. The author acknowledges the use of generative AI tools to assist with the English writing and editing of this manuscript. These tools were used solely to improve language clarity and fluency.
This paper was edited by Gerald Fleming and reviewed by two anonymous referees.
ACGIH: Threshold limit values for chemical substances and physical agents and biological exposure indices, American Conference of Governmental Industrial Hygienists, Cincinnati, OH, USA, 1995. a
Bergeron, M. F., Bahr, R., Bärtsch, P., Bourdon, L., Calbet, J. A. L., Carlsen, K. H., Castagna, O., González-Alonso, J., Lundby, C., Maughan, R. J., Millet, G., Mountjoy, M., Racinais, S., Rasmussen, P., Subudhi, A. W., Young, A. J., Soligard, T., and Engebretsen, L.: International Olympic Committee consensus statement on thermoregulatory and altitude challenges for high-level athletes, Brit. J. Sports Med., 46, 770–779, 2012. a
Blazejczyk, K., Epstein, Y., Jendritzky, G., Staiger, H., and Tinz, B.: Comparison of UTCI to selected thermal indices, Int. J. Biometeorol., 56, 515–535, 2012. a
Bowler, N. E., Arribas, A., Mylne, K. R., Robertson, K. B., and Beare, S. E.: The MOGREPS short-range ensemble prediction system, Q. J. Roy. Meteor. Soc., 134, 703–722, 2008. a
Bramwell, R., West, H., and Salmon, P.: Health professionals' and service users' interpretation of screening test results: experimental study, Bmj, 333, 284, https://doi.org/10.1136/bmj.38884.663102.AE, 2006. a
Breton, É.: Les usagers professionnels des prévisions météorologiques probabilistes: des rapports à l'incertitude variés, La Météorologie, 2023, 32–38, 2023. a, b
Brotherhood, J. R.: Heat stress and strain in exercise and sport, J. Sci. Med. Sport, 11, 6–19, 2008. a
BS EN ISO 7243: Ergonomics of the Thermal Environment – Assessment of Heat Stress Using the WBGT (Wet Bulb Globe Temperature) Index (ISO 7243:2017), International Organization for Standardization, Geneva, Switzerland, 2017. a
Budd, G. M.: Wet-bulb globe temperature (WBGT) – its history and its limitations, J. Sci. Med. Sport, 11, 20–32, 2008. a
Buizza, R. and Hollingsworth, A.: Storm prediction over Europe using the ECMWF ensemble prediction system, Meteorol. Appl., 9, 289–305, 2002. a
COM: EU Adaptation Strategy, https://climate.ec.europa.eu/eu-action/adaptation-climate-change/eu-adaptation-strategy_en (last access: 24 March 2025), 2021. a
Dale, M., Wicks, J., Mylne, K., Pappenberger, F., Laeger, S., and Taylor, S.: Probabilistic flood forecasting and decision-making: an innovative risk-based approach, Nat. Hazards, 70, 159–172, 2014. a
Demeritt, D., Stephens, E. M., Créton-Cazanave, L., Lutoff, C., Ruin, I., and Nobert, S.: Communicating and Using Ensemble Flood Forecasts in Flood Incident Management: Lessons from Social Science, in: Handbook of Hydrometeorological Ensemble Forecasting, edited by: Duan, Q., Pappenberger, F., Thielen, J., Wood, A., Cloke, H., and Schaake, J., Springer, Berlin, Heidelberg, https://doi.org/10.1007/978-3-642-40457-3_44-1, 2016. a
Descamps, L., Labadie, C., Joly, A., Bazile, E., Arbogast, P., and Cébron, P.: PEARP, the Météo-France short-range ensemble prediction system, Q. J. Roy. Meteor. Soc., 141, 1671–1685, 2015. a, b, c
Dieckmann, N. F., Johnson, B. B., Gregory, R., Mayorga, M., Han, P. K., and Slovic, P.: Public perceptions of expert disagreement: Bias and incompetence or a complex and random world?, Public Understanding of Science, 26, 325–338, 2017. a
Dimiceli, V. E., Piltz, S. F., and Amburn, S. A.: Estimation of black globe temperature for calculation of the wet bulb globe temperature index, in: Proceedings of the World Congress on Engineering and Computer Science 2011, Vol. II, p. WCECS 2011, 19–21 October 2011, San Francisco, US, 2011. a
Doksæter Sivle, A. and Kolstø, S. D.: Use of online weather information in everyday decision-making by laypeople and implications for communication of weather information, Meteorol. Appl., 23, 650–662, 2016. a
Durbach, I. N. and Stewart, T. J.: An experimental study of the effect of uncertainty representation on decision making, Eur. J. Oper. Res., 214, 380–392, 2011. a
Ebert, E. E.: Ability of a poor man's ensemble to predict the probability and distribution of precipitation, Mon. Weather Rev., 129, 2461–2480, 2001. a
ECMWF: IFS Documentation CY48R1 – Part V: Ensemble Prediction System, in: IFS Documentation CY48R1, IFS Documentation, ECMWF, https://doi.org/10.21957/e529074162, 2023. a
Fischhoff, B., Brewer, N. T., and Downs, J. S.: Communicating Risks and Benefits: An Evidence-Based User's Guide, Government Printing Office, Silver Spring, MA, 2012. a
Fundel, V. J., Fleischhut, N., Herzog, S. M., Göber, M., and Hagedorn, R.: Promoting the use of probabilistic weather forecasts through a dialogue between scientists, developers and end-users, Q. J. Roy. Meteor. Soc., 145, 210–231, 2019. a, b, c
Gigerenzer, G., Hertwig, R., Van Den Broek, E., Fasolo, B., and Katsikopoulos, K. V.: “A 30 % chance of rain tomorrow”: How does the public understand probabilistic weather forecasts?, Risk Analysis, 25, 623–629, 2005. a, b, c
Gneiting, T. and Raftery, A. E.: Weather forecasting with ensemble methods, Science, 310, 248–249, 2005. a
Gneiting, T., Raftery, A. E., Westveld III, A. H., and Goldman, T.: Calibrated probabilistic forecasting using ensemble model output statistics and minimum CRPS estimation, Mon. Weather Rev., 133, 1098–1118, 2005. a
Hamill, T. M., Whitaker, J. S., and Wei, X.: Ensemble reforecasting: Improving medium-range forecast skill using retrospective forecasts, Mon. Weather Rev., 132, 1434–1447, 2004. a
Hirschy, M., Badier, M., Bernos, L., Delanoue, G., Dufourcq, T., Fabian, T., Labeyrie, B., Limousin, T., and Gautier, J.: Gel et grêle en viticulture et arboriculture – Etat des lieux des dispositifs de protection contre les aléas climatiques, Technical report, ACTA – Association de Coordination Technique Agricole, 2020. a, b
Hohle, S. M. and Teigen, K. H.: Forecasting forecasts: The trend effect, Judgment and Decision making, 10, 416–428, 2015. a
Johansson, E., Thorsson, S., Emmanuel, R., and Krüger, E.: Instruments and methods in outdoor thermal comfort studies – The need for standardization, Urban climate, 10, 346–366, 2014. a
Joslyn, S. and Savelli, S.: Communicating forecast uncertainty: Public perception of weather forecast uncertainty, Meteorol. Appl., 17, 180–195, 2010. a, b
Joslyn, S. L. and LeClerc, J. E.: Uncertainty forecasts improve weather-related decisions and attenuate the effects of forecast error, J. Exp. Psychol.-Applied, 18, 126, https://doi.org/10.1037/a0025185, 2012. a
Juanchich, M. and Sirota, M.: How to improve people's interpretation of probabilities of precipitation, J. Risk Res., 19, 388–404, 2016. a
Kim, H. H.: Urban heat island, Int. J. Remote Sens., 13, 2319–2336, 1992. a
Kim, I.-G., Kim, J.-Y., Kim, B.-J., and Lee, K.-K.: The collective value of weather probabilistic forecasts according to public threshold distribution patterns, Meteorol. Appl., 21, 795–802, https://doi.org/10.1002/met.1424, 2014. a
LeClerc, J. and Joslyn, S.: The cry wolf effect and weather-related decision making, Risk Anal., 35, 385–395, 2015. a
Leutbecher, M. and Palmer, T. N.: Ensemble forecasting, J. Comput. Phys., 227, 3515–3539, 2008. a
Markowski, A. S. and Mannan, M. S.: Fuzzy risk matrix, J. Hazard. Mater., 159, 152–157, 2008. a
Matos, M. A. and Bessa, R. J.: Setting the operating reserve using probabilistic wind power forecasts, IEEE T. Power Syst., 26, 594–603, 2010. a
Molteni, F., Buizza, R., Palmer, T. N., and Petroliagis, T.: The ECMWF ensemble prediction system: Methodology and validation, Q. J. Roy. Meteor. Soc., 122, 73–119, 1996. a
Morss, R. E., Demuth, J. L., and Lazo, J. K.: Communicating uncertainty in weather forecasts: A survey of the US public, Weather Forecast., 23, 974–991, 2008. a
Morss, R. E., Lazo, J. K., and Demuth, J. L.: Examining the use of weather forecasts in decision scenarios: Results from a US survey with implications for uncertainty communication, Meteorol. Appl., 17, 149–162, 2010. a, b
Mountjoy, M., Alonso, J.-M., Bergeron, M. F., Dvorak, J., Miller, S., Migliorini, S., and Singh, D.: Hyperthermic-related challenges in aquatics, athletics, football, tennis and triathlon, Brit. J. Sports Med., 46, 800–804, 2012. a
Murphy, A. H.: The value of climatological, categorical and probabilistic forecasts in the cost-loss ratio situation, Mon. Weather Rev., 105, 803–816, 1977. a
Mylne, K., Walters, D., Roberts, N., Barciela, R., Gray, M., Petch, J., Wells, O., Sachon, P., Skea, A., Davies, P., Willington, S., and Titley, H.: Ensemble Classes of Use Cases, EMS Annual Meeting 2024, Barcelona, Spain, 1–6 September 2024, EMS2024-143, https://doi.org/10.5194/ems2024-143, 2024. a
Mylne, K. R.: Decision-making from probability forecasts based on forecast value, Meteorol. Appl., 9, 307–315, 2002. a, b
Neal, R. A., Boyle, P., Grahame, N., Mylne, K., and Sharpe, M.: Ensemble based first guess support towards a risk-based severe weather warning service, Meteorol. Appl., 21, 563–577, 2014. a, b
Organisation Internationale de la Vigne et du Vin (OIV): Global wine production in 2017 estimated at 246.7 Mhl, down 8.2 % compared to 2016, https://www.oiv.int/public/medias/5683/fr-communiqu-depresse-octobre-2017.pdf (last access: 18 July 2025), 2017. a
Palmer, T.: The ECMWF ensemble prediction system: Looking back (more than) 25 years and projecting forward 25 years, Q. J. Roy. Meteor. Soc., 145, 12–24, 2019. a
Palmer, T., Molteni, F., Mureau, R., Buizza, R., Chapelet, P., and Tribbia, J.: Ensemble prediction, in: Proc. ECMWF Seminar on Validation of models over Europe, vol. 1, 21–66, European Centre for Medium-Range Weather Forecasts Reading, United Kingdom, 1993. a
Palmer, T. N.: The economic value of ensemble forecasts as a tool for risk assessment: From days to decades, Q. J. Roy. Meteor. Soc., 128, 747–774, 2002. a, b, c
Parsons, K.: Human thermal environments: the effects of hot, moderate, and cold environments on human health, comfort and performance, CRC press, 2nd Edn., Imprint CRC Press, London, 560 pp., https://doi.org/10.1201/9781420025248, 2007. a
Pinson, P., Chevallier, C., and Kariniotakis, G. N.: Trading wind generation from short-term probabilistic forecasts of wind power, IEEE T. Power Syst., 22, 1148–1156, 2007. a
Poling, E. B.: Spring cold injury to winegrapes and protection strategies and methods, HortScience, 43, 1652–1662, 2008. a
Poni, S., Sabbatini, P., and Palliotti, A.: Facing spring frost damage in grapevine: recent developments and the role of delayed winter pruning–a review, Am. J. Enol. Viticult., 73, 211–226, 2022. a
Prata, A. T., Dacre, H. F., Irvine, E. A., Mathieu, E., Shine, K. P., and Clarkson, R. J.: Calculating and communicating ensemble-based volcanic ash dosage and concentration risk for aviation, Meteorol. Appl., 26, 253–266, 2019. a
Raftery, A. E.: Use and communication of probabilistic forecasts, Statistical Analysis and Data Mining: The ASA Data Science Journal, 9, 397–410, 2016. a
Raynaud, L. and Bouttier, F.: The impact of horizontal resolution and ensemble size for convective-scale probabilistic forecasts, Q. J. Roy. Meteor. Soc., 143, 3037–3047, 2017. a
Richardson, D.: Predictability and economic value., in: Seminar on Predictability of weather and climate, 9–13 September 2002, 321–332, ECMWF, Shinfield Park, Reading, 2003. a
Richardson, D. S.: Skill and relative economic value of the ECMWF ensemble prediction system, Q. J. Roy. Meteor. Soc., 126, 649–667, 2000. a
Ripberger, J., Bell, A., Fox, A., Forney, A., Livingston, W., Gaddie, C., Silva, C., and Jenkins-Smith, H.: Communicating probability information in weather forecasts: Findings and recommendations from a living systematic review of the research literature, Weather, Climate, and Society, 14, 481–498, 2022. a, b
Roulston, M. S., Kaplan, D. T., Hardenberg, J., and Smith, L. A.: Using medium-range weather forcasts to improve the value of wind energy production, Renew. Energ., 28, 585–602, 2003. a, b
Sawka, M. N., Burke, L. M., Eichner, E. R., Maughan, R. J., Montain, S. J., and Stachenfeld, N. S.: American College of Sports Medicine position stand. Exercise and fluid replacement, Med. Sci. Sport. Exer., 39, 377–390, 2007. a
Steele, E., Brown, H., Bunney, C., Gill, P., Mylne, K., Saulter, A., Standen, J., Blair, L., Cruickshank, S., and Gulbrandsen, M.: Using metocean forecast verification information to effectively enhance operational decision-making, in: Offshore Technology Conference, 16–19 August 2021, Virtual and Houston, Texas, 2021. a
Stephens, E. M., Spiegelhalter, D. J., Mylne, K., and Harrison, M.: The Met Office Weather Game: investigating how different methods for presenting probabilistic weather forecasts influence decision-making, Geosci. Commun., 2, 101–116, https://doi.org/10.5194/gc-2-101-2019, 2019. a
Taillardat, M. and Mestre, O.: From research to applications – examples of operational ensemble post-processing in France using machine learning, Nonlin. Processes Geophys., 27, 329–347, https://doi.org/10.5194/npg-27-329-2020, 2020. a
Toth, Z. and Kalnay, E.: Ensemble forecasting at NMC: The generation of perturbations, B. Am. Meteorol. Soc., 74, 2317–2330, 1993. a
Windschitl, P. D. and Weber, E. U.: The interpretation of “likely” depends on the context, but “70 %” is 70 % – right? The influence of associative processes on perceived certainty, J. Exp. Psychol.: Learning, Memory, and Cognition, 25, 1514, https://doi.org/10.1037/0278-7393.25.6.1514, 1999. a
Yaglou, C. P. and Minaed, D.: Control of Heat Casualties at Military Training Centers, Arch. Indust. Health, 16, 302–16, 1957. a
Young, A., Bhattacharya, B., and Zevenbergen, C.: A rainfall threshold-based approach to early warnings in urban data-scarce regions: A case study of pluvial flooding in Alexandria, Egypt, J. Flood Risk Manage., 14, e12702, https://doi.org/10.1111/jfr3.12702, 2021. a, b
Zhou, Z., Botterud, A., Wang, J., Bessa, R. J., Keko, H., Sumaili, J., and Miranda, V.: Application of probabilistic wind power forecasting in electricity markets, Wind Energy, 16, 321–338, 2013. a
Zhu, Y., Toth, Z., Wobus, R., Richardson, D., and Mylne, K.: The economic value of ensemble-based weather forecasts, B. Am. Meteorol. Soc., 83, 73–84, 2002. a
- Abstract
- Introduction
- Preliminary study: End-user perception of probabilistic forecasts at Météo-France
- End-user applications: prototypes and case studies
- Conclusions
- Code and data availability
- Author contributions
- Competing interests
- Disclaimer
- Special issue statement
- Acknowledgements
- Review statement
- References