 | 08 Sep 2025
Wind and solar PV generation ramping events from farm to national level: the case of Ireland
Aina Maimó Far
Conor Sweeney
Damian Flynn
Renewable energy sources (RES), such as wind and solar photovoltaic (PV), account for a significant share of today's power systems. This share is set to grow significantly in the near future, due to ambitious emission reduction targets in many countries. A significant proportion of energy generation in the future, therefore, will be dependent on weather conditions, which can potentially change significantly over short time horizons. These changes in renewable generation will need to be managed by power system operators, who will need to ensure sufficient ramping capacity to maintain grid stability, particularly if an increase/decrease in renewable generation is coincident with a decrease/increase in electrical demand.
RES ramps are defined as changes in generation, taking place over a number of hours, that exceed a given threshold. RES-induced ramps are generally caused by changes in weather, which can result in fairly rapid and large changes in electricity generation, particularly as weather fronts sweep across a country with the associated winds and cloud coverage. Other events linked to large ramps are solar eclipses for PV (which are rare and predictable) and high-wind periods that can lead to wind farm shutdowns. In this work, ramping events over Ireland are explored at national scale, with insights at the farm scale for onshore wind.
First, models driven by ERA5 reanalysis data are used to generate hourly, farm-level wind and PV data from 1940 to 2023, and their error when representing national ramps in recent years is quantified. This model is then used for temporal analysis of national RES ramping events, allowing us to capture a broader range of extremes and return periods, and better understand the seasonality and temporal cycles linked to ramps. This is done under three different energy scenarios representative of the Irish reality at different stages of its energy transition: an onshore wind-only scenario, a scenario with some PV added to the onshore wind, and a scenario with a more balanced proportion of onshore wind and PV with the addition of offshore wind farms. Finally, we extend our analysis to wind farm ramps, quantifying the error of our model at reproducing farm ramps and exploring the spatial patterns that govern RES ramping in Ireland.
- Article
(972 KB) - Full-text XML
- BibTeX
- EndNote


Renewable energy sources (RES) present a large contribution to an increasing number of energy systems worldwide, especially dominated by the rising share of wind and solar photovoltaic (PV) technologies (IEA, 2024). This change is leading to power systems becoming more dependent on local weather conditions. The inherent variability of the driving weather is posing additional challenges to power system operators, who need to guarantee supply, regardless of the weather conditions. In this context, ensuring that the system has sufficient available flexibility to manage variations in renewable generation or electrical demand becomes crucial.
Ramping events are defined as changes in the production of RES. The main parameters used for the characterisation of ramps are magnitude, duration, ramp rate (magnitude/duration), timing, and direction (Gallego-Castillo et al., 2015). Although the presence of national ramps has decreased due to the geographical distribution of RES, it is set to increase with the presence of very large farms, especially for offshore wind technology (Drew et al., 2017), and will also be influenced by the widespread introduction of PV.
In Ireland, onshore wind is the dominant renewable energy source, but PV is starting to play a role in the system, and there are plans to make both sources almost equally present (EirGrid and SONI, 2024). For wind, once an extensive geographical distribution of farms is in place such as in the case of Ireland, future expansions will make little difference to the climatological-scale frequency and magnitude of wind ramping events (Drew et al., 2015). Something similar happens for PV, where most ramps are quite specific in location and time. This leads to smoother responses from the combination of spatially diverse PV farm distributions at shorter time scales, but more similar and predictable behaviours between the different PV farms for longer ramp events (Raygani et al., 2015).
Previous studies have centred on conducting a climatological-scale study of national scale ramps (see Cannon et al., 2015, for a case study in the UK) or on ramps in a limited number of wind farms (Drew et al., 2017; Cheneka et al., 2023). The effects of combining PV and wind energy have been widely explored (López Prol et al., 2024; Pedruzzi et al., 2023), but to the authors' knowledge, there is no specific study on the impact on ramping behaviour. Additionally, even though the characteristics of ramps from different wind farms have been studied in some cases, only a few selected wind farms have been considered, or clustering has been applied (Cheneka et al., 2020; Drew et al., 2018).
In this work, we characterise the patterns followed by RES ramps in Ireland, focusing on three energy scenarios representative of different stages of the transition of the Irish energy system, and applicable to most Northern European countries. The first stage (from a few years ago) is represented by a system with onshore wind as the only RES, the second stage (the current one) incorporates a small share of solar PV generation, and the coming years are expected to bring a diversified mix of onshore and offshore wind, along with solar PV generation. National ramps are characterised by means of their magnitude, frequency, seasonality, and return periods. The spatial distribution of wind ramps is also explored. In the process, the error of ERA5-driven models at reproducing both national and farm ramps is quantified.
After introducing the data and methods in Sect. 2, we assess the error of ERA5-driven models at reproducing national ramps in Sect. 3. We then use these models to explore the climate-scale features of national ramps for the three considered scenarios in Sect. 4. Section 5 provides an assessment of the error of reanalysis-driven models at reproducing wind farm ramps, while showing their spatial patterns in Ireland. Finally, the main conclusions from this work are outlined in Sect. 6.
The atmospheric data source used to drive the simulations is the ERA5 reanalysis (Hersbach et al., 2020). National and farm availability data (availability, or available power, is picked over generation to focus on atmospheric-driven behaviours) are obtained from EirGrid, the Irish transmission system operator. National solar (since May 2023) and wind (since 2014) availability are publicly available at a temporal resolution of 15 min (EirGrid, 2024), which we resample to hourly to agree with the ERA5 reanalysis dataset. The same process is followed with the wind farm availability (2022 and 2023), which EirGrid provided to the authors.
In terms of farm information, the location of wind farms and the corresponding turbine model information were provided by EirGrid. This information was completed by the authors by adding the publicly available installation date (EirGrid, 2024). The location of PV farms was identified via online search, by using project websites (such as https://www.statkraft.ie/ (last access: 28 July 2025) for the Gallanstown project) or online mapping platforms (such as Google Maps or Open Street Map) for each individual farm. Only the final installation dates were provided for large PV farms, so the steps at which they were connected to the system were estimated by the authors from the generation time series for each individual farm, which was directly provided by EirGrid. Sudden and consistent jumps in the energy production were identified and assigned to step changes in the installed capacity. Similarly, the installed capacity for any given farm was estimated to be 1.4 times its maximum export capacity (MEC) on average, as this is the value that more closely represents the observed farm energy production. This value was obtained by simulating generation profiles at each solar farm assuming different ratings above the declared MEC, and identifying the one that minimised the root mean square error (RMSE). These individual farm values were then averaged to get a MEC scalar representative of the national behaviour.
Three different capacity distributions are used in this work. First, a distribution of onshore wind capacity as of the end of 2023 (WIND); second, a combined distribution of onshore wind and PV capacity as of the end of 2023, with over 4.5 GW of wind in but only 0.58 GW of PV (W90-PV10, named after the percentage of each technology) (EirGrid, 2024); and finally, a distribution based on the target plans for 2030 (EirGrid and SONI, 2023), which aim for capacities of 9 GW for onshore wind, 8 GW for utility-scale PV and 5 GW for offshore wind (W41-PV36-OW23).
In addition to the observed data for the wind and PV distribution up to 2023, we use the Atlite model (Hofmann et al., 2021) to simulate the PV and wind farms and estimate the climatic-scale behaviours of any given capacity distribution. Both the PV and wind models were selected as the ones best representing the historical national ramp data for Ireland. In this work, we focus on ramps with a duration of 3 h, with ramp amplitude defined as the change in power output in terms of capacity factor (CF) over a 3 h time period. Only the CF that is part of an observed ramp with an amplitude larger than 0.2 in CF is used for the model error calculation.
The wind power curve was selected out of the database provided by renewables.ninja (Staffell and Pfenninger, 2016) with the different levels of smoothing (amplitude dependent on wind speed) – the NEG Micon NM 60/1000 with 0.20 w smoothing and a fixed hub height of 100 m was selected as the best at representing national ramps. The PV models included in Atlite were tested against observations and the best results were obtained from the Beyer et al. (2004) PV model with the Kaneka hybrid panel with the optimal panel orientation (all options included in Atlite), which takes as inputs the surface downward solar radiation and the 2 m temperature. Ireland has not yet developed large offshore wind projects, so we select the IEA 15 MW offshore reference turbine at a hub height of 150 m (Gaertner et al., 2020), and smooth it equivalently to the onshore wind turbine.
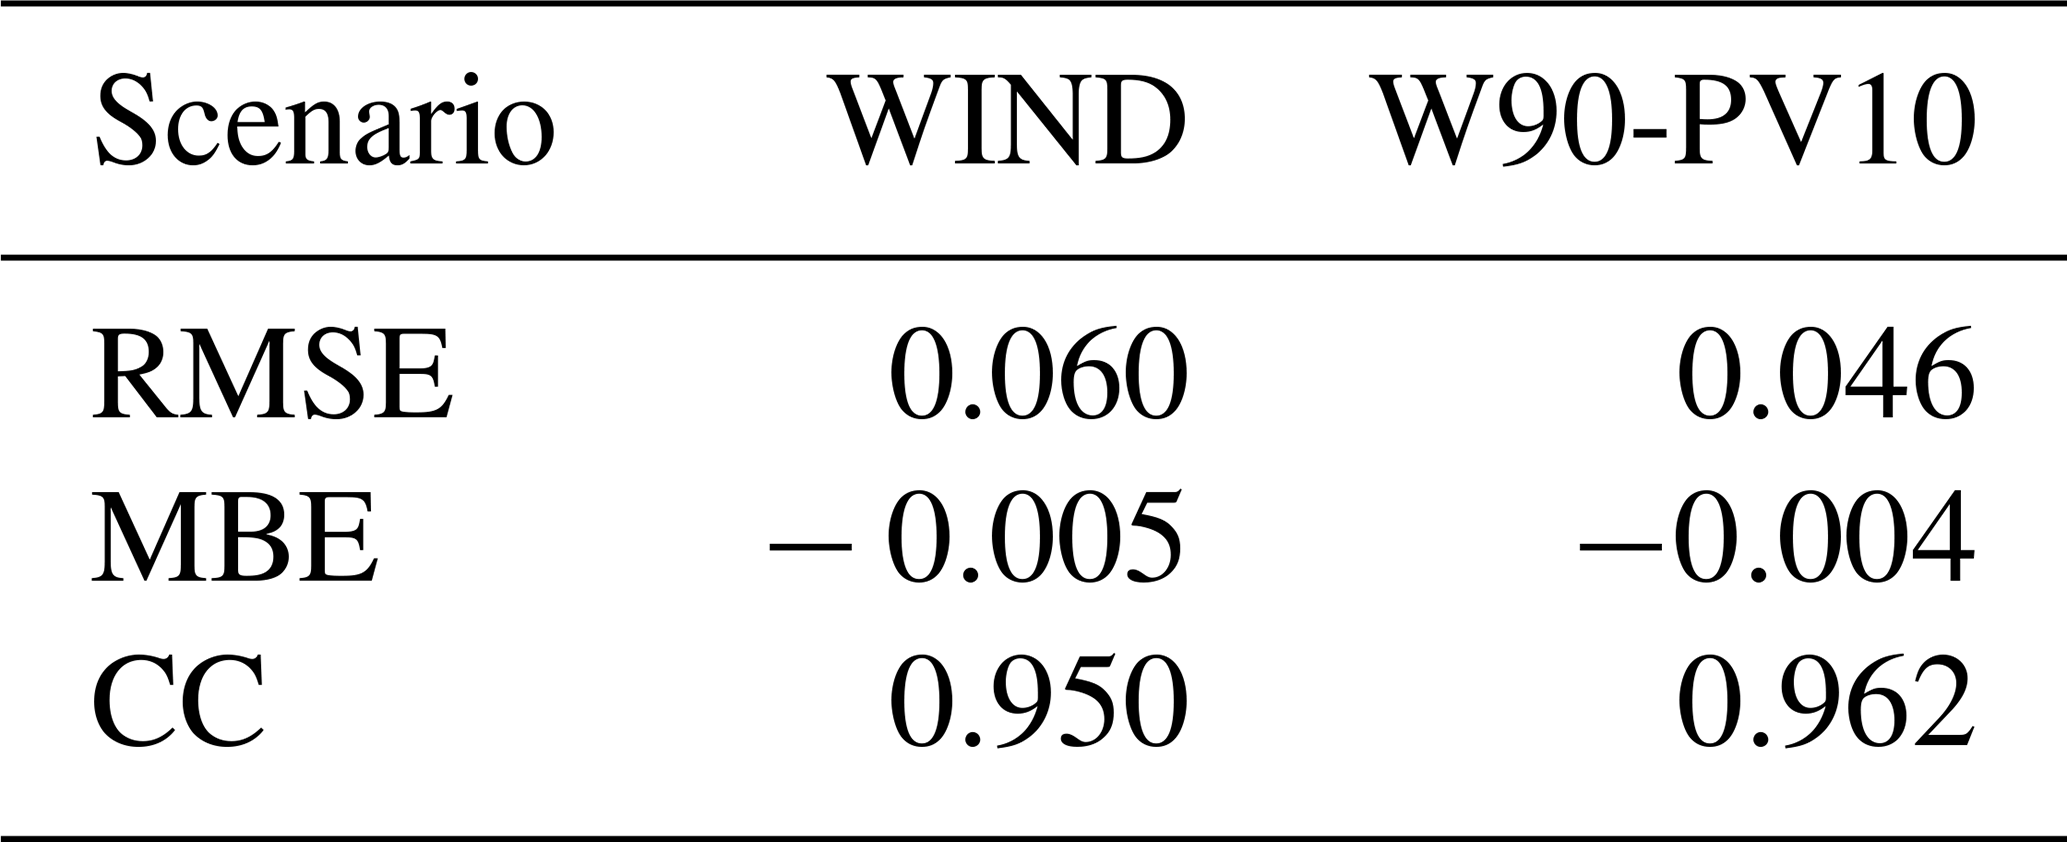
This first part of the results focuses on quantifying the error of the national simulated data at reproducing the observations for the two scenarios based on the actual wind and solar farm installation at the end of 2023: WIND and W90-PV10. The error is calculated using the CF series during times when it is part of a 3 h ramp with an amplitude larger than 0.2 in CF. This threshold is somewhat arbitrary, but is used to exclude periods with no significant change in the generation, and offline analysis show qualitative consistency to changes in the threshold. The error is assessed by means of three metrics: root mean square error (RMSE), mean bias error (MBE), and correlation coefficient (CC), with RMSE and MBE being widely used in the assessment of ramps (Gallego-Castillo et al., 2015), and the correlation coefficient being a standard.
These error metrics for WIND (Table 1) show that the general distribution of wind ramps is well reproduced by the modelled data. In fact, the addition of PV into the system, despite the small proportion (W90-PV10), improves the error metrics, with reductions in the overall error relative to the observed ramps. The models are able to represent reality for both scenarios, especially considering the limited availability of PV data and the uncertainty around the size of the farms.
Table 1Error metrics for the CF for the two observed scenarios: WIND (2014–2023) and W90-PV10 (2023).
The general distribution of the three modelled energy scenarios (Fig. 1a) shows how RES spatial diversification can reduce the number of aggregated high-amplitude ramps. W90-PV10 shows a small reduction in ramp amplitude relative to WIND, but the effect of diversification only becomes clearly visible when W41-PV36-OW23 is considered. This scenario is expected to severely reduce the number of large ramps, in terms of CF, even when the absolute size of the ramps may increase due to the higher installed capacity.
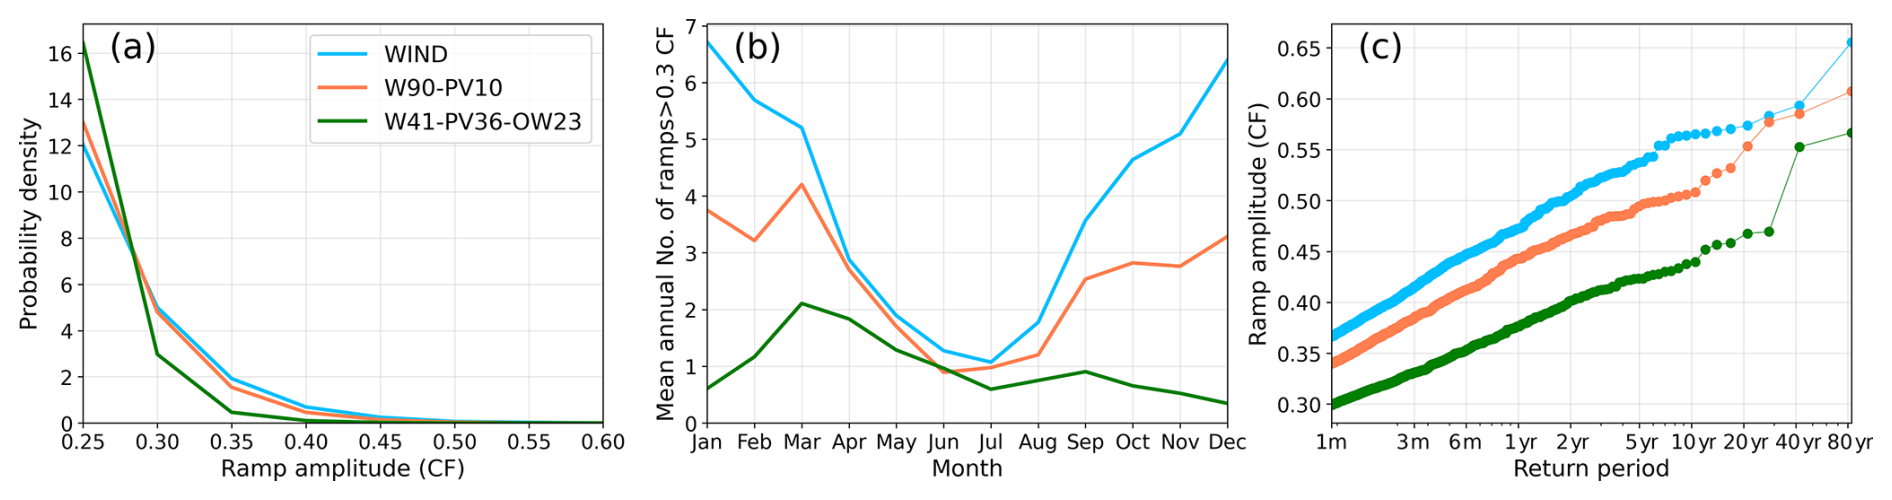
Figure 1Analysis of national ramps for the three scenarios: WIND (blue), W90-PV10 (orange), and W41-PV36-OW23 (green) in terms of (a) distributions (with normalised area), (b) seasonality of ramps with an amplitude larger than 0.3 in CF per month over the 1940–2023 period, and (c) return periods (x axis) for any given ramp amplitude (y axis).
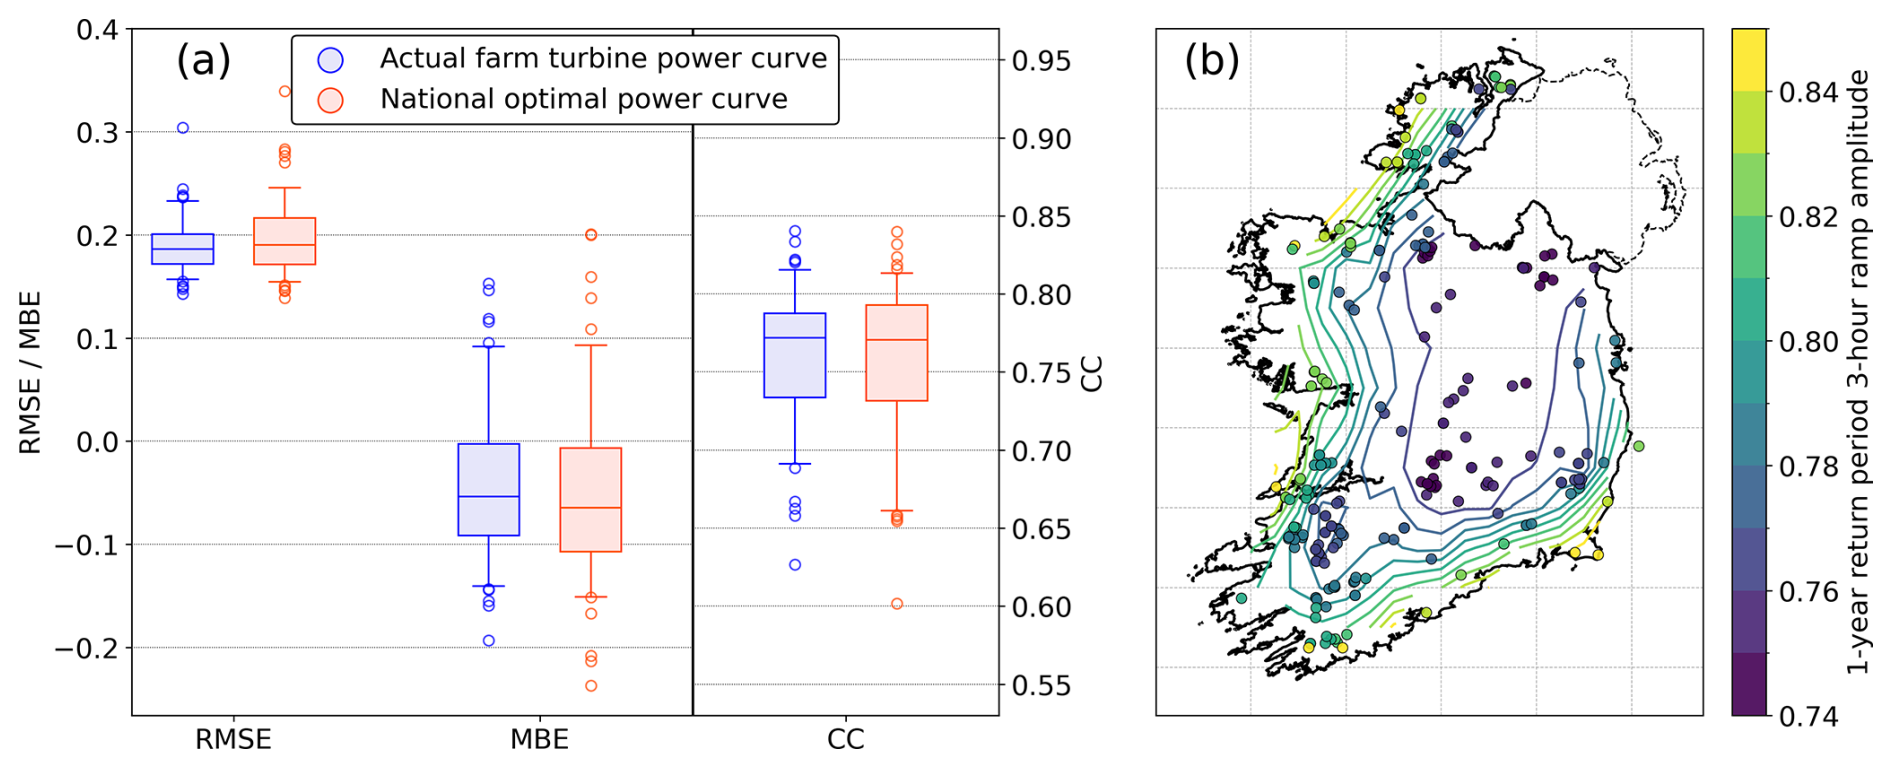
Figure 2Distribution of error metrics for onshore wind farm ramps for the 2022–2023 period (a) using the power curve for each turbine and farm with the smoothing yielding the lowest RMSE (blue) and the single national optimal power curve (red); and spatial distribution of onshore wind farm ramp amplitude with a 1-year return period (b) using the simulated 1940–2023 series using the national power curve.
Only ramps with an amplitude larger than 0.3 CF are considered to assess the seasonal distribution of ramps (Fig. 1b). Ramps exceeding this threshold are considered large ramps, which will likely impact the system. The specific threshold is selected based on the distributions observed in Fig. 1a and the definitions compiled in Gallego-Castillo et al. (2015). Wind ramps (WIND) present a strong seasonal variation, being much more common during the winter months, followed by autumn, spring and summer. These results are consistent with previous literature (Cannon et al., 2015; Cheneka et al., 2020). The introduction of PV (W90-PV10) allows for a reduction (almost 45 % in total) in the number of ramps for all months of the year, with a stronger effect in the winter leading to a reduction of seasonality. As in the distribution, W41-PV36-OW23 provides the best results, with the total number of ramps coming to under 15 % of the WIND ones, and the seasonal signal largely disappearing thanks to the complementarity of the resources.
Again, note that this change is analysed in terms of CF ramps, and does not directly translate in terms of absolute ramps. The addition of PV farms slightly increases the number of significant absolute ramps, showing that there may be potential for the co-installation of wind and solar PV capacity to mitigate ramps. For the future, an increase in onshore and offshore wind capacity, along with solar farms, will increase the absolute magnitude of the ramps observed, especially for those linked to large offshore wind farms (Drew et al., 2017). However, the magnitude of the ramps relative to the installed (wind and solar) capacity can be expected to reduce due to spatial and technology diversity.
Return periods are used to explore the most extreme ramps under each energy scenario (Fig. 1c). The transition from WIND to W90-PV10 increases the return period for a given ramp duration (decreases the ramp amplitude for a given return period). This effect is even stronger for W41-PV36-OW23, showing large reductions in ramp amplitude for a given return period. For reference, a ramp with a return period of 10 years has an amplitude in terms of CF of 0.57 for WIND, 0.51 for W90-PV10, and 0.44 for W41-PV36-OW23.
Here, we focus on onshore wind farms for the ramp analysis for two main reasons: its dominant role in the Irish power system and widespread access to long-term data for most farms. The aim of this section is twofold. On the one hand, the performance of two different models with different levels of complexity for farm-level ramps is tested to quantify and compare their error. On the other hand, the spatial distribution of wind farm ramps is estimated to identify those regions experiencing the largest ramps.
The observed time series and modelled time series for farms are compared under two modelling approaches: one using the selected national power curve, and one using the actual power curve for each farm, with the smoothing level that more closely represents reality (minimises RMSE). These two approaches show comparable error in their representation of farm ramps (Fig. 2a). Therefore, the national power curve can be used without increasing error, allowing for a crucial advantage: any spatial patterns identified can be directly linked to the driving wind resource.
The spatial distribution of the wind ramps over Ireland using the national power curve shows that the strongest ramps take place near the coast (Fig. 2b). The ramp amplitude decreases inland, although the minimum is shifted eastward due to the strong Atlantic winds coming from the west.
National ramp patterns are well reproduced by the ERA5-driven model, showing relatively low error. The wind-only Irish system (WIND) shows several high-amplitude ramps, with most of them concentrated in the winter months. The incorporation of PV (W90-PV10) contributes to the reduction of high-amplitude CF ramps, the strong winter-dominant seasonality, and the CF amplitude of the most extreme ramps. However, the biggest difference comes from the introduction of widespread PV and the addition of offshore wind (W41-PV36-OW23), reducing ramps, effectively eliminating seasonality and severely reducing the occurrence of extreme ramps. These effects are observed for CF ramps, showing how a fixed total capacity benefits from the diversification. However, the absolute ramp amplitude may not decrease in the actual Irish case, as the capacity is being developed.
We have focused on wind for our farm-based spatial analysis. Models show much higher error when reproducing farm ramps than their national counterparts. The main reason explaining this discrepancy is the misrepresentation of local topography and winds in ERA5, whose 0.25° resolution may be too low, as the compensation mechanisms that take place in national modelling do not occur at the farm scale. Still, using the national optimal power curve shows similar error to using individual power curves for each farm, while providing a direct association of ramps to wind patterns. From a power systems perspective, the greater concern is on national ramps, which are quite well represented.
The combined installation of wind and PV farms has been widely considered a favourable factor for power systems with net zero ambitions, as it increases overall generation capacity while reducing its power production variability. This work has shown that this effect extends to ramps, which are the most concerning type of variability due to their large amplitude in short time periods. This is also the case when adding offshore wind farms, where a combination of the three inputs offers the best option for ramp reduction. In terms of simulating ramps, ERA5-driven models show high potential for representing system-wide (aggregated) ramps, but their large errors at farm level pose a limitation, as the main problem is the driving wind itself. Still, the estimated distribution of wind farm ramps highlights those locations likely to experience large ramps.
Future expansions of this work could explore the effect of using higher resolution reanalysis data. Tools such as COSMO-REA6 (Bollmeyer et al., 2015) offer higher resolution reanalysis data, but also pose additional limitations in their shorter temporal span and their ERA-Interim based initial and boundary conditions (Jourdier, 2020). Still, this model shows skill as a wind energy model (Niermann et al., 2019), and the higher spatial resolution could improve the representation of wind farm ramps.
The code required to reproduce this article is available at https://github.com/ainamaimofar/ramps_Ireland_EMS, last access: 28 July 2025. EirGrid information is publicly available at https://www.eirgrid.ie/grid/system-and-renewable-data-reports, last access: 4 February 2025. Any further data will be provided by the authors upon reasonable request. ERA5 data (Hersbach et al., 2020) was downloaded from the Climate Data Store of the Copernicus Climate Change Service and is openly available.
AMF: Conceptualisation, Data curation, Formal analysis, Investigation, Methodology, Software, Validation, Visualisation, Writing – original draft, Writing – review & editing. CS: Conceptualisation, Funding acquisition, Methodology, Resources, Supervision, Writing – review & editing. DF: Writing – review & editing.
The contact author has declared that none of the authors has any competing interests.
Publisher's note: Copernicus Publications remains neutral with regard to jurisdictional claims made in the text, published maps, institutional affiliations, or any other geographical representation in this paper. While Copernicus Publications makes every effort to include appropriate place names, the final responsibility lies with the authors.
This article is part of the special issue “EMS Annual Meeting: European Conference for Applied Meteorology and Climatology 2024”. It is a result of the EMS Annual Meeting 2024, Barcelona, Spain, 2–6 September 2024. The corresponding presentation was part of session OSA2.1: Energy Meteorology.
The results contain modified Copernicus Climate Change Service information 2024. Neither the European Commission nor ECMWF is responsible for any use that may be made of the Copernicus information or data it contains. The authors would like to acknowledge EirGrid for providing the necessary data to conduct this study.
The research conducted in this publication was funded by Science Foundation Ireland and co-funding partners (grant number 21/SPP/3756) through the NexSys Strategic Partnership Programme.
This paper was edited by Ekaterina Batchvarova and reviewed by two anonymous referees.
Beyer, H. G., Bethke, J., Drews, A., Heinemann, D., Lorenz, E., Heilscher, G., and Bofinger, S.: Identification of a general model for the MPP performance of PV-modules for the application in a procedure for the performance of grid connected systems, https://citeseerx.ist.psu.edu/document?repid=rep1&type=pdf&doi=55aae29ec956eb9f6bb203257ce07f9ccf917cb0 (last access: 16 December 2024), 2004. a
Bollmeyer, C., Keller, J. D., Ohlwein, C., Wahl, S., Crewell, S., Friederichs, P., Hense, A., Keune, J., Kneifel, S., Pscheidt, I., Redl, S., and Steinke, S.: Towards a high-resolution regional reanalysis for the European CORDEX domain, Q. J. Roy. Meteor. Soc., 141, 1–15, https://doi.org/10.1002/qj.2486, 2015. a
Cannon, D. J., Brayshaw, D. J., Methven, J., Coker, P. J., and Lenaghan, D.: Using reanalysis data to quantify extreme wind power generation statistics: A 33 year case study in Great Britain, Renewable Energy, 75, 767–778, https://doi.org/10.1016/j.renene.2014.10.024, 2015. a, b
Cheneka, B. R., Watson, S. J., and Basu, S.: The impact of weather patterns on offshore wind power production, J. Phys. Conf. Ser., 1618, 062032, https://doi.org/10.1088/1742-6596/1618/6/062032, 2020. a, b
Cheneka, B. R., Watson, S. J., and Basu, S.: Quantifying the impacts of synoptic weather patterns on North Sea wind power production and ramp events under a changing climate, Energy and Climate Change, 4, 100113, https://doi.org/10.1016/j.egycc.2023.100113, 2023. a
Drew, D., Cannon, D., Brayshaw, D., Barlow, J., and Coker, P.: The impact of future offshore wind farms on wind power generation in Great Britain, Resources, 4, 155–171, https://doi.org/10.3390/resources4010155, 2015. a
Drew, D. R., Cannon, D. J., Barlow, J. F., Coker, P. J., and Frame, T. H. A.: The importance of forecasting regional wind power ramping: A case study for the UK, Renewable Energy, 114, 1201–1208, https://doi.org/10.1016/j.renene.2017.07.069, 2017. a, b, c
Drew, D. R., Barlow, J. F., and Coker, P. J.: Identifying and characterising large ramps in power output of offshore wind farms, Renewable Energy, 127, 195–203, https://doi.org/10.1016/j.renene.2018.04.064, 2018. a
EirGrid: System and Renewable Data Reports [data set], https://www.eirgrid.ie/grid/system-and-renewable-data-reports (last access: 4 February 2025), 2024. a, b, c
EirGrid and SONI: Shaping our electricity future Roadmap, Tech. rep., https://cms.eirgrid.ie/sites/default/files/publications/Shaping-Our-Electricity-Future-Roadmap_Version-1.1_07.23.pdf (last access: 19 February 2025), 2023. a
EirGrid and SONI: Ten-Year Generation Capacity Statement 2023-2032, https://cms.eirgrid.ie/sites/default/files/publications/19035-EirGrid-Generation-Capacity-Statement-Combined-2023-V5-Jan-2024.pdf (last access: 18 February 2025), 2024. a
Gaertner, E., Rinker, J., Sethuraman, L., Zahle, F., Anderson, B., Barter, G., Abbas, N., Meng, F., Bortolotti, P., Skrzypinski, W., Scott, G., Feil, R., Bredmose, H., Dykes, K., Shields, M., Allen, C., and Viselli, A.: Definition of the IEA Wind 15-Megawatt Offshore Reference Wind Turbine, IEA Wind TCP Task 37 NREL/TP-5000-75698, NREL (National Renewable Energy Laboratory), https://www.nrel.gov/docs/fy20osti/75698.pdf (last access: 10 December 2024), 2020. a
Gallego-Castillo, C., Cuerva-Tejero, A., and Lopez-Garcia, O.: A review on the recent history of wind power ramp forecasting, Renew. Sustain. Energ. Rev., 52, 1148–1157, https://doi.org/10.1016/j.rser.2015.07.154, 2015. a, b, c
Hersbach, H., Bell, B., Berrisford, P., Hirahara, S., Horányi, A., Muñoz-Sabater, J., Nicolas, J., Peubey, C., Radu, R., Schepers, D., Simmons, A., Soci, C., Abdalla, S., Abellan, X., Balsamo, G., Bechtold, P., Biavati, G., Bidlot, J., Bonavita, M., De Chiara, G., Dahlgren, P., Dee, D., Diamantakis, M., Dragani, R., Flemming, J., Forbes, R., Fuentes, M., Geer, A., Haimberger, L., Healy, S., Hogan, R. J., Hólm, E., Janisková, M., Keeley, S., Laloyaux, P., Lopez, P., Lupu, C., Radnoti, G., de Rosnay, P., Rozum, I., Vamborg, F., Villaume, S., and Thépaut, J.-N.: The ERA5 global reanalysis, Q. J. Roy. Meteor. Soc., 146, 1999–2049, https://doi.org/10.1002/qj.3803, 2020. a
Hofmann, F., Hampp, J., Neumann, F., Brown, T., and Hörsch, J.: atlite: A Lightweight Python Package for Calculating Renewable Power Potentials and Time Series, J. Open Source Softw., 6, 3294, https://doi.org/10.21105/joss.03294, 2021. a
IEA: World Energy Outlook 2024, Tech. rep., International Energy Agency, Paris, https://www.iea.org/reports/world-energy-outlook-2024 (last access: 22 January 2025), 2024. a
Jourdier, B.: Evaluation of ERA5, MERRA-2, COSMO-REA6, NEWA and AROME to simulate wind power production over France, Adv. Sci. Res., 17, 63–77, https://doi.org/10.5194/asr-17-63-2020, 2020. a
López Prol, J., de Llano Paz, F., Calvo-Silvosa, A., Pfenninger, S., and Staffell, I.: Wind-solar technological, spatial and temporal complementarities in Europe: A portfolio approach, Energy, 292, 130348, https://doi.org/10.1016/j.energy.2024.130348, 2024. a
Niermann, D., Borsche, M., Kaiser-Weiss, A., and Kaspar, F.: Evaluating renewable-energy-relevant parameters of COSMO-REA6 by comparison with satellite data, station observations and other reanalyses, Meteorol. Z., 28, 347–360, https://doi.org/10.1127/metz/2019/0945, 2019. a
Pedruzzi, R., Silva, A. R., Soares dos Santos, T., Araujo, A. C., Cotta Weyll, A. L., Lago Kitagawa, Y. K., Nunes da Silva Ramos, D., Milani de Souza, F., Almeida Narciso, M. V., Saraiva Araujo, M. L., Medrado, R. C., Camilo Júnior, W. O., Neto, A. T., de Carvalho, M., Pires Bezerra, W. R., Costa, T. T., Bione de Melo Filho, J., Bandeira Santos, A. Á., and Moreira, D. M.: Review of mapping analysis and complementarity between solar and wind energy sources, Energy, 283, 129045, https://doi.org/10.1016/j.energy.2023.129045, 2023. a
Raygani, S., Sharma, R., and Saha, T.: PV power output uncertainty in Australia, in: 2015 IEEE Power & Energy Society General Meeting, 26–30 July 2015, Denver, CO, USA, https://doi.org/10.1109/PESGM.2015.7286078, 2015. a
Staffell, I. and Pfenninger, S.: Using bias-corrected reanalysis to simulate current and future wind power output, Energy, 114, 1224–1239, https://doi.org/10.1016/j.energy.2016.08.068, 2016. a
- Abstract
- Introduction
- Data and methods
- Results – Part 1: Model error quantification
- Results – Part 2: The impact of PV and offshore wind on national RES ramps
- Results – Part 3: Spatial distribution of wind ramps
- Conclusions
- Code and data availability
- Author contributions
- Competing interests
- Disclaimer
- Special issue statement
- Acknowledgements
- Financial support
- Review statement
- References