 | 14 Nov 2025
Evaluation of ERA5, COSMO-REA6 and CERRA in simulating wind speed along the French coastline for wind energy applications
Anindita Patra
Boutheina Oueslati
Tessa Chevallier
Paul Renaud
Youen Kervella
Laurent Dubus
The quality of wind speed from different reanalyses (ERA5, COSMO-REA6 and CERRA) is assessed along the different coasts of mainland France. SYNOP (surface synoptic observations) wind measurements from Météo-France at 10 m height and floating LiDAR (Light Detection and Ranging) measurements from DGEC (Direction Générale de l'Énergie et du Climat) at 100 m height are used as reference. The inter-annual variability, distribution of wind, seasonal cycle, diurnal cycle and extremes are evaluated using several metrics (bias, correlation, normalized root mean square error). Results show that the shape of the 10 m wind seasonal cycle is well represented by all reanalyses. However, along the Mediterranean coast, wind speed is underestimated by ERA5, and overestimated by COSMO-REA6 during winter. COSMO-REA6 does not reproduce well the diurnal cycle along the Mediterranean coast, nor does ERA5 for the Atlantic coast. Overall, CERRA has better skills in representing surface wind speed on the three French seafronts, as well as for offshore wind speed at 100 m. The present study provides insights on the use of CERRA as a reference for offshore wind studies over the French maritime zone.
- Article
(3070 KB) - Full-text XML
-
Supplement
(1928 KB) - BibTeX
- EndNote


France's electricity mix is dominated by nuclear power which contributed 65 % of the total production in 2020. It is followed by renewables (wind, solar, hydro, bioenergy: 29 % of the total production), and fossil fuels (6 %) (RTE, 2023). As the share of renewables in the electricity mix in France continues to increase (RTE, 2021), so does the electric system sensitivity to climate variability (Bloomfield et al., 2016). France has the second largest offshore wind resource potential in Europe behind the UK, and thus a promising future for the installation of offshore wind farms. Therefore, it is important to investigate France's offshore wind resource and its evolution over the lifespan (several decades) of offshore wind farms.
Since wind measurements over coastal areas and offshore regions are sparse over medium/large spatial areas or temporal periods, assessments can be performed using high resolution and gap-free wind data from numerical model simulations. Reanalysis datasets have the advantage of homogeneous spatiotemporal data coverage that allows characterizing the wind resource variability over large spatial domains, as well as investigating long-term trends. But a thorough evaluation of reanalyses is necessary to quantify any issue, such as underlying systematic model errors (Bloomfield et al., 2016), coarse resolution (Dawkins, 2019), misrepresentation of extreme events (Cannon et al., 2015), among others.
Until present, several studies have evaluated reanalyses for wind speed resources (Carvalho et al., 2014a; Miao et al., 2020; Jourdier, 2020; Shen et al., 2022; Potisomporn et al., 2023). Overall, these studies have found globally that most reanalyses show a decent correlation (mean Pearson coefficient R>0.75) of wind speed with observations but significant mean biases of magnitude greater than 0.3 m s−1 and RMSE larger than 3 m s−1 (Potisomporn et al., 2023). Wilczak et al. (2024) reported on negative bias in ERA5 derived wind power over the United States and therefore the need for bias correction. The validation of offshore wind resource from reanalyses using lidar data has been reported for the US coast (Sheridan et al., 2022; Fragano and Colle, 2025).
Several studies (Ramon et al., 2019; Gualtieri, 2022; Fan et al., 2021) concluded that among the global reanalyses, ERA5 overall exhibits better performance, with respect to the mean wind speed bias and RMSE, compared to other reanalysis datasets. However, regional higher resolution reanalyses should be used when available to address fine-scale aspects that are important for wind energy applications (Gualtieri, 2022). The regional simulations benefit from using higher spatial resolution models than the global reanalyses. Fan et al. (2021) suggested that wind energy production should select different products for different regions to minimize the discrepancy with observations. The use of regional reanalyses is also recommended over the more challenging coastal and mountainous sites to adequately resolve detailed terrain features as well as land use discontinuities and strong stability variations (Carvalho et al., 2014b). Importantly, any improvement in global datasets could also have a positive effect on regional products, whose accuracy strictly depends on the quality of the global reanalysis they use as boundary conditions (Clarke et al., 2021).
Jourdier (2020) evaluated several reanalyses (global: MERRA-2, ERA5; regional: COSMO-REA6, NEWA, AROME) using wind mast data (between 55 and 100 m above ground) over continental France. ERA5 is very skilled, except in mountainous areas, where high resolution regional models are better. In this article, we focus on surface winds along the coasts of France, including newly available regional reanalyses, and for the extended time period 1995–2018. The surface winds measurements (SYNOP) from automated weather stations, which are located onshore, are used as a reference. In addition, 100 m wind speeds from floating LiDAR stations are considered to assess the reanalyses at higher levels and at offshore locations. The global reanalyses ERA5 (Hersbach et al., 2020), and regional reanalyses COSMO-REA6 (Bollmeyer et al., 2015) and Copernicus Regional Reanalysis for Europe (CERRA, Ridal et al., 2024), which are available at a finer spatial scale, are considered for evaluation. Moreover, the quality of these reanalyses is assessed along different coastlines of mainland France: the English Channel, the Atlantic Ocean and the Mediterranean Sea. In addition to mean, high and low percentiles, mean cycles (e.g., seasonal and diurnal), and different seasons are also evaluated.
The stations located in the northern and western parts of the French coastline are in rather flat terrain, and largely influenced by westerlies (offshore winds) from the Atlantic Ocean. On the other hand, stations in the south-east part of the French coastlines are in a much more complex environment with elevated mountain ridges: the Pyrénées to the south-west, the Alps to the east and the Massif Central in between (Drobinski et al., 2015; Salameh et al., 2009). The Mediterranean coast is affected by mistral and tramontane channeled flows, which are onshore winds from the north-west. The Mediterranean climate system is in particular subject to local breeze during summer. In addition, the calm season here sees a mix of offshore sea-breezes and onshore north-west wind episodes. The seasonal contrast is higher on the Mediterranean coast compared to the Atlantic and the Channel coast.
Evaluating models' skill is complicated because the measured data are not temporally homogeneous, and their coverage depends on stations. Although many metrics can be computed, their selection depends on the application. The metrics computed over the entire period cannot fully characterize the seasonal or diurnal cycles, thus they must be carefully evaluated at each station. Jourdier (2020) mentioned that the evaluation of the diurnal cycle is interesting, not only because it reveals hidden intra-day biases, but also because it is a good measure of how well the boundary layer physical processes are parameterized in the models. Therefore, this study also evaluates seasonal and diurnal cycles of the reanalyses in comparison to the observations.
The structure of the manuscript is as follows: Section 2 introduces the data (measurements and reanalysis) and discusses the quality control and statistical methods used for evaluation. The results are presented in Sect. 3, focusing on the 10 and 100 m wind speeds, respectively, showing the error metrics at each station, seasonal and diurnal cycles, interannual variability and distributions, and high and low percentiles of wind speeds. The conclusion is provided in Sect. 4.
2.1 Data
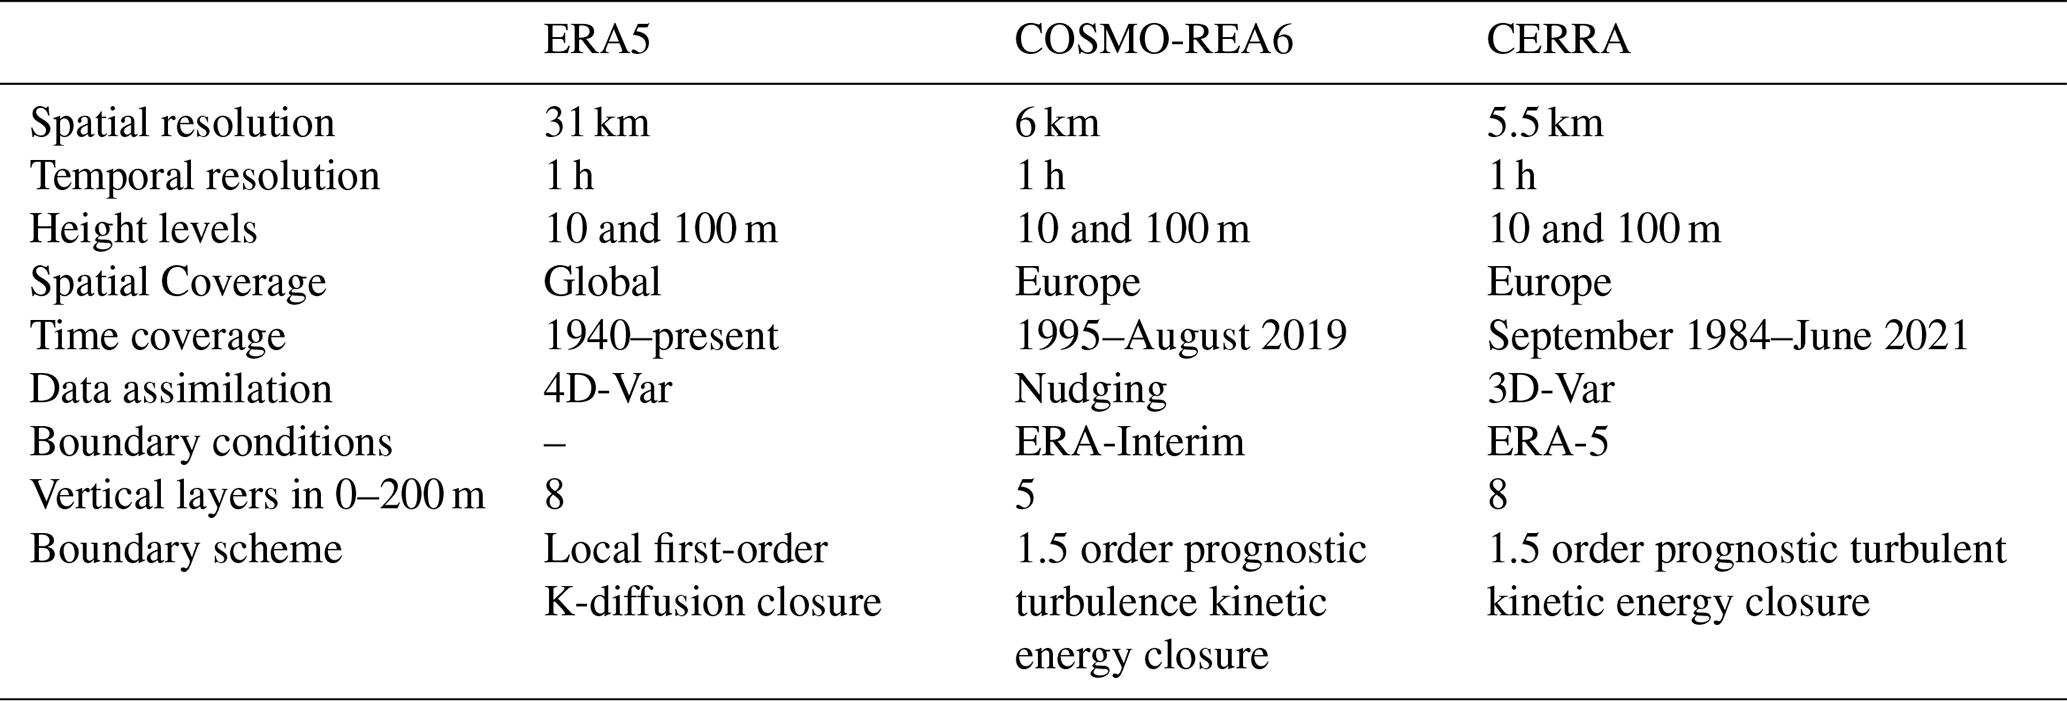
This section describes the measurements and reanalysis data (Table 1) evaluated in this study.
2.1.1 SYNOP
The SYNOP (surface synoptic observations) wind measurements are made in accordance with World Meteorological Organization (WMO) standards at 10 m above terrain using verified and calibrated anemometers. As per WMO standards, the automated weather stations (AWS) are representative of the surrounding area, (mostly, not always) away from buildings and trees, which would otherwise influence the measurements. The description of the French stations and the available parameters can be found here: https://meteo.data.gouv.fr/datasets/6569b4473bedf2e7abad3b72 (last access: 28 September 2024).
The stations are maintained regularly and are calibrated to ensure correct readings. All stations send data every 10 min, while they report back every hour with the highest measurements in the latest 1 h period (https://meteodata.dk/windsynop.php, last access: 28 September 2024). Note that hourly measurements are available for recent years (primarily after 1990); only 3-hourly records are provided for earlier periods. We have selected all the coastal stations (at most a few km from the coastline) around France and then a quality control was applied (Sect. 2.2.1) to keep only the best stations for our comparisons (Fig. 1).
2.1.2 ERA5
ERA5 is the fifth generation ECMWF (European Centre for Medium-Range Weather Forecasts) atmospheric reanalysis that is based on the Integrated Forecasting System (IFS) Cy41r2 (Hersbach et al., 2020). The horizontal resolution is 31 km (0.28°) and the temporal resolution is hourly during the period 1940 to present. On the vertical, there are 137 levels from the surface to the model top located at 0.01 hPa or 80 km altitude. In the lowest 200 m of the marine atmospheric boundary layer (MABL), there are eight sigma levels. 4DVar is used for the assimilation of a variety of conventional and satellite based observational data. Quality-assured monthly updates of ERA5 are published within 3 months of real time. Access to the data is provided by the Meteorological Archival and Retrieval System (MARS) of ECMWF and the Copernicus Climate Data Store (CDS).
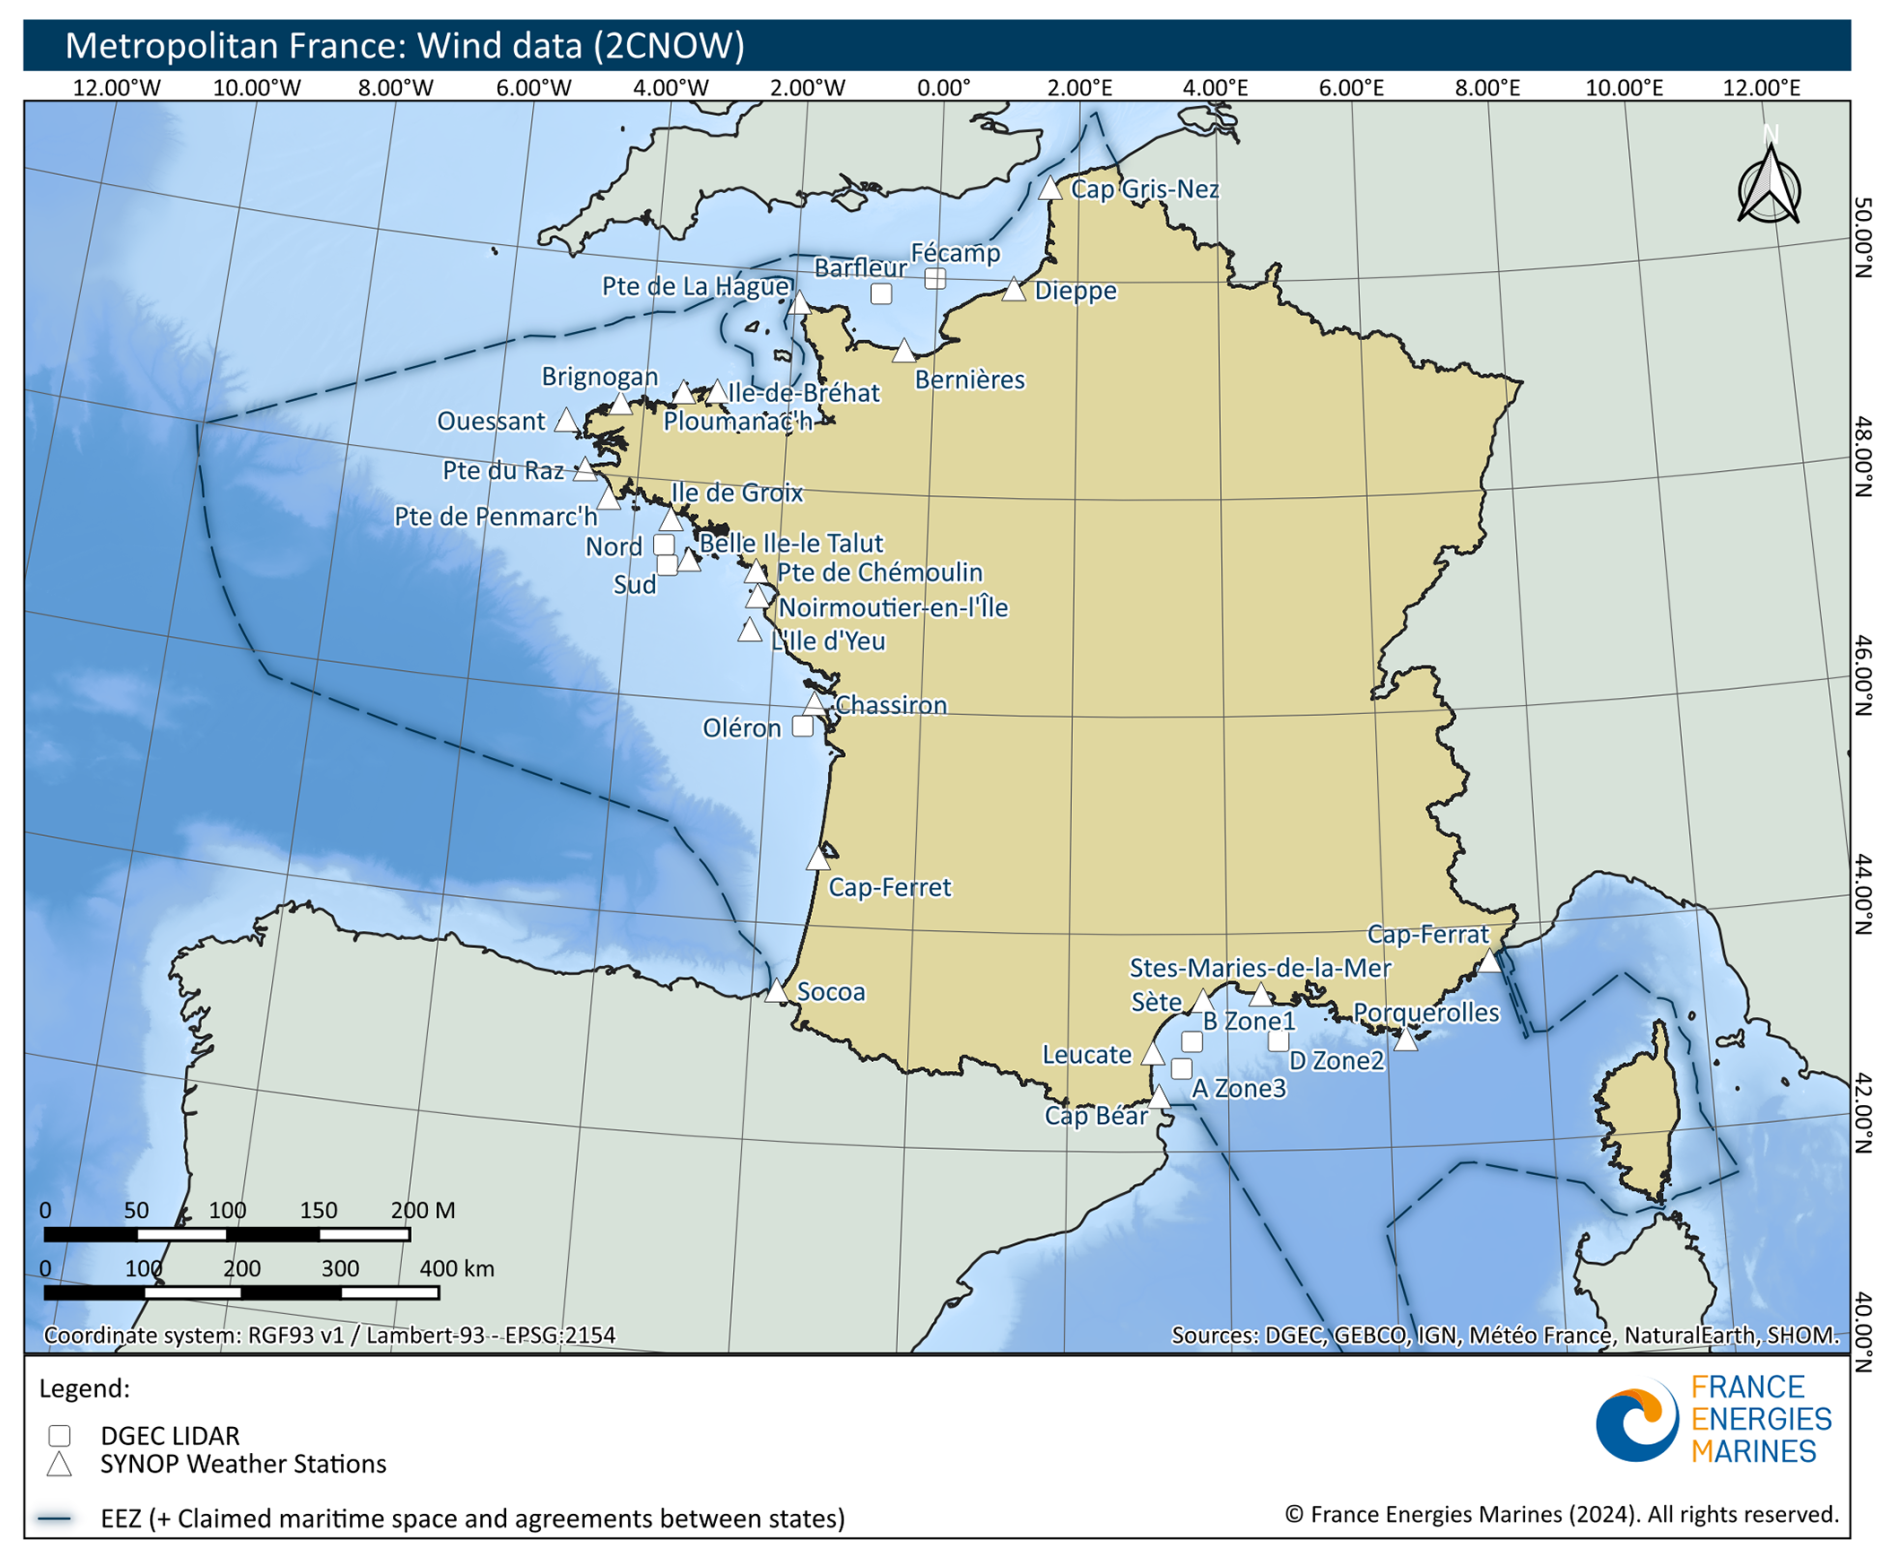
Figure 1Coastal weather stations (data source: Météo France, triangles) and offshore LiDAR stations (data source: DGEC, squares) used in this study.
Generally, the data consists of “analyses” and “forecasts”, initialized twice daily from analyses at 06:00 and 18:00 UTC. Using data assimilation, each previous forecast is combined with the newly available observations in an optimal way to produce a new best estimate of the state of the atmosphere, called the analysis, from which an updated, improved forecast is issued. An issue with the diurnal cycle of wind speeds in ERA5, associated with the assimilation process, which affects mostly low latitude oceanic regions but also Europe and North America, was reported by Jourdier (2020). To overcome this issue, ERA5 forecasts (“fc”) are used here instead of analysis (“an”) data. The global models like ERA5 have relatively low spatial resolution. Thus, higher resolution, limited spatial extent models are also investigated.
2.1.3 COSMO-REA6
The regional European reanalysis COSMO-REA6 was developed within the Hans-Ertel-Centre for Weather Research and uses operational NWP model COSMO version 4.25 of the German Meteorological Service (DWD) with initial and boundary conditions from the ERA-Interim reanalysis (Dee et al., 2011) at 6-hourly interval. The model domain is adjusted to match the EURO-CORDEX region. The configuration used incorporates a horizontal resolution of 6 km with a non-hydrostatic model formulation. In the vertical, the terrain following hybrid coordinate system consists of 40 levels with 5 levels in the lower 200 m MABL.
For data assimilation, COSMO-REA6 uses a Newtonian relaxation scheme (nudging) to combine prognostic model variables with observations. Observations are assimilated stemming from radiosondes, SYNOP stations, ships, buoys or aircraft. Satellite data is not assimilated in COSMO-REA6 (Bollmeyer et al., 2015). The COSMO-REA6 data is publicly available as part of DWD's open data (https://opendata.dwd.de/climate_environment/REA, last access: 28 September 2024). The COSMO-REA6 reanalysis is chosen because of its high spatial resolution and availability from 1995 to August 2019 at hourly frequency.
2.1.4 CERRA
The CERRA system (Ridal et al., 2024) is based on the HARMONIE-ALADIN data assimilation system. The model runs with a 5.5 km horizontal grid spacing and with 106 vertical levels (8 levels in the lower 200 m MABL) with the domain larger than the Euro-CORDEX domain. The system uses lateral boundary conditions obtained from the ERA5 global reanalysis. It runs with a 3 h cycle producing 6 h forecasts at all analysis times except at 00:00 and 12:00 UTC where 30 h forecasts are produced. The CERRA system employs the 3D variational assimilation (3D-VAR) method. At fixed points in time the model state is adjusted based on the observed state, considering the error statistics of both model and observations. The CERRA high-resolution system has been running with eight assimilation cycles per day performing analyses (“an”) at 00:00, 03:00, 06:00, 09:00, 12:00, 15:00, 18:00 and 21:00 UTC. The forecast lengths vary between 6 and 30 h depending on the starting hour. The forecast model is then started from the analysis and the output is saved hourly for the first 6 h. Due to the forecast lengths, the forecasts are overlapping (refer to Fig. S1 for details) and for every hour of the day data can be chosen from the forecasts (“fc”). More information can be found in Schimanke et al. (2021b, a) and via the link: https://cds.climate.copernicus.eu/datasets/reanalysis-cerra-single-levels?tab=overview (last access: 28 September 2024).
Table 1Description of reanalysis datasets used in the study. Height levels refer to only those used in this study.
After the assimilation of the observations (the analysis), the model state is not completely balanced dynamically, meaning that the model atmosphere might contain high-frequency waves. That might affect the quality of the forecasts closest to the analysis time if they are not rapidly damped. On the other hand, longer forecasts might veer away from the real weather, e.g., due to shortcomings in the model parametrizations, the initial conditions and/or inaccurate boundary conditions. The comparisons completed by Jourdier et al. (2023) suggest that it is better to use the forecasts with lead times of 4, 5 and 6 h for each time step (00:00, 03:00, 06:00, … 21:00). Thus, we have an hourly dataset from CERRA- “fc” (Fig. S1). It is currently available from September 1984 to June 2021.
2.1.5 LiDAR
LiDAR observations are available from Météo-France at 7 offshore stations (Fig. 1). They are part of the plan of the DGEC to monitor wind speed for the development of offshore wind power projects. Wind data were acquired over a period of about 1 year (see Fig. S2 for timeline) using a buoy-mounted LiDAR system from LEOSPHERE (Windcube V2 Offshore 8.66 for buoys, model WLS866-4). The LiDAR sends an infrared laser pulse towards the atmosphere and measures the reflections of aerosol particles, which makes it possible to calculate the speed and direction of the wind based on the shift in their wavelength due to the Doppler effect. These measurements are taken at 11 different heights, from 40 to 200 m (40, 50, 60, 80, 100, 120, 140, 150, 160, 180, 200 m). The data sampling rate is 1sec. Wind speeds are corrected for the buoy movement and averaged to produce 10 min wind speed. Technical reports produced by Météo-France state that the lidar measurements were validated against Météo France's AROME model and anemometer measurements (https://www.eoliennesenmer.fr/sites/eoliennesenmer/files/fichiers/2024/05/AO7_Ol%C3%A9ron_Lot4_Rapport-final_V2_20230512.pdf, last access: 13 November 2025).
2.2 Methodology
2.2.1 Quality control of SYNOP measurements
Each “raw” observation exceeding the daily mean value by a factor of 2 times the daily standard deviation is removed as an outlier (Bentamy and Croize-Fillon, 2014). As the SYNOP measurements have several data gaps, a data filtering method is applied. First, sudden changes in data distribution are filtered by removing the older data. Those jumps generally happen when a new sensor is put in place. The new sensors are believed to be more precise and less subject to errors than the old ones, thus the older data is not used here. Such jumps were found only for the Sete station, around 1996. To deal with the missing values, we calculated the number of missing observations per month in each year. We allowed a maximum of 33 % missing values in each month: it corresponds to two missing values per day for 3-hourly data, and eight for hourly data. The years with at least a month above this threshold were removed to prevent a bias in the seasonal cycle (Fig. 2). The years where the number of missing values per month was constant were also excluded: after a manual check, those missing values happened daily at the same time. Thus, keeping them would lead to a bias in the diurnal cycle. This last issue occurred only in the 3-hourly data (before 1990) when the data collection was manual. The stations with at least 10 years of data between 1995 and 2018 were kept, resulting in a total of 24 SYNOP stations (Fig. 1): 7 stations along the English Channel coast, 11 along the Atlantic coast and 6 along the Mediterranean coast.
2.2.2 Comparison methods
The reanalysis data are provided on a grid, where the latitude and longitude values correspond to the center of each grid cell. For the horizontal matching with SYNOP measurements, the reanalyses (ERA5, COSMO-REA6, CERRA) grid points are extracted at the measurement points according to a nearest neighbor approach. It turns out that this approach provides better results than bi-linear interpolation of the surrounding 4 grid cells for the coastal stations, since it allows to avoid linearly interpolating land and ocean points together at the coastal transition. Due to the horizontal resolution of the reanalyses, local topographical features may not be always accurately represented. The vertical levels of the reanalyses, used here, are at the same height as SYNOP or Lidar measurements.
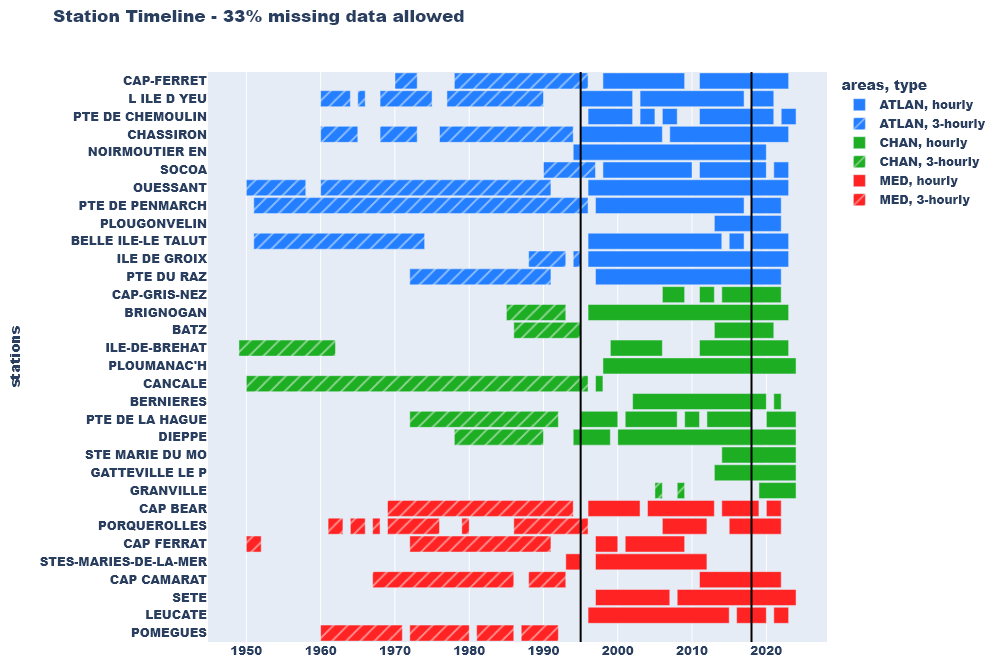
Figure 2Timeline of the stations after removing the missing values. Green, blue, red are for the English Channel, Atlantic and Mediterranean stations, respectively. The hatched and non-hatched rectangles correspond to three-hourly and hourly measurements, respectively.
For the temporal matching, both SYNOP measurements and reanalyses data are available on hourly basis. The hourly reanalysis data represents an average of the instantaneous time step of minute 0 of the current and following hour. From the LIDAR time series with a 10 min resolution, we choose the 0 min of each hour. The reanalysis data are selected during the common time period 1995–2018. Moreover, time steps when any dataset or observation (SYNOP/ LiDAR) is missing at a station are removed from all the time series. These time series are used to compute several metrics. The evaluation is then done only for common timesteps. We acknowledge that these methods used to generate a homogenous data set may introduce some uncertainty according to the resolution of the reanalysis.
The diurnal cycle, seasonal cycle, inter-annual variability, and cumulative density function are evaluated at each SYNOP and LiDAR location. Thereafter, a station average along each coastline is also calculated. For coastal averages, we separately compute the mean of point measurements and of the corresponding reanalysis grid values at each coast. The coastal zones in France are divided into three seafronts: the English Channel, the Atlantic Ocean, and the Mediterranean Sea. The box plots are presented for both the mean and extreme percentiles of wind speed. The error metrics (percentage bias: PBIAS, normalized standard deviation ratio: STDratio, normalized root mean square error: NRMSE, Pearson product-moment correlation coefficients: CORR) used here are defined as follows:
Where M and O represent reanalysis and reference measurements, respectively, N is the number of timestamps, and σ is standard deviation.
3.1 Evaluation of Surface Wind Speed (10 m)
Surface wind speed at 10 m provided by the reanalyses is evaluated for the different coastlines of France in comparison to the in-situ measurements. The purpose is to assess the performance of each reanalysis, by considering the metrics described above, and to identify the one showing the best skill for most of the stations.
3.1.1 Distribution of error metrics over stations
The error metrics (PBIAS, STDratio, NRMSE, CORR) are computed at each station for the hourly time series (at common times between the measurements and reanalyses) for the 1995–2018 period (refer to Table S1 for metrics at each station). Thereafter, the metrics are presented through Box–Whisker plots for each reanalysis at each coastline. Figure 3 provides the overview of percentage biases (PBIAS) for the stations along the 3 French seafronts (see Fig. 1 for station locations). For the 7 stations along the English Channel coastline, the comparison with the SYNOP measurements shows that the median bias is ∼2 %–3 % (<0.2 m s−1) for the 3 reanalyses (Fig. 3, left panel). For CERRA, 50 % of the bias values (First (Q1) to third quartile (Q3) range indicated by the boxes) are within 10 % (absolute bias: 0.5 m s−1) with a quasi-systematic bias toward positive values. Similar systematic positive bias values for CERRA are reported for the German Exclusive Economic Zone of the North Sea (Spangehl et al., 2023). The inter-quartile range (Q3–Q1) is higher for other reanalyses compared to CERRA. COSMO-REA6, although a regional reanalysis, has a larger bias spread. For the Atlantic (11 stations) and Mediterranean (6 stations) coastlines, CERRA has also an inter-quartile range (Q3–Q1) within 10 %. The percentage biases from ERA5 are the worst in the Mediterranean and have high values for the English Channel and Atlantic as well. The COSMO-REA6 performs well in the Atlantic, with a low median bias but a larger interquartile spread than CERRA. A larger underestimation by ERA5 (interquartile range: −2.4 to −0.16 m s−1) over Southern France (also see Fig. S3) is also reported by Jourdier (2020). This discrepancy is attributed to the region's complex orography and the lower resolution of ERA5 compared to regional models. Contrary to ERA5, COSMO-REA6 displays a larger overestimation (interquartile range: −0.19 to 1.17 m s−1) for the Mediterranean coast. These findings hold true even when PBIAS values are computed separately for the winter (December to February) and summer (June to August) (Fig. S4). In particular, the large overestimation by COSMO-REA6 is reduced in summer and increased in winter (Fig. S4). Overall CERRA presents the best results in terms of PBIAS.
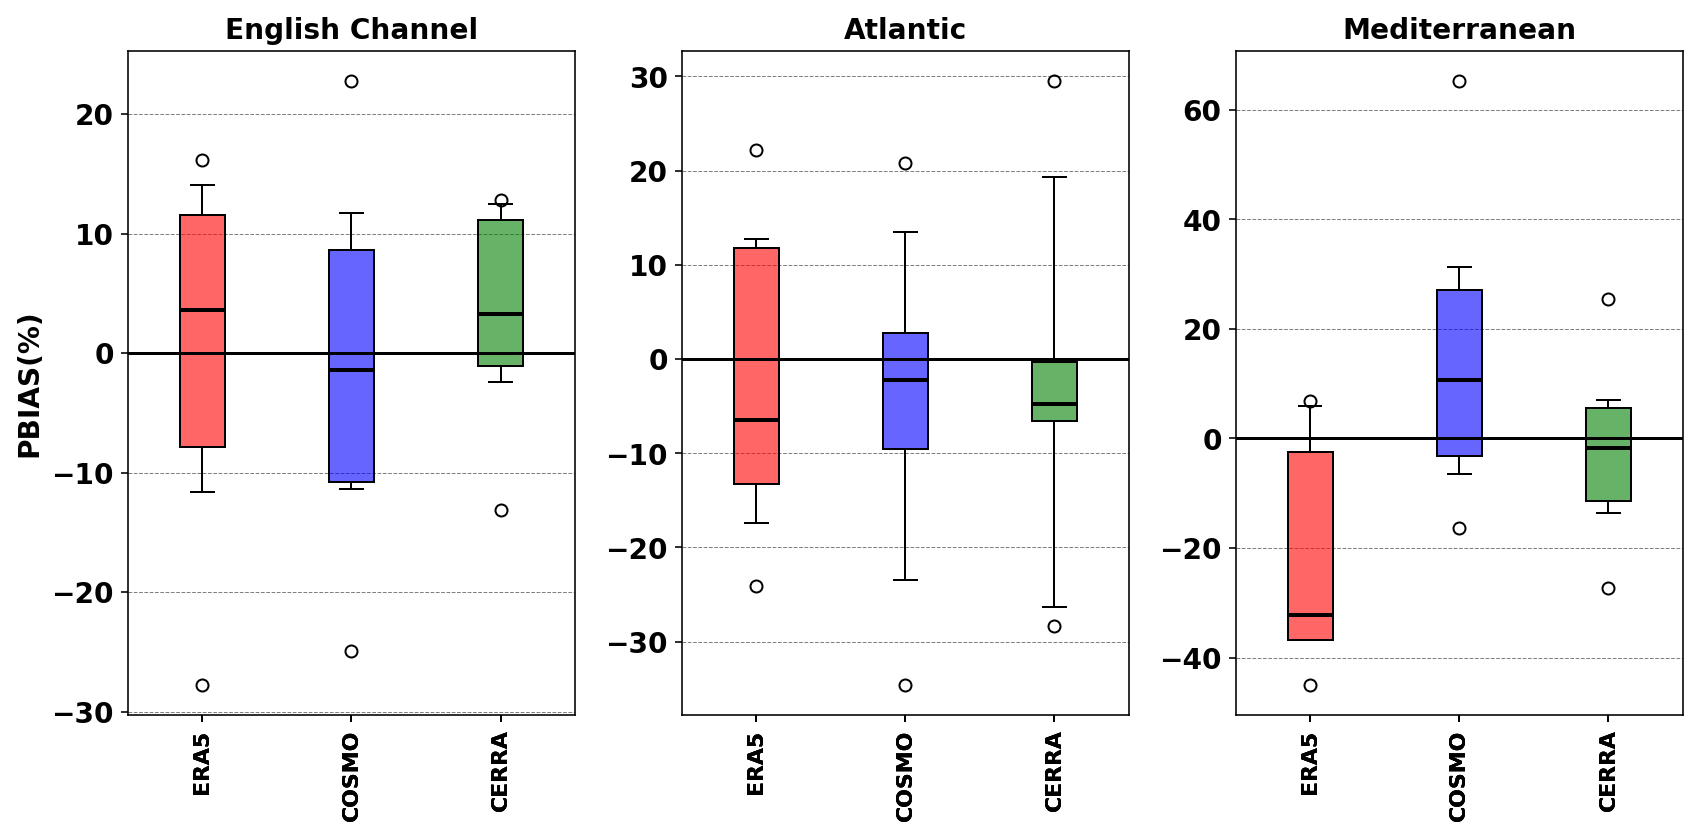
Figure 3Box–Whisker plots for the bias distribution over the stations for 10 m wind speed from the reanalyses in comparison to SYNOP measurements. The black horizontal line shows the median, the box shows the 25th and 75th quantiles, and the vertical line shows the 5th and 95th quantile range of the biases for different stations at each coast. Larger biases (beyond 5th–95th quantile range) are indicated by the circles. Note that the vertical axis is different for each region.
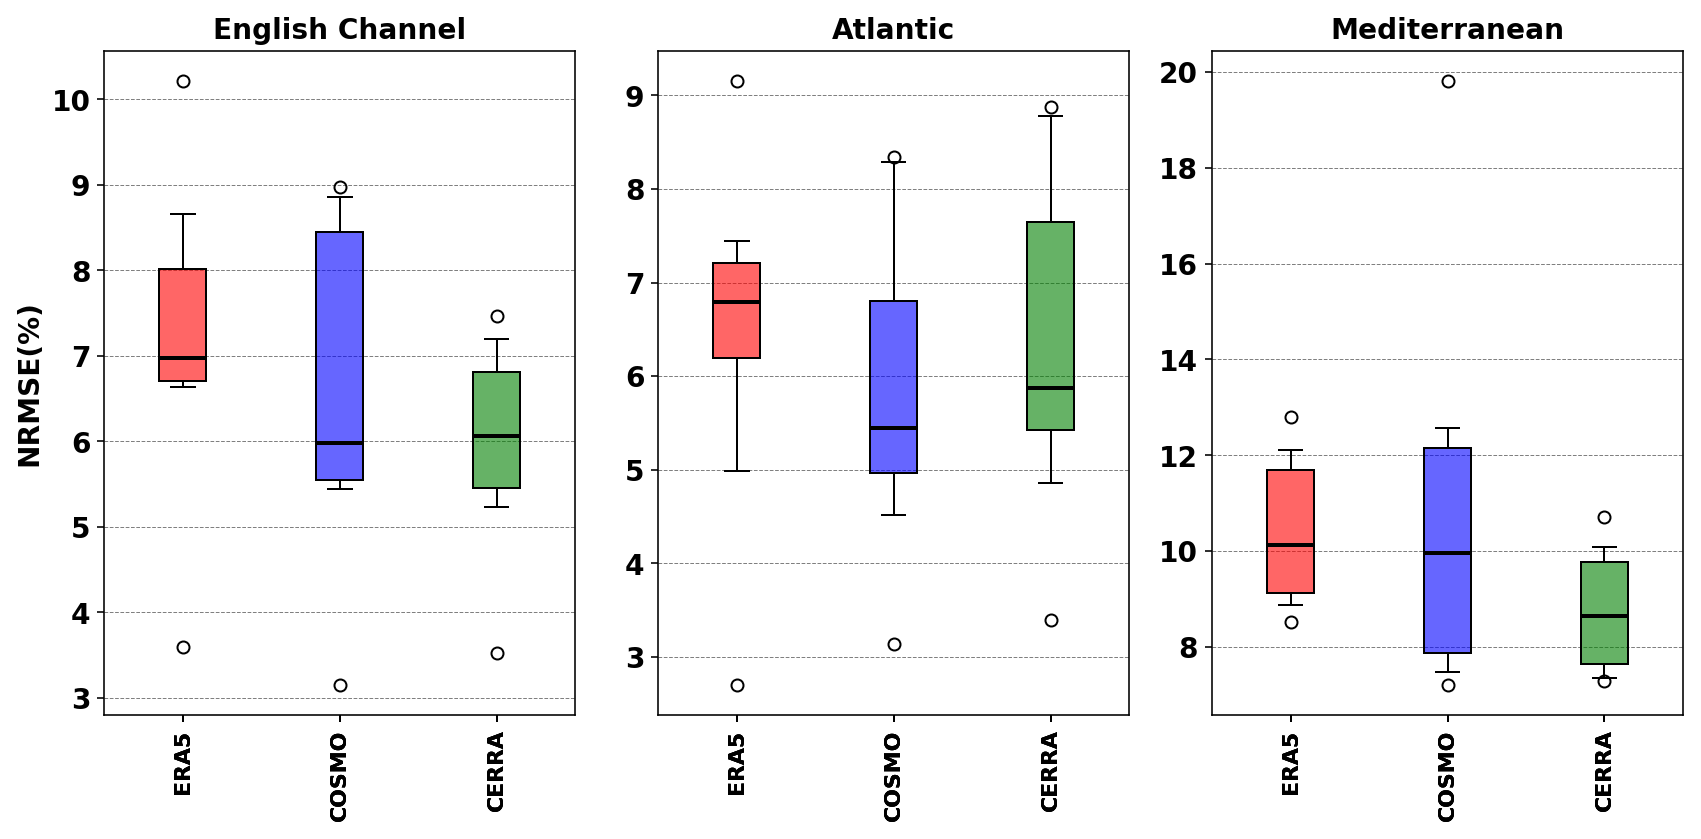
In addition to the bias, which represents the systematic error, other error metrics, such as the normalized root mean square error, correlation, normalized standard deviation (using hourly data) are computed. The NRMSE values of the reanalyses (Fig. 4) are usually within 10 %, except for ERA5 and COSMO-REA6 for the Mediterranean coastline, as high biases are also seen for these cases. The median NRMSE value from CERRA is less than 6 % for the English Channel and Atlantic, and around 8 % for the Mediterranean. The absolute RMSE values are less than 3 m s−1 for the English Channel and Atlantic coast and less than 5 m s−1 for the Mediterranean coast. Various studies which have evaluated reanalyses in different locations for wind speed found that most of the reanalyses show RMSEs higher than 3 m s−1 (Potisomporn et al., 2023). Overall CERRA presents the best results in terms of NRMSE, followed by COSMO-REA6.
The reanalyses show a decent correlation (>0.75) with the measurements (Fig. 5), which agrees with Potisomporn et al. (2023). The median value of CERRA (above 0.82) is always higher than that of the other reanalyses, except in the Atlantic, where COSMO-REA6 shows a slightly higher correlation. Slightly lower correlation values can be seen for ERA5. The most eastern station in the Mediterranean, Cap Ferrat, has the lowest correlation, especially in COSMO-REA6 (Fig. S5). At Cap-Ferrat, there are many missing values in SYNOP measurements (Fig. 2, Table S2) and no data is available after 2010. In general, lower correlations are observed along the Mediterranean coast (third quartiles drop to 0.7).
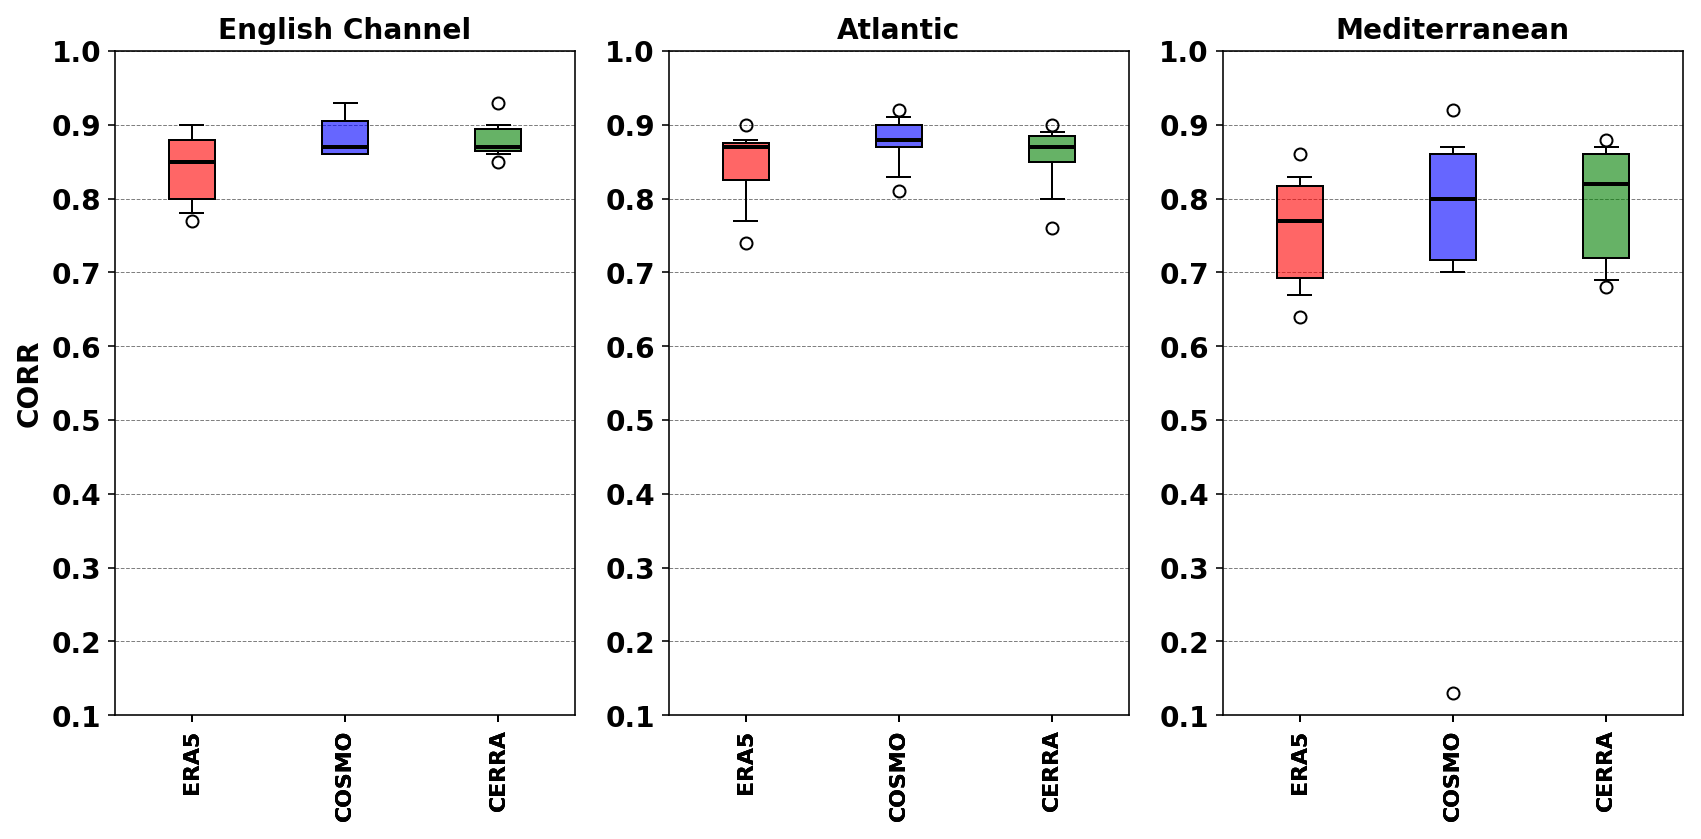
Figure 5Same as Fig. 3, but for the distribution of Correlation Coefficients over the stations.
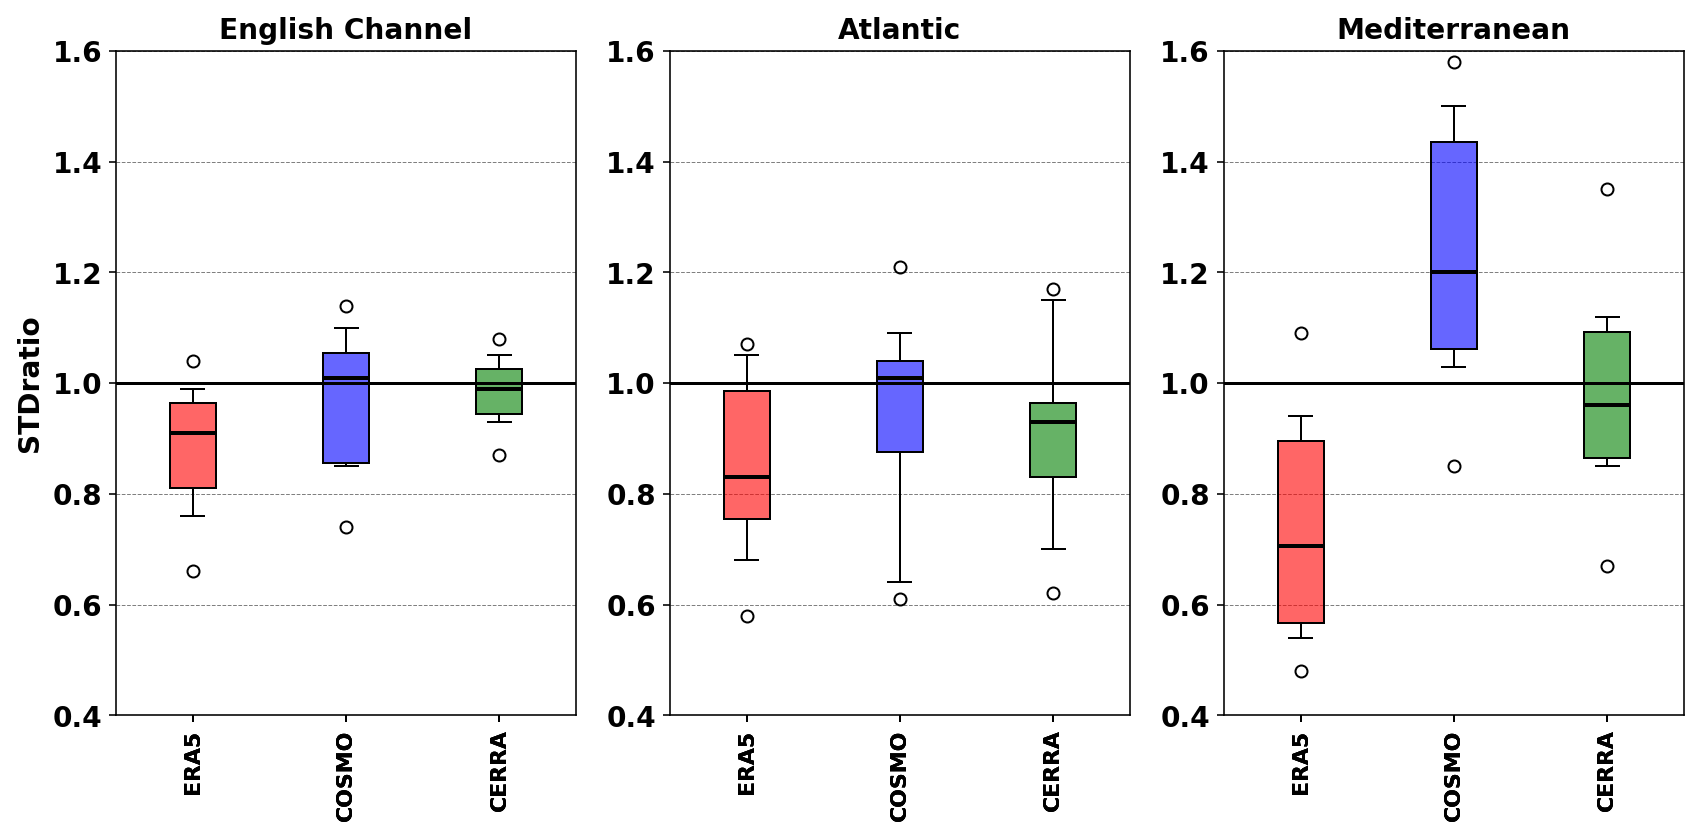
Figure 6Same as Fig. 3, but for the distribution of Normalized standard deviation over the stations.
The normalized standard deviation depicts less variability (<1.0) in the reanalyses when compared to the SYNOP measurements (Fig. 6), meaning there is less variability in the reanalyses compared to the observation. This is expected as reanalysis are based on models and are therefore not able to accurately represent the most extreme values. The median values are mostly below 1.0 for the reanalyses, except for COSMO-REA6, most notably along the Mediterranean coast. ERA5 has lower variability than the observations for all the coastal locations, and COSMO-REA6 has very high variability in the Mediterranean. However, CERRA represents the temporal variability well for the English Channel and Mediterranean coast. The first and third quartiles of the normalized standard deviation for CERRA are between 0.83 and 1.09. Potisomporn et al. (2023) explained ERA5's underestimation of the hourly wind variability caused by small-scale fluctuations that are not captured by the macro-scale driven ERA5 simulation. The Taylor diagrams for the 3 different coasts (Fig. S6) reflect the above error metrics, summarizing the comparison discussed above.
3.1.2 Seasonal and Diurnal Cycles
The evaluation of the diurnal and seasonal cycles of wind speed in the reanalyses is important for wind farm planning. The seasonal cycles, represented by monthly means for the different French coasts (mean over the stations) are shown in Fig. 7.
In comparison to SYNOP measurements, the shape of the seasonal cycle (Fig. 7, left column) is well represented by each of the reanalyses, although biases exist. For the English Channel, the seasonal cycles for the observations and the 3 reanalyses (Fig. 7, top left panel) show lower values in summer (June, July and August) around 5 m s−1 and higher values during winter (December, January and February) with average values above 7 m s−1. We can see that CERRA is the reanalysis most in agreement with the observations in summer but presents slightly too high values in winter. ERA5 and COSMO-REA6 are in agreement in winter but present low values in summer. Overall, the biases in the reanalyses are small (within 0.5 m s−1). For the Atlantic coast (middle panel), the seasonal cycles of the reanalyses are very close to each other but are lower than the measurements by around 0.3 m s−1, especially in summer. For the Mediterranean coast, larger biases are observed owing to the complexity of processes and wind regimes. COSMO-REA6 has low biases during summer months, but high biases during winter months. The biases in CERRA are below −0.5 m s−1 throughout the year. The wind speeds from CERRA are mostly higher than those of ERA5, in agreement with Jourdier et al. (2023), who showed large differences, especially over mountains (where ERA5 tends to underestimate the wind speeds). Olsen et al. (2019), using wind-speed measurements from Vestas for almost 300 masts spread throughout Europe (including 30 in France), also reported that ERA5 underestimates the wind speed ( m s−1) and that the bias increases with the orographic complexity.
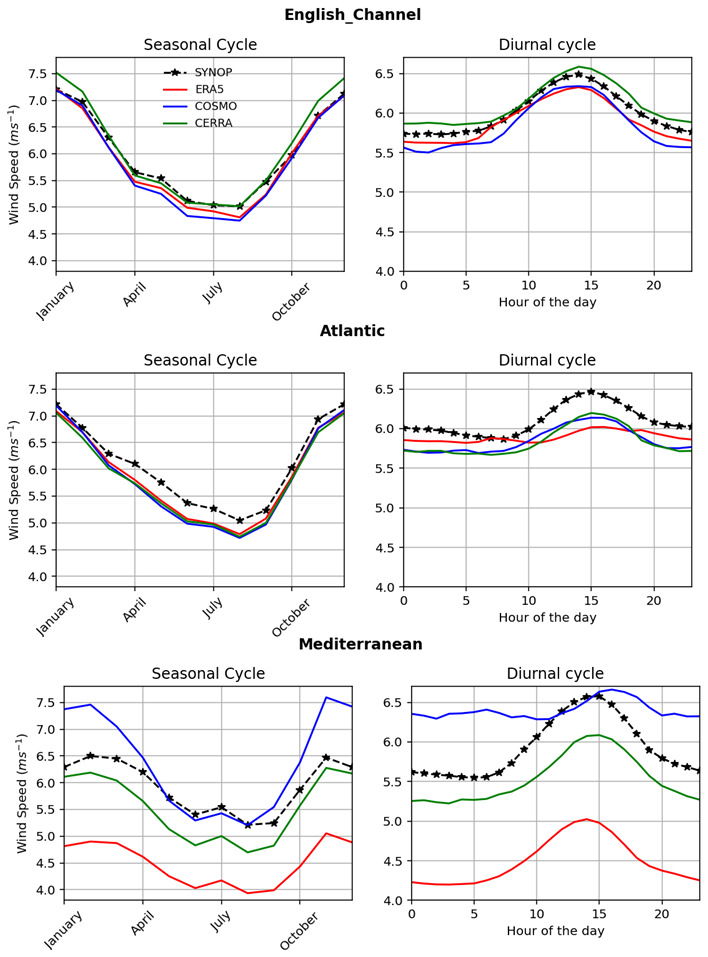
Figure 7Comparison of the seasonal cycle (left column) and the diurnal cycle (right column) for the different French coasts. Each plot is the mean of all the stations on that coast.
The diurnal cycle biases are in a similar range as the seasonal cycle biases (Fig. 7, right column). For the English Channel coast, CERRA is close to the observations, and the shape of the cycle is better represented in CERRA. Although COSMO-REA6 and ERA5 show small underestimations, the shape of the diurnal cycle is represented relatively well. Along the Atlantic coast, the shape of the diurnal cycle in CERRA and COSMO-REA6 agrees well with the measurements, with a bias of −0.2 m s−1. The diurnal cycle in ERA5 is relatively flatter for the station mean. This is associated with a daytime negative bias, when higher wind speed prevails (Fig. S7). For the Mediterranean coast, CERRA represents well the shape of the observed diurnal cycle (bias m s−1). The form of the diurnal cycle in COSMO-REA6 is worse, and ERA5 shows a larger (around −1.5 m s−1) underestimation. Jourdier (2020) emphasized that ERA5 shows very good skill in reproducing the diurnal cycle, even in complex environments: there is indeed a bias, but the shape is correct. The issue in diurnal cycle in COSMO-REA6 can be linked to difficulties with stable conditions, with nocturnal low-level jets and with vertical mixing after sunrise, originating from the boundary layer turbulence scheme in the COSMO model (Heppelmann et al., 2017). The daytime negative bias in COSMO-REA6 persists during summer but is replaced by a stronger positive bias throughout both day and night in winter (Fig. S7).
The PBIAS in seasonal and diurnal cycles is similar to the PBIAS using hourly data (Fig. 3), thus is not discussed here. The shape of the seasonal cycle in the reanalyses (as seen in Fig. 7) can be better evaluated by its correlation with the observed seasonal cycle. Figure 8 displays that the correlation is always high (>0.9) for the reanalysis seasonal cycles, except for a station in the Mediterranean (see also Fig. S8). Nevertheless, reanalyses always show a decent correlation (>0.70) with measurement (also reported by Potisomporn et al., 2023). Overall, considering the correlation, all reanalyses perform well for the English Channel and the Atlantic coast. Along the Mediterranean coast, CERRA has better correlation values for the seasonal cycle.
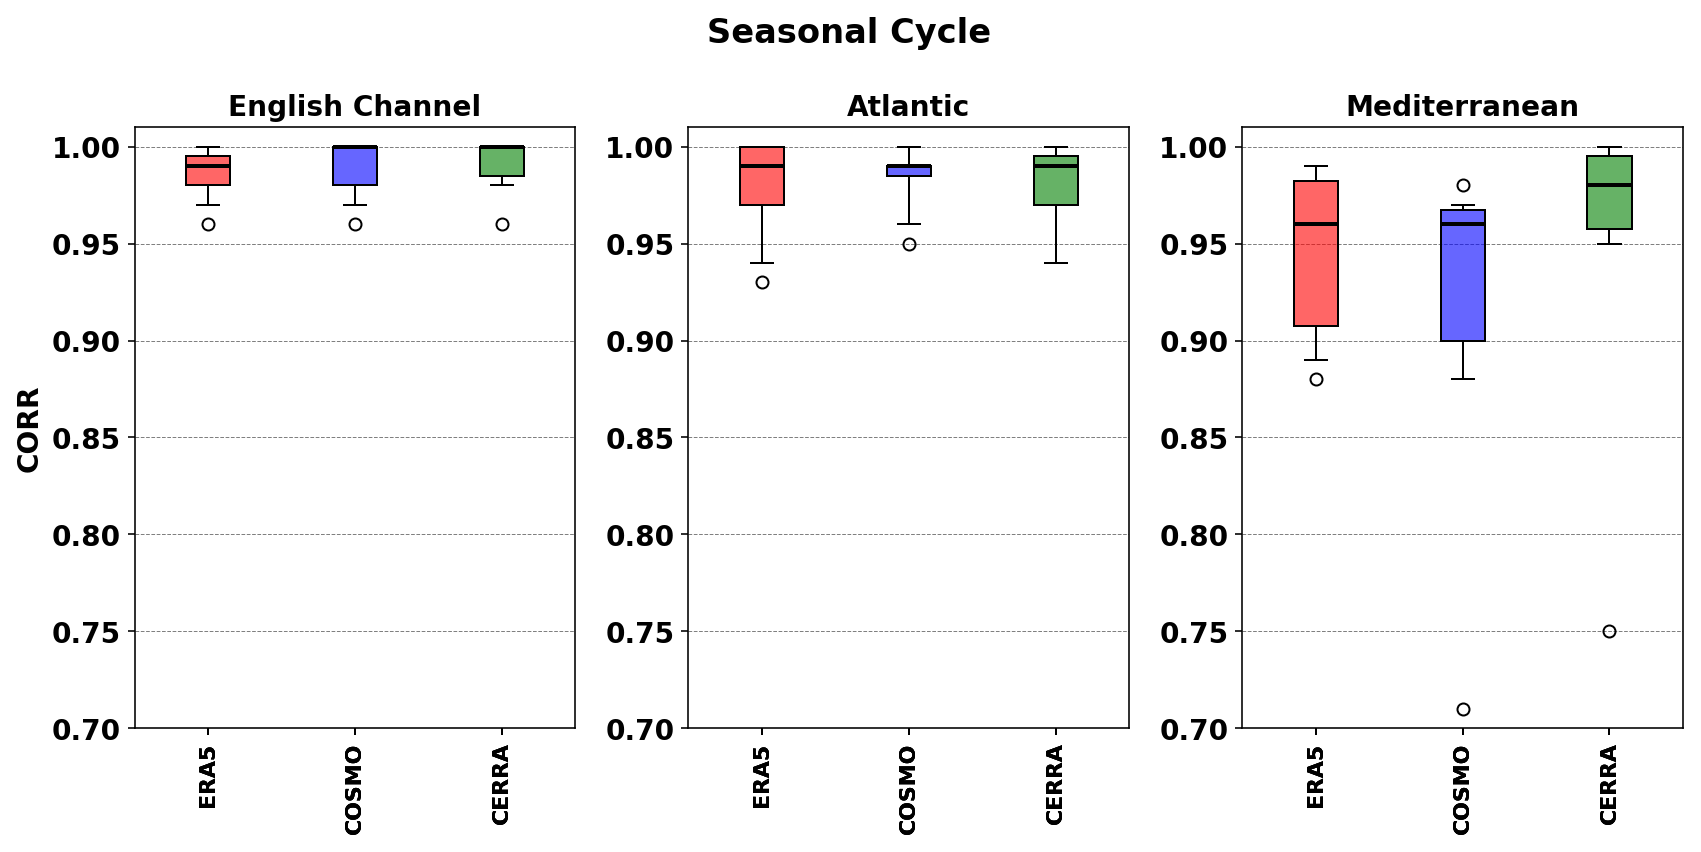
Figure 8Box–Whisker plots for the distribution (across the stations) of the Correlation Coefficients of the seasonal cycle for 10 m wind speed between the reanalysis and the SYNOP measurements.
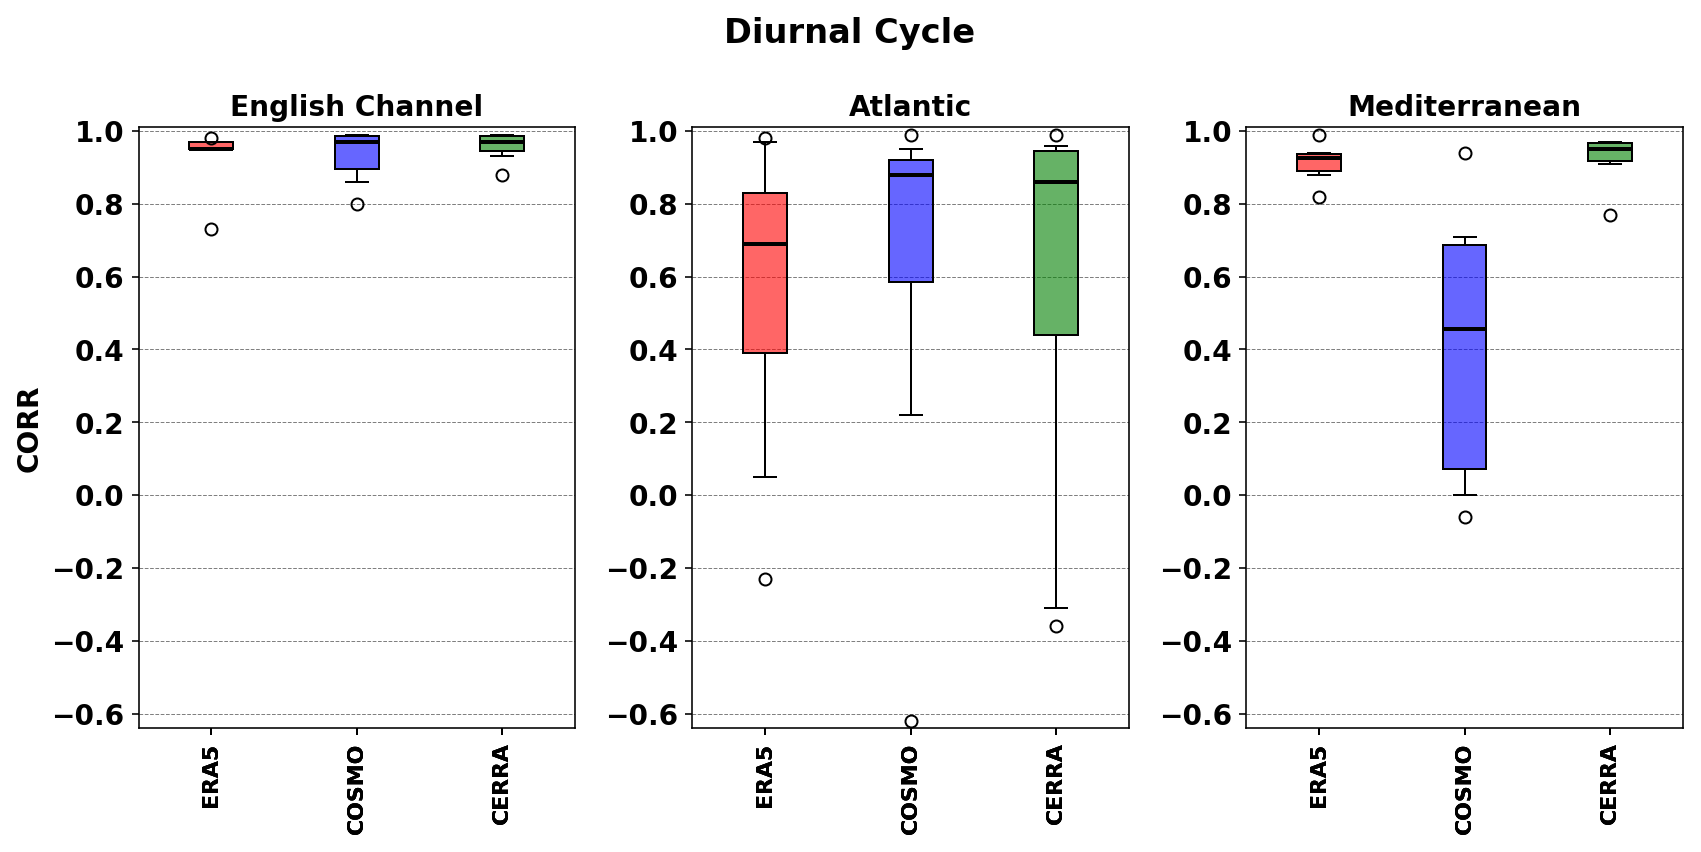
Figure 9Box–Whisker plots for the distribution (across all stations) of the Correlation Coefficients of the diurnal cycle for 10 m wind speed between the reanalysis and the SYNOP measurements.
The diurnal cycle correlations (Fig. 9) are not always as high as the seasonal cycle correlations (Fig. 8). For the English Channel, the reanalyses have high correlations (1st quartile >0.9) with the measurements, while in the Mediterranean, all but COSMO-REA6 (also clear from Fig. 7) have high correlation values. Along the Atlantic coast, some low and even negative correlations are observed, but mostly for island locations (also see Fig. S9). However, the median values are close to 0.9 for CERRA and COSMO-REA6 there. Moreover, the first and third quartiles of the correlations go from 0.59 to 0.92 for COSMO-REA6, and 0.44 to 0.95 for CERRA. The third quartiles are below 0.85 for ERA5.
3.1.3 Inter-annual variability and distribution
The reanalyses can overall capture the interannual variation (Fig. 10), in agreement with Spangehl et al. (2023), who reported that ERA5, COSMO-REA6, and CERRA reproduce well the interannual variations in wind speed. For the period around 2000, there are biases (∼0.4 m s−1) in the Atlantic coast station mean (primarily from 3 stations). During that period, there were much higher wind speeds in northern France, related to a very positive phase of the North Atlantic Oscillation (Jourdier, 2020). For the Mediterranean coastline, the underestimation by ERA5 and overestimation by COSMO-REA6 are also obvious (Fig. 10); but overall, a good correlation (>0.75) is found between the reanalyses and the measurements for the annual mean time series. The reanalyses show negative trends for the English Channel and Atlantic Coast. Such a trend is not clear along the Mediterranean coast where the observed trend seems on the contrary to be rather positive.
The cumulative distribution function (CDF) shows that the distribution of wind speed in all the reanalyses resembles the observed distribution for the full range of wind speeds in the English Channel and along the Atlantic Coast (Fig. 10). Similar observations have been reported for CERRA, COSMO-REA6 and ERA5 in the German Exclusive Economic Zone (EEZ) of the North Sea (Spangehl et al., 2023). However, for the Mediterranean coast, CERRA is closer to the observations, even if the CDF function shows a slight underestimation in CERRA for wind speeds higher than 6 m s−1. The ERA5 distribution is shifted towards low values for all wind regimes. The distribution obtained from COSMO-REA6 shows a slight shift towards higher values for high wind regimes, which also agrees with Spangehl et al. (2023).
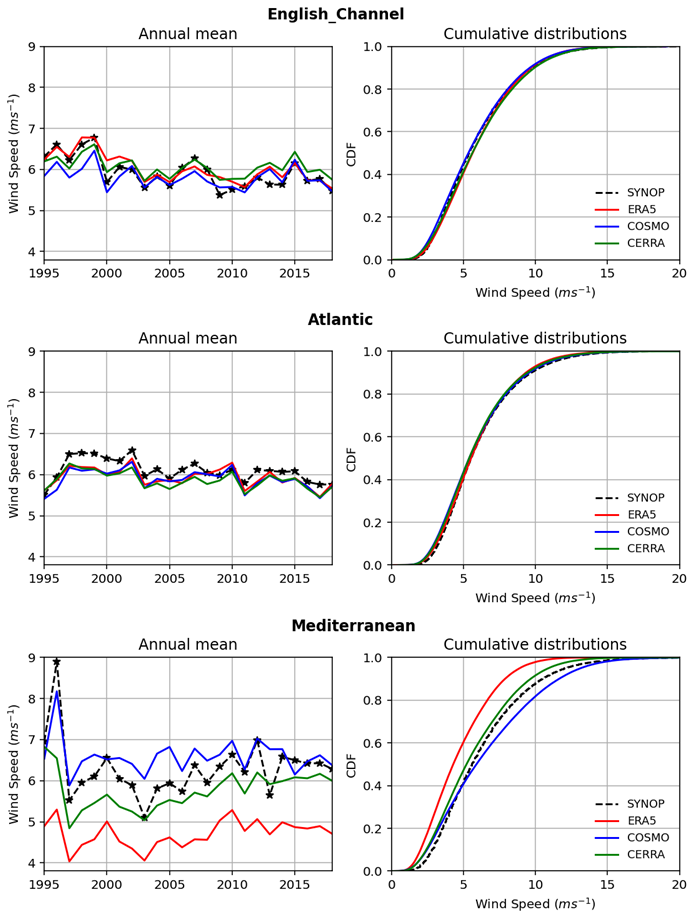
Figure 10Comparison of the (mean over the stations) annual mean time series (left column) and Cumulative distribution function (right column) for the different French coasts.
3.1.4 Low and high wind speeds
Low (5th) and high (95th) percentiles of 10 m wind speeds are evaluated at the 24 coastal weather locations over the period 1995–2018 (Fig. 11). Here we choose percentiles from 10 m winds for extremes instead of winds beyond wind turbines' cut-in and cut-off limits. Indeed, the cut-in and cut-out wind speeds refer to the wind speed at the hub height of the wind turbine, which depends on wind turbine characteristics, and varies with the type of wind turbine technology.
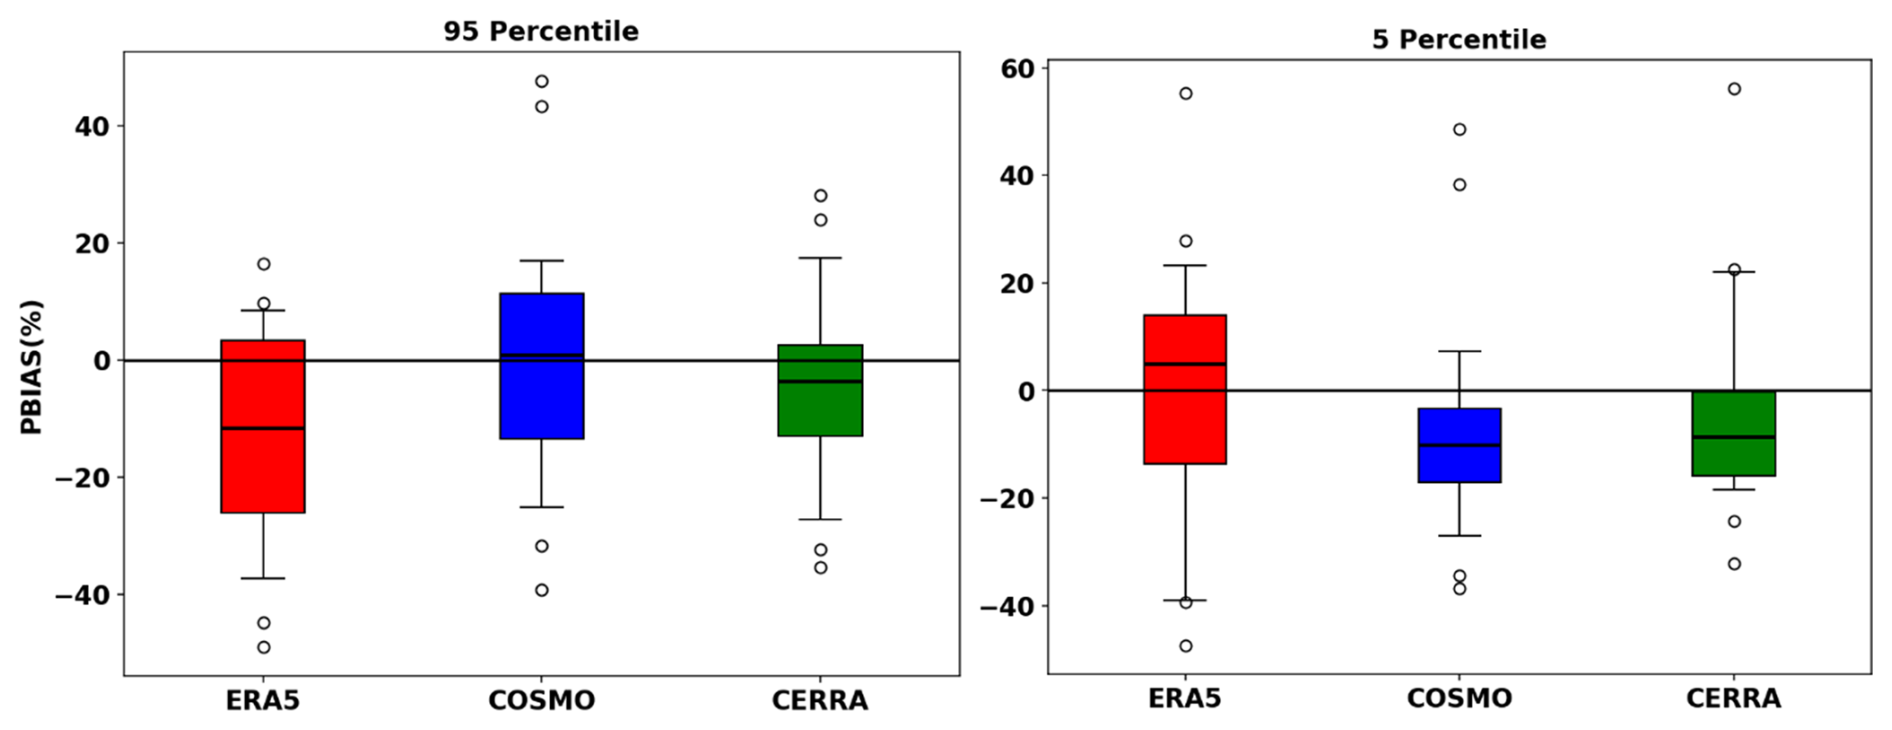
Figure 11Box–Whisker plots for the distribution of PBIAS (%) for all the 24 stations for the 95th and 5th percentiles.
For the 95th percentile, ERA5 shows a large underestimation (also see Fig. S10), and COSMO-REA6 has a median bias value close to 0. The first and third quartiles ranges are −12.9 % to 2.6 % for CERRA and −13.3 % to 11.4 % for COSMO-REA6. The median values (Fig. 11) for ERA5, COSMO-REA6, and CERRA are −11.6 %, 0.9 %, −3.5 %, respectively.
For the 5th percentile, a systematic shift towards negative bias values is found for CERRA (median bias: −8.6 %) and COSMO-REA6 (median bias: −10.2 %), and the first and third quartiles ranges are −15.7 % to −0.2 % and −17.0 % to −3.3 %, respectively (Fig. 11). A larger range of biases is observed for ERA5 (also see Fig. S11), although the median values are low (4.8 %).
Considering the station mean for each coast (Fig. S12), ERA5 underestimates high percentiles along all coasts, and overestimates the low percentiles (except in the Mediterranean), although by a smaller margin. For the English Channel and Atlantic coast, CERRA and COSMO-REA6 are very close and have similar interannual variations for both high and low percentiles. In the Mediterranean, both the 5th and 95th percentiles wind speeds are better represented by CERRA. For the correlations, higher values are observed for the higher percentiles, and lower values are observed for the lower percentiles. The reanalyses display negative tendency in the English Channel and along the Atlantic coast for the high and low percentiles, in agreement with mean values.
3.2 Evaluation of 100 m Wind Speed with LiDAR
Reanalyses are evaluated based on the 10 m wind speed because observations at that height are available over an extended period. However, it is also necessary to evaluate the 100 m offshore wind speed from the reanalyses, which is more relevant for wind energy projects. The measurements for 100 m wind speed data are from floating LiDAR, although available over shorter periods. Considering the common data availability, all 3 reanalyses can be evaluated at the stations of Groix and Oleron (Atlantic coast, Fig. 1).
The error metrics are computed during the common time period between the LiDAR measurements and the reanalyses. Overall, the reanalyses show low PBIAS (<10 %) and NRMSE (<10 %), high correlations (>0.9), and normalized standard deviations close to 1 for 100 m wind speed at all the stations (Table S3). Despite the relatively coarse spatial resolution of ERA5, Cañadillas et al. (2023) reported that the ERA5 data shows high correlations with wind speed from LiDAR located on Norderney Island near the German mainland. CERRA has lower biases than COSMO-REA6 and global reanalyses (Table S3).
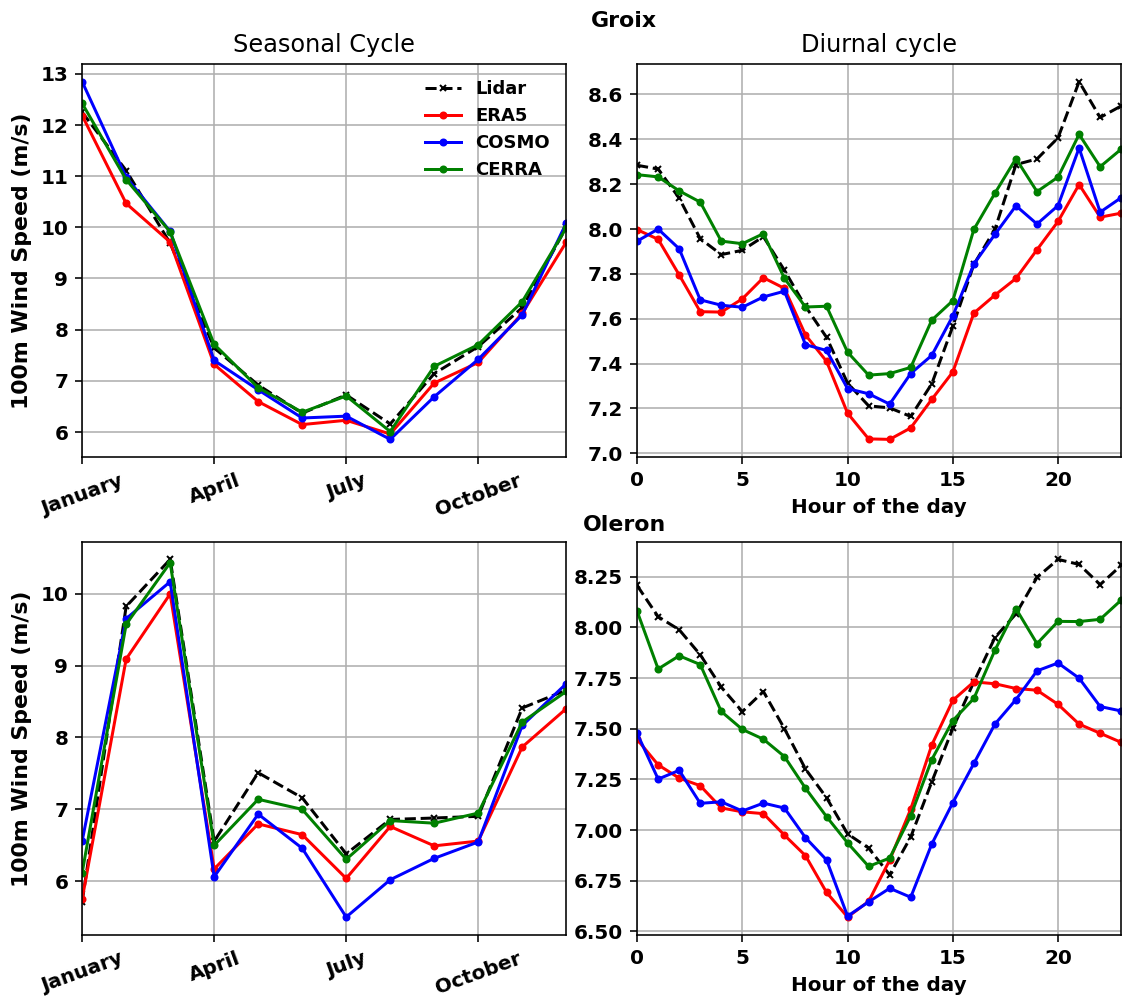
Figure 12Comparison of the seasonal (left column) and diurnal (right column) cycle between the different reanalyses and the LiDAR measurements.
The shape of the seasonal cycle (Fig. 12, left column)) from reanalyses agrees well with the LiDAR observations. The biases are low (<1–1.5 m s−1) for all reanalyses, and CERRA has the smallest bias (< 0.1 m s−1). Similar negative biases (∼1 m s−1) are reported for ERA5 in comparison to LiDAR by Pronk et al. (2022). The regional reanalyses COSMO-RA6 and CERRA show small biases and the global reanalysis ERA5 slightly underestimates the wind speed measurements near 100 m at the FINO1 research platform (Spangehl et al., 2023). Rouholahnejad et al. (2024) reports the superiority of CERRA compared to ERA5, and ERA5 systematically underestimates the 100 m wind speed at all sites in the North Sea. In addition, biases are smaller during winter months than summer months. Considering the shape of the diurnal cycles (Fig. 12), the reanalyses show reasonable agreement with the LiDAR measurements. The negative bias in diurnal cycles of the reanalyses are within the spread of the reanalyses. CERRA has the smallest bias among the reanalyses at these Atlantic coastal locations. It must be noted that limited LiDAR data availability is the reason to initially evaluate the reanalysis using widely available surface observation.
The wind energy industry often relies on reanalysis datasets for different activities such as the assessment of the wind energy resources in a particular region. In this study, the quality of 10 and 100 m wind speeds from ERA5, COSMO-REA6 and CERRA are evaluated along different coastlines of mainland France. The larger part of the evaluation is focused on 10 m wind speeds due to much greater measurement data availability at this height. The reference datasets are SYNOP wind measurements at 10 m height (Météo-France, 24 coastal weather stations), and LiDAR measurements at 100 m height (DGEC/Météo-France, 7 offshore stations). The longer data overlapping period (1995–2018) for 10 m wind speed has given the opportunity for a thorough investigation of the seasonal and diurnal cycles, inter-annual variability, distribution, and extreme values. The reanalyses do not seem to perform homogeneously for the three different coastlines of France. Along the Mediterranean coast, larger differences with the measurements (at 10 m height) can be seen for ERA5 (underestimation) and COSMO-REA6 (overestimation). In general, CERRA has low biases for most of the stations along the French coastline. Overall, the reanalyses exhibit high correlation (>0.75) values, with slightly lower values along the Mediterranean coast. The normalized standard deviation shows that CERRA performs well, ERA5 has low variability for most of the locations, and COSMO-REA6 has too much variability in the Mediterranean. The shape of the seasonal cycle for 10 m wind speeds is well represented by all the reanalyses but is underestimated (overestimated) by ERA5 (COSMO-REA6 during winter) along the Mediterranean coast. Considering the diurnal cycle, COSMO-REA6 does not reproduce well the shape along the Mediterranean coast, nor does ERA5 for the Atlantic coast. CERRA can reproduce well the shape of the observed diurnal cycle of the 10 m wind speed for all the coasts.
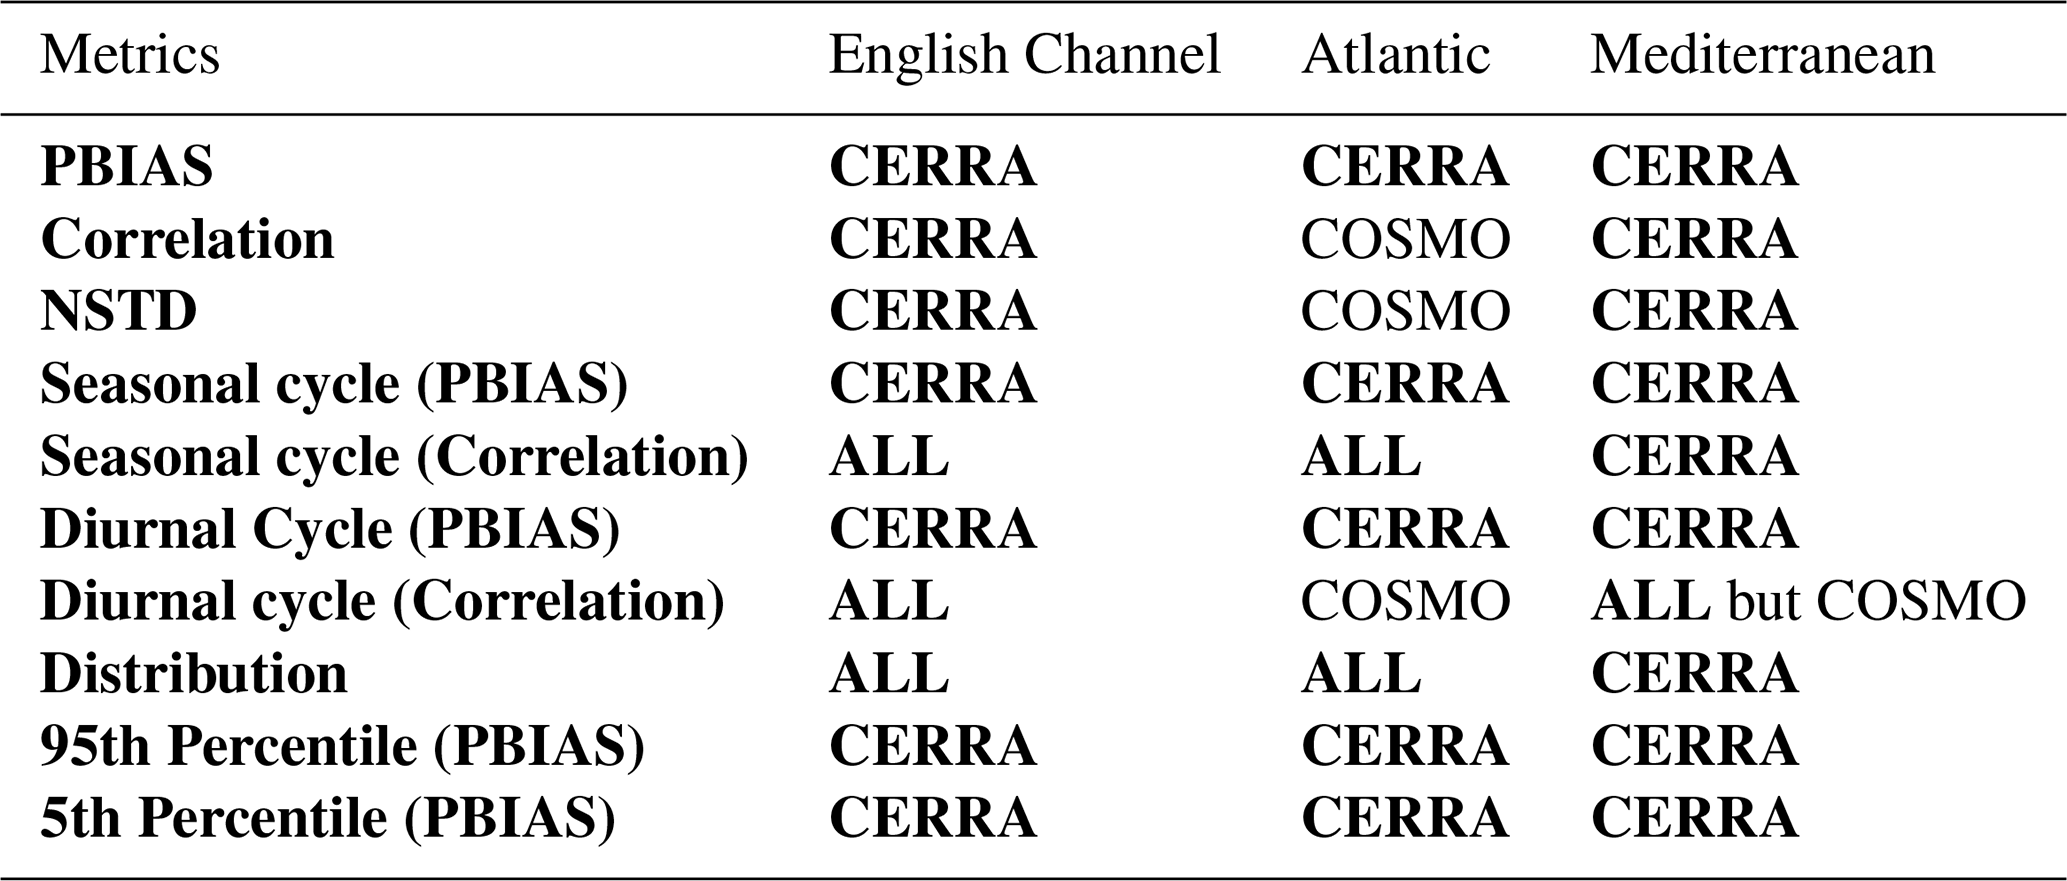
Table 2Best reanalysis for the coasts and for different metrics. CERRA (& ALL: to imply 3 reanalyses) is in bold to highlight its very frequent appearances in the table.
In reanalyses, the modeled wind speeds can be highly sensitive to the boundary layer scheme used. The limitation in planetary boundary layer (PBL) turbulence scheme can cause the decoupling of the surface layer from heights in the upper boundary layer (MacDonald and Teixeira, 2020). Therefore, to avoid decoupling, models artificially enhance the turbulent mixing more than the original empirical stability function, which leads to development of a low-level cool bias, but can improve other model performance aspects (MacDonald and Teixeira, 2020; Sandu et al., 2013; Holtslag et al., 2013). The consistent underestimation of ERA5 can be explained by the PBL scheme (Fragano and Colle, 2025), coarser resolution, and terrain complexity. The reanalyses have better accuracy in flat regions, and poorer accuracy in complex regions (Xu et al., 2025). The underestimation of strong wind speeds offshore in ERA5 is related to surface drag formulation and its sea state, especially under short fetch (Gandoin and Garza, 2024). The better performance of CERRA as compared to ERA5 is due to a better resolved topography in the system. COSMO-REA6, owing to its finer resolution (lesser distance from measurement point in Table S4), outperforms ERA5 in relatively flat terrain of the Atlantic coast. However, in the complex terrain of the Mediterranean region, the diurnal cycle in COSMO-REA6 is not captured well, which is likely related to the boundary-layer scheme.
In addition to a realistic average, the reanalyses should also have realistic variability. Diurnal variability of the wind resource is of great importance to estimate the amount of energy produced at peak or off-peak hours, which will have very different impacts on balancing generation and demand (Jourdier, 2020). The reanalyses can reproduce well the interannual variations that are present in the measurements. The low percentiles are underestimated by COSMO-REA6 and CERRA, and the high percentiles are underestimated by ERA5. The 100 m wind speed from ERA5, COSMO-REA6, and CERRA can reproduce the shape of the seasonal and diurnal cycles observed in the LiDAR measurements (although the analysis is limited by the short period available for the LiDAR measurements), but CERRA has the smallest bias. Eventually, the best reanalysis for each coast and for each metric is summarized in Table 2 (all metrics are provided in Table S5), considering both the median and inter-quartile range of the stations at each coast. CERRA performs well in many aspects, and thus appears to be the optimal reanalysis to use as a reference for offshore wind studies over the French maritime zone, notably as a reference for the bias correction of climate projections.
A follow-up study will focus on evaluating the stability profiles (shear) across seasons from these reanalyses and include new upcoming reanalyses, for example: COSMO-R6G2, which used ERA-5 instead of ERA-Interim as boundary conditions.
Reanalysis and SYNOP data are publicly available online and links are given in the description of data. LiDAR data are not publicly available and has to be asked from DGEC.
The supplement related to this article is available online at https://doi.org/10.5194/asr-22-69-2025-supplement.
AP: Writing – original draft, Visualization, Validation, Software, Resources, Methodology, Formal analysis, Data curation. BO: Writing – review & editing, Validation, Methodology. TC: Visualization. PR: Writing – review & editing. YK: Writing – review & editing, Validation, Methodology, Data curation. LD: Writing – review & editing, Validation.
The contact author has declared that none of the authors has any competing interests.
Publisher's note: Copernicus Publications remains neutral with regard to jurisdictional claims made in the text, published maps, institutional affiliations, or any other geographical representation in this paper. While Copernicus Publications makes every effort to include appropriate place names, the final responsibility lies with the authors. Views expressed in the text are those of the authors and do not necessarily reflect the views of the publisher.
This article is part of the special issue “EMS Annual Meeting: European Conference for Applied Meteorology and Climatology 2024”. It is a result of the EMS Annual Meeting 2024, Barcelona, Spain, 2–6 September 2024. The corresponding presentation was part of session OSA2.1: Energy Meteorology.
The authors thanks the members of the 2C NOW project, within which this study is integrated, as well as the DGEC for providing the LiDAR data.
This research has been supported by France Energies Marines and its members and partners, as well as French State funding managed by the National Research Agency under the France 2030 investment plan (grant no. ANR-10-IEED-0006-34).
This paper was edited by Ekaterina Batchvarova and reviewed by two anonymous referees.
Bentamy, A. and Croize-Fillon, D.: Spatial and temporal characteristics of wind and wind power off the coasts of Brittany, Renewable Energy, 66, 670–679, https://doi.org/10.1016/j.renene.2014.01.012, 2014.
Bloomfield, H. C., Brayshaw, D. J., Shaffrey, L. C., Coker, P. J., and Thornton, H. E.: Quantifying the increasing sensitivity of power systems to climate variability, Environmental Research Letters, 11, 124025, https://doi.org/10.1088/1748-9326/11/12/124025, 2016.
Bollmeyer, C., Keller, J. D., Ohlwein, C., Wahl, S., Crewell, S., Friederichs, P., Hense, A., Keune, J., Kneifel, S., Pscheidt, I., Redl, S., and Steinke, S.: Towards a high-resolution regional re-analysis for the European CORDEX domain, Quarterly Journal of the Royal Meteorological Society, 141, 1–15, https://doi.org/10.1002/qj.2486, 2015.
Cañadillas, B., Wang, S., Ahlert, Y., Djath, B., Barekzai, M., Foreman, R., and Lampert, A.: Coastal horizontal wind speed gradients in the North Sea based on observations and ERA5 reanalysis data, Meteorologische Zeitschrift, 32, 207–228, https://doi.org/10.1127/metz/2022/1166, 2023.
Cannon, D. J., Brayshaw, D. J., Methven, J., Coker, P. J., and Lenaghan, D.: Using reanalysis data to quantify extreme wind power generation statistics: A 33-year case study in Great Britain, Renewable Energy, 75, 767–778, https://doi.org/10.1016/j.renene.2014.10.024, 2015.
Carvalho, D., Rocha, A., Gómez-Gesteira, M., and Santos, C. S.: WRF wind simulation and wind energy production estimates forced by different reanalyses: Comparison with observed data for Portugal, Applied Energy, 117, 116–126, https://doi.org/10.1016/j.apenergy.2013.12.001, 2014a.
Carvalho, D., Rocha, A., Gómez-Gesteira, M., and Santos, C. S.: Offshore wind energy resource simulation forced by different reanalyses: Comparison with observed data in the Iberian Peninsula, Applied Energy, 134, 57–64, https://doi.org/10.1016/j.apenergy.2014.08.018, 2014b.
Clarke, E., Doddy, S., Griffin, F., McDermott, J., Monteiro Correia, C., and Sweeney, C.: Which reanalysis dataset should we use for renewable energy analysis in Ireland?, Atmosphere, 12, 624, https://doi.org/10.3390/atmos12050624, 2021.
Dawkins, L. C.: Weather and climate related sensitivities and risks in a highly renewable UK energy system: a literature review, Crown Copyright, Met Office, Exeter (UK), London, UK, 2019.
Dee, D. P., Uppala, S. M., Simmons, A. J., Berrisford, P., Poli, P., Kobayashi, S., Andrae, U., Balmaseda, M. A., Balsamo, G., Bauer, P., Bechtold, P., Beljaars, A. C. M., van de Berg, L., Bidlot, J., Bormann, N., Delsol, C., Dragani, R., Fuentes, M., Geer, A. J., Haimberger, L., Healy, S. B., Hersbach, H., Hólm, E. V., Isaksen, L., Kållberg, P., Köhler, M., Matricardi, M., McNally, A. P., Monge-Sanz, B. M., Morcrette, J.-J., Park, B.-K., Peubey, C., de Rosnay, P., Tavolato, C., Thépaut, J.-N., and Vitart, F.: The ERA-Interim reanalysis: Configuration and performance of the data assimilation system, Quarterly Journal of the Royal Meteorological Society, 137, 553–597, https://doi.org/10.1002/qj.828, 2011.
Drobinski, P., Coulais, C., and Jourdier, B.: Surface wind-speed statistics modelling: Alternatives to the Weibull distribution and performance evaluation, Boundary-Layer Meteorology, 157, 97–123, https://doi.org/10.1007/s10546-015-0035-7, 2015.
Fan, W., Liu, Y., Chappell, A., Dong, L., Xu, R., Ekström, M., and Fu, T. M.: Evaluation of global reanalysis land surface wind speed trends to support wind energy development using in situ observations, Journal of Applied Meteorology and Climatology, 60, 33–50, https://doi.org/10.1175/JAMC-D-20-0037.1, 2021.
Fragano, C. and Colle, B.: Validation of offshore winds in the ERA5 reanalysis and NREL NOW-23 WRF analysis using two floating LiDARs in the New York Bight, Weather and Forecasting, 40, 1307–1323, https://doi.org/10.1175/WAF-D-24-0155.1, 2025
Gandoin, R. and Garza, J.: Underestimation of strong wind speeds offshore in ERA5: evidence, discussion and correction, Wind Energ. Sci., 9, 1727–1745, https://doi.org/10.5194/wes-9-1727-2024, 2024.
Gualtieri, G.: Analysing the uncertainties of reanalysis data used for wind resource assessment: A critical review, Renewable and Sustainable Energy Reviews, 167, 112741, https://doi.org/10.1016/j.rser.2022.112741, 2022.
Heppelmann, T., Steiner, A., and Vogt, S.: Application of numerical weather prediction in wind power forecasting: Assessment of the diurnal cycle, Meteorologische Zeitschrift, 26, 319–331, https://doi.org/10.1127/metz/2017/0820, 2017.
Hersbach, H., Bell, B., Berrisford, P., Hirahara, S., Horányi, A., Muñoz-Sabater, J., Nicolas, J., Peubey, C., Radu, R., Schepers, D., Simmons, A., Soci, C., Abdalla, S., Abellan, X., Balsamo, G., Bechtold, P., Biavati, G., Bidlot, J., Bonavita, M., De Chiara, G., Dahlgren, P., Dee, D., Diamantakis, M., Dragani, R., Flemming, J., Forbes, R., Fuentes, M., Geer, A., Haimberger, L., Healy, S., Hogan, R. J., Hólm, E., Janisková, M., Keeley, S., Laloyaux, P., Lopez, P., Lupu, C., Radnoti, G., de Rosnay, P., Rozum, I., Vamborg, F., Villaume, S., and Thépaut, J.-N.: The ERA5 global reanalysis, Quarterly Journal of the Royal Meteorological Society, 146, 1999–2049, https://doi.org/10.1002/qj.3803, 2020.
Holtslag, A. A. M., Svensson, G., Baas, P., Basu, S., Beare, B., Beljaars, A. C. M., Bosveld, F. C., Cuxart, J., Lindvall, J., Steeneveld, G. J., Tjernström, M., and Van de Wiel, B. J. H.: Stable atmospheric boundary layers and diurnal cycles: Challenges for weather and climate models, Bulletin of the American Meteorological Society, 94, 1691–1706, https://doi.org/10.1175/BAMS-D-11-00187.1, 2013.
Jourdier, B.: Evaluation of ERA5, MERRA-2, COSMO-REA6, NEWA, and AROME to simulate wind power production over France, Advances in Science and Research, 17, 63–77, https://doi.org/10.5194/asr-17-63-2020, 2020.
Jourdier, B., Diaz, C., and Dubus, L.: Evaluation of CERRA for wind energy applications, EMS Annual Meeting 2023, Bratislava, Slovakia, 4–8 September 2023, EMS2023-311, https://doi.org/10.5194/ems2023-311, 2023.
MacDonald, M. and Teixeira, J.: Scaling behavior of a turbulent kinetic energy closure scheme for the stably stratified atmosphere: A steady-state analysis, Journal of the Atmospheric Sciences, 77, 3161–3170, https://doi.org/10.1175/JAS-D-19-0332.1, 2020.
Miao, H., Dong, D., Huang, G., Hu, K., and Tian, Q.: Evaluation of northern hemisphere surface wind speed and wind power density in multiple reanalysis datasets, Energy, 200, 117382, https://doi.org/10.1016/j.energy.2020.117382, 2020.
Olsen, B. T., Hahmann, A., Žagar, M., Hristov, Y., Mann, J., Kelly, M., and Badger, J.: Mapping the European wind climate: Validation of the New European Wind Atlas, EMS Annual Meeting, 2019, 9–13 September 2019, Lyngby, Denmark, 2019.
Potisomporn, P., Adcock, T. A., and Vogel, C. R.: Evaluating ERA5 reanalysis predictions of low wind speed events around the UK, Energy Reports, 10, 4781–4790, https://doi.org/10.1016/j.egyr.2023.11.035, 2023.
Pronk, V., Bodini, N., Optis, M., Lundquist, J. K., Moriarty, P., Draxl, C., Purkayastha, A., and Young, E.: Can reanalysis products outperform mesoscale numerical weather prediction models in modeling the wind resource in simple terrain?, Wind Energ. Sci., 7, 487–504, https://doi.org/10.5194/wes-7-487-2022, 2022.
Ramon, J., Lledó, L., Torralba, V., Soret, A., and Doblas-Reyes, F.: What global reanalysis best represents near-surface winds?, Quarterly Journal of the Royal Meteorological Society, 145, 3236–3251, https://doi.org/10.1002/qj.3616, 2019.
Ridal, M., Bazile, E., Le Moigne, P., Randriamampianina, R., Schimanke, S., Andrae, U., Berggren, L., Brousseau, P., Dahlgren, P., Edvinsson, L., El-Said, A., Glinton, M., Hagelin, S., Hopsch, S., Isaksson, L., Medeiros, P., Olsson, E., Unden, P., and Wang, Z. Q.: CERRA, the Copernicus European Regional Reanalysis system, Quarterly Journal of the Royal Meteorological Society, 150, 3385–3411, https://doi.org/10.1002/qj.4764, 2024.
Rouholahnejad, F., Meyer, P. J., and Gottschall, J.: Collocating wind data: A case study on the verification of the CERRA dataset, Journal of Physics: Conference Series, 2875, 012016, https://doi.org/10.1088/1742-6596/2875/1/012016, 2024.
RTE: Bilan électrique 2023, RTE, https://assets.rte-france.com/analyse-et-donnees/2024-03/Bilan%20%C3%A9lectrique%202023%20rapport%20complet_29fev24.pdf (last access: 13 November 2025), 2023.
RTE: Futurs énergétiques 2050, Principaux résultats, RTE, https://assets.rte-france.com/prod/public/2021-10/Futurs-Energetiques-2050-principaux-resultats_0.pdf (last access: 13 November 2025), 2021.
Salameh, T., Drobinski, P., Vrac, M., and Naveau, P.: Statistical downscaling of near-surface wind over complex terrain in southern France, Meteorology and Atmospheric Physics, 103, 253–265, https://doi.org/10.1007/s00703-008-0330-7, 2009.
Sandu, I., Beljaars, A., Bechtold, P., Mauritsen, T., and Balsamo, G.: Why is it so difficult to represent stably stratified conditions in numerical weather prediction (NWP) models?, Journal of Advances in Modeling Earth Systems, 5, 117–133, https://doi.org/10.1002/jame.20013, 2013.
Schimanke, S., Ridal, M., Le Moigne, P., Berggren, L., Undén, P., Randriamampianina, R., Andrea, U., Bazile, E., Bertelsen, A., Brousseau, P., Dahlgren, P., Edvinsson, L., El Said, A., Glinton, M., Hopsch, S., Isaksson, L., Mladek, R., Olsson, E., Verrelle, A., and Wang, Z.: CERRA sub-daily regional reanalysis data for Europe on height levels from 1984 to present, CDS [data set], https://doi.org/10.24381/cds.38b394e6, 2021a.
Schimanke, S., Ridal, M., Le Moigne, P., Berggren, L., Undén, P., Randriamampianina, R., Andrea, U., Bazile, E., Bertelsen, A., Brousseau, P., Dahlgren, P., Edvinsson, L., El Said, A., Glinton, M., Hopsch, S., Isaksson, L., Mladek, R., Olsson, E., Verrelle, A., and Wang, Z.: CERRA sub-daily regional reanalysis data for Europe on single levels from 1984 to present, CDS [data set], https://doi.org/10.24381/cds.622a565a, 2021b.
Shen, C., Zha, J., Wu, J., Zhao, D., Azorin-Molina, C., Fan, W., and Yu, Y.: Does CRA-40 outperform other reanalysis products in evaluating near-surface wind speed changes over China?, Atmos Res., 266, 105948, https://doi.org/10.1016/j.atmosres.2021.105948, 2022.
Sheridan, L. M., Krishnamurthy, R., García Medina, G., Gaudet, B. J., Gustafson Jr., W. I., Mahon, A. M., Shaw, W. J., Newsom, R. K., Pekour, M., and Yang, Z.: Offshore reanalysis wind speed assessment across the wind turbine rotor layer off the United States Pacific coast, Wind Energ. Sci., 7, 2059–2084, https://doi.org/10.5194/wes-7-2059-2022, 2022.
Spangehl, T., Borsche, M., Niermann, D., Kaspar, F., Schimanke, S., Brienen, S., Möller, T., and Brast, M.: Intercomparing the quality of recent reanalyses for offshore wind farm planning in Germany's exclusive economic zone of the North Sea, Adv. Sci. Res., 20, 109–128, https://doi.org/10.5194/asr-20-109-2023, 2023.
Wilczak, J., Akish, E., Capotondi, A., and Compo, G.: Evaluation and bias correction of the ERA5 reanalysis over the United States for wind and solar energy applications, Energies, 17, 1667, https://doi.org/10.3390/en17071667, 2024.
Xu, Y., Yu, H., Wang, S., Chai, Y., and Zhang, C.: Comparison of temperature, relative humidity and surface pressure from CERRA, UERRA and ERA5 reanalysis over Europe, Advances in Space Research, 75, 5363–5373, https://doi.org/10.1016/j.asr.2025.01.038, 2025.