
 | 08 Oct 2026
Frost days in the beginning of the growing season for Norway
Helga Therese Tilley Tajet

Reidun Gangstø
Andreas Dobler
Inger Hanssen-Bauer
Hans Olav Hygen
Due to increasing temperatures, the growing season is expanding in Norway, except on glaciers and in high mountain areas. It now starts earlier and ends later in the year, when night–time temperatures may still be low. Therefore, despite a decreasing number of frost days in a generally warmer climate, a longer growing season may lead to an increased risk of frost early or late in the growing season.
Frost early in the growing season can pose a risk for several plant species. In Norway, there have been incidents where fruit crops were destroyed after an unusually warm period followed by a cold spell.
In this study, we show that frost in the beginning of the growing season is already a risk factor in lowland areas of South Norway, with the highest risk in the southeast. Changes between the periods 1961–1990 and 1991–2020 show the largest increase in the number of days along the west coast of South Norway, which is also where the growing season has increased the most. Future scenarios indicate an even higher risk of frost days in the beginning of the growing season along the coast of Norway, except in the northernmost areas. The increase in risk is highest in the same areas where the growing season is projected to increase the most. In contrast, the risk decreases in many inland areas of South Norway.
- Article
(6223 KB) - Full-text XML
- BibTeX
- EndNote


Air temperature is rising as a result of a changing climate (IPCC, 2021). This leads to a longer growing season and fewer frost and cold extremes (IPCC, 2021). Although the number of frost days is decreasing, studies show that the risk of frost after the growing season has started, or in early spring, has increased (e.g. Liu et al., 2018; Nidzgorska-Lencewicz et al., 2024; Vautard et al., 2023; Dyrrdal et al., 2025).
Despite the ongoing warming of the climate, frosts remain a risk to crops (Nidzgorska-Lencewicz et al., 2024). Liu et al. (2018) found a significant increase in frost days during the growing season, despite an overall decline in total frost days, across the Northern Hemisphere between 1982 and 2012, especially in Europe during spring. Frost days in the beginning of the growing season can affect different areas, plant species and agricultural sectors. For example, in France a cold spell in April 2021 damaged grapevines and fruit trees (Vautard et al., 2023). Frost can also affect the uptake of CO2 by damaging trees, resulting in a less effective photosynthesis (Hufkens et al., 2012; Wang et al., 2025).
Press releases in recent years document several examples of frost affecting plum and apple blossom in Norway (Storfossen, 2005; Dalen, 2014; Buaas et al., 2019), as well as blackcurrant (Lile, 2013). A common feature of these years is early flowering, caused by a warm period in early spring followed by a cold spell. Spring 2025 was the warmest on record in the eastern part of South Norway, based on a temperature time series going back to 1901 (Grinde et al., 2025). This led to an early start of the growing season in several areas of Norway. A Norwegian blackcurrant farmer argued that farmers in Norway are insufficiently prepared for cold spells occurring after the beginning of the growing season (Myrvang and Skålevik, 2025). Unlike in France, Norwegian farmers often lack protective equipment such as braziers (“braseros”) used in vineyards to prevent freezing. Timely information on growing season changes and the risk of frost days in the beginning of the growing season can support farm management and climate adaptation.
Several studies indicate that even though the number of frost days continues to decrease in a warmer future climate, there will still be a risk of frost days after the growing season has started because of an earlier start of the growing season. This shift increases frost exposure across agriculture and forestry, for example in French viticulture (Sgubin et al., 2018) and in Norway spruce stands in Sweden (Svystun et al., 2021). In Quebec, Canada, trees with early budburst or leaf–out likewise remain at risk, although the risk is projected to decline (Marquis et al., 2022).
Previous work on frost during the growing season includes historical analyses (Tajet et al., 2025) and future scenario maps made available online and summarized in the national climate report (Dyrrdal et al., 2025). In this paper, we investigate whether the earlier start of the growing season associated with a warmer climate leads to increased frost exposure. We provide a systematic assessment of historical and projected changes across Norway, including the full distribution of frost risk and regional differences under different emission scenarios.
2.1 Data
For this work, we used both historical data (from observations and gridded datasets) and future climate projections. Observations from meteorological stations in Norway are available at http://seklima.met.no (last access: 5 October 2026) or http://frost.met.no (last access: 5 October 2026). The temperature is measured at 2 m height. These observations were used to study historical changes in frost days in the beginning of the growing season for the two historical normal periods 1961–1990 and 1991–2020.
Observation–based gridded data at daily resolution are used for the same historical normal periods. The dataset has a 1 km × 1 km grid resolution and covers mainland Norway. It is available from 1957 to the present (Lussana et al., 2019; Lussana, 2020c). The latest version available at the outset of this study, seNorge2018 version 20.05, is used for the time period 1961–2020 to study historical development. Grid–cell values represent area averages and are therefore not directly comparable to point observations from individual stations (e.g. Smith et al., 2025). Gridded datasets provide a representative picture for nationwide analyses, but very local phenomena may be smoothed and not fully captured.
Additionally, bias-adjusted daily climate projections of temperature are analysed for the periods 2041–2070 and 2071–2100. The future climate projections follow the scenarios RCP2.6, RCP4.5 and SSP3-7.0, representing low, medium and high emissions. The bias-adjusted data are based on an ensemble from EURO-CORDEX (Jacob et al., 2020) consisting of ten regional climate model simulations for each scenario (Table A1), downscaled for Norway to the same resolution as the historical data (1km × 1km). More details on the bias-adjusted data, methods and model selection can be found in Huang et al. (2026). The complete set of daily bias-adjusted data is freely available at the Arctic Data Centre (Wong et al., 2025).
We use gridded data to obtain a spatially complete picture for nationwide analyses, complemented by station data to provide more detailed information at selected locations. For the current climate, we analyse historical time periods. For future climate, we consider three different scenarios to capture the range of possible developments.
2.2 Thermal growing season and frost days
The growing season depends on several factors, including temperature, insolation, precipitation and snow cover. This paper focuses on the thermal growing season. For Nordic countries, Carter (1998) recommended a daily mean air temperature above 5 °C as a threshold for active plant growth. Skaugen and Tveito (2004) used this threshold temperature in their study of the start and end of the growing season for Norway and applied the average monthly temperature to get smoothed daily mean temperatures for 30-year periods. Due to the smoothing curve, this method does not include fluctuations around the 5 °C threshold. However, to study frost days after the beginning of the growing season, a smoothed daily curve is not sufficient. The start of the growing season must be defined for each individual year in order to count the frost days after this date. In the present study, we have thus used the definition recommended by the “Expert Team on Climate Change Detection and Indices” (ETCCDI) (Karl et al., 1999; Peterson et al., 2001): at least six consecutive days with a daily mean temperature above 5 °C. The same definition was used by Zhou et al. (2018).
According to ETCCDI, frost days are defined as days when the minimum temperature is below 0 °C (Peterson et al., 2001). We count the number of frost days from the start of the growing season until 1 July, or until the end of the growing season if it occurs before 1 July. We define the end of the growing season as the first day in the last period of the year with six consecutive days of daily mean temperature above 5 °C. 1 July was chosen as the cutoff because agricultural activity in Norway is mainly concentrated in lowland areas where the growing season starts earlier. Our assessment therefore focuses on early–season frost risk, which is most relevant for these regions.
Estimates of frost days depend on how the start of the growing season is defined. Counts differ when the start is taken as the midpoint of the six consecutive days of daily mean temperature above 5 °C versus the end of that window. In our historical analysis, we define the start of the growing season at the end of the six-day period and count frost days from day 7 onward. This contrasts with Tajet et al. (2025) and Dyrrdal et al. (2025), who set the start of the growing season at the midpoint. For the future period, we use the midpoint definition because we use the same future dataset as Dyrrdal et al. (2025). A sensitivity check for the historical period (comparing the two definitions) indicates that frost days can occur within the six-day window as the growing season begins. However, differences between the two definitions in the 30-year median number of frost days are generally no greater than one day, with local maxima of three days (not shown).
2.3 Methods
Some years include short warm spells of six consecutive days with temperatures above 5 °C early in the year. These episodes activate the growing season index. However, such brief warm episodes are usually false starts to the growing season (Davis, 1972; Cornes et al., 2019) and artificially increase the number of frost days in the early season. To reduce the impact of single years with an early false start, we use the 30-year median instead of the mean.
Agricultural land in Norway ranges from near sea level to approximately 800–900 m a.s.l., but most of this land is located at low elevations in counties in South Norway (Statistics Norway, 2026). Figure 1 shows the topography of Norway on a 1 km × 1 km grid with county borders. In lowland areas up to about 200 m a.s.l. (light green in Fig. 1), grain is the main crop, and this zone is the primary area for fruit and vegetable production. More inland areas and valleys are dominated by forage production (grass and silage) and livestock farming, although fruit and vegetables are grown in some locations. At higher elevations, from about 500 to 900 m a.s.l., production is mainly grass and summer grazing. Areas above 900 m a.s.l. (white in Fig. 1) contain little cropland. The present study is most relevant for the production of grain, fruit and vegetables, and therefore mainly concerns areas below 500 m a.s.l. (green areas in Fig. 1).
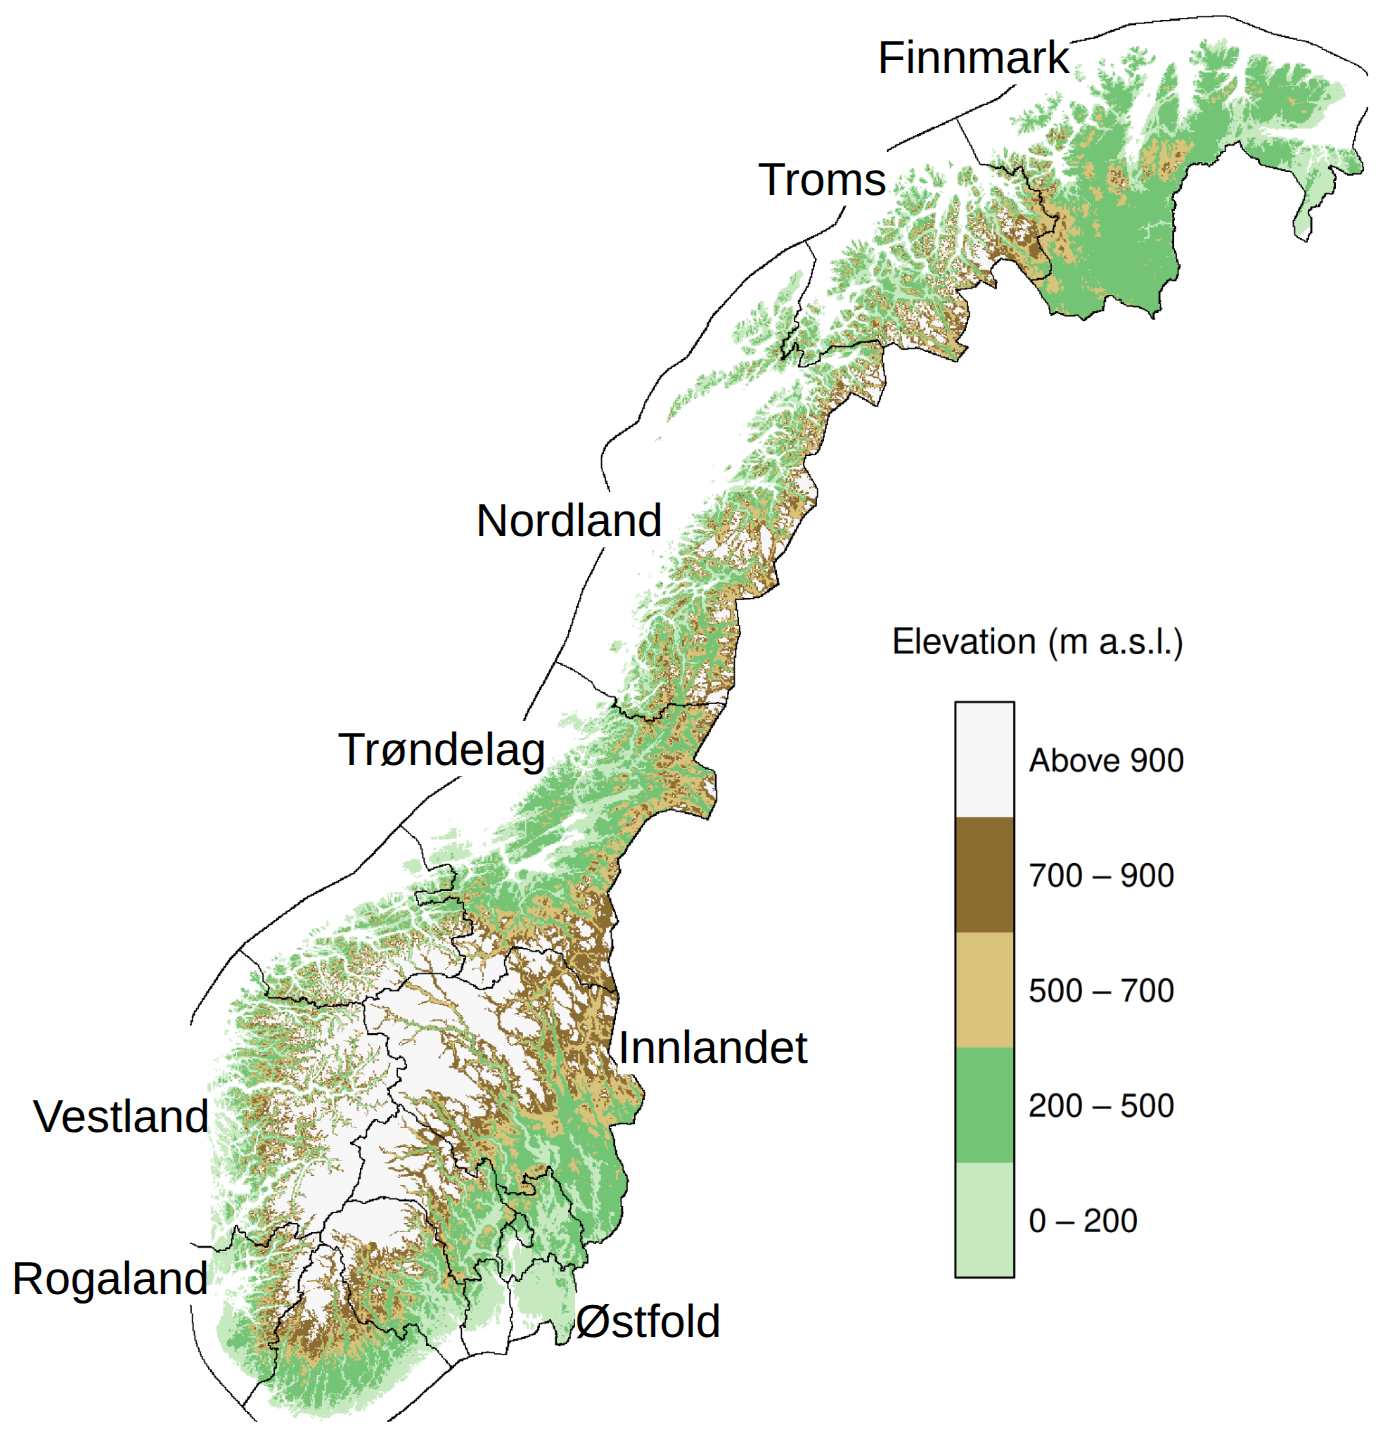
Figure 1Topography of Norway divided into five elevation zones (m a.s.l.). County borders are shown; selected county names are provided.
Consistent with Norwegian administrative geography, “North Norway” denotes the counties of Nordland, Troms and Finnmark from Fig. 1, while “South Norway” includes Trøndelag and all counties to the south. This regional convention is applied throughout the manuscript.
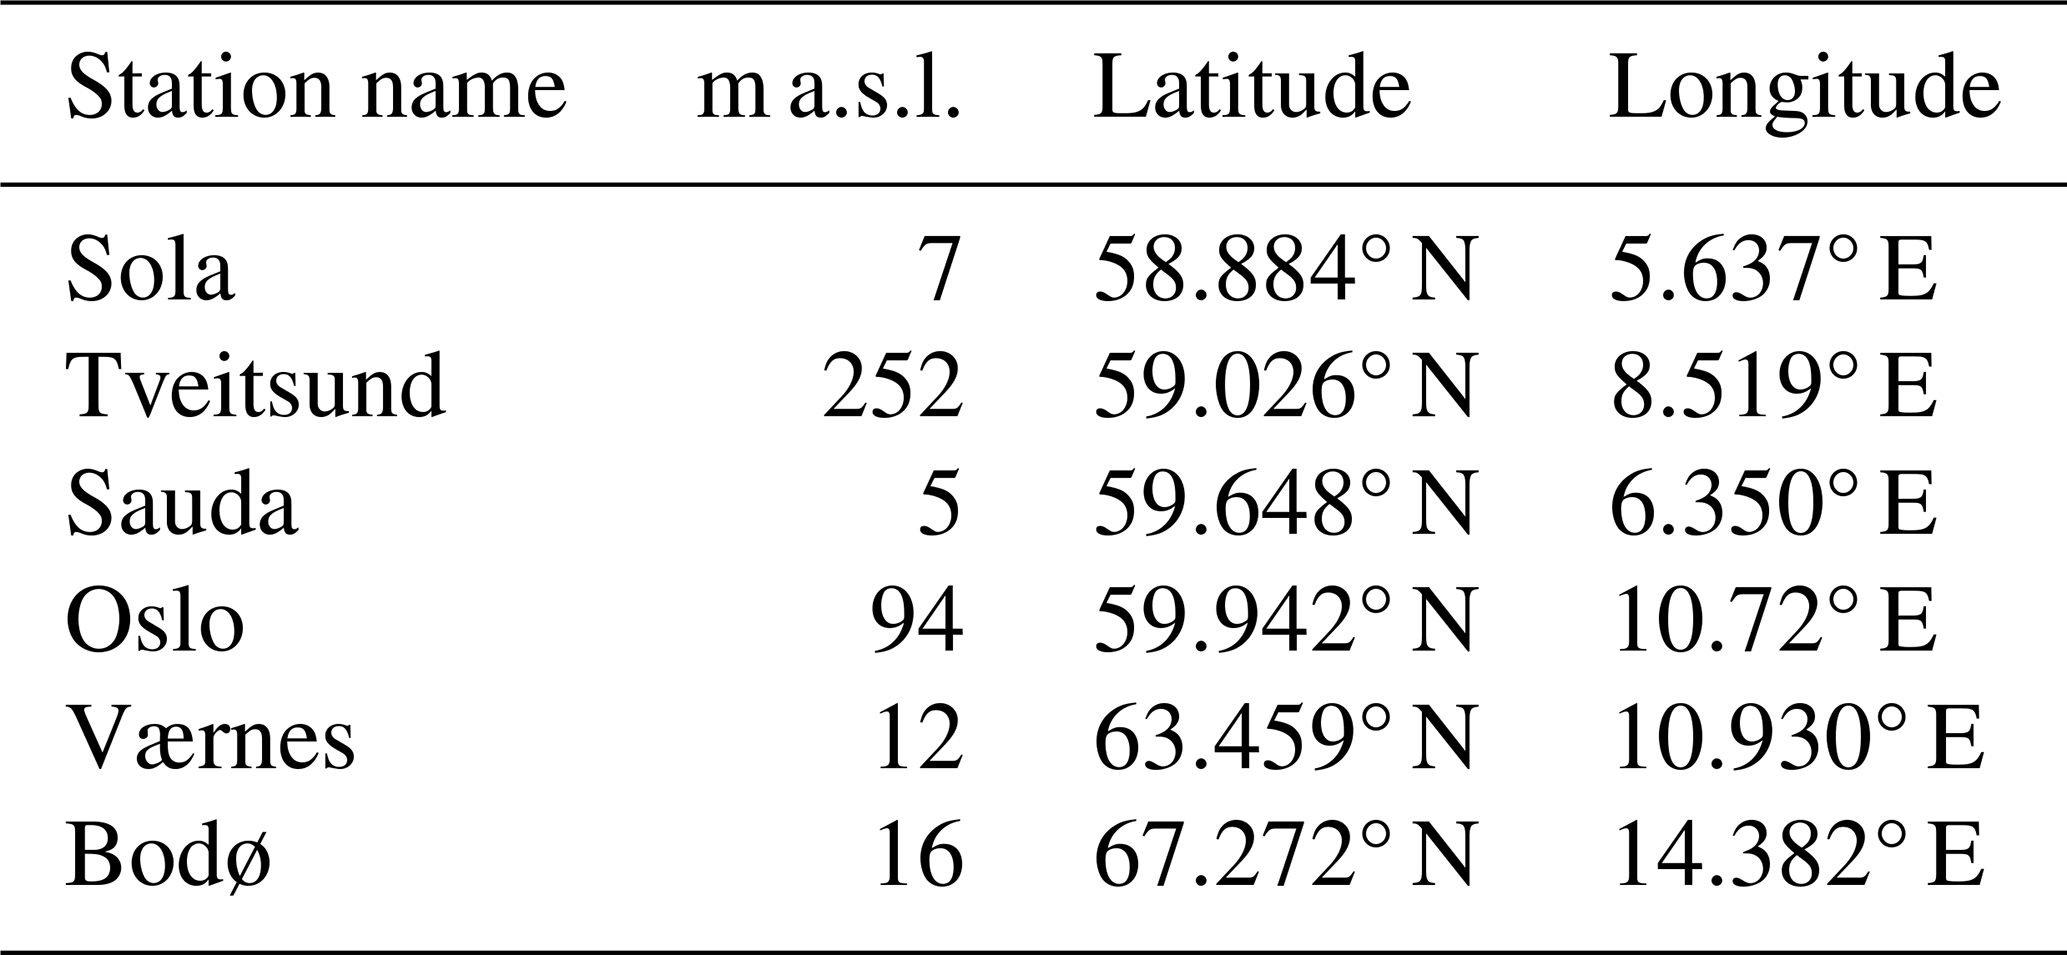
Six meteorological stations representative of major agricultural regions in Norway were analysed. Oslo and Tveitsund represent the eastern sector of South Norway. Sola and Sauda represent the western coastal sector of South Norway. Værnes represents Mid-Norway (Trøndelag) and Bodø represents Nordland in North Norway. Station locations are shown in Fig. 2 (Sect. 3.1.1). Table 1 lists each station's elevation (m a.s.l.) and geographic coordinates (latitude, longitude).
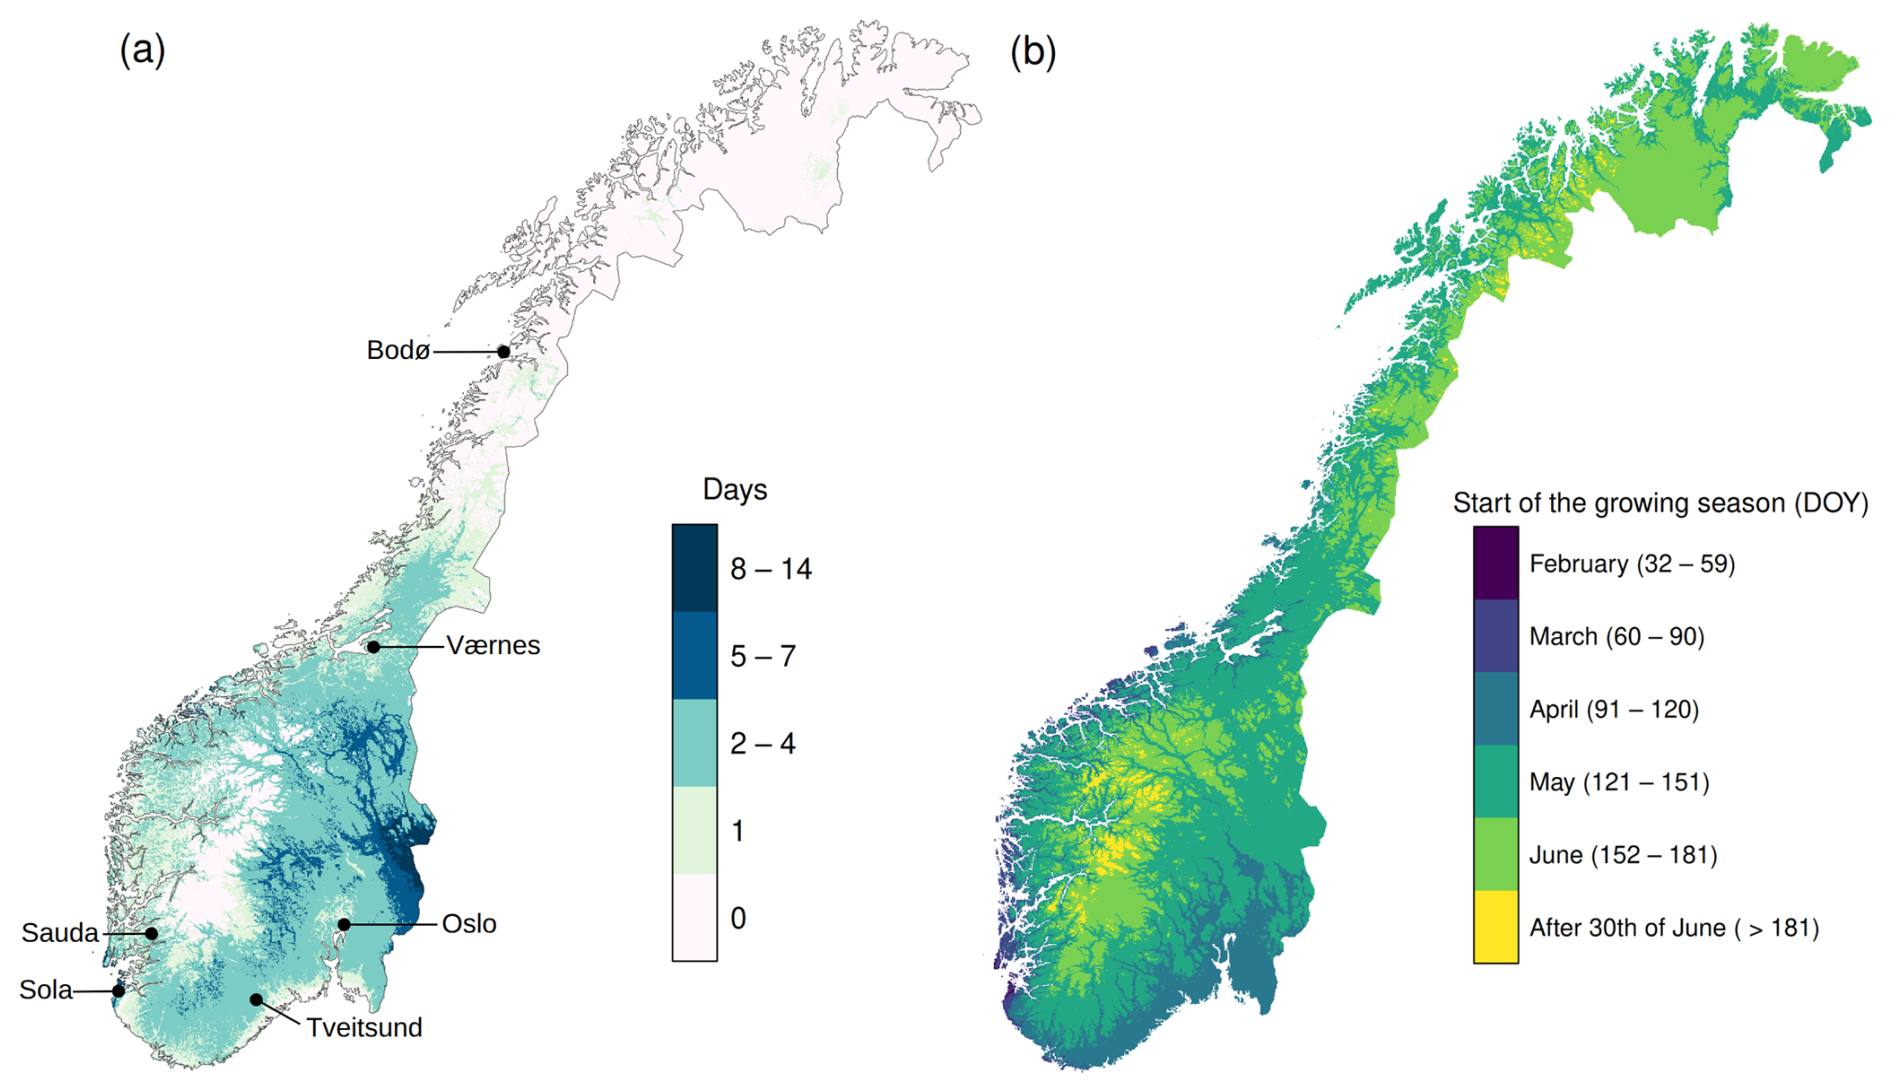
Figure 2(a) Frost days in the beginning of the growing season, median of the period 1991–2020, and location of the six meteorological stations used in this study. (b) Start of the thermal growing season, day of year (DOY), average for the period 1991–2020.
Table 1Location and height above sea level for six selected meteorological stations listed south to north.
Data are incomplete in some years for the stations Sauda and Tveitsund. Years with any missing daily mean or minimum temperature within the period were excluded from the analysis to prevent them from affecting the results (encoded as NA).
3.1 Results
3.1.1 Frost days in the beginning of the growing season for Norway in the present climate (1991–2020)
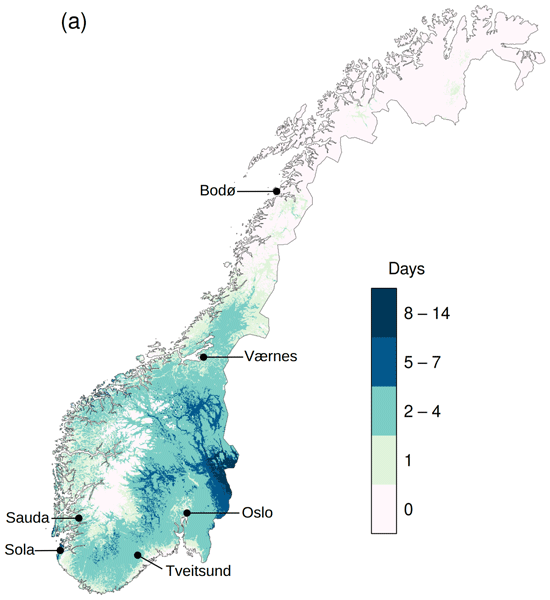
Figure 2a shows the distribution of frost days in the beginning of the growing season for Norway in the period 1991–2020. The number of frost days (30-year median) ranges from 0 to 14 d. In most parts of South Norway there are frost days in the beginning of the growing season, except in some mountain areas and in parts of the coastal zone. Most areas have between 2 and 4 d, and some areas up to one week. The southeastern parts of South Norway have the highest numbers, with medians of up to 14 frost days in the period. North Norway has very few frost days in the beginning of the growing season. Only some areas in Nordland County (county locations are shown in Fig. 1) have medians of 1–4 frost days, and some areas in Finnmark County have a median of one frost day in the period.
The day of the year the thermal growing season starts in Norway is shown in Fig. 2b, averaged over the period 1991–2020. In coastal areas in the western part of South Norway, the growing season starts in February and March. In the majority of Norway, it starts in April and May. In the mountain areas of Norway and inner parts of the Troms and Finnmark counties, the growing season is short (Dyrrdal et al., 2025), and typically starts in June or even July (Fig. 2b). Consequently, these high–altitude regions exhibit very few frost days in the beginning of the growing season (Fig. 2a), despite experiencing many frost days throughout the year.
In years when the growing season starts very early, the potential number of frost days is high in some areas. To analyse the spatial pattern in years with many frost days in the beginning of the growing season, the 75th and 90th percentiles were calculated for the period 1991–2020 (Fig. 3). The 75th percentile shows that many areas in Norway can have frost days for up to seven days in the beginning of the growing season. Some areas in South Norway can have up to 14 d, and certain coastal areas and a few inland regions can have more than 14 frost days in this period. The 90th percentile (Fig. 3b) shows that in some years the frost exposure can be particularly high, especially in South Norway.
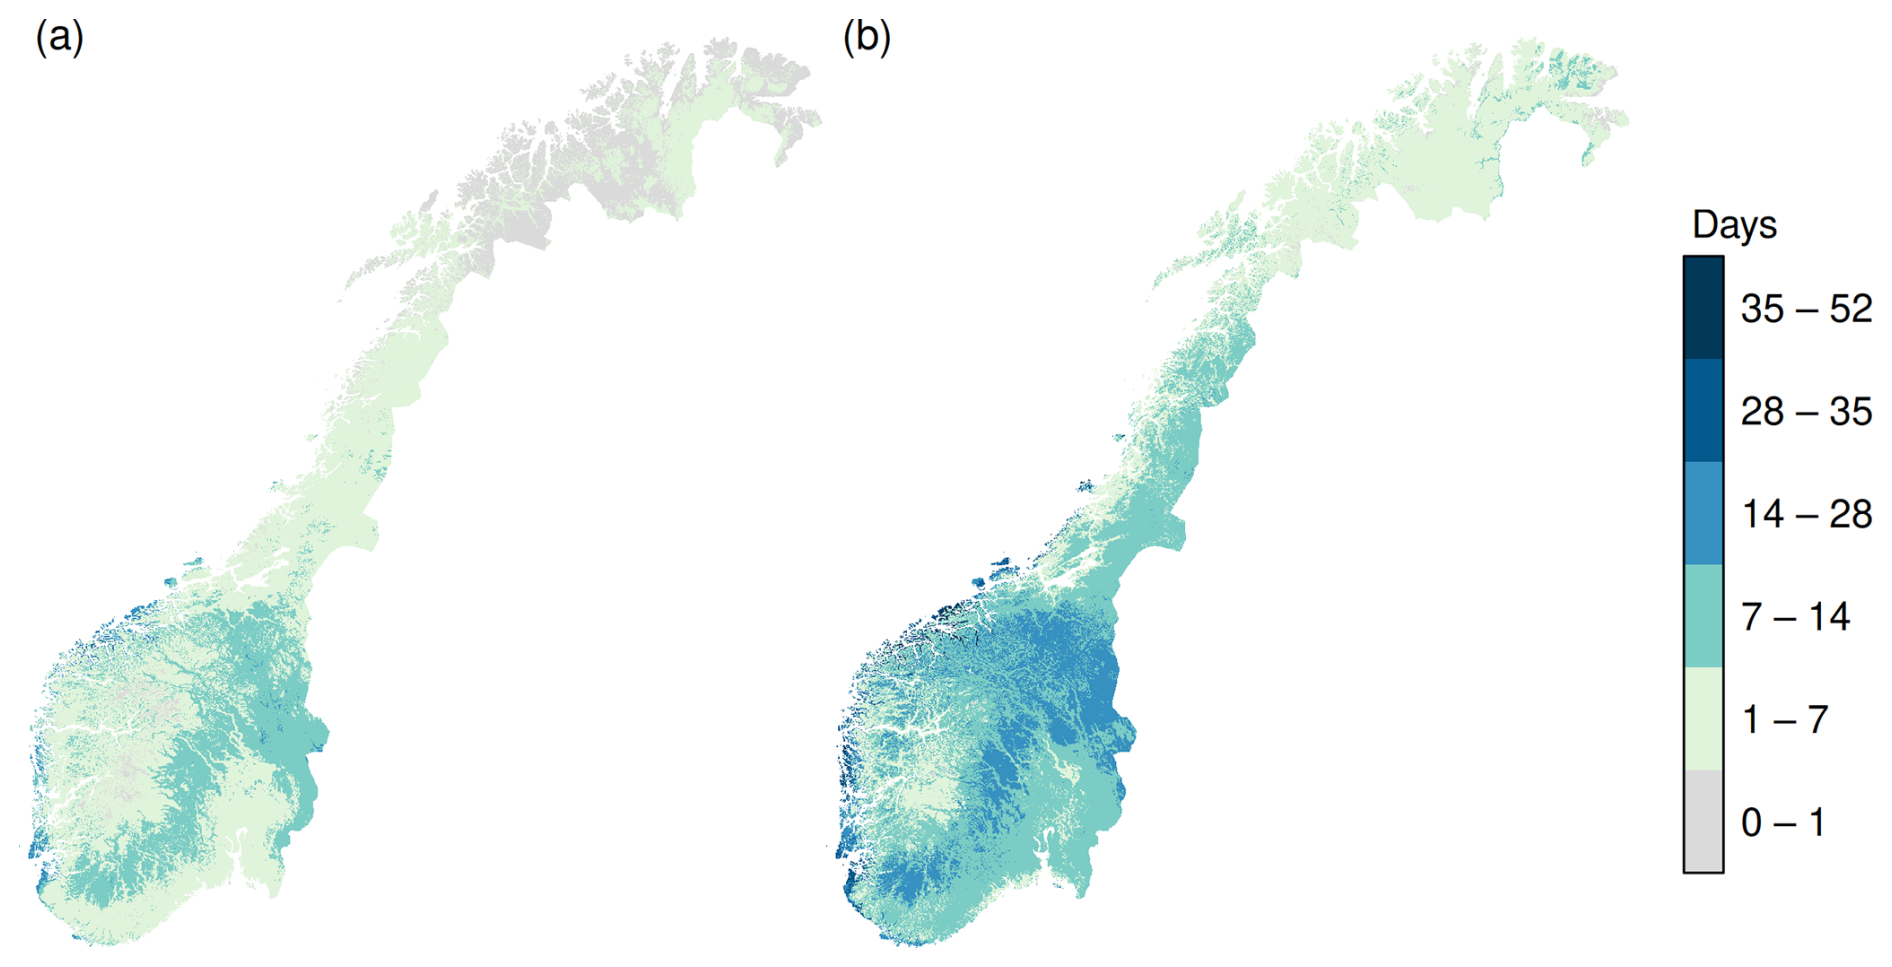
Figure 3The (a) 75th and (b) 90th percentiles of frost days in the beginning of the growing season for Norway for the period 1991–2020.
3.1.2 Historical changes (from 1961–1990 to 1991–2020)
For all six stations that represent agricultural areas in Norway, the mean, median, 75th percentile (p75) and 90th percentile (p90) number of frost days in the beginning of the growing season were calculated for the periods 1961–1990 and 1991–2020 (Table 2).
Table 2The mean, median, 75th and 90th percentiles (p75 and p90) of frost days in the beginning of the growing season for the periods 1961–1990 and 1991–2020 for six selected stations listed south to north.
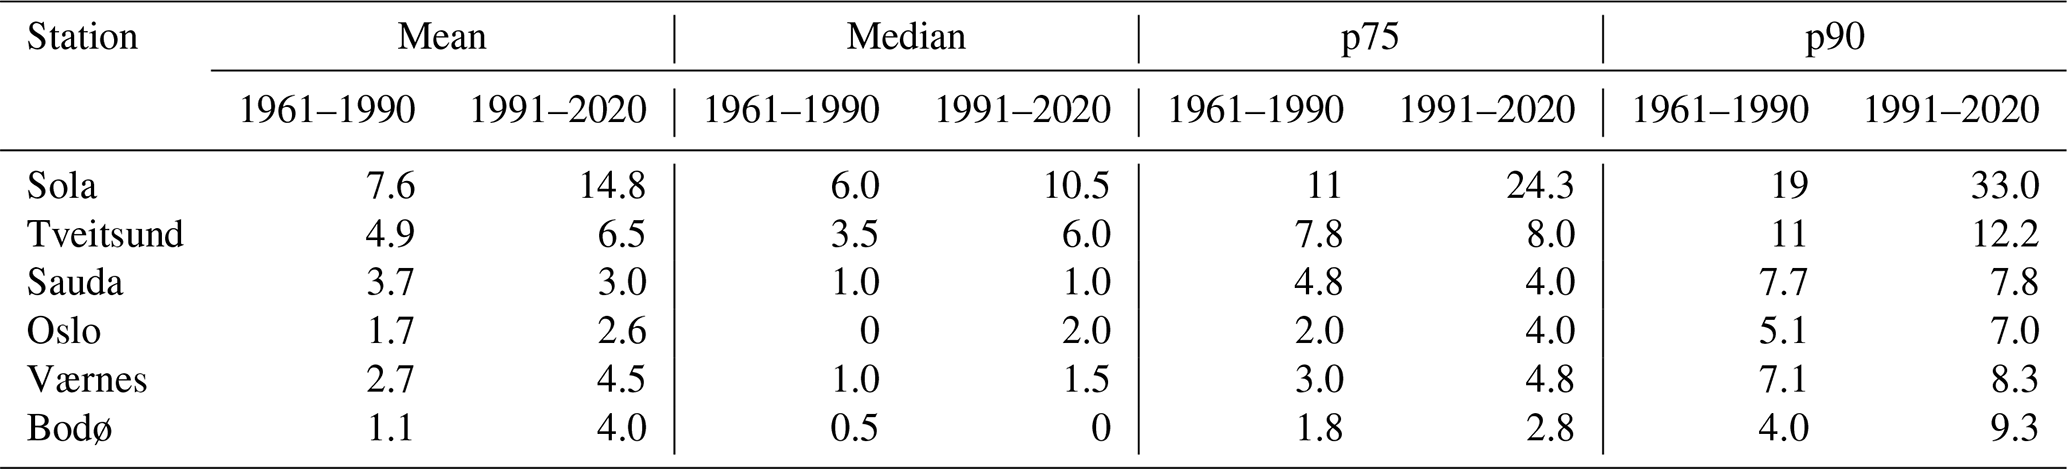
As shown in Table 2, the mean number of frost days in the beginning of the growing season is higher in 1991–2020 than in 1961–1990 for most stations. At Sola, the mean has increased from 7.6 d in 1961–1990 to 14.8 d in 1991–2020, while the median has increased from 6.0 to 10.5 d. The upper percentiles (p75 and p90) have also increased for the later period, with a particularly large increase in the 90th percentile.
Similar tendencies are observed at Oslo, Tveitsund and Værnes, although both the number of days and the magnitude of change between the two normal periods are smaller than at Sola. At Bodø, the mean has increased while the median remains zero.
In contrast, Sauda shows a slight decrease in the mean number of frost days and in the 75th percentile between the two normal periods, while the median and the 90th percentile remain nearly unchanged (Table 2).
The number of frost days in the beginning of the growing season in the two normal periods 1961–1990 and 1991–2020 is shown for six stations in Fig. 4: Oslo, Tveitsund, Sola, Sauda, Værnes and Bodø (see locations in Table 1 and Fig. 2). For Oslo, Tveitsund, Sola and Værnes (Fig. 4a, c, d, f), the distribution has shifted towards higher values in 1991–2020 compared with 1961–1990. This is consistent with the increase in mean, median and upper percentiles shown in Table 2. The interquartile range is wider in the more recent period for Oslo, Sola, Bodø and Værnes, while it is slightly narrower for Sauda and Tveitsund (Fig. 4). Overall, all displayed quantiles tend to increase, especially in the upper part. For Bodø (Fig. 4e) the upper quantiles have shifted to substantially higher values.
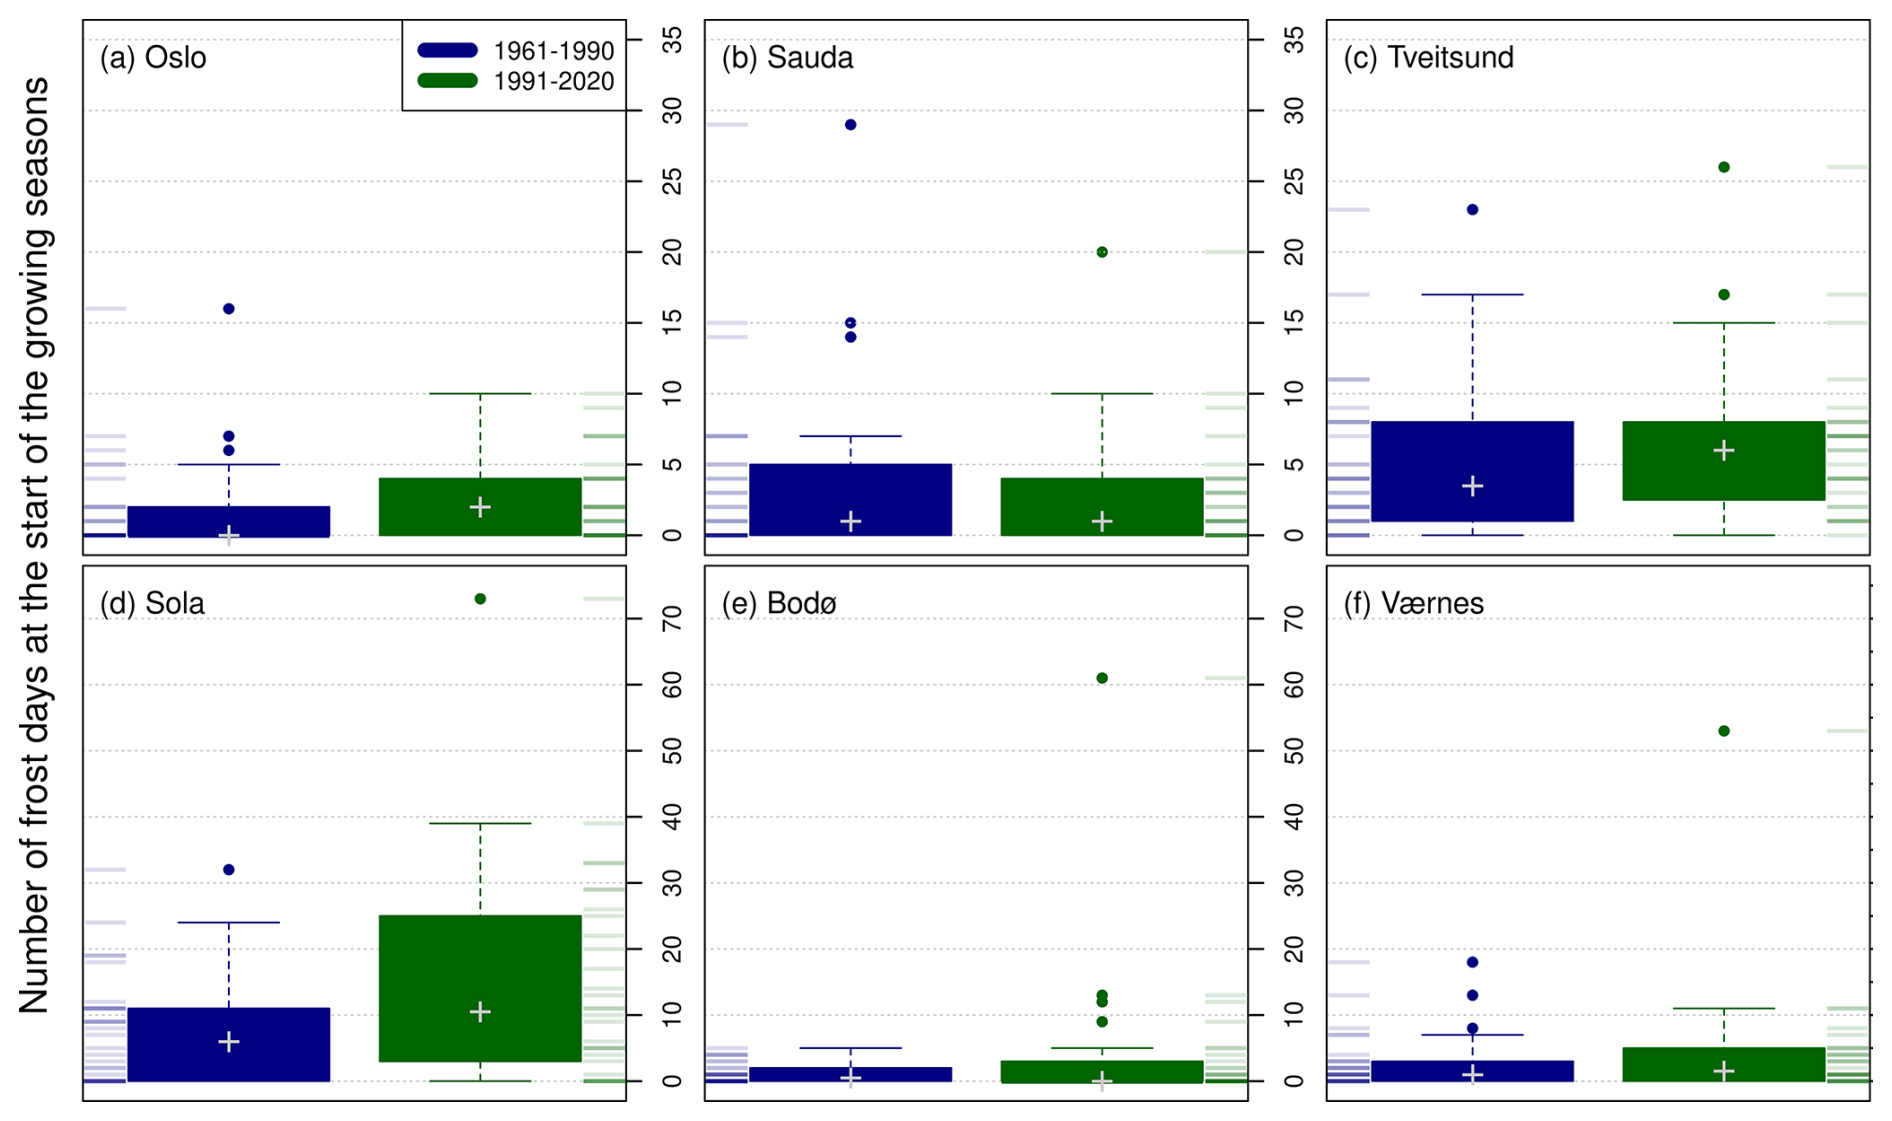
Figure 4Number of frost days in the beginning of the growing season for the periods 1961–1990 (blue) and 1991–2020 (green) for stations (a) Oslo, (b) Sauda, (c) Tveitsund, (d) Sola, (e) Bodø and (f) Værnes. The boxes show the IQR (interquartile range: 25–75 percentiles) while the white crosses show the median. The whiskers show the most extreme data point that is no more than 1.5 times the IQR from the box. The dots show the outliers. Horizontal lines next to the boxes give the number of frost days per year in the two periods, with darker colours for multiple occurrences. (Different y-axes are used: 0–35 d in the top and 0–70 d in the bottom plots).
3.1.3 Future frost days in the beginning of the growing season (2041–2070, 2071–2100)
Having established the historical changes, we next examine how frost risk may develop in the future under different emission scenarios. Projected changes in frost days in the beginning of the growing season are shown in Fig. 5 for three scenarios for the middle of the century (2041–2070) and the end of the century (2071–2100), relative to the period 1991–2020. The main pattern is an increase in the number of frost days along the coast and a decrease in some inland areas of South Norway. This contrast strengthens with higher emission scenarios. The largest increase is projected along the western coast, in the area where the growing season also extends the most in the future (Dyrrdal et al., 2025). In these coastal areas, the growing season may start already in January in future scenarios (Fig. B1).
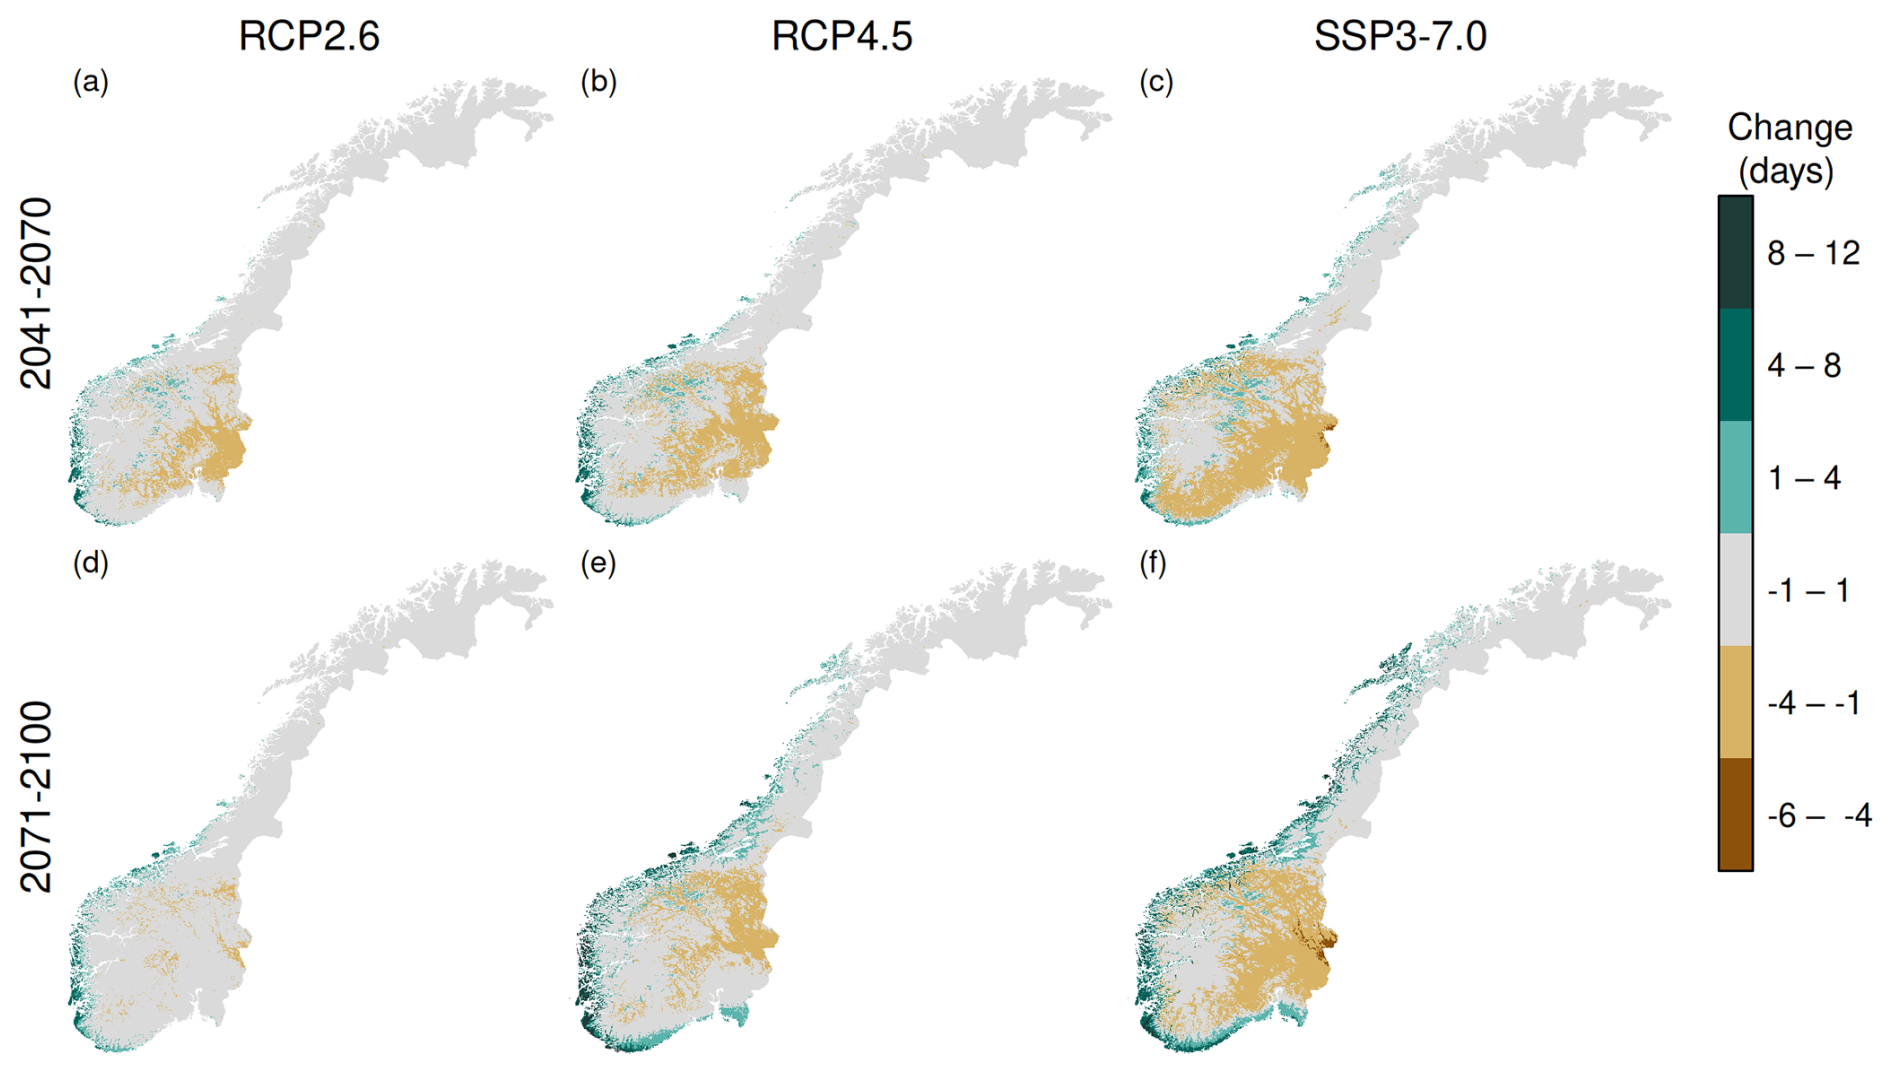
Figure 5Changes in frost days in the beginning of the growing season for the period 2041–2070 (top (a, b, c)) and 2071–2100 (bottom (d, e, f)) following a low (RCP2.6, left column), medium (RCP4.5 middle column) and high (SSP3-7.0, right column) emission scenario. The values shown are the model ensemble mean of the changes in the median number of annual frost days from the period 1991–2020.
With higher emission scenarios and towards the end of the century, the number of frost days in the beginning of the growing season along the coast increases and the area extends further north and east (Fig. 5). By the end of the century, the low emission scenario shows a maximum increase of 7 d. The medium and high emission scenarios both show a maximum increase of 12 d, with the largest changes on the western coast.
In parts of South Norway, the future scenarios indicate a reduction in the number of affected days (Fig. 5). Most of these areas show a decrease of 1 to 4 frost days in the beginning of the growing season compared to 1991–2020. Under the high emission scenario (SSP3-7.0), an area in the far eastern part of South Norway shows a reduction of up to six days. Many areas in North Norway, and some areas in South Norway, exhibit only minor changes (±1 d).
Projected changes vary within the model ensemble. The 10th percentile of the model changes indicates a reduction of frost days in the beginning of the growing season over almost all of Norway for all scenarios (Fig. C1). An exception is a small area along the southwestern coast where the 10th percentile shows a weak increase in the far future for the medium and high emission scenarios. In contrast, the 90th percentile (Fig. C2) shows an increase in many areas, especially along the Norwegian coast. In Innlandet County (see location in Fig. 1) the 90th percentile from the high emission scenario still shows a reduction of frost days in the beginning of the growing season. Thus, although there is a spread in the projections from the model ensemble, the pattern of a decreasing number of frost days in the beginning of the growing season in Innlandet County and the increases along the coast (e.g. in Rogaland County) is a rather robust result within the model ensemble. The decreasing number of frost days in the beginning of the growing season in Innlandet County for the future (Fig. 5) coincides with areas of high historical frost exposure (Fig. 2a).
However, locally the projected change of frost days in the beginning of the growing season may vary considerably among scenarios and ensemble members (Table D1). At several locations, the ensemble mean indicates an increase, while the 10th–90th percentile (p10–p90) range spans both negative and positive changes, showing that the sign of the projected change is not consistent across the ensemble.
The clearest increases occur at Sauda and Bodø towards the end of the century, particularly under the high emission scenario. In Bodø, the ensemble mean increase reaches 8 d, with a p10–p90 range of 0–15 d. In contrast, projected changes are small at Oslo and Tveitsund. Sola and Værnes show larger ensemble spreads, with decreases at the 10th percentile and increases at the 90th percentile for several periods and scenarios.
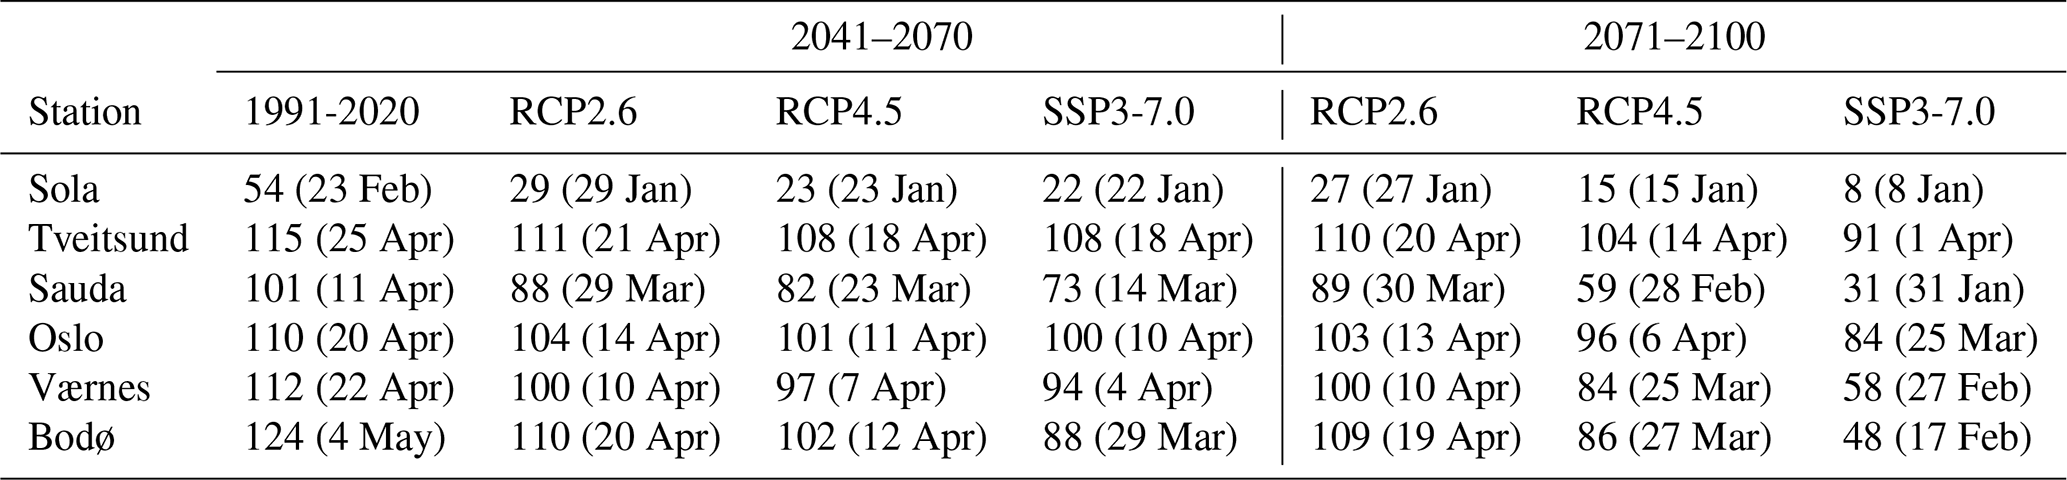
In some coastal areas of Rogaland, projected frost exposure in the beginning of the growing season is slightly higher under the medium emission scenario than under the high emission scenario towards the end of the century. At Sola, the start of the growing season (Table D2) shifts from 23 February (DOY 54) in 1991–2020 to 15 January (DOY 15) under medium emissions and 8 January (DOY 8) under high emissions in 2071–2100 (Fig. B1). The corresponding changes in frost days are +7 and +4 d, respectively (Table D1).
Overall, the results show substantial spatial variation across Norway, ranging from decreases or small changes to relatively large increases of frost days in the beginning of the growing season.
3.2 Discussion
Norway is an elongated country extending from 58 to 71° N, characterised by high mountains, deep fjords, valleys and agricultural areas. This complex topography leads to large spatial differences in frost exposure in the growing season. Frost days during the growing season tend to occur most frequently in short periods immediately after the season starts and shortly before it ends (Liu et al., 2018). In this study, we focus on frost days in the beginning of the growing season due to the higher risk of damage in the initial growth phase.
Many areas in South Norway that experience up to seven frost days in the beginning of the growing season in the period 1991–2020 (Fig. 2a) are important agricultural regions (Fig. 1). This can pose challenges for farmers, as frost damage depends on plant species (Augspurger, 2013; Ma et al., 2019). The growing season is defined based on temperature only and does not necessarily represent the actual growing season or phenological development of individual crops or species. Frost sensitivity also varies between crops and phenological stages. This paper focuses on frost exposure rather than actual frost damage, which would require more tailored studies.
By restricting the analysis to the period before 1 July (Sect. 2.2), later frost events in high–elevation areas are not included. Studies of high–altitude vegetation or forestry may therefore need different seasonal thresholds.
We define frost days as days with a minimum temperature below 0 °C, using standard meteorological observations at 2 m above ground. Other temperature thresholds (e.g. −1 to −4 °C or crop-specific thresholds), measurements at other heights (e.g. near-ground or crop-specific heights), and available daylight may provide additional information, but these are beyond the scope of the present study.
3.2.1 Changes historically
Recent warming has not necessarily reduced frost in the beginning of the growing season. Tajet et al. (2025) found greater frost exposure in large parts of South Norway between the periods 1961–1990 and 1991–2020, but less in parts of North Norway, central Norway and northern areas of South Norway. Liu et al. (2018) found that the risk of frost days during the spring growing season in Europe increased between 1982 and 2012. Ma et al. (2019) found a diverging trend for recent decades in Europe, with an increased risk of frost damage in low–lying coastal and maritime areas, and decreased risk at higher altitudes in more continental areas.
In Norway, an early onset of the growing season increases the risk of frost days, because nights are long and dark, especially before the spring equinox. When the season starts earlier, more of the growing period falls in a part of the year when daily minimum temperatures can still drop below 0 °C. Historically, the total number of frost days in Norway has decreased as temperatures have risen (Tajet et al., 2024). However, in regions with an early onset of the growing season, this earlier onset can outweigh the reduction in frost days. As a result, the risk of frost days in the beginning of the growing season can increase.
These general trends, however, hide important regional differences in frost risk. Regional frost risk patterns vary significantly between coastal and inland areas. This is especially clear when comparing Sola and Sauda, two stations at similar elevations (5–7 m a.s.l.). At Sola, the most frost–exposed years now include more frost days after the growing season has started than in the earlier period (Fig. 4d, Table 2). Furthermore, the wider interquartile range in the recent period (Fig. 4d) indicates greater interannual variability in early–season frost, which could make adaptation planning more difficult. In contrast, Sauda shows an opposing trend (Table 2, Fig. 4b), with fewer frost days in the beginning of the growing season in most years, while frost exposure in the most extreme years is unchanged.
This contrast is linked to the timing of the growing season; at Sola the growing season in 1991–2020 typically starts in February, while at Sauda, the growing season typically starts in April (Fig. 2b, Table D2), when the nights are considerably shorter. Sola is more exposed to coastal conditions, where mild spells are more frequent and can trigger an early start of the growing season. Sauda is located further inland, where the climate is less influenced by such mild spells, and the growing season therefore starts later. This regional difference, where coastal areas risk increased exposure despite overall warming, is a key finding that underlines the need for location–specific adaptation measures. This pattern is consistent with the maritime–continental pattern reported by Ma et al. (2019).
3.2.2 Changes for the future
Under a future warmer climate, the total number of frost days in Norway is projected to decline (Dyrrdal et al., 2025). In contrast, the number of frost days in the beginning of the growing season is projected to increase in some regions (Fig. 5). This increase is most evident in coastal areas, from Østfold County in the south to Troms County in the north (see counties in Fig. 1). These results are consistent with previous studies. Sgubin et al. (2018) and Svystun et al. (2021) showed that although climate models project fewer cold days in the future, frost risk can still increase. The main reason is that budburst is expected to advance more rapidly with warming than the reduction in spring frost. Similarly, Vautard et al. (2023) found that more frequent frost damage events can be expected in a 2 °C warmer climate, because the growing season starts earlier.
The contrasting responses suggest that an earlier growing season onset does not necessarily increase frost exposure. At Sola, the growing season starts earlier under SSP3-7.0 than under RCP4.5, yet fewer frost days occur after onset. This implies that, under SSP3-7.0, the increase in minimum temperature reduces the number of days with temperatures below 0 °C enough to compensate for the increased exposure caused by an earlier start of the growing season. The reduction in frost days is smaller under the medium emission scenario than under the high emission scenario. This may explain why frost exposure is slightly higher under medium than high emissions in Sola and parts of coastal Rogaland.
For some inland areas of South Norway, the opposite response occurs; frost days are decreasing more than the growing season is expanding. In these areas, the risk of frost days early in the growing season is declining (Figs. 5, C1, C2). Similar decreases in frost risk were identified for continental Europe and Canada (Ma et al., 2019; Marquis et al., 2022).
Other studies have also used climate model ensembles to investigate future frost risk (Marquis et al., 2022; Vautard et al., 2023). Marquis et al. (2022) found large variability among climate model projections of future frost occurrence. Here, we have assessed the robustness of projected changes in frost days after the start of the growing season across Norway using the 10th and 90th percentiles of the model ensemble. Contrasting changes between the lower and upper percentiles indicate that modelled changes in frost days in the beginning of the growing season are not uniformly robust across Norway. For some areas, where the 10th and 90th percentiles span both negative and positive values, the ensemble does not provide a consistent direction of change. In contrast, locations where the ensemble mean and both percentiles have the same sign show a more robust result within the ensemble.
The wider ensemble spread at some locations and under some high emission projections also suggests that the magnitude of future changes is less constrained in these cases. These differences should be considered when assessing future frost risk, as changes in the ensemble mean alone may conceal substantial variation among projections.
For adaptation, it is important to consider years with many frost days in the beginning of the growing season, as these may pose substantial risks even where changes in the ensemble mean are small.
Our results show that climate change is altering frost exposure in the beginning of the growing season in Norway. Although the number of frost days is decreasing overall, an earlier start of the growing season can increase frost exposure in some regions. This results in a clear regional contrast: frost risk is projected to decrease in inland areas of South Norway, while coastal areas may experience persistent or increasing risk. Overall, our findings show that a warmer climate does not necessarily lead to lower frost risk during the growing season, because changes in risk also depend on how the timing of the growing season shifts.
Using observations from meteorological stations and gridded historical and future data, including bias-adjusted climate model data, we assessed changes in frost days in the beginning of the growing season in Norway. The large climatic and topographic variation across Norway results in strong regional differences in frost exposure in the beginning of the growing season. In summary, our findings are:
-
Climatology for frost days in the beginning of the growing season in Norway:
-
The median shows a minimum of frost days in the beginning of the growing season in mountain areas in South Norway and most of North Norway, which coincides with areas where the growing season starts late and agricultural activity is limited.
-
The maximum risk is found in inland areas in the southeast.
-
There is considerable year-to-year variability in the risk of frost days in the beginning of the growing season.
-
The risk is particularly high in years when the growing season has an early onset.
-
Areas along the southern and western coast, where the growing season starts early, can experience individual years with several frost days in the beginning of the growing season.
-
-
Historical development at six selected (five coastal) stations in agricultural areas between the periods 1961–1990 and 1991–2020:
-
The risk of frost days in the beginning of the growing season has increased at all stations except one.
-
There is greater year-to-year variability at all stations, except the inland station.
-
-
Future projections:
-
Coastal areas of Norway are projected to experience an increasing risk, with a robust signal in parts of Rogaland County.
-
Inland areas of South Norway show a decreasing risk in the future, with a robust signal in Innlandet County.
-
The reduction of frost days in the beginning of the growing season is more evident under higher emission scenarios, reflecting higher future temperatures projected for Norway.
-
The pattern of increased frost risk along the coast and reduced risk in inland areas is consistent with several European studies.
-
4.1 Future work
To look at the damage from frost days after the growing season has started, there is a need for more crop-specific analyses that account for different phenological stages. For perennial species, winter climate is also relevant, as it is important for the development of frost tolerance. For case studies in Norway, temperature data can be combined with data on budburst, developing leaves, or flowers for years with frost days in the beginning of the growing season. Future studies could also examine frost exposure towards the end of the growing season, which is not considered in this study. Combining climate information with land-use and crop-distribution data could further help identify where changes in frost exposure are most relevant for agricultural risk.
Table A1Overview of the global climate models (GCMs) from CMIP5 and CMIP6 and the regional climate model (RCM) downscalings that have been bias-adjusted for Norway by Wong et al. (2025). The numbers in the table refer to the GCM ensemble member which has been downscaled by the corresponding RCMs.
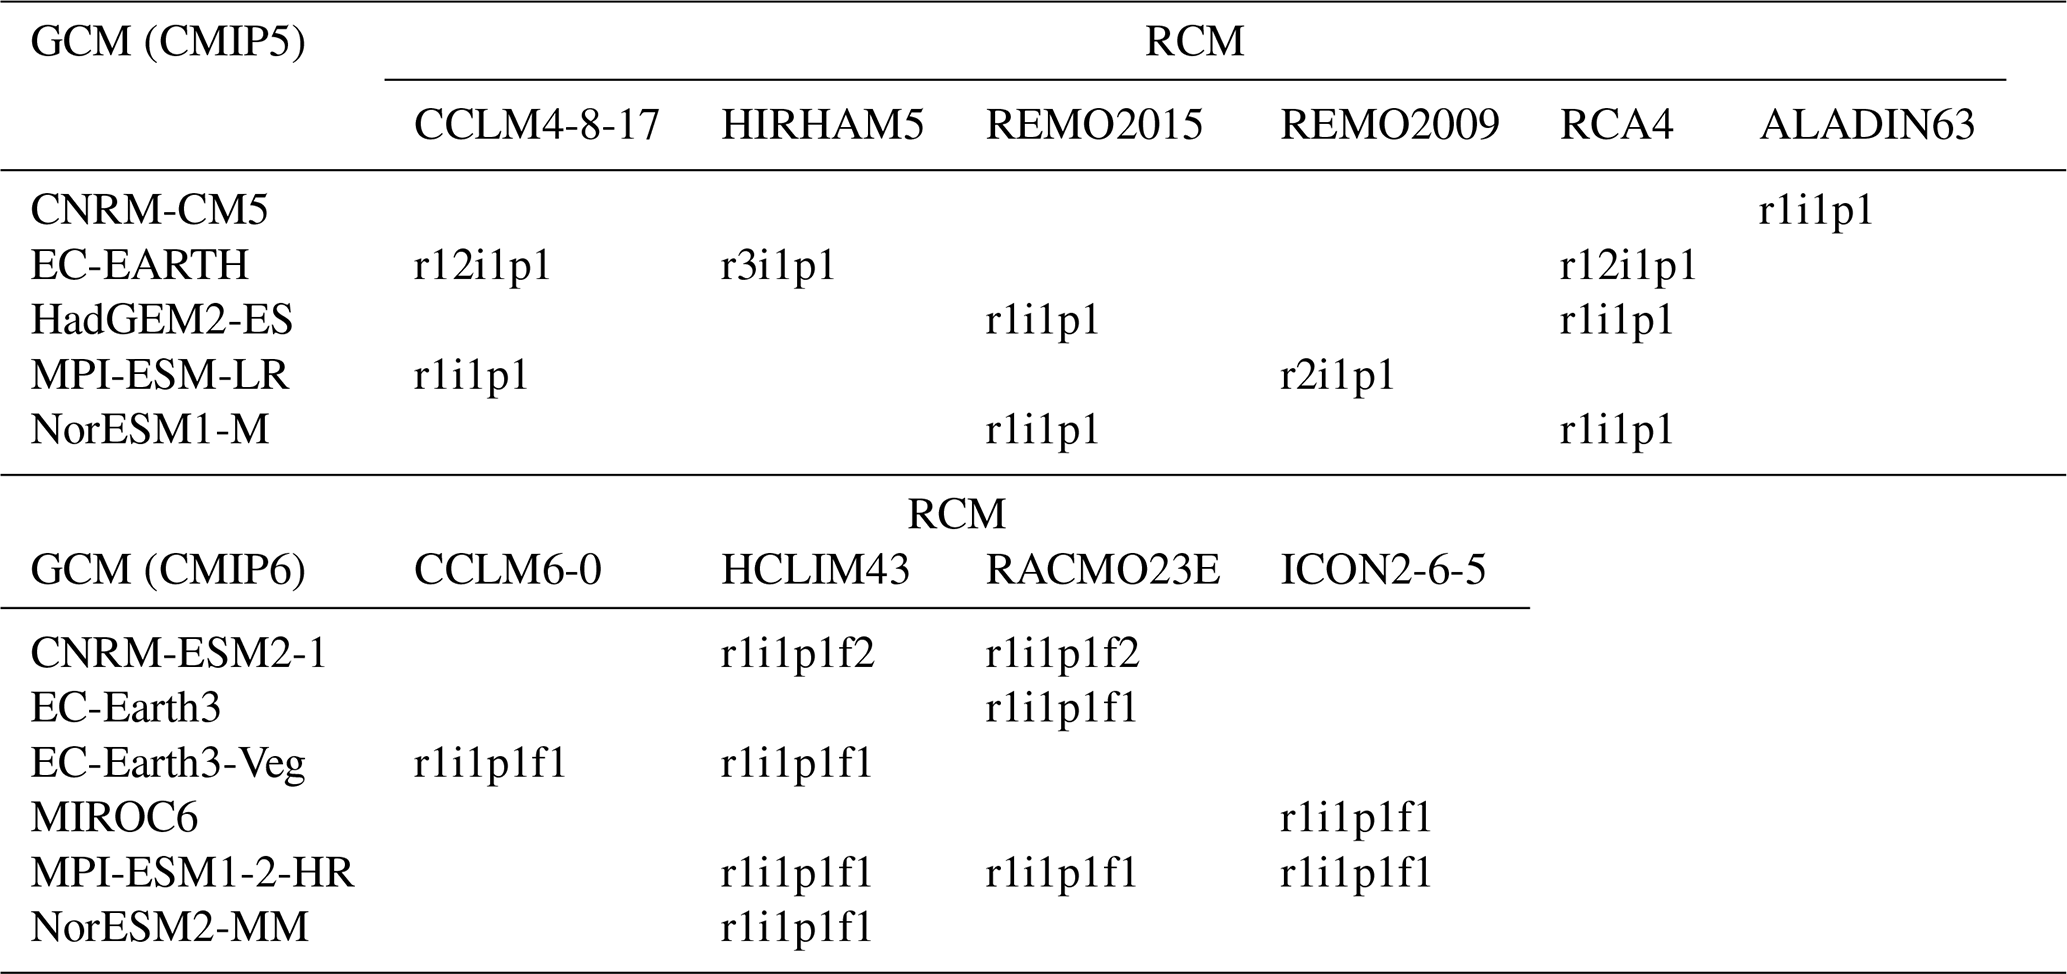
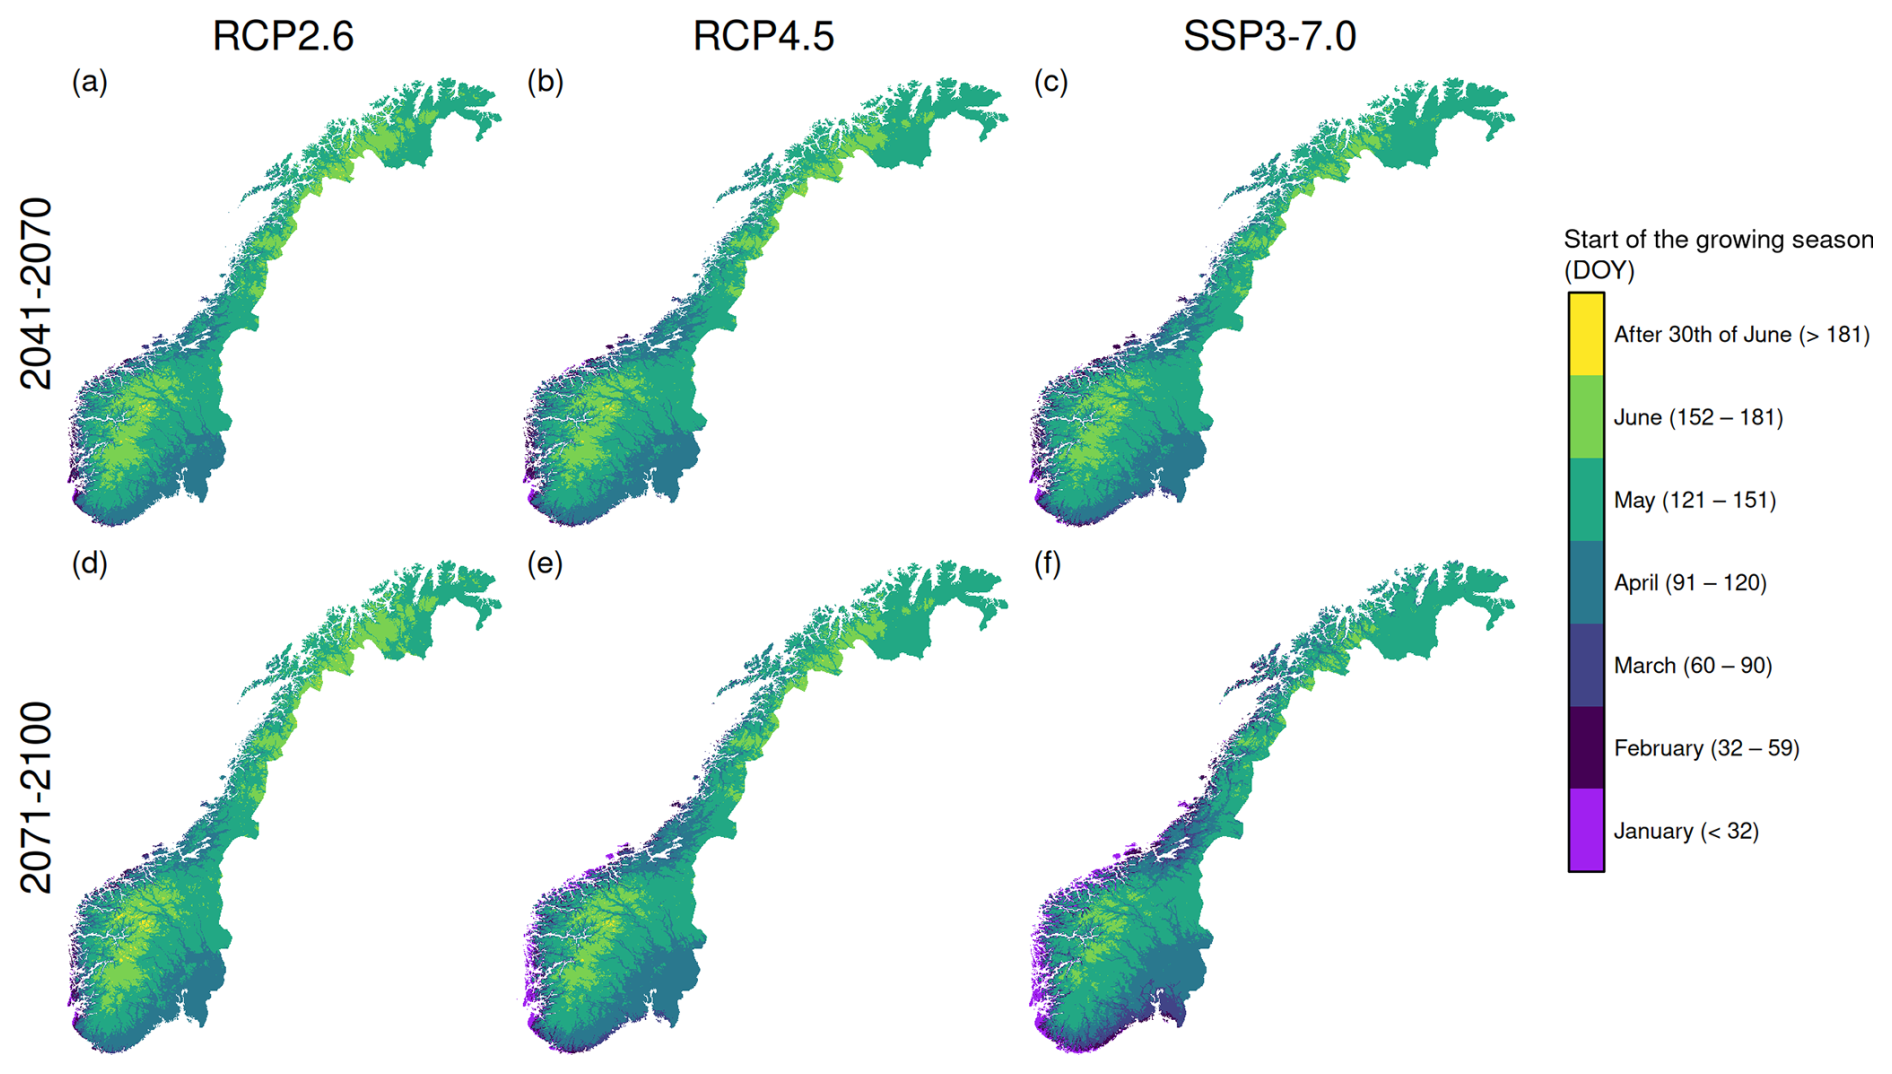
Figure B1Start of the thermal growing season, day of year (DOY) for future scenarios. Median of the period 2041–2070 (top (a, b, c)) and 2071–2100 (bottom (d, e, f)) for low (RCP2.6, left column), medium (RCP4.5 middle column) and high (SSP3-7.0, right column) emission scenarios.
Projected changes in frost days in the beginning of the growing season are shown for the 10th (Fig. C1) and 90th percentiles (Fig. C2) of the model ensemble, based on the median of each 30-year period.
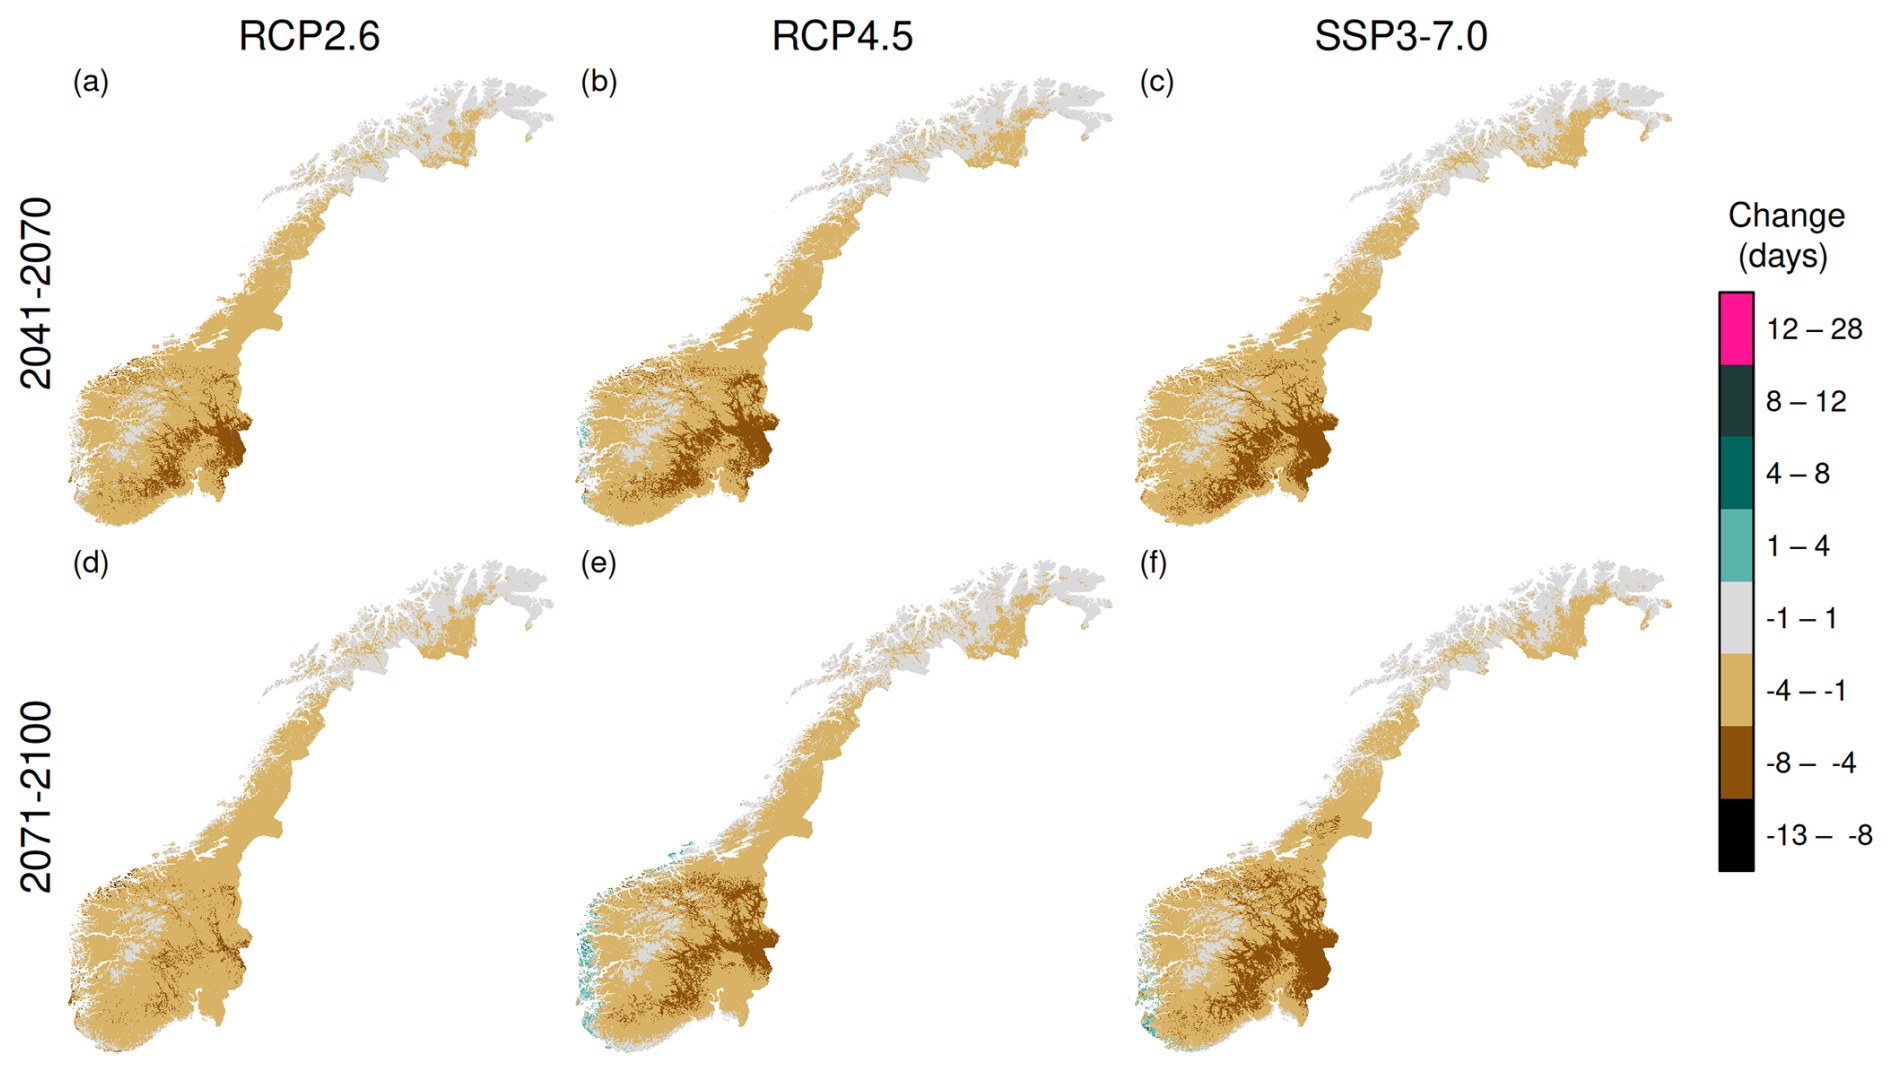
Figure C110th percentile of changes in frost days in the beginning of the growing season for the period 2041–2070 (top (a, b, c)) and 2071–2100 (bottom (d, e, f)) following a low (RCP2.6, left column), medium (RCP4.5 middle column) and high (SSP3-7.0, right column) emission scenario. The values shown are the 10th percentile of the model ensemble changes in the median number of annual frost days from the period 1991–2020.
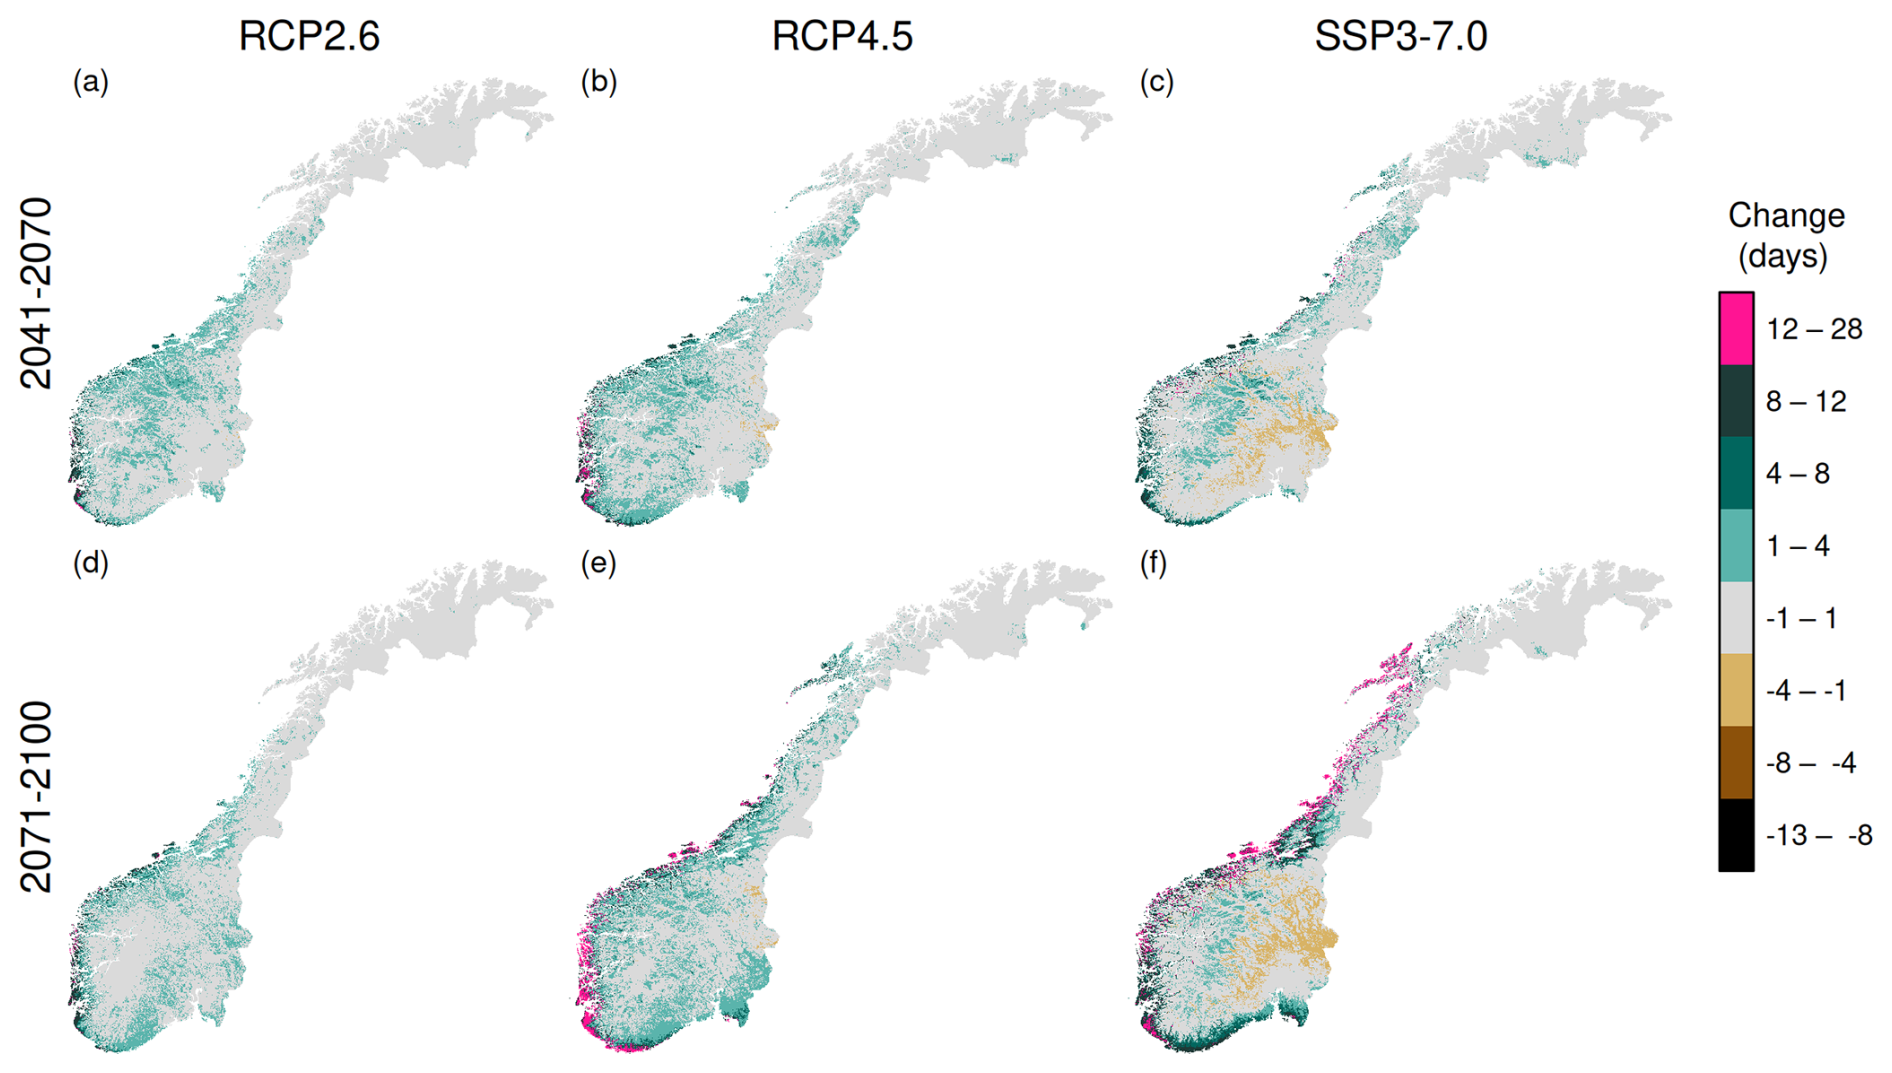
Figure C2As Fig. C1 but for the 90th percentile of the model ensemble changes.
Projected changes in frost days in the beginning of the growing season (Table D1) for three scenarios for the middle of the century (2041–2070) and the end of the century (2071–2100), relative to the period 1991–2020 for six locations (Table 1) with the mean, 10th and 90th percentile of the models, the median of the 30 year time periods. The start of the growing season is shown in Table D2 for historic (1991–2020) and two future periods (2041–2070 and 2071–2100).
Table D1Changes from 1991–2020 in frost days in the beginning of the growing season for selected station locations: model average, 10th and 90th percentiles of the models, median of the 30 years for the middle of the century (2041–2070) and the end of the century (2071–2100). Changes are given as the model average (p10–p90).
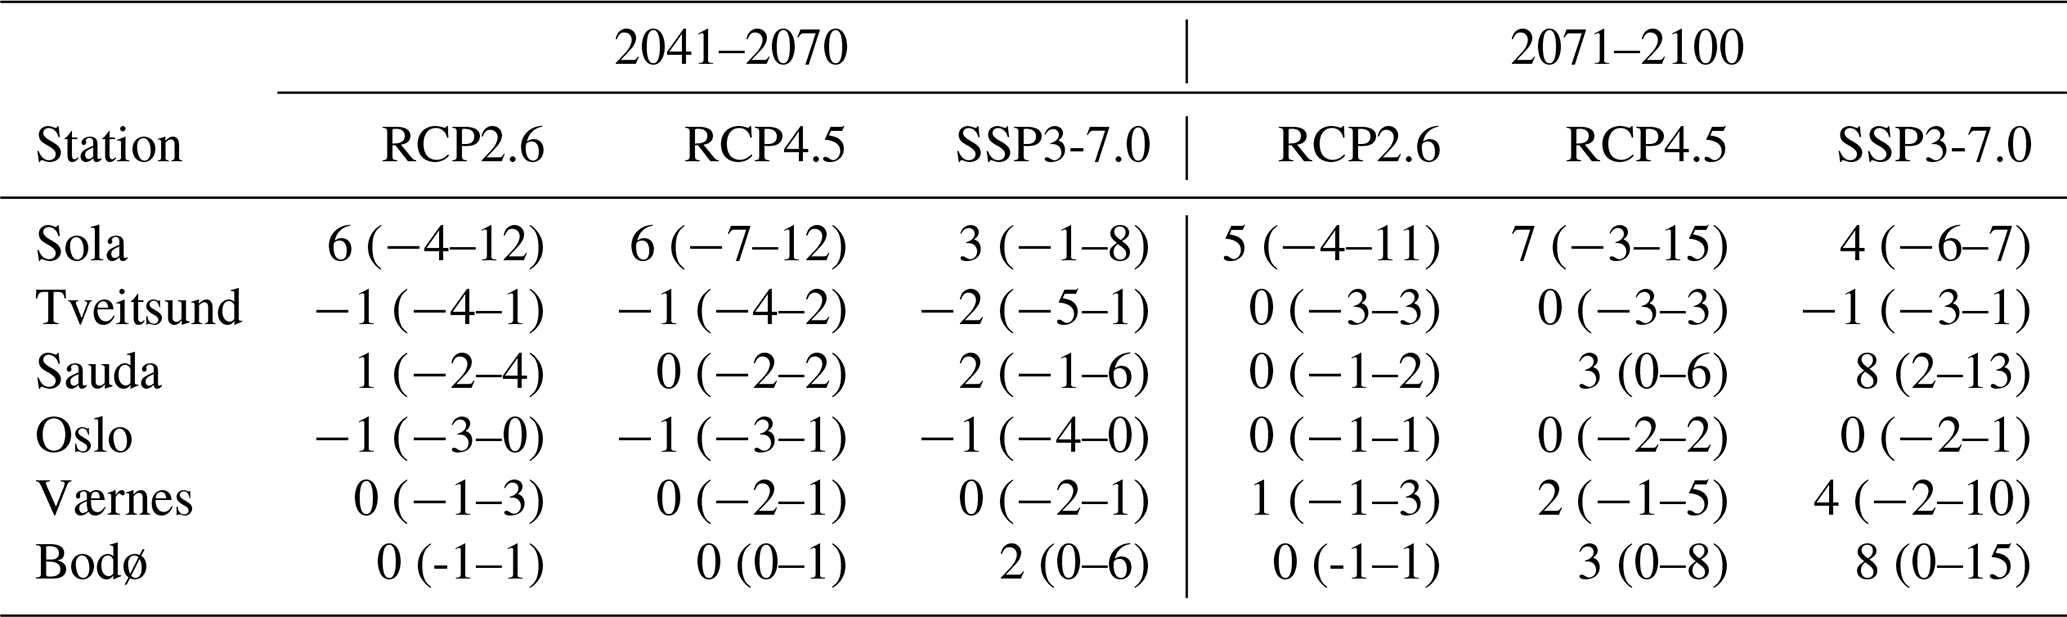
Table D2Start of the growing season, given as day of year (date), for station locations for 1991–2020 and three future scenarios, middle of the century (2041–2070) and the end of the century (2071–2100).
All data can be provided by the corresponding author upon request. Observations from meteorological stations in Norway are available at http://seklima.met.no or http://frost.met.no. The gridded seNorge2018 v20.05 datasets for the period 1957–2019 are available at https://doi.org/10.5281/zenodo.3923706 (daily mean temperatures; Lussana, 2020a) and https://doi.org/10.5281/zenodo.3923697 (daily minimum temperatures; Lussana, 2020b), and at https://doi.org/10.5281/zenodo.17293482 (Dobler and Lussana, 2025) for the year 2020. Projected future changes in frost days in the beginning of the growing season are available as part of the dataset Projected changes in climate and hydrological indices for Norway for 2041-2070 and 2071-2100 (https://doi.org/10.21343/f828-rv60, Dobler et al., 2025) on https://adc.met.no/dataset/c0b1e69a-1f5c-5b45-8a08-1349ad3110b5 (last access: 5 October 2026) (RCP2.6), https://adc.met.no/dataset/49fb868b-22c0-5e39-a66b-254cbdceba7c (last access: 5 October 2026) (RCP4.5) and https://adc.met.no/dataset/e7b3c846-78ed-5c23-97e8-6bad1727f4dc (last access: 5 October 2026) (SSP3-7.0).
All authors helped to design the experiment and the subsequent index. HTTT, AD and HOH prepared the datasets. HTTT and AD made the visualisations/plots. All authors carried out the analyses. HTTT wrote the first draft. All authors contributed to the text. All authors discussed the results and contributed to the review and editing of the manuscript.
The contact author has declared that none of the authors has any competing interests.
Publisher's note: Copernicus Publications remains neutral with regard to jurisdictional claims made in the text, published maps, institutional affiliations, or any other geographical representation in this paper. The authors bear the ultimate responsibility for providing appropriate place names. Views expressed in the text are those of the authors and do not necessarily reflect the views of the publisher.
This article is part of the special issue “EMS Annual Meeting: European Conference for Applied Meteorology and Climatology 2025”. It is a result of the EMS Annual Meeting 2025, Ljubljana, Slovenia, 7–12 September 2025. The corresponding presentation was part of session OSA3.4: Deriving actionable information from climate data.
This work is carried out within the Norwegian Centre for Climate Services (NCCS). NCCS provides information for climate adaptation and helps municipalities to be robust in a changing climate. All authors in this paper are involved in NCCS. We acknowledge the World Climate Research Programme, the CORDEX Science Advisory Team (SAT) – coordinating body of CORDEX, and the Working Group on Coupled Modelling (WGCM) – responsible for CMIP5 and CMIP6. In particular, we are grateful to the CORDEX climate modelling groups Royal Netherlands Meteorological Institute (KNMI), Climate Service Center Germany (GERICS), Brandenburg University of Technology Cottbus (BTU), Karlsruhe Institute for Technology (KIT), Centre National de Recherches Meteorologiques (CNRM), Danish Meteorological Institute (DMI), Swedish Meteorological and Hydrological Institute (SMHI) and the HARMONIE-Climate community (HCLIMcom) for producing and making available their model output (listed in Table A1). We also thank CMIP5 and CMIP6 for providing the driving data, the Earth System Grid Federation (ESGF) for providing access, and the multiple funding agencies who support CORDEX, CMIP and ESGF. The authors acknowledge the use of ChatGPT (OpenAI) to assist with coding support for the figure layouts and colour selection. The authors reviewed and verified all results and are fully responsible for the final content.
This paper was edited by Andreas Fischer and reviewed by two anonymous referees.
Augspurger, C. K.: Reconstructing patterns of temperature, phenology, and frost damage over 124 years: Spring damage risk is increasing, Ecology, 94, 41–50, https://doi.org/10.1890/12-0200.1, 2013.
Buaas, T. O., Simonsen, S. W., and Lindgren, H. M.: Jostein fortviler: – Ikke et eneste eple på 13.000 epletrær (“Jostein despairs: – Not a single apple in 13,000 apple trees”), NRK, https://www.nrk.no/vestfoldogtelemark/far-eplesesongen-odelagt-av-frost-1.14542678, (last access: 10 March 2026), 2019.
Carter, T. R.: Changes in the thermal growing season in Nordic countries during the past century and prospects for the future, AFSci., 7, 161–179, https://doi.org/10.23986/afsci.72857, 1998.
Cornes, R. C., van der Schrier, G., and Squintu, A. A.: A reappraisal of the thermal growing season length across Europe, Int. J. Climatol.,39, 1787–1795, https://doi.org/10.1002/joc.5913, 2019.
Dalen, R.: Nattefrost kan gi eplekrise (“Night frost may cause apple crisis”), NRK, https://www.nrk.no/buskerud/nattefrost-kan-gi-eplekrise-1.11696127, (last access: 10 March 2026), 2014.
Davis, N. E.: The variability of the onset of spring in Britain, Q. J. Roy. Meteor. Soc., 98 763–777, https://doi.org/10.1002/qj.49709841805, 1972.
Dobler, A. and Lussana, C.: seNorge_2018 v20.05 daily mean, minimum and maximum temperatures and total precipitation amounts for year 2020, Version 20.05, Zenodo [data set], https://doi.org/10.5281/zenodo.17293482, 2025.
Dobler, A., Lutz, J., Huang, S., Wong, W. K., Tveito, O. E., Haugen, J. E., Tajet, H. T. T., and Nilsen, I. B.: Projected changes in climate and hydrological indices for Norway for 2041–2070 and 2071–2100, Norwegian Meteorological Institute [data set], https://doi.org/10.21343/f828-rv60, 2025.
Dyrrdal, A. V., Bakke, S. J., Hanssen-Bauer, I., Mayer, S., Nilsen, I. B., Nilsen, J. E. Ø., Paasche, Ø., Saloranta, T., and Årthun, M. (Eds.): Klima i Norge – kunnskapsgrunnlag for klimatilpasning oppdatert i 2025, NCCS-rapport 1/2025, https://doi.org/10.60839/4rgq-nn84, 2025.
Grinde, L., Mamen, J., and Tunheim, K.: Været i Norge vårsesongen 2025, MET info 15-2025, https://www.met.no/publikasjoner/met-info/met-info-2025/_/attachment/inline/47d9d9e2-0549-4bb8-94fb-8e23bb7b0d75:9367860e65651c1fe87f828f1ae5eb931a89d5f9/MET-info-15-2025.pdf (last access: 5 October 2026), 2025.
Huang, S., Wong, W. K., Dobler, A., Bakke, S. J., Beldring, S., Haddeland, I., Hygen, H. O., Løvset, T., Mayer, S., Melvold, K., Nilsen, I. B., Ruan, G., Sørland, S. L., and Dyrrdal, A. V.: An improved modelling chain for bias-adjusted high-resolution climate and hydrological projections for Norway, Geosci. Model Dev., 19, 4567–4599, https://doi.org/10.5194/gmd-19-4567-2026, 2026.
Hufkens, K., Friedl, M. A., Keenan, T. F., Sonnentag, O., Bailey, A., O'Keefe, J., and Richardson, A. D.: Ecological impacts of a widespread frost event following early spring leaf-out, Glob. Change Biol., 18, 2365–2377, https://doi.org/10.1111/j.1365-2486.2012.02712.x, 2012.
IPCC: Climate Change 2021: The Physical Science Basis. Contribution of Working Group I to the Sixth Assessment Report of the Intergovernmental Panel on Climate Change, edited by: Masson-Delmotte, V., Zhai, P., Pirani, A., Connors, S. L., Péan, C., Berger, S., Caud, N., Chen, Y., Goldfarb, L., Gomis, M. I., Huang, M., Leitzell, K., Lonnoy, E., Matthews, J. B. R., Maycock, T. K., Waterfield, T., Yelekçi, O., Yu, R., and Zhou, B., Cambridge University Press, Cambridge, United Kingdom and New York, NY, USA, In press, https://doi.org/10.1017/9781009157896, 2021.
Jacob, D., Teichmann, C., Sobolowski, S., Katragkou, E., Anders, I., Belda, M., Benestad, R., Boberg, F., Buonomo, E., Cardoso, R. M., Casanueva, A., Christensen, O. B., Christensen, J. H., Coppola, E., De Cruz, L., Davin, E. L., Dobler, A., Dominguez, M., Fealy, R., Fernandez, J., Gaertner, M. A., García-Díez, M., Giorgi, F., Gobiet, A., Goergen, K., Gómez-Navarro, J. J., Alemán, J. J. G., Gutiérrez, C., Gutiérrez, J. M., Güttler, I., Haensler, A., Halenka, T., Jerez, S., Jiménez-Guerrero, P., Jones, R. G., Keuler, K., Kjellström, E., Knist, S., Kotlarski, S., Maraun, D., van Meijgaard, E., Mercogliano, P., Montávez, J. P., Navarra, A., Nikulin, G., Noblet-Ducoudré, N., Panitz, H. J., Pfeifer, S., Piazza, M., Pichelli, E., Pietikäinen, J. P., Prein, A. F., Preuschmann, S., Rechid, D., Rockel, B., Romera, R., Sánchez, E., Sieck, K., Soares, P. M. M., Somot, S., Srnec, L., Sørland, S. L., Termonia, P., Truhetz, H., Vautard, R., Warrach-Sagi, K., and Wulfmeyer, V.: Regional climate downscaling over Europe: perspectives from the EURO-CORDEX community, Reg. Environ. Change, 20, 51, https://doi.org/10.1007/s10113-020-01606-9, 2020.
Karl, T. R., Nicholls, N., and Ghazi, A.: Clivar/GCOS/WMO Workshop on Indices and Indicators for Climate Extremes Workshop Summary, Climatic Change, 42, 3–7, https://doi.org/10.1023/A:1005491526870, 1999.
Lile, A.: Her blir det ingen solbær (“There will be no blackcurrants here”), Ringerikes blad, https://www.ringblad.no/nyheter/her-blir-det-ingen-solbar/s/1-97-6686382, (last access: 10 March 2026), 2013.
Liu, Q., Piao, S., Janssens, I.A., Fu, Y., Peng, S., Lian, X., Ciais, P., Myneni, R. B., Peñuelas, J., and Wang, T. : Extension of the growing season increases vegetation exposure to frost, Nat. Commun., 9, 426, https://doi.org/10.1038/s41467-017-02690-y, 2018.
Lussana, C.: seNorge_2018 daily mean temperature 1957–2019, Version 20.05, Zenodo [data set], https://doi.org/10.5281/zenodo.3923706, 2020a.
Lussana, C.: seNorge_2018 daily minimum temperature 1957–2019, Version 20.05, Zenodo [data set], https://doi.org/10.5281/zenodo.3923697, 2020b.
Lussana, C.: seNorge observational gridded datasets, seNorge_2018, version 20.05, MET report 07-2020, https://www.met.no/publikasjoner/met-report/met-report-2020/_/attachment/download/9f79d391-62d8-4fc1-a61a-9f0e7f1de389:8c74ebf2118593aa75272e6aff416ce66f86e73f/MET-report-07-2020.pdf (last access: 5 October 2026), 2020c.
Lussana, C., Tveito, O. E., Dobler, A., and Tunheim, K.: seNorge_2018, daily precipitation, and temperature datasets over Norway, Earth Syst. Sci. Data, 11, 1531–1551, https://doi.org/10.5194/essd-11-1531-2019, 2019.
Ma, Q., Huang, J.-G., Hänninen, H., and Berninger, F.: Divergent trends in the risk of spring frost damage to trees in Europe with recent warming, Glob. Change Biol., 25, 351–360, https://doi.org/10.1111/gcb.14479, 2019.
Marquis, B., Bergeron, Y., Houle, D., Leduc, M., and Rossi, S.: Variability in frost occurrence under climate change and consequent risk of damage to trees of western Quebec, Canada, Sci. Rep., 12, 7220, https://doi.org/10.1038/s41598-022-11105-y, 2022.
Myrvang, S. E. and Skålevik, G. A.: Aldri opplevd så tidlig vår: – Hva skjer hvis ikke vi tilpasser oss? (“Never experienced spring this early: – What happens if we don't adapt?”), VG, https://www.vg.no/nyheter/i/PpG3dX/bonden-har-aldri-opplevd-saa-tidlig-vaar-hva-skjer-hvis-ikke-vi-tilpasser-oss (last access: 10 March 2026), 2025.
Nidzgorska-Lencewicz, J., Mąkosza, A., Koźmiński, C., and Michalska, B.: Potential Risk of Frost in the Growing Season in Poland, Agriculture, 14, 501, https://doi.org/10.3390/agriculture14030501, 2024.
Peterson, T. C., Folland, C., Gruza, G., Hogg, W., Mokssit, A., and Plummer, N.: Report on the Activities of the Working Group on Climate Change Detection and Related Rapporteurs 1998–2001, WMO, Rep. WCDMP-47, WMO-TD 1071, Geneve, Switzerland, 143 pp. https://etccdi.pacificclimate.org/docs/wgccd.2001.pdf (last access: 5 October 2026), 2001.
Sgubin, G., Swingedouw, D., Dayon, G., de Cortázar-Atauri, I. G., Ollat, N., Pagé, C., and van Leeuwen, C.: The risk of tardive frost damage in French vineyards in a changing climate, Agric. For. Meteorol., 250–251, 226–242, https://doi.org/10.1016/j.agrformet.2017.12.253, 2018.
Skaugen, T. E. and Tveito, O. E.: Growing-season and degree-day scenario in Norway for 2021–2050, Clim. Res., 26, 221–232, https://doi.org/10.3354/cr026221, 2004.
Smith, E., Grant, N., Luo, X., and Diaz, D.: Evaluating the ability of gridded climate datasets to capture temperature and precipitation trends and extremes, Sci. Rep., 15, 12607, https://doi.org/10.1038/s41598-025-97570-7, 2025.
Statistics Norway: Statistics on Land use and land cover, https://www.ssb.no/en/natur-og-miljo/areal/statistikk/arealbruk-og-arealressurser, (last access: 11 August 2026), 2026.
Storfossen, J.: Store frostskader på frukt (“Major frost damage to fruits”), Laagendalsposten, https://www.laagendalsposten.no/nyheter/store-frostskader-pa-frukt/s/2-2.1601-1.2481783, (last access: 10 March 2026), 2005.
Svystun, T., Lundströmer, J., Berlin, M., Westin, J., and Jönsson, A. M.: Model analysis of temperature impact on the Norway spruce provenance specific bud burst and associated risk of frost damage, Forest Ecol. Manag., 493, 119252, https://doi.org/10.1016/j.foreco.2021.119252, 2021.
Tajet, H. T. T., Hanssen-Bauer, I., Tveito, O. E., and Gangstø, R.: Temperaturindekser 1961–1990 og 1991–2020, MET report 2-2024, Meteorologisk institutt, https://www.met.no/publikasjoner/met-report/met-report-2024/_/attachment/inline/779096fa-079b-41be-a87a-f11c100294af:65772d3fdf9a8991da06df0a21ad38a9ce5017b3/MET-report-2-2024-Temperaturindekser 1961-1990 og 1991-2020.pdf (last access: 5 October 2026), 2024.
Tajet, H. T. T., Gangstø, R., Hanssen-Bauer, I., Dobler, A., and Hygen, H. O.: Frost i vekstsesongen for Norge, 1961–2020, MET report 09-2025, Meteorologisk institutt, https://www.met.no/publikasjoner/met-report/_/attachment/inline/6a85d48d-c7d0-4014-9c17-64842d1392df:692b728eab7afabde90b851ecff442cd2879bc05/MET rapport 9_2025 - Frost i vekstsesong, KiN bakgrunnsrapport.pdf (last access: 5 October 2026), 2025.
Vautard, R., van Oldenborgh, G. J., Bonnet, R., Li, S., Robin, Y., Kew, S., Philip, S., Soubeyroux, J.-M., Dubuisson, B., Viovy, N., Reichstein, M., Otto, F., and Garcia de Cortazar-Atauri, I.: Human influence on growing-period frosts like in early April 2021 in central France, Nat. Hazards Earth Syst. Sci., 23, 1045–1058, https://doi.org/10.5194/nhess-23-1045-2023, 2023.
Wang, J., Hua, H., Guo, J. Huang, X., Zhang, X., Yang, Y., Wang, D., Guo, X., Zhang, R., Smith, N. G., Rossi, S., Peñuelas, J. Ciais, P., Wu, C., and Chen, L.: Late spring frost delays tree spring phenology by reducing photosynthetic productivity, Nat. Clim. Change, 15, 201–209. https://doi.org/10.1038/s41558-024-02205-w, 2025.
Wong, W. K., Dobler, A., Huang, S., Beldring, S., Melvold, K., and Ruan, G.: Daily bias-adjusted climate (COR-BA-2025) and hydrological (distHBV-COR-BA-2025) projections for Norway, Norwegian Meteorological Institute at the Arctic Data Centre [data set], https://doi.org/10.21343/0k90-6w67, 2025.
Zhou, B., Zhai, P., Chen, Y. and Yu, R.: Projected changes of thermal growing season over Northern Eurasia in a 1.5 °C and 2 °C warming world, Environ. Res. Lett., 13, 035004, https://doi.org/10.1088/1748-9326/aaa6dc, 2018.
- Abstract
- Introduction
- Data and Methods
- Results and Discussion
- Conclusions
- Appendix A: Overview of climate models
- Appendix B: Maps of start of the growing season for future scenarios
- Appendix C: Maps of the 10th and 90th percentiles of changes in frost days in the beginning of the growing season
- Appendix D: Tables of changes in frost days in the beginning of the growing season and start of growing season
- Data availability
- Author contributions
- Competing interests
- Disclaimer
- Special issue statement
- Acknowledgements
- Review statement
- References
- Abstract
- Introduction
- Data and Methods
- Results and Discussion
- Conclusions
- Appendix A: Overview of climate models
- Appendix B: Maps of start of the growing season for future scenarios
- Appendix C: Maps of the 10th and 90th percentiles of changes in frost days in the beginning of the growing season
- Appendix D: Tables of changes in frost days in the beginning of the growing season and start of growing season
- Data availability
- Author contributions
- Competing interests
- Disclaimer
- Special issue statement
- Acknowledgements
- Review statement
- References