A new framework for probabilistic seasonal forecasts based on circulation type classifications and driven by an ensemble global model
Gianni Messeri
Riccardo Benedetti
Alfonso Crisci
Bernardo Gozzini
Matteo Rossi
Roberto Vallorani
Giampiero Maracchi
In the last years coupled atmospheric ocean climate models have remarkably improved medium range seasonal forecasts, especially on middle latitude areas such as Europe and the Mediterranean basin. In this study a new framework for medium range seasonal forecasts is proposed. It is based on circulation types extracted from long range global ensemble models and it aims at two goals: (i) an easier use of the information contained in the complex system of atmospheric circulations, through their reduction to a limited number of circulation types and (ii) the computation of high spatial resolution probabilistic forecasts for temperature and precipitation. The proposed framework could be also useful to lead predictions of weather-derived parameters, such as the risk of heavy rainfall, drought or heat waves, with important impacts on agriculture, water management and severe weather risk assessment. Operatively, starting from the ensemble predictions of mean sea level pressure and geopotential height at 500 hPa of the NCEP – CFSv2 long range forecasts, the third-quantiles probabilistic maps of 2 m temperature and precipitation are computed through a Bayesian approach by using E-OBS 0.25∘ gridded datasets. Two different classification schemes with nine classes were used: (i) Principal Component Transversal (PCT9), computed on mean sea level pressure and (ii) Simulated Annealing Clustering (SAN9), computed on geopotential height at 500 hPa. Both were chosen for their best fit concerning the ground-level precipitation and temperature stratification for the Italian peninsula. Following this approach an operative chain based on a very flexible and exportable method was implemented, applicable wherever spatially and temporally consistent datasets of weather observations are available.
In this paper the model operative chain, some output examples and a first attempt of qualitative verification are shown. In particular three case studies (June 2003, February 2012 and July 2014) were examined, assuming that the ensemble seasonal model correctly predicts the circulation type occurrences. At least on this base, the framework here proposed has shown promising performance.
- Article
(2543 KB) - Full-text XML
- BibTeX
- EndNote
Seasonal forecasting attempts to provide useful probabilistic information about the climate that can be expected in the coming few months. The seasonal forecasts target is not a possible snapshot of continually changing atmospheric conditions, but rather a likely preview of the main weather events occurring in a given season. Consequently long-term predictions fall into the realm of essentially probabilistic problems. Due to their chaotic nature, atmospheric states just a few weeks forward in time are predictable only in terms of a probability cloud, possibly conditioned to slowly changing variables, such as the ocean's surface temperatures. Global climate models based on ocean-atmosphere coupling are frequently used with an ensemble approach to sample the inherent atmospheric uncertainty (Leutbecher and Palmer, 2007). There is a growing interest in a wide swath of user communities for the seasonal forecasts on both global and local scale, but the skill of the forecasts, as well as the type of the provided information, needs to be improved.
Remarkably the importance of a probabilistic way to communicate predictions, for instance weather warning, was already stressed at the beginning of the twentieth century:
“The most appropriate system seems therefore to be to leave to the clients concerned by the warning to form an idea of the value of loss/cost and to issue the warnings in such a form that the larger or smaller probability of the event gets clear from the formulation. The client may then himself consider if it is worth while to make arrangements of protection, or to disregard a given warning.” (Angström, 1922).
The method proposed here for probabilistic seasonal forecasts at high resolution starts from a climatological ensemble global model (the NCEP-NCAR CFSv2) and reduces the atmospheric complexity through a circulation types classification approach. The European project Cost Action 733 (2008–2010) gave a significant contribution for atmospheric circulation type classifications, in order to evaluate their skill in stratifying surface climate elements or other weather related environmental variables. The adopted technique rely on a discrete characterization of atmospheric circulations grouped into subsets (Huth et al., 2015; Philipp et al., 2014). In addition, the other key factor of this framework is the increase of the spatial resolution, through a sort of statistical downscaling (see for instance Nikulin et al., 2018; and Manzanas et al., 2018) to improve the dependence of climatic factors on geographical characteristics and orographic complexities. This goal was achieved thanks to the availability of a consistent high-resolution surface data, such as the E-OBS gridded datasets from the European Climate Assessment & Dataset project (Haylock et al., 2008). Furthermore, a Bayesian procedure was used for producing probabilistic forecasts suitable for decision-making processes and risk assessment. The Bayesian algorithm merges the information coming from the ensemble monthly forecast (i.e the predicted probability for the possible circulation types) with the climatology of the predictands for each circulation type. The final output is the probability for each predictand given both the ensemble forecast and the climatological data, that is a single product which preserves the possibility to separately evaluate the different sources of uncertainty.
Further investigations will be carried out to characterize each circulations type in terms of occurrences of heavy precipitation, cold spells, heat waves, landslides, snowfall, or dry spells, which are very important variables for many activities like agriculture, water management, energy provision and severe weather risk assessment. Indeed the relationship between circulation weather type classifications and high-impact weather events was also shown in previous studies concerning extreme precipitation (Fernandez-Montes et al., 2014), extreme temperature episodes (Kysely, 2008), floods (Prudhomme and Genevier, 2011), droughts (Russo et al., 2015), and even lightning activity (Ramos et al., 2011).
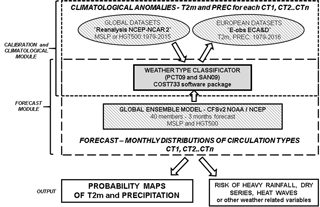
The main core of the operative chain for the proposed methodology of seasonal forecasts is based on the weather type classification software package, developed within the project COST733 (Philipp et al., 2014). This software has been used for both the calibration and the forecast module of the operative chain, as illustrated in Fig. 1.
The calibration was carried out on NCEP-NCAR Reanalysis 2 data (Kanamitsu et al., 2002) between 1979 and 2015 through a sensitivity analysis detailed in a specific study (Vallorani et al., 2017). In summary several circulation type classifications were computed with different classification methods, number of types and classification variables (i.e. predictands). Then such classifications were compared through the use of proper statistical indexes in order to assess the stratification of the ground-level precipitation and the surface air temperature across Italian peninsula. The PCT (Principal Component Transversal) and the SAN (Simulated Annealing) methods with 9 classes computed on MSLP and 500HGT (Vallorani et al., 2018) were selected as the best performing classifications for precipitation and temperature respectively (see in Fig. 2 the centroid maps for PCT09 and SAN09 classifications as a result of the calibration module, where the centroids are the central value of the class/cluster). Climatological values of rainfall amount, wet days (number of days with a daily rainfall exceeding the 0.4 mm sensitivity limit), and minimum, maximum and mean temperature were consequently calculated for each of the nine circulation types over the period 1981–2010, on a monthly basis.
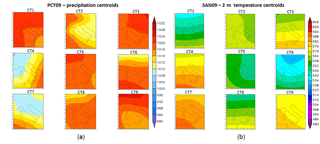
Figure 2Centroids of PCT09 classification implemented on mean sea level pressure (Fig. 2a, values in hPa on the right side of color bar) computed for ground-level precipitation and (a) SAN09 classification implemented on geopotential height at 500 hPa (Fig. 2b, values in tens of metres on the right side of color bar) computed for 2 m temperature (b). Each map represents the central value of the circulation type as a result of the calibration procedure.
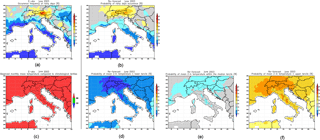
Figure 3June 2003: observations E-OBS versus the operational chain re-forecast: the E-OBS occurrence frequency of rainy days (a), the re-forecast probability of the rainy days occurrence (b), the E-OBS tertile climatological distribution (c), the re-forecast probability to stay below the lower tertile (d), the re-forecast probability to stay within the median tertile (e) and the re-forecast probability to stay above the upper tertile (f).
The weather type classifier is also used operatively in the forecast module. Each of the 40 members of MSLP and 500HGT extracted from the NCEP – CFSv2 global model are converted into daily series of circulation types for the future 90 days. For each record of the 40 members the dissimilarity/distance between the record and the centroids are calculated and the circulation type number is chosen to be the one with the minimum distance. The probability output maps are finally computed trough a Bayesian algorithm (described in Sect. 2.1) which combine ensemble forecasts, circulation types and climatology.
In this paper a preliminary test is carried out on three case studies on Italy, all with important temperature or rain anomalies: June 2003, February 2012, and July 2014. The obtained results are then qualitatively compared with the observed values during these three months, taken from the E-OBS gridded dataset. Since the purpose of this first test is to verify the predicting capability of the climatological and circulation types contribution, rather than the goodness of the ensemble forecast (EF), the probabilistic weights coming from EF (the terms P(CTi|EFm) in Eq. 2) have been collapsed to zero with the only exception of the one related to the actually occurred circulation type, as derived by the Reanalysis 2 dataset. This is equivalent to assume a perfect forecast (all the members of EF predict the same circulation type), whereas in practice a spread of the members on different circulation types is expected. Finally the so predicted precipitation and temperature fields, and in particular the probability of having values below the lower or above the upper climatological tertile, are compared with the E-OBS values.
The Bayesian basic formula
The searched probability for the value x of a target variable, (i.e. surface daily mean temperature or precipitation) in a given day of the month m is conditioned to both the global ensemble forecast EFm and the climatology Cm for that month. By the marginalization rule applied on the set of nine circulation types CTi, the searched conditional probability can be written as:
where the right hand term has been obtained by simply applying the product rule. The probability distribution P(x|EFmCm) is thus expressed by the sum of products, each containing two terms: the first one, P(CTi|EFmCm), is the probability that the circulation type i occurs at the day of interest given both the global ensemble forecast and the climatology; the second one, P(x|EFmCmCTi), is the probability that the target variable takes the value x given the global ensemble forecast, the climatology and the circulation type i.
The first term can be explicitly computed assuming that the ensemble forecast is significantly more informative than climatology in determining the circulation type occurrence, so making the climatology nearly irrelevant (indeed any seasonal forecast unable to improve climatological predictions is in practice useless). Hence P(CTi|EFmCm)=P(CTi|EFm). Similarly the second term can be easily computed if the value of the target variable is better determined by the climatology of each given CTi than using directly the ensemble forecasts: P(x|EFmCmCTi)=P(x|CmCTi).
Thus the conditional probability (1) can be definitely rewritten as:
where the first term of the product on the right hand side accounts for the circulation types predicted by the global ensemble model, whereas the second term is directly given by the frequency distribution of the x values for each circulation type, as extracted by the dataset on which the climatology is based.
As concerns precipitation, the dry days (precipitation below the 0.4 mm limit of sensitivity) has been preliminary separated by the wet ones, and then the rainfall amount given the day is wet extracted (from the observed data) or computed (as predicted probability for the observed value).
A first, little more than qualitative, verification was carried out on three months that are all characterized by an unusual occurrence of some circulation types, generating important temperature or precipitation anomalies. The monthly occurrences of each CT with respect to the reference climatological period (1981–2010) are reported in Table 1.
For each case study two kinds of semi-quantitative comparison are shown: (i) the observed occurrences of rainy days (i.e. the fraction of rainy days within the month) versus the simulated mean probability of rainy day occurrences, and (ii) the observed monthly mean temperature (at 2 m) classified into 3 intervals according to the climatological tertiles (i.e. observed tertile climatological distribution) versus the simulated mean probability of having a day with mean temperature below the lower tertile or above the upper one, or within the two tertiles.
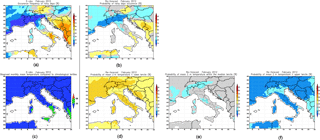
Figure 4February 2012: observations E-OBS versus the operational chain re-forecast: the E-OBS occurrence frequency of rainy days (a), the re-forecast probability of the rainy days occurrence (b), the E-OBS tertile climatological distribution (c), the re-forecast probability to stay below the lower tertile (d), the re-forecast probability to stay within the median tertile (e) and the re-forecast probability to stay above the upper tertile (f).
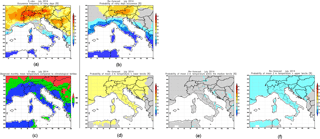
Figure 5July 2014: observations E-OBS versus the operational chain re-forecast: the E-OBS occurrence frequency of rainy days (a), the re-forecast probability of the rainy days occurrence (b), the E-OBS tertile climatological distribution (c), the re-forecast probability to stay below the lower tertile (d), the re-forecast probability to stay within the median tertile (e) and the re-forecast probability to stay above the upper tertile (f).
June 2003 is part of the hottest summer on record in Europe, with thermal monthly anomaly up to 5–6 ∘C on inland central-northern areas of Italy (Fig. 3c). This month was thermally characterized by an extraordinary frequency of circulation type 7 in the SAN9 classification (+11 days compared to the climatological frequency), while the anomalies in PCT9 were less evident (Table 1). As shown in Fig. 3a and b, a good matching is found between the observed fraction of rainy days and the mean predicted probability, whose highest values are located in the alpine region and the lowest in southern Italy. Concerning the 2 m temperature, the simulation shows the highest probability (around 50–70 %) to exceed the upper climatological tertile all over Italy (Fig. 3f). Moreover, the probability for values below the lower tertile (Fig. 3d) is low all over the country (around 10–20 %). This results are in good accordance with the observed monthly mean temperature (Fig. 3c).
February 2012 was characterized by north Atlantic blocking to zonal flux and advection of continental Euro-Asiatic air masses into Mediterranean basin. Very cold spells occurred during the first half of the month with frequent snowfalls on central-southern Italy due to a quasi-stationary low between southern Tyrrhenian and Ionian Sea. The persistence of this kind of circulation was highlighted by a strong positive anomalies of circulation type 9 in the PCT9 classification, while negative anomalies of circulation types 1 and 8 were counterbalanced by positive anomalies of circulation types 5 and 6 for the SAN9 classification (Table 1). Also for this case study the simulated probability of rainy days occurrence and the observed percentage of rainy days show very similar patterns and values all over the domain. Likewise, the observed monthly mean temperature fell below the lower tertile in good accordance with the predictions, with the lower tertile probability map (Fig. 4d) showing values between 50–60 % on a large part of the domain.
July 2014 was anomalously characterized by numerous instability episodes and fronts crossing Italy, determining negative thermal anomaly all over the Italian peninsula and several rainy days on central and northern Italy (Fig. 5a).
According to these characteristics, Table 1 pointed out some anomalies in the circulation types and in particular a 6 days negative anomaly of circulation type 7 for SAN9 and a 5 days positive anomaly of circulation type 2 for PCT9. Concerning the percentage of rainy days (Fig. 5a and b), this case study shows less satisfactory results, despite the overall pattern remains quite well described. A lack of rainy days was evident on central and northern Italy (Fig. 5b). On the contrary, the tertile probability maps for 2 m temperature show good agreement with the observed tertile climatological distribution.
The operative chain for seasonal forecast illustrated in this paper is a flexible and exportable solution for computing mesoscale probability distribution of surface meteorological variables, like temperature and precipitation. Spatial resolution is strongly dependent on the surface observation datasets. In our application of the method, the E-OBS gridded datasets (Haylock et al., 2008) at 25 km proved to be an acceptable solution for describing the geographical heterogeneity and orographic complexity of the Italian peninsula. However other consistent datasets could be used whenever they are available. For instance, a datasets at 5 km resolution based on a dense network of long series weather observations for central-north Italy is under development (http://www.arcis.it/wp/en/home-2/, last access: 31 July 2018).
The circulation type classifications adopted in the operational chain were specifically selected and calibrated for the stratification of surface temperature and precipitation for Italy, but different types of classifications are available in the COST 733 catalogue (http://cost733.geo.uni-augsburg.de/cost733wiki/Cost733Cat2.0, last access: 31 July 2018) for other European countries; alternatively a selection of the most suitable classification could be carried out for a specific region, as illustrated in other works (Vallorani et al., 2017; Broderick and Fealy, 2014).
A further element of flexibility is due to the possibility to use any conceivable numerical model all over the world, provided it runs in ensemble mode and a suitable climatology is available. The Bayesian approach used to produce the output maps fully maintains the probabilistic nature of the driving ensemble global model and represents the essential link to any decision making process, such as the cost/loss model (Palmer, 2002).
The simplified approach, based on Eq. (2), merges the information coming from the ensemble monthly forecast, the climatology and the circulation type classifications into a single product. Nevertheless this does not prevent one from evaluating separately the different sources of uncertainty. The method appears suitable for risk assessment analysis of extreme events strongly related to surface temperature and precipitation. Anyway the circulation types approach can be also extended to other variables like heat waves, cold spells, heavy precipitations or dry series, producing estimates for the occurrence probability of extremes, possibly at local scale and on a seasonal time horizon. The positive impact on agriculture, water management, energy and health system is easily understood.
The first preliminary test presented in this paper gives an idea of how good can be the matching between the probabilistic output and the observed monthly anomalies, even in case when strong anomalies occurred. As shown by the results presented here, if the monthly circulation types are correctly predicted, then a reliable forecast for the expected anomalies of rainy days and surface temperature becomes possible. The uncertainty coming from the prediction of the circulation types, as made by the ensemble seasonal forecast, could deteriorate the final probability estimation for the variable of interest, even in the case of highly informative climatological circulation types. Since we have not taken into account this aspect in the present study, further investigations on this issue are surely needed.
A verification procedure based on statistically consistent samples of measurements will be carried out in the near future starting from a retrospective seasonal forecast database (i.e. hindcasts of the ensemble NCEP-NCAR CFSv2), over a period of at least 10 years (Nikulin et al., 2018; Manzanas et al., 2018). Hence, the skill of the entire framework of seasonal forecasts will be evaluated throughout a proper score, like the logarithmic score (Benedetti, 2010) based on the relative entropy between the observed occurrence frequencies and the predicted probabilities for the forecasted events.
Text files of the two circulation type classifications (pct9 and san9) and the centroid values of MSLP and 500HGT (Fig. 2) are available to the following DOI (https://doi.org/10.5281/zenodo.1321007, Vallorani and Messeri, 2018). The pct9 and san9 classifications were selected through a sensitivity analysis detailed in a specific study (https://doi.org/10.1002/joc.5219, Vallorani et al., 2017).
GM, RB, AC and RV conceived of the presented idea, developed the theory and performed the computations. MR and RV performed post-processing and graphical output. BG and GM gave numerous suggestions for the methodology and encouraged our research. All authors discussed the results and contributed to the final manuscript.
The authors declare that they have no conflict of interest.
This article is part of the special issue “17th EMS Annual Meeting: European Conference for Applied Meteorology and Climatology 2017”. It is a result of the EMS Annual Meeting: European Conference for Applied Meteorology and Climatology 2017, Dublin, Ireland, 4–8 September 2017.
A special thank full of affection, esteem and gratitude to Giampiero Maracchi for having always believed and stimulated our research on
climaology and seasonal forecasts.
Edited by: Rasmus Benestad
Reviewed by: Ciaran Broderick and one anonymous referee
Angstrom, A.: On the effectivity of weather warnings, Nordisk Statistisk Tidskrift, 1, 394–408, 1922.
Benedetti, R.: Scoring Rules for Forecast Verification, American Meteorological Society, Mon. Weather Rev., 138, 203–211, https://doi.org/10.1175/2009MWR2945.1, 2010.
Broderick, C. and Fealy R.: An analysis of the synoptic and climatological applicability of circulation type classifications for Ireland, Int. J. Climatol., 35, 451–505, https://doi.org/10.1002/joc.3996, 2014.
Fernandez-Montes, S., Seubert, S., Rodrigo, F. S., Rasilla Álvarez, D. F., Herting, E., Esteban, P., and Philipp, A.: Circulation types and extreme precipitation days in the Iberian Peninsula in the transition seasons: Spatial links and temporal changes, Atmos. Res., 138, 41–58, https://doi.org/10.1016/j.atmosres.2013.10.018, 2014.
Haylock, M. R., Hofstra, N., Klein Tank, A. M. G., Klok, E. J., Jones P. D., and New, M.: A European daily high-resolution gridded dataset of surface temperature and precipitation for 1950–2006, J. Geophys. Res.-Atmos., 113, D20119, https://doi.org/10.1029/2008JD10201, 2008.
Huth, R., Beck, C., and Kuĉerová, M.: Synoptic-climatological evaluation of the circulation pattern over Europe, Int. J. Climatol., 36, 2710–2726, https://doi.org/10.1002/joc.4546, 2015.
Kanamitsu, M., Ebisuzaki, W., Woollen, J., Yang, S.-K., Hnilo, J. J., Fiorino, M., and Potter, G. L.: NCEP-DOE AMIP-II Reanalysis (R-2), B. Am. Meteorol. Soc., 83, 1631–1643, https://doi.org/10.1175/BAMS-83-11-1631, 2002.
Kysely, J.: Influence of the persistence of circulation patterns on warm and cold temperature anomalies in Europe: Analysis over the 20th century, Global Planet. Change, 62, 147–163, https://doi.org/10.1016/j.gloplacha.2008.01.003, 2008.
Leutbecher, M. and Palmer, T. N.: Ensemble forecasting, J. Comp. Phys., 227, 3515–3539, https://doi.org/10.1016/j.jcp.2007.02.014, 2007.
Manzanas, R., Gutierrez, J. M., Fernandez, J., Van Meijgaard, E., Calmanti, S., Magarino, M. E., and Cofino, A. S., and Herrera, S.: Dynamical and statistical downscaling of seasonal temperature forecasts in Europe: Added value for user applications, Clim. Serv., 9, 44–56, 2018.
Nikulin, G., Asharaf, S., Magarino, M. E., Calmanti, S., Cardoso, R. M., Bhend, J., Fernandez, J., Frias, M. D., Frohlich, K., Fruh, B., Garcia, S. H., Manzanas, R., Gutierrez, J. M., Hansson, U., Kolax, M., Liniger, M. A., Soares, P. M. M., Spring, C., Tome, R., and Wyser, K.: Dynamical and statistical downscaling of a global seasonal hindcast in eastern Africa, Clim. Serv., 9, 72–85, 2018.
Palmer, T. N.: The economic value of ensemble forecasts as a tool for risk assessment: From days to decades, Q. J. Roy. Meteor. Soc., 128, 747–774, 2002.
Philipp, A., Beck, C., Huth, R., and Jacobeit, J.: Development and comparison of circulation type classifications using the COST 733 dataset and software, Int. J. Climatol., 36, 2673–2691, https://doi.org/10.1002/joc.3920, 2014.
Prudhomme, C. and Genevier, M.: Can atmospheric circulation be linked to flooding in Europe?, Hydrol. Process., 25, 1180–1990, 2011.
Ramos, M., Ramos, R., Sousa, P., Trigo, R. M., Janeira M., and Prior, V.: Cloud to ground lightning activity over Portugal and its association with circulation weather types, Atmos. Res., 101, 84–101, https://doi.org/10.1016/j.atmosres.2011.01.014, 2011.
Russo, S., Sillmann, J., and Fischer, E. M.: Top ten European heatwaves since 1950 and their occurrence in the coming decades, Environ. Res. Lett., 10, 124003, https://doi.org/10.1088/1748-9326/10/12/124003, 2015.
Vallorani, R., Bartolini, G., Betti, G., Crisci A., Gozzini B., Grifoni D., Iannuccilli M., Messeri A., Messeri G., Morabito M., and Maracchi G.: Circulation type classifications for temperature and precipitation stratification in Italy, Int. J. Climatol., 38, 915–931, https://doi.org/10.1002/joc.5219, 2017.
Vallorani, R., Messeri, G., Crisci, A., and Iannuccilli, M.: Circulation type classifications for surface temperature and precipitation optimized for Italy, https://doi.org/10.5281/zenodo.1321007, 2018.


