 | 02 Jul 2019
A climatological assessment of balancing effects and shortfall risks of photovoltaics and wind energy in Germany and Europe
Michael Borsche
Uwe Pfeifroth
Jörg Trentmann
Jaqueline Drücke
Paul Becker
With an increased share of solar and wind energy e.g. in the German and European energy systems it is becoming increasingly important to analyze the impact of weather variability on the reliability of the energy production. In this study, we calculate solar PV and wind power capacity factors using two recently developed climatological datasets that provide information with high spatial and temporal details on the continental (European) scale and are of sufficient length for assessments at climatological time scales: Surface radiation derived from meteorological satellites (SARAH-2) and wind speed from a high-resolution regional reanalysis (COSMO-REA6). Balancing effects are analysed: On average, the seasonal cycles of PV and wind power production complement each other in Germany as well as in Europe. The frequency of events with a risk of low electricity generation is analyzed under different assumptions. When using wind energy over German land areas as a reference case, the results illustrate that the number of low production events is reduced when Germany's Exclusive Economic Zone is included into the analysis, or when a combined system of PV and wind energy is considered. A European-wide analysis also leads to a distinct reduction of such events.
- Article
(1327 KB) - Full-text XML
- BibTeX
- EndNote


Germany as well as the European Union aim at extending the share of renewable energy in the electricity sectors (for Germany see German Renewable Energy Sources Act (Bundesministerium für Justiz und Verbraucherschutz, 2017); for the European Union: Renewable Energy Directive, European Union, 2018). This extension will be largely based on wind and solar energy, esp. photovoltaics (PV). Because of the fluctuating nature of weather parameters, strategies are needed to cope with fluctuations and phases of low energy generation from renewable energy sources, e.g. by reserve capacity or large-scale exchange of energy. Some studies have shown the potential of regional compensation of energy generation in Europe, e.g. for wind energy (e.g. Grams et al., 2017). Gerhardt et al. (2017) performed a detailed study of the European energy system based on the meteorological conditions of selected years and illustrated the feasibility of a renewable energy system with a reduction of CO2-emission of 95 %. For that analysis they used 7 years of archived meteorological output of the numerical weather prediction (NWP) model COSMO of Germany's national meteorological service (DWD, Deutscher Wetterdienst). The planning of a reliable energy system has to consider the frequency of rare events with low energy production. The investment into storage (e.g. Graabak et al., 2017) or alternative solutions depends on the length and spatial extent of such situations. Graabak and Korpås (2016a) reviewed existing studies on the role of the Nordic hydropower systems for balancing and storage in a future Northern/Central European power system. One of their conclusions was that uncertainties in simulations of the future energy system can still be reduced by modelling the system with higher spatial and temporal resolution. Different strategies for optimal integration of storage are also discussed in a recent analysis of Zerrahn et al. (2018). They conclude that electrical storage is unlikely to limit the transition to renewable energy. A detailed literature review can be found in Child et al. (2019).
To capture the frequency of such rare situations, the analysis needs to be based on sufficiently long meteorological datasets (preferably some decades, see Pfenninger, 2017; Collins et al., 2018). New data sources with consistent quality and high spatial and temporal resolution over the last decades became available as a result of recent activities: They are based on meteorological satellites and model-based reanalysis and are available for Europe at a resolution of a few kilometers and with hourly resolution (or better). Specific versions of such datasets are used here in combination to illustrate the potential of these new open data products (of DWD and EUMETSAT's CM SAF) for energy related applications. The focus of this study is on the assessment of situations with meteorological conditions that lead to periods of low solar PV and/or wind power production. We evaluate whether considering larger regions (e.g. Europe compared to Germany) results in a decreased number of such situations. Details of the datasets are described in Sect. 2. The methodology for the assessment and comparison of low production events is described in Sect. 3. Results for Germany and Europe are shown in Sect. 4.
For the assessment at climatological time scales on the continental scale, two types of data sources have the potential to provide information with high spatial and temporal details: Firstly, surface radiation data can be derived from meteorological satellites that have now provided observations for a few decades. Secondly, model-based reanalyses can provide information on wind conditions also at hub height of modern wind energy converters (in contrast to conventional weather stations). They are based on modern NWP systems and are an established tool for a wide range of applications and frequently used for energy-related applications. However, the majority of existing studies are based on global reanalyses, which are of rather coarse resolution. In recent years, regional reanalysis datasets have been developed as well. They are based on regional numerical weather prediction models (including their data assimilation schemes) and use boundary conditions from global reanalyses.
Details of the datasets are described in the following.
2.1 Radiation: Surface Solar Radiation Data Set-Heliosat, Edition 2
The Surface Solar Radiation Data Set-Heliosat, Edition 2 (SARAH-2, Pfeifroth et al., 2017), is a climate data record of the surface incoming solar radiation based on the geostationary Meteosat satellite series covering Africa, Europe, and the Atlantic Ocean. SARAH-2 is provided by the EUMETSAT Satellite Application Facility on Climate Monitoring (CM SAF) and covers the time period 1983–2015. For this study, the global and direct radiation at half-hourly temporal resolution have been used for the time period of 1995–2015 (the overlapping period of the COSMO-REA6 and SARAH-2 dataset). SARAH-2 offers a high spatial resolution of and has been proven to be of high accuracy and stability (see e.g. Urraca et al., 2017; Pfeifroth et al., 2018). A thorough overview of the basic retrieval principle of the SARAH climate data record series can be found in Müller et al. (2015). SARAH-2 has proven its suitability for solar energy related applications (e.g. Pfenninger and Staffel, 2016). The SARAH-2 dataset, as well as the successor (SARAH-2.1, covering 1983–2017, Pfeifroth et al., 2019), is publicly available via: http://www.cmsaf.eu (last access: 25 June 2019).
2.2 Wind: COSMO-REA6
COSMO-REA6 is a regional reanalysis based on DWD's NWP-model COSMO. The reanalysis was developed within the Hans-Ertel-Centre for Weather Research (Universities of Bonn and Cologne; see Bollmeyer et al., 2015) of Deutscher Wetterdienst (Simmer et al., 2016). For the production of COSMO-REA6 the nudging method (Schraff and Hess, 2003) was applied to assimilate radiosonde, aircraft, wind profiler, and surface level data. COSMO-REA6 provides a dataset of several meteorological parameters for the European CORDEX domain (EURO-CORDEX) at a spatial resolution of ∼ 6 km (0.055∘) and currently covers the period 1995 to 2017 (with planned updates of recent years). The 3-dimensional fields of the atmospheric parameters are available at hourly resolution. The quality of wind data has been evaluated in comparison with selected wind masts by Borsche et al. (2016) and in comparison to the conventional meteorological stations of DWD by Kaiser-Weiss et al. (2015). A comparison with other European regional reanalyses has been performed within the EU-funded project UERRA (Niermann et al., 2018, 2019; Kaiser-Weiss et al., 2019), showing a generally good quality of COSMO-REA6 in comparison to other products, e.g. based on the comparison with German station data. In this study, the reanalysis datasets are not only used to provide the wind speed at hub height, but also to provide the additional parameters (beyond radiation) that are needed to assess the photovoltaic production potential (temperature and wind).
Selected parameters of the COSMO-REA6 reanalysis are publicly available (DWD/HErZ, 2019) and have been used in other energy-related studies (e.g. Henckes et al., 2018; Germer and Kleidon, 2019; Ramirez Camargo et al., 2019).
One focus of our study is the comparison of variability of wind and photovoltaic electricity production. The meteorological variables wind speed and solar radiation are not directly suitable for comparison, because of the non-linear relationship between those meteorological parameters and potential energy yield. Therefore the so-called capacity factor is used in this study to make wind speed and solar radiation comparable. The capacity factor (CF) is a frequently used parameter in energy applications and is the unitless ratio between the actual energy output over a given period of time and the maximum possible energy output over that period.
For our analysis, we converted the meteorological parameters to capacity factors based on the assumption of a typical modern photovoltaic and wind energy system. The detailed assumptions for both are described in the following:
3.1 Wind
The calculation of the wind-CF was performed by means of a power curve of a modern large wind turbine. The power curve of an Enercon_E126-7.5MW turbine was used as implemented in the R-package bReeze (Graul and Poppinga, 2018).
The CF was calculated for each hour and grid point for the model level centered at around 116 m height, i.e. the fourth model level above ground (Borsche et al., 2016). No additional vertical interpolation was applied, i.e. the analysis is based on the direct model output for that level. The COSMO-model has a terrain following vertical coordinate system and the height of the model levels is slightly reduced over high mountains.
The average hub height of new onshore converters in Germany in 2017 was 128 m, with 50 % of all new converters in the range between 119 and 141 m (Fraunhofer IEE, 2018). For current and future new installations with such hub heights slightly better performance can be expected compared to our analysis height of 116 m.
3.2 Photovoltaics
For the calculation of the photovoltaic capacity factors (PV-CF) the method described by Huld and Gracia Amillo (2015) is used. Main input data for the PV-CF calculation are the global and direct surface solar radiation given by SARAH-2 and 2 m temperature and 10 m wind speed provided by the COSMO-REA6 regional reanalysis. The latter two are used, together with the incoming solar radiation, to estimate the PV-module temperature which influences the PV performance. In this study, the PV-CF are calculated given a standard crystalline silicon (c-SI) PV-module oriented southwards with an inclination angle of 25∘. Basically, the PV capacity factors are defined as the current weather-dependent PV performance relative to Standard Test Conditions (see IEC Central Office, 2005), which are defined as 1000 W m−2 irradiance and a PV-module temperature of 25 ∘C.
3.3 Validation
The generated wind- and PV- capacity factors are validated using actual wind- and PV-generated electricity for 2015 taken from the Open Power System Data (2018). Figure 1 shows the high correlation of the generated capacity factors for wind and PV, with values higher than 0.9. The overestimation of the simulated capacity factor is due to the neglect of additional losses in the transformation of the solar/wind energy to electrical power, e.g. in converters, as well as possibly systematic modelling errors (Saint-Drenan et al., 2017). Previous validation studies of the meteorological datasets do not indicate a general systematic positive bias that would explain the overestimation in the simulated capacity factors (see references in Sect. 2). For our analysis, however, the high correlation of the simulated with the measured capacity factors is most relevant.
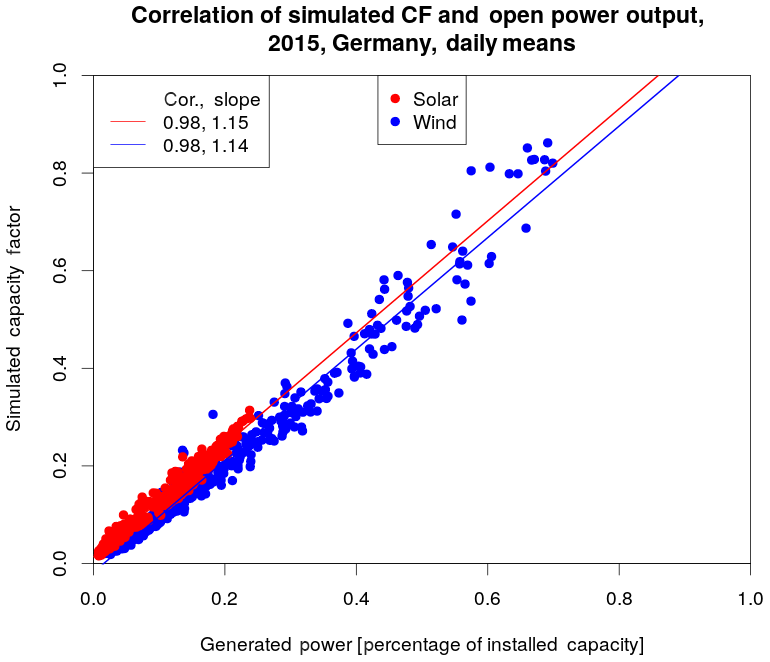
Figure 1Scatterplot of daily means of simulated and actually generated wind and photovoltaic power for Germany, 2015; Generated power data is taken from the Open Power System Data (2018).
3.4 Averaging and aggregation
Our analysis for the combination of wind and PV is performed on the same spatial grid; therefore the radiation dataset has been re-gridded to 6 km resolution. The capacity factors for wind and PV are calculated for each grid cell and time step. We analyze the relative seasonal cycles of wind versus PV and therefore no assumption has to be made about the absolute installed capacity. Furthermore, an aim of our study is an assessment of the theoretical potential for large scale balancing effects of wind and solar energy. This is done without detailed assumption on the distribution of existing or future power plants. The purpose of the study is a climatological assessment independent of specific national strategies within the next years. For the analysis an equal distribution of both technologies over all grid cells is assumed. In the averaging procedure no weighting is applied to both technologies, i.e. for each grid cell the same installed capacity for wind and PV is assumed (normalized to 1, i.e. 50 % wind, 50 % PV). This simplified assumption is close to the mix of 55 % wind to 45 % PV, which was suggested by Heide et al. (2010) as an optimal mix of wind and solar power in a future, 100 % renewable Europe. The fraction of installed capacity of wind to PV in Germany in 2017 was ∼ 57 % to ∼ 43 %.1 In order to illustrate the climatological variability and complementarity, the capacity factors are averaged country-wise without a further weighting of grid-cells. Thereby, the analysis also considers sites with relatively weak conditions. In reality the priority for installations would be on better sites, therefore it can be assumed that in reality better results can be achieved. Regional average capacity factors are calculated for each country without assumptions on distribution networks. In addition, for Germany the same approach is also applied to Germany's Exclusive Economic Zone, which is the sea zone prescribed by the United Nations Convention on the Law of the Sea over which Germany has special rights regarding the exploration and use of marine resources, including energy production from water and wind. Scandinavia was excluded from the analysis because of the minor role of photovoltaics in this region. The analysis only refers to energy production. Variability in energy consumption is not considered.
4.1 Spatial distribution
Figures 2 and 3 show the regional distribution of the average long-term (1995–2015) capacity factors for wind and photovoltaics based on the assumptions described in Sect. 3. Figure 2 shows the results for Europe; Fig. 3 the details for Germany. In case of wind Fig. 3 also includes results for Germany's Exclusive Economic Zone. The maps confirm several well-known features:
-
For Europe, highest capacity factors for wind prevail in the northern parts, esp. in regions close to the coasts. For photovoltaics highest values are calculated for the southern parts of Europe.
-
In Germany, high average wind speeds in the coastal regions and in some mountainous areas (esp. the Central German Uplands) result in higher capacity factors. Especially for the Exclusive Economic Zone, considerably higher capacity factors are calculated, illustrating the potentially high contribution that this offshore region could contribute to the German energy production. For photovoltaics, highest capacity factors are derived for the southern parts of Germany.
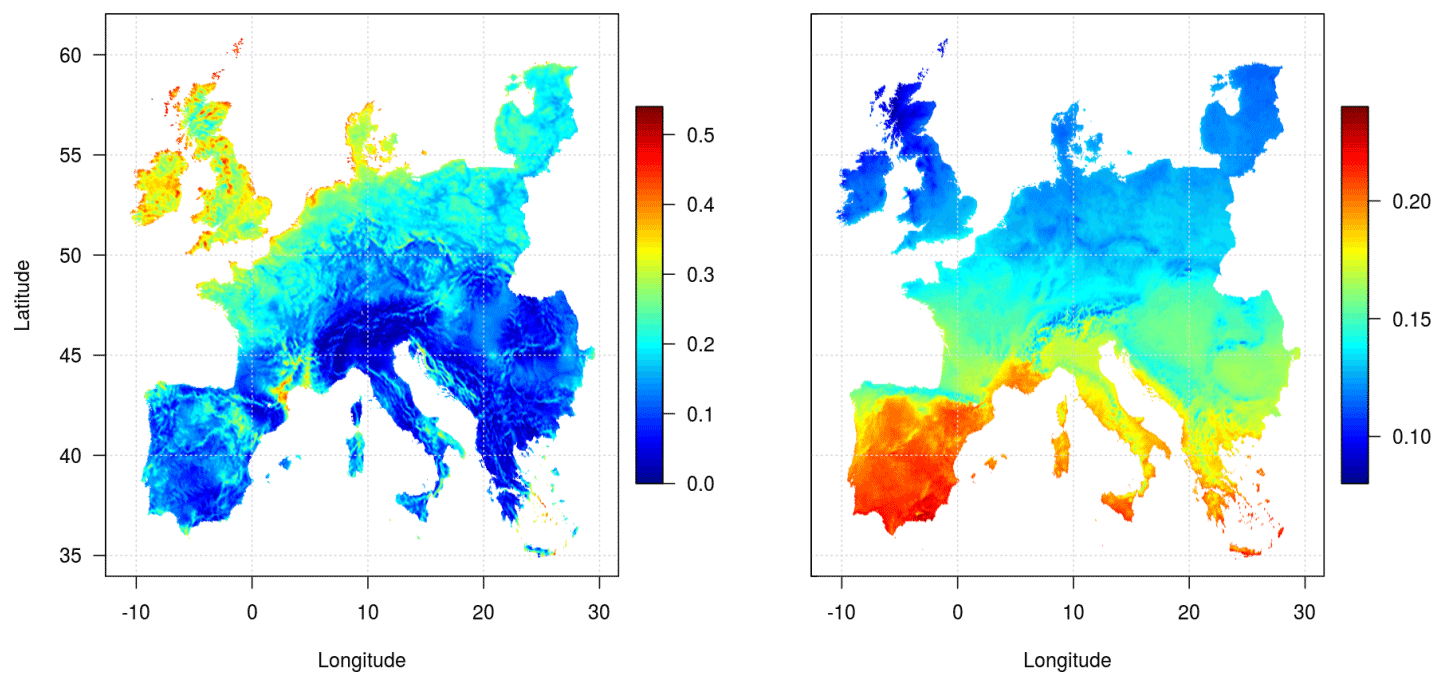
Figure 2Average capacity factors for wind (left) and photovoltaics (right) in Europe (1995–2015) derived from the regional reanalysis COSMO-REA6 and the satellite-based SARAH 2 dataset.
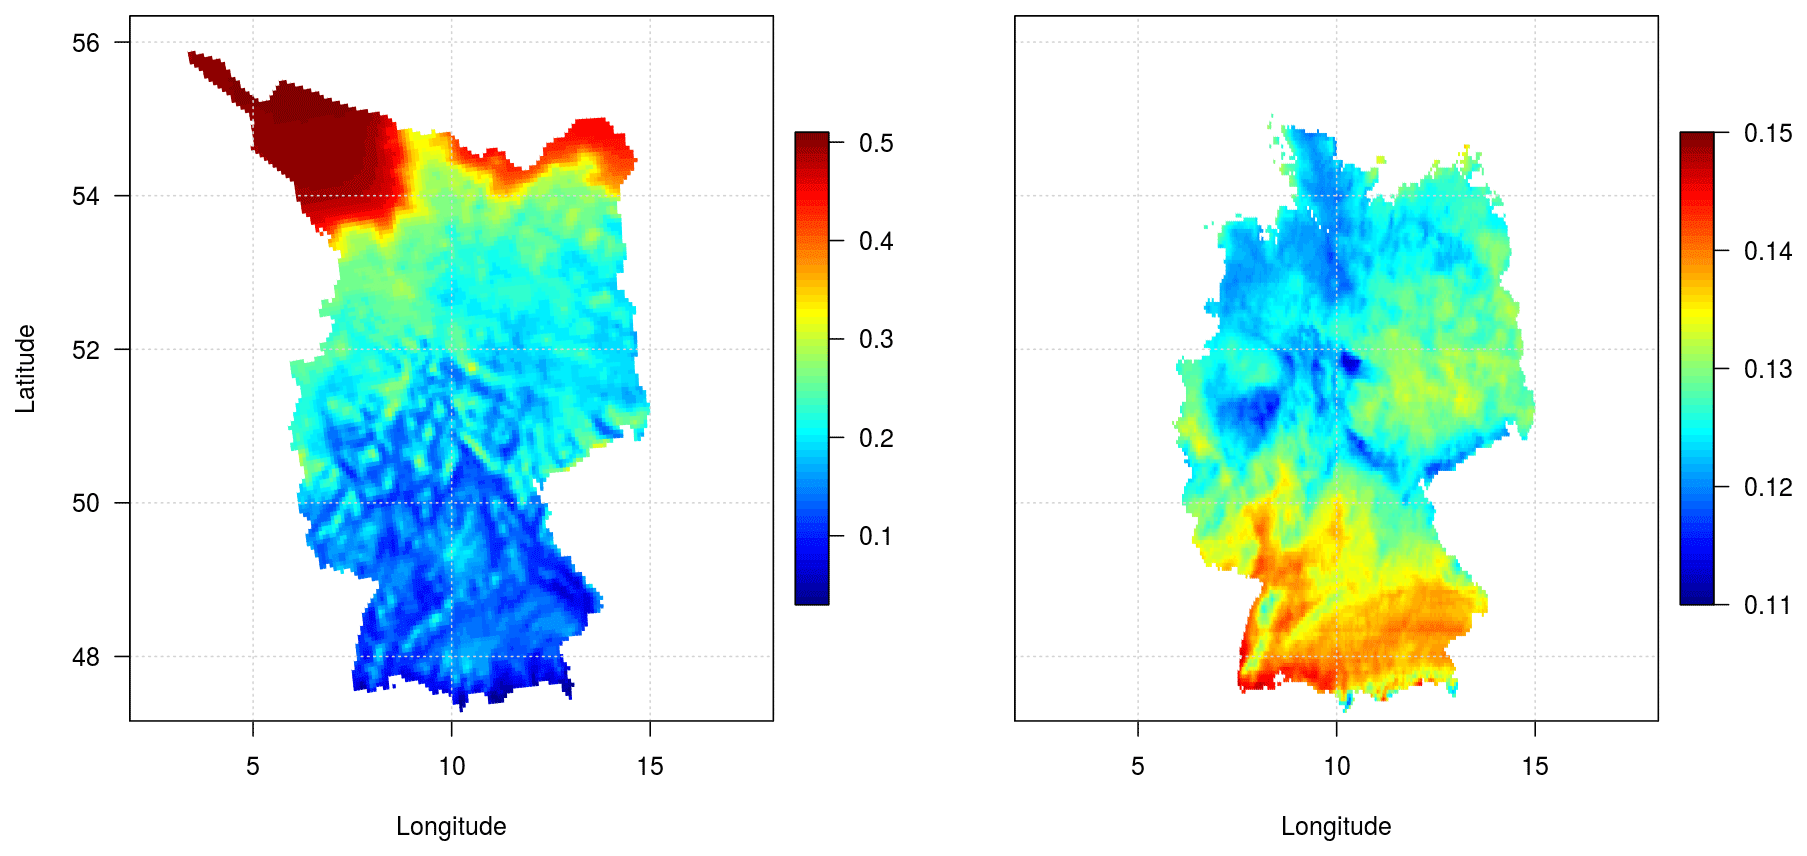
Figure 3Average capacity factors for wind (left) and photovoltaics (right) in Germany and Germany's Exclusive Economic Zone (1995–2015).
4.2 Seasonal cycle
Figures 4 and 5 show the average seasonal cycle of the capacity factors over Germany and Europe to illustrate the complementary cycles of both energy sources. The figures illustrate the meteorological potential for balancing effects for both regions. Therefore no detailed assumptions on the (current or future) distribution of individual power plants have been applied in this analysis, but an equal density over Germany and Europe was assumed. The average daily capacity factors are based on the data from 1995 to 2015. The black line is the average of wind and photovoltaics (based on the assumption of an equal share of installed capacity of both). For both regions, the seasonal cycle of wind and photovoltaics are complementary. For photovoltaics higher capacity factors are calculated for summer, for wind higher capacity factors occur in winter. In contrast to the seasonal cycles of both individual technologies, the combination leads to a much less distinct seasonality: When averaged with an assumed equal share of both technologies an almost constant distribution over the seasons is derived (for Germany as well as for Europe). This analysis is based on long-term averages. Nevertheless, periods with low production can occur and will be analyzed in the next section.

Figure 4Seasonal cycle of the capacity factors for wind and PV for Germany. The dots represent daily average values for the analysis period of 21 years. The lines are centered 11 d running means. The daily resolution is shown to illustrate the remaining variability in a 21 year dataset for both parameters. A longer analysis period would result in additional smoothing.
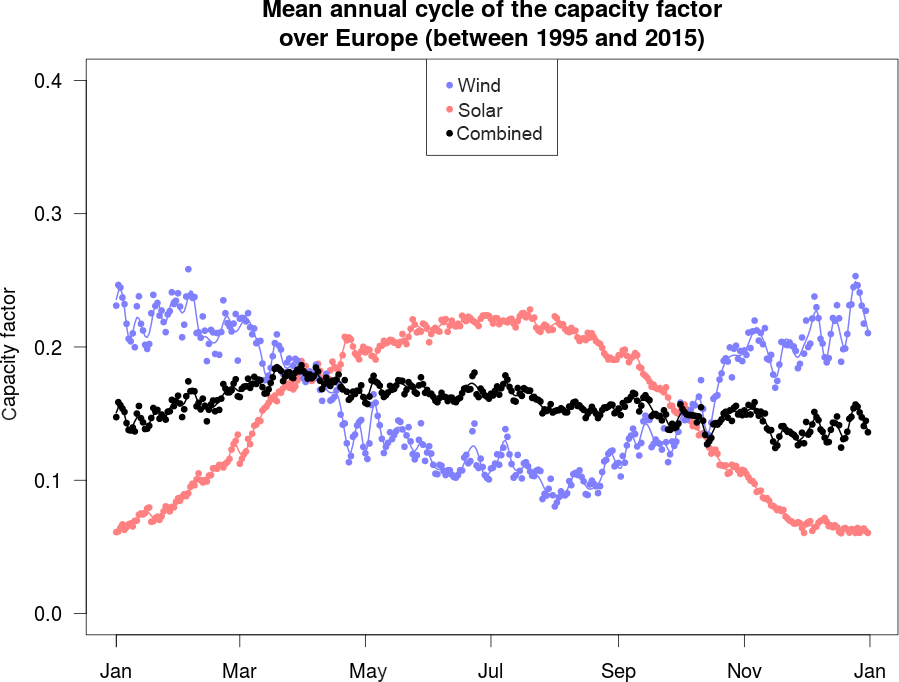
Figure 5Seasonal cycle of the capacity factors for wind and PV for Europe, otherwise same as Fig. 4.
4.3 Frequency of low production events
Because of the fluctuating nature of renewable energies, an important issue is the frequency, duration and spatial extent of meteorological situations when both energy sources only operate at a low fraction of their installed capacity. With an increasing share of renewable energy, such events are becoming more important and determine the requirements for storage capacity or alternative solutions, e.g. sector coupling (see for example Quaschning, 2016). Gerhardt et al. (2017, p. 7) discussed the example of 24 January 2017, when both, wind and PV only provided a minor contribution to the German electricity production (less than 5 % of their installed capacity, whereas throughout the whole year 2017 they provided about approx. 16 % of their jointly installed capacity2).
Here we analyze the frequency of events, when the average capacity factor in a region remained below a defined threshold for a specific duration. In the following we compare the number of events for selected event durations (48, 72, 96, and 120 h) and thresholds (0.05, 0.1, and 0.15). Higher thresholds are not analyzed, because the average capacity factor itself is only in the order of approx. 0.2, for wind in Germany (e.g. based on production data and installed capacity in 2018).
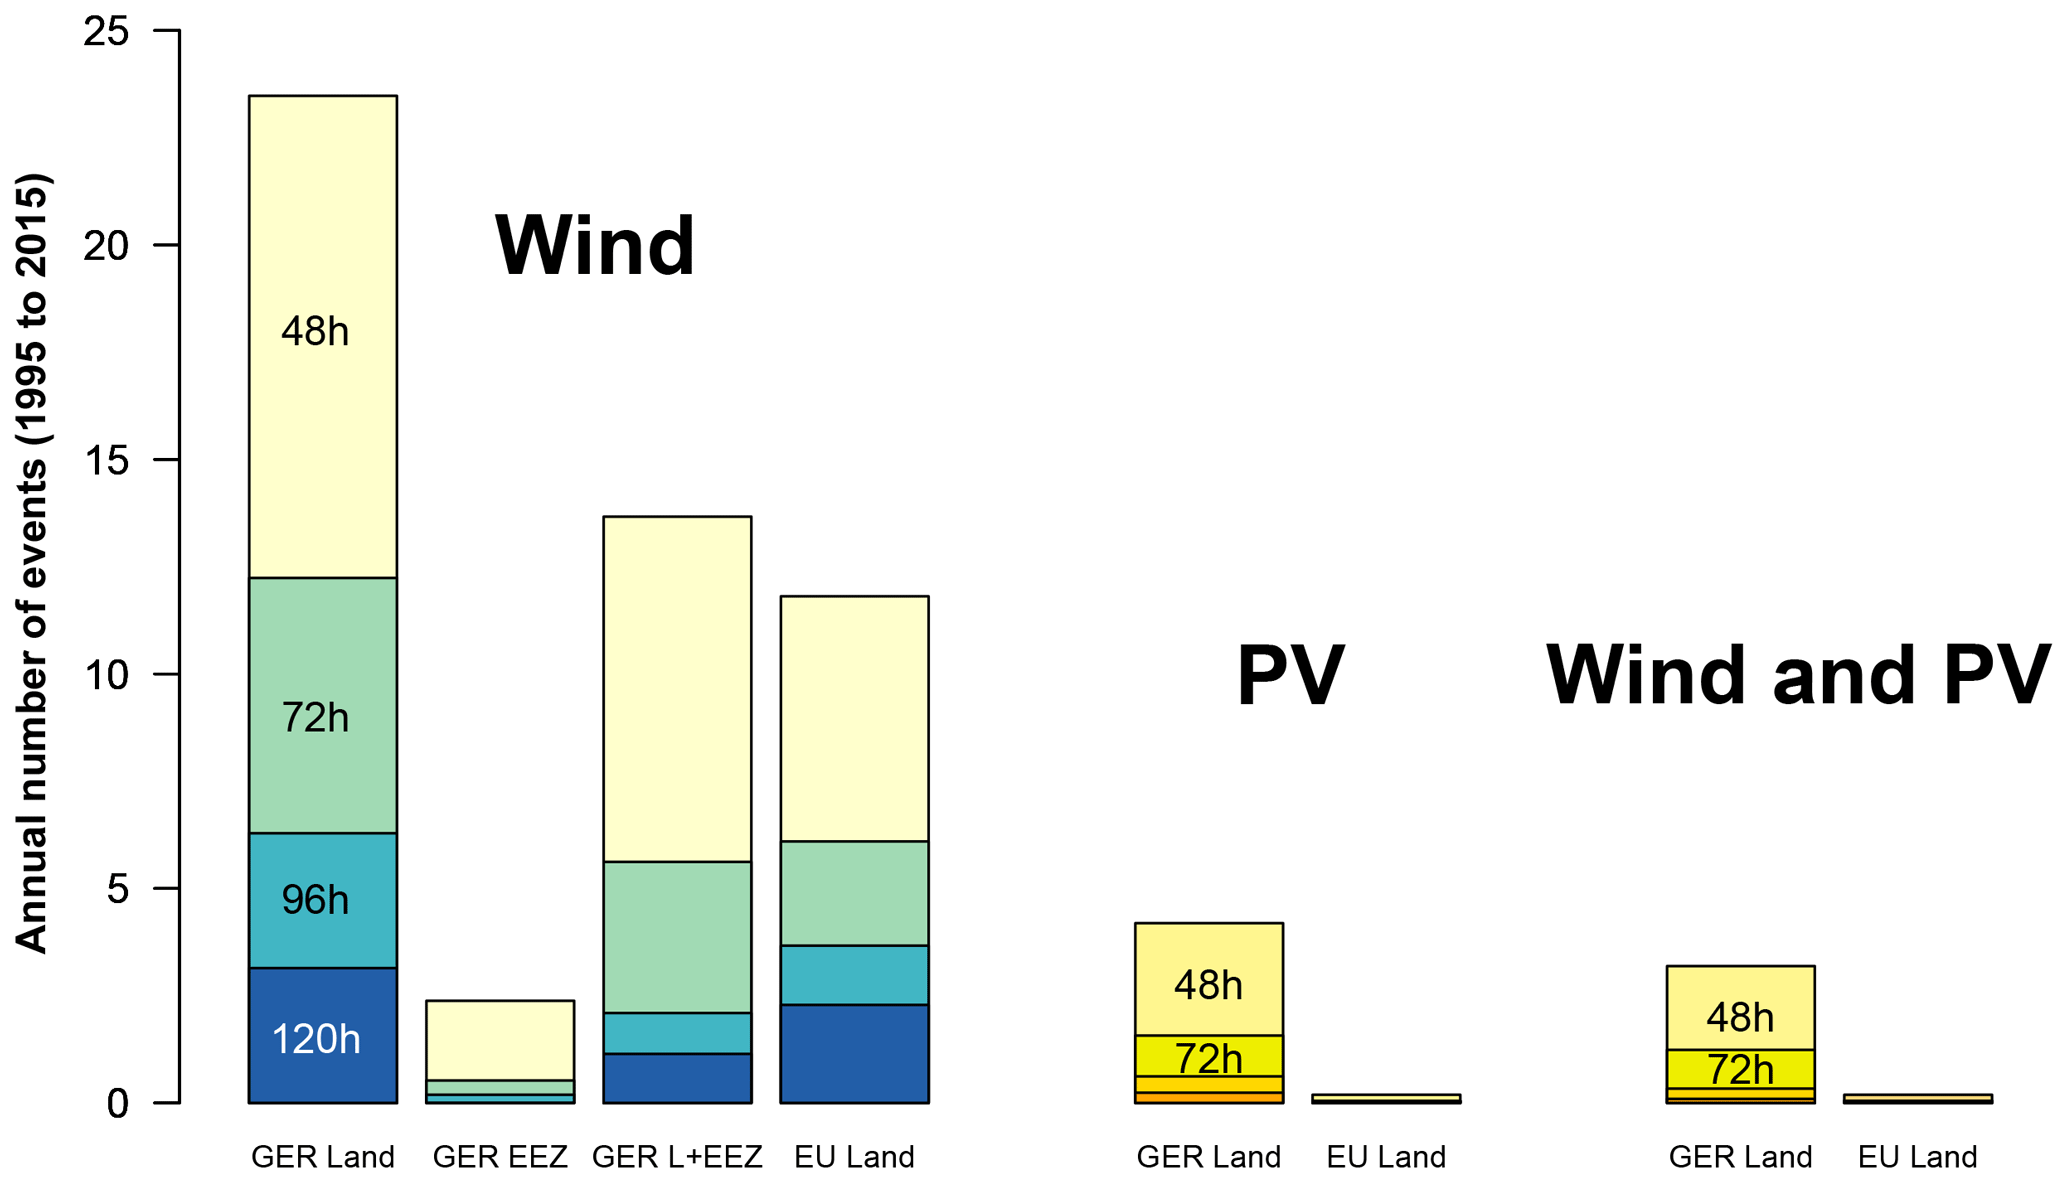
Figure 6Average annual number of events within a period of 21 years of data when the capacity factor remained below a threshold value of 10 % for a specific period of time. The frequency is based on the period 1995 to 2015. Several settings are analyzed: Wind, photovoltaics (PV) and a combination of both for the following regions: German land areas (GER land, the German Exclusive Economic Zone (GER-EEZ), and the European land area (as defined in the text). The bars for all event durations refer to the zero point of the y-axis.
As an example, Fig. 6 shows a comparison of the frequency of events with low energy production, when a capacity factor threshold of 0.1 is applied. The comparison is based on different lengths of these events (48, 72, 96, and 120 h). The capacity factor is averaged over Germany (with and without EEZ, and EEZ only) and Europe at hourly resolution. Then the number of events was counted when that capacity factor was below the threshold value (in the period 1995 to 2015). The figure shows the average annual number of events for several settings (PV and wind alone or combined, averaged over Germany or Europe). For wind over German land areas (left bar), 23 events are identified with a duration of at least 48 h. Events of longer duration occur less frequently, e.g. ∼ 6 events with a duration of > =96 h. The number of events is considerably smaller for Germany's Exclusive Economic Zone (second bar), therefore the combination of German land areas and Germany's EEZ also results in a reduction of events (compared to land area alone, third bar, ∼ 14 events with a duration of > =48 h). As indicated by the fourth bar, the number of events is smaller for Europe (land) than for Germany (land), but also at that scale some events occur (∼ 12 for a length >=48 h). For PV, the number of events is smaller when the same criteria are applied (e.g. > =48 h, CF < =0.1) for Germany as well as for Europe (fifth and sixth bar). The combination of wind and PV leads to an additional reduction in the number of events (seventh and eighth bar; 50 % of the installed capacity for each, wind and PV). Figures A1 and A2 in the Appendix show the same analysis for thresholds of 0.05 and 0.15. Quantitatively, the results show the same relative behavior, but with a lower/higher absolute number of events. Especially for the case of 0.05 (Fig. A1) a very distinct reduction of events is derived for wind when looking at the European instead of the German scale.
In this study, two high-resolution datasets have been used to estimate long-term capacity factors for wind and photovoltaics for Europe at high spatial and temporal resolution. The assessment was done based on simplified assumptions, especially a European-wide equal distribution of installations. The intention of that approach is not to simulate the current energy system, but to provide a climatological assessment independent of specific national strategies. For Germany as well as Europe, the derived seasonal cycles for both technologies are complementary to each other. When combined, the higher capacity factors for wind in winter compensate the lower values of photovoltaics. The hourly resolution of the datasets allows identifying periods with low production. For the comparison of such events, a set of durations and thresholds has been analyzed. When using wind energy over German land areas as a reference case, the results illustrate that the number of low production events (e.g. defined as a period with a length of at least 48 h with a production lower that 0.1 of the installed capacity) is reduced when the Exclusive Economic Zone is included into the analysis, or when a combined system of solar PV and wind energy is considered. A European-wide analysis also leads to a distinct reduction of such events.
The results should be understood as a relative climatological comparison based on simplified assumptions. As in this analysis several unfavorable assumptions have been made, especially the assumed uniform spatial distribution of installations, it can be assumed that the conclusions are not a result of a too optimistic setting. In reality, installations will typically be located in more favorable locations. Also, PV panel orientation (see e.g. Tafarte et al., 2019) or wind turbine type have not been optimized by location (see e.g. Ryberg et al., 2019). However, it should be noted that favorable locations for wind and solar power might also be more sensitive to climate variability. Therefore, a more realistic distribution of installations could also result in an increased number of low power events, at least compared to the average capacity factor. For Germany, the EEZ is such a favorable region. In that specific case, a distinct reduction of low power events was simulated.
The strong reduction of low production events in case of wind (Fig. A1) for Europe (relative to Germany) is consistent to the results of other studies. Grams et al. (2017) showed that weather regimes provide a meteorological explanation for multi-day fluctuations in Europe's wind power and that their contrasting inter-regime behavior can help to eliminate output variations. Pozo-Vazquez et al. (2011) showed for the example of the Mediterranean region that the spatial patterns of the influence of the North Atlantic Oscillation (NAO) on the solar and wind energy resources contribute to spatial and local balancing between these energy resources. In a review paper Graabak and Korpås (2016b) assessed the current knowledge on a variety of variability characteristics and recommended further systematic assessments of variability of European wind and solar power resources. The high resolution datasets used in our study provide additional opportunities to analyze such characteristics.
Similar to our analysis of the seasonal cycle, the datasets would also allow analyzing balancing effects at the hourly to daily scale. However, we did not perform an equivalent analysis at that scale, because electricity consumption also has a very distinct daily cycle and storage solutions are easier to develop. Just analyzing balancing effects of the day-night-cycle between wind and PV without including the daily cycle of consumption could be misleading.
Other studies have also demonstrated complementarity of wind and solar power for other regions of the world, e.g. for West Africa (Sterl et al., 2018), China (Ding et al., 2017), Canada (Hoicka and Rowlands, 2011) or Brazil (De Oliveira Costa Souza Rosa et al., 2017).
The meteorological data used in this study is openly accessible: The satellite-based Surface Radiation Data Set – Heliosat (SARAH) – Edition 2 (Pfeifroth et al., 2017) is available via: https://doi.org/10.5676/EUM_SAF_CM/SARAH/V002, 2017. Selected parameters of the COSMO-REA6 regional reanalysis are publicly available via DWD's Climate Data Center: https://opendata.dwd.de/climate_environment/REA/ (DWD/HErZ, 2019).

Figure A1Average annual number of events within a period of 21 years of data when the capacity factor remained below a threshold value of 5 % (otherwise same as Fig. 6).
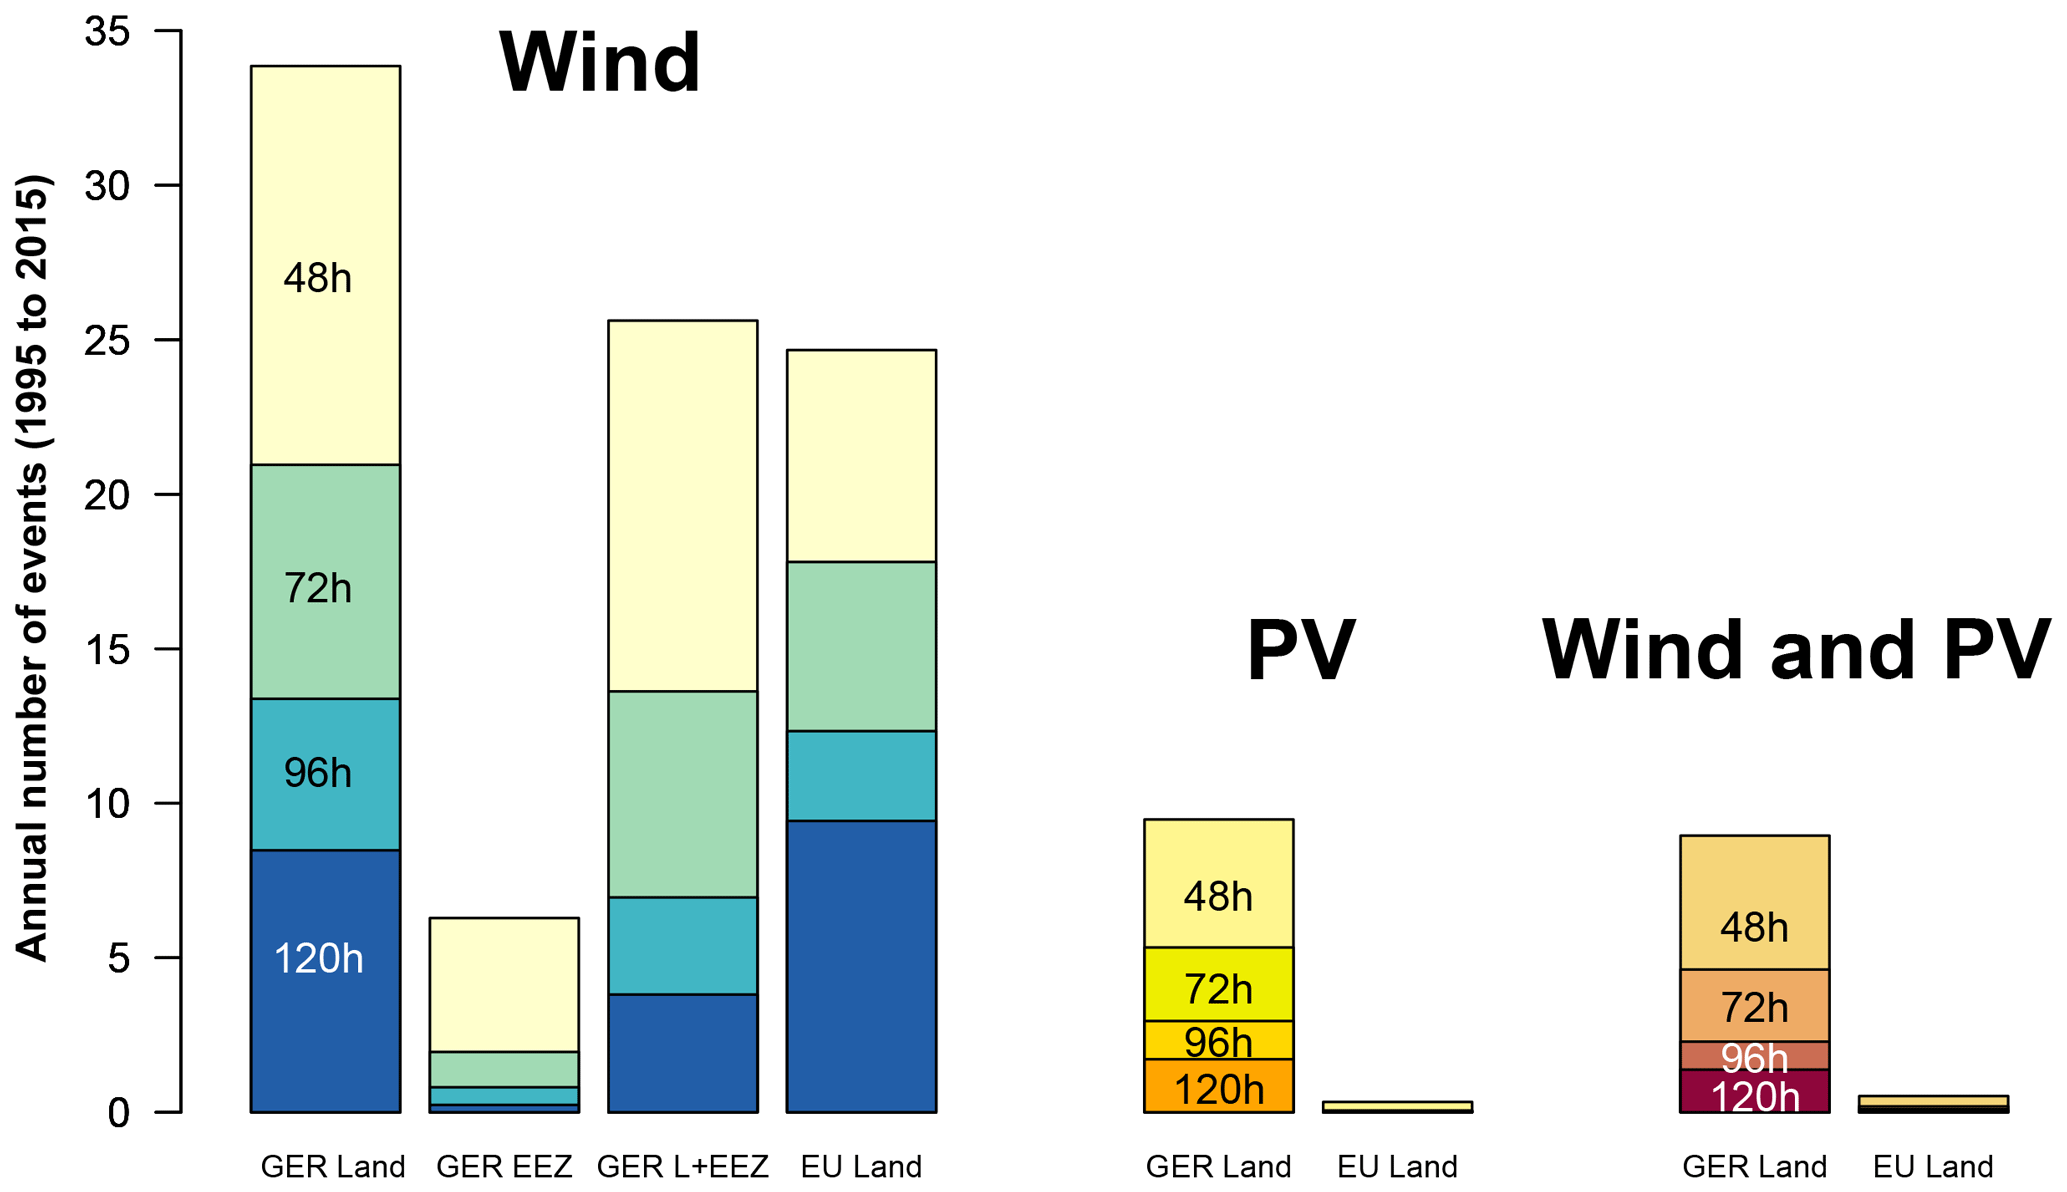
Figure A2Average annual number of events within a period of 21 years of data when the capacity factor remained below a threshold value of 15 % (otherwise same as Fig. 6).
The authors declare that they have no conflict of interest.
This article is part of the special issue “18th EMS Annual Meeting: European Conference for Applied Meteorology and Climatology 2018”. It is a result of the EMS Annual Meeting: European Conference for Applied Meteorology and Climatology 2018, Budapest, Hungary, 3–7 September 2018.
The regional reanalysis COSMO-REA6 was produced within DWD's Hans-Ertel Centre for Weather Research at the University of Bonn. We are grateful to the two anonymous referees for their helpful comments.
This paper was edited by Sven-Erik Gryning and reviewed by two anonymous referees.
Bollmeyer, C., Keller, J. D., Ohlwein, C., Wahl, S., Crewell, S., Friederichs, P., Hense, A., Keune, J., Kneifel, S., Pscheidt, I., Redl, S., and Steinke, S.: Towards a high-resolution regional reanalysis for the European CORDEX domain, Q. J. Roy. Meteor. Soc., 141, 1–15, https://doi.org/10.1002/qj.2486, 2015.
Borsche, M., Kaiser-Weiss, A. K., and Kaspar, F.: Wind speed variability between 10 and 116 m height from the regional reanalysis COSMO-REA6 compared to wind mast measurements over Northern Germany and the Netherlands, Adv. Sci. Res., 13, 151–161, https://doi.org/10.5194/asr-13-151-2016, 2016.
Bundesministerium für Justiz und Verbraucherschutz: Gesetz für den Ausbau erneuerbarer Energien 2017, available at: https://www.gesetze-im-internet.de/eeg_2014/__1.html (last access: 25 May 2019), 2017.
Child, M., Kemfert, C., Bogdanov, D., and Breyer, C.: Flexible electricity generation, grid exchange and storage for the transition to a 100 % renewable energy system in Europe, Renew. Energ., 139, 80–101, https://doi.org/10.1016/j.renene.2019.02.077, 2019.
Collins, S., Deane, P., Gallachóir B. Ó., Pfenninger, S., and Staffell, I.: Impacts of Inter-annual Wind and Solar Variations on the European Power System, Joule, 2, 2076–2090, https://doi.org/10.1016/j.joule.2018.06.020, 2018.
De Oliveira Costa Souza Rosa, C., Alonso Costa, K., Da Silva Christo, E., and Braga Bertahone, P.: Complementarity of Hydro, Photovoltaic, and Wind Power in Rio de Janeiro State, Sustainability, 9, 1130, https://doi.org/10.3390/su9071130, 2017.
Ding, L., Xinxin Xu, X., Jing Shuai, J., and Chuanmin Shuai, C.: How Solar and Wind Powers can Complement Each Other in Spatial-Temporal Dimensions? – An Empirical Study in China's Hubei Province, International Energy Journal, 17, 125–140, 2017.
DWD/HErZ (Deutscher Wetterdienst – Climate Data Center/Hans-Ertel Center for Weather Research): COSMO-REA6 regional reanalysis, available at: https://opendata.dwd.de/climate_environment/REA, last access: 27 June 2019.
European Union, 2018: Directive (EU) 2018/2001 of the European Parliament and of the Council of 11 December 2018 on the promotion of the use of energy from renewable sources, Official Journal of the European Union, L 328, available at: http://data.europa.eu/eli/dir/2018/2001/oj (last access: 25 June 2019), 2018.
Fraunhofer IEE: Windmonitor, statistics on hub height in 2017, available at: http://windmonitor.iee.fraunhofer.de/windmonitor_de/3_Onshore/2_technik/4_anlagengroesse/, last access: 21 December 2018.
Gerhardt, N., Böttger, D., Trost, T., Scholz, A., Pape, C., Gerlach, A.-K., Härtel, P., and Ganal, I.: Analyse eines europäischen −95 %-Klimazielszenarios über mehrere Wetterjahre, Fraunhofer IWES, Kassel, http://publica.fraunhofer.de/dokumente/N-439079.html (last access: 25 June 2019), 2017.
Germer, S. and Kleidon, A.: Have wind turbines in Germany generated electricity as would be expected from the prevailing wind conditions in 2000–2014?, PLoS ONE, 14, e0211028, https://doi.org/10.1371/journal.pone.0211028, 2019.
Graabak, I. and Korpås, M.: Balancing of variable wind and solar production in Continental Europe with Nordic hydropower – A review of simulation studies, Energy Procedia, 87, 91–99, https://doi.org/10.1016/j.egypro.2015.12.362, 2016a.
Graabak, I. and Korpås, M.: Variability Characteristics of European Wind and Solar Power Resources – A Review, Energies, 9, 449, https://doi.org/10.3390/en9060449, 2016b.
Graabak, I., Jaehnert, S., Korpås, M., and Mo, B.: Norway as a Battery for the Future European Power System – Impacts on the Hydropower System, Energies, 10, 2054, https://doi.org/10.3390/en10122054, 2017.
Grams, C. M., Beerli, R., Pfenninger, S., Staffell, I., and Wernli, H.: Balancing Europe's wind power output through spatial deployment informed by weather regimes, Nat. Clim. Change, 7, 557–562, https://doi.org/10.1038/nclimate3338, 2017.
Graul, C. and Popinga, C.: R-Package bReeze: Functions for Wind Resource Assessment, version 0.4-2, 2018-01-05, 2018.
Heide, D., von Bremen, L., Greiner, M., Hoffmann, C., Speckmann, M., and Bofinger, S.: Seasonal optimal mix of wind and solar power in a future, highly renewable Europe, Renew. Energ., 35, 2483–2489, https://doi.org/10.1016/j.renene.2010.03.012, 2010.
Henckes, P., Knaut, A., Obermüller, F., and Frank, C.: The benefit of long-term high resolution wind data for electricity system analysis, Energy, 143, 934–942, https://doi.org/10.1016/j.energy.2017.10.049, 2018.
Hoicka, C. E. and Rowlands, I. H.: Solar and wind resource complementarity: Advancing options for renewable electricity integration in Ontario, Canada, Renew. Energ., 36, 97–107, https://doi.org/10.1016/j.renene.2010.06.004, 2011.
Huld, T. and Gracia Amillo, A. M.: Estimating PV Module Performance over Large Geographical Regions: The Role of Irradiance, Air Temperature, Wind Speed and Solar Spectrum, Energies, 8, 5159–5181, https://doi.org/10.3390/en8065159, 2015.
IEC Central Office: Photovoltaic Devices – Part 3: Measurement Principles for Terrestrial Photovoltaic (PV) Solar Devices with Reference Spectral Irradiance Data, Technical Report IEC 61215-3, International Electrotechnical Commission, Geneva, Switzerland, 2005.
Kaiser-Weiss, A. K., Kaspar, F., Heene, V., Borsche, M., Tan, D. G. H., Poli, P., Obregon, A., and Gregow, H.: Comparison of regional and global reanalysis near-surface winds with station observations over Germany, Adv. Sci. Res., 12, 187–198, https://doi.org/10.5194/asr-12-187-2015, 2015.
Kaiser-Weiss, A. K., Borsche, M., Niermann, D., Kaspar, F. Lussana, C., Isotta, F., van den Besselaar, E., van der Schrier, G., and Undén, P.: Added value of regional reanalyses for climatological applications, Environmental Research Communications, accepted, 2019.
Müller, R., Pfeifroth, U., Träger-Chatterjee, C., Trentmann, J., and Cremer, R.: Digging the METEOSAT Treasure – 3 Decades of Solar Surface Radiation, Remote Sens., 7, 8067–8101, https://doi.org/10.3390/rs70608067, 2015.
Niermann, D., Borsche, M., Kaiser-Weiss, A., van den Besselaar, E., van der Schrier, G., Cornes, R., de Vreede, E., Lussana, C., Tveito, O. E., Cantarello, L., Frei, C., Isotta, F., Davie, J., Bazil, E., and Bojariu, R.: UERRA Deliverable 3.6.: Scientific report on assessment of regional analysis against independent datasets, available at: http://www.uerra.eu/project-overview/all-deliverables.html (last access: 25 June 2019), 2018.
Niermann, D., Borsche, M., Kaiser-Weiss, A. K., and Kaspar, F.: Evaluating renewable energy relevant parameters of COSMO-REA6 by comparing against station observations, satellites and other reanalyses, Meteorologische Zeitschrift, in press, 2019.
Open Power System Data: Data Package Time series, Version 2018-03-13, available at: https://data.open-power-system-data.org/time_series/2018-03-13/ (last access: 25 June 2019), 2018.
Pfeifroth, U., Kothe, S., Müller, R., Trentmann, J., Hollmann, R., Fuchs, P., and Werscheck, M.: Surface Radiation Data Set – Heliosat (SARAH) – Edition 2, Satellite Application Facility on Climate Monitoring, https://doi.org/10.5676/EUM_SAF_CM/SARAH/V002, 2017.
Pfeifroth, U., Sanchez-Lorenzo, A., Manara, V., Trentmann, J., and Hollmann, R.: Trends and variability of surface solar radiation in Europe based on surface- and satellite-based data records, J. Geophys. Res.-Atmos., 123, 1735–1754, https://doi.org/10.1002/2017JD027418, 2018.
Pfeifroth, U., Kothe, S., Trentmann, J., Hollmann, R., Fuchs, P., Kaiser, J., and Werscheck, M.: Surface Radiation Data Set – Heliosat (SARAH) – Edition 2.1, Satellite Application Facility on Climate Monitoring, https://doi.org/10.5676/EUM_SAF_CM/SARAH/V002_01, 2019.
Pfenninger, S.: Dealing with multiple decades of hourly wind and PV time series in energy models: A comparison of methods to reduce time resolution and the planning implications of inter-annual variability, Appl. Energ., 197, 1–13, https://doi.org/10.1016/j.apenergy.2017.03.051, 2017.
Pfenninger, S. and Staffell, I.: Long-term patterns of European PV output using 30 years of validated hourly reanalysis and satellite data, Energy, 114, 1251–1265, https://doi.org/10.1016/j.energy.2016.08.060, 2016.
Pozo-Vazquez, D., Santos-Alamillos, F. J., Lara-Fanego, V., Ruiz-Arias, J. A., and Tovar-Pescador, J.: The Impact of the NAO on the Solar and Wind Energy Resources in the Mediterranean Area, in: Hydrological, Socioeconomic and Ecological Impacts of the North Atlantic Oscillation in the Mediterranean Region, Advances in Global Change Research, edited by: Vicente-Serrano, S. and Trigo, R., vol. 46, Springer, Dordrecht, https://doi.org/10.1007/978-94-007-1372-7_15, 2011.
Quaschning, V.: Sektorkopplung durch die Energiewende: Anforderungen an den Ausbau erneuerbarer Energien zum Erreichen der Pariser Klimaschutzziele unter Berücksichtigung der Sektorkopplung, Hochschule für Technik und Wirtschaft, HTW, Berlin, 38 pp., 2016.
Ramirez Camargo, L., Gruber, K., and Nitsch, F.: Assessing variables of regional reanalysis data sets relevant for modelling small-scale renewable energy systems, Renew. Energ., 133, 1468–1478, https://doi.org/10.1016/j.renene.2018.09.015, 2019.
Ryberg, D. S., Caglayan, D. G., Schmitt, S., Linßen, J., Stolten, D., and Robinius, M.: The Future of European Onshore Wind Energy Potential: Detailed Distribution and Simulation of Advanced Turbine Designs, Energy, https://doi.org/10.1016/j.energy.2019.06.052, in press, 2019.
Saint-Drenan, Y. M., Good, G. H., and Braun, M.: A probabilistic approach to the estimation of regional photovoltaic power production, Sol. Energy, 147, 257–276, https://doi.org/10.1016/j.solener.2017.03.007, 2017.
Schraff, C. and Hess, R.: A description of the non-hydrostatic regional model LM–Part III: Data assimilation, technical report, Deutscher Wetterdienst, Offenbach, Germany, 48 pp., 2003.
Simmer, C., Adrian, G., Jones, S., Wirth, V., Göber, M., Hohenegger, C., Janjic, T., Keller, J., Ohlwein, C. , Seifert, A., Trömel, S., Ulbrich, T., Wapler, K., Weissmann, M., Keller, J., Masbou, M., Meilinger, S., Riß, N., Schomburg, A., Vormann, A., and Weingärtner, C.: HErZ: The German Hans-Ertel Centre for Weather Research, B. Am. Meteorol. Soc., 97, 1057–1068, https://doi.org/10.1175/BAMS-D-13-00227.1, 2016.
Sterl, S., Liersch, S., Koch, H., van Lipzig, N. P. M., and Thiery, W.: A new approach for assessing synergies of solar and wind power: implications for West Africa, Environ. Res. Lett., 13, 094009, https://doi.org/10.1088/1748-9326/aad8f6, 2018.
Tafarte, P., Eichhorn, M., and Thrän, D.: Capacity Expansion Pathways for a Wind and Solar Based Power Supply and the Impact of Advanced Technology – A Case Study for Germany, Energies, 12, 324, https://doi.org/10.3390/en12020324, 2019.
Urraca, R., Gracia-Amillo, A. M., Koubli, E., Huld, T., Trentmann, J., Riihelä, A., Lindfors, A. V., Palmer, D., Gottschalg, R., and Antonanzas-Torres, F.: Extensive validation of CM SAF surface radiation products over Europe, Remote Sens. Environ., 199, 171–186, https://doi.org/10.1016/j.rse.2017.07.013, 2017.
Zerrahn, A., Schill, W.-P., and Kemfert, C.: On the economics of variable renewable energy sources, electrical storage, and curtailment, Eur. Econ. Rev., 108, 259–279, https://doi.org/10.1016/j.euroecorev.2018.07.004, 2018.
Based on data on installed capacity for 2017 from https://www.energy-charts.de (last access: 10 February 2019): wind: 55.72 GW (50.29 GW onshore + 5.43 GW offshore), photovoltaics: 42.34 GW.
Estimated based on data on energy production and installed capacity in 2017 for solar PV, onshore wind and offshore wind from https://www.energy-charts.de/ (last access: 26 May 2019).