 | 08 Aug 2019
Climate monitoring and heat and cold waves detection over France using a new spatialization of daily temperature extremes from 1947 to present
François Besson
Brigitte Dubuisson
Pierre Etchevers
Anne-Laure Gibelin
Pierre Lassegues
Michel Schneider
Béatrice Vincendon
For many years real-time climate monitoring for temperature over France has been performed using a national index built by averaging the daily mean temperatures of constant subset of 30 stations with long-term series. In order to derive climate indices at finer scales, a spatialization of extreme daily temperatures (called ANASTASIA) had been produced on a 1 km regular grid using a regression-kriging method. The production covers 1947 to present period. Cross-validation shows low biases after the 1960s. The temporal homogeneity of the product is satisfying at the national scale from the 1970s. However, a high impact of the network density has been found and the use of a too coarse observation network deteriorates the analysis creating temporal heterogeneities. Finally, the ANASTASIA analysis has been used for real-time monitoring over France and detection of heat and cold wave episodes. The new products based on ANASTASIA are consistent with the current operational ones at national scale while bringing added values at local scales.
- Article
(2646 KB) - Full-text XML
- BibTeX
- EndNote


Real-time monitoring of climate variables is crucial at global, national but also local scales. The characterisation of climate events at several scales is not easy and it requires the use of diagnostics or indices able to synthesise useful information. In France, at the national scale, air temperature monitoring (https://donneespubliques.meteofrance.fr/donnees_libres/bulletins/BCM/201903.pdf, last access: 6 August 2019, p. 3) is currently performed thanks to an index (called “national thermic index”) described in Sect. 3.2. At the local scale, monitoring is done using time series at observation stations.
In the meantime more and more temperature gridded products are available at kilometric resolution: from regional reanalysis (Soci et al., 2013) or from observation gridded dataset (Haylock et al., 2008; Lussana et al., 2016; Frei, 2014; Hiebl and Frei, 2016). Those gridded products are useful for real time climate monitoring (https://climate.copernicus.eu/climate-bulletins, last access: 6 August 2019), and new indices can be based on the aggregation of that kind of gridded analyses.
This article describes a new spatial analysis of daily minimum and maximum temperatures developed at Météo-France (called ANASTASIA for “ANAlyse Spatiale des TempérAture de Surface avec Initialisation Aurelhy”) available at a 1 km resolution over France from 1947 to present days. This analysis is done using a regression-kriging method described in Sect. 2. Evaluation and assessment of the temporal homogeneity of this product is shown is Sect. 3. Two applications (real-time climate monitoring and heat/cold wave detection) using this new dataset are presented in Sect. 4.
The developed methodology needed to be applicable from 1947 to present days in order to cover an extreme heat wave event which occurred during summer 1947 over France (Blanchet, 2014; Sanson, 1948a, b). It benefits from two sources of information available over this period :
-
In situ observations of daily minimum and maximum temperatures with available observations amount varying from around 250 in 1947 to around 2500 from the 2000s.
-
Monthly climatological fields of daily minimum and maximum temperatures produced on a 1 km regular grid using the Aurelhy method (Benichou and Le Breton, 1987) applied over the 1981–2010 period (Canellas et al., 2014). This is an interpolation that takes the statistical relationship between orography and temperature at climatological time scale into account.
The ANASTASIA analysis is performed every day using a regression-kriging method (Hengl et al., 2007):
-
A linear regression between the daily observations and the monthly climatological field at the observation locations is done, the linear model formula obtained is applied on each grid cell producing a first spatialized field.
-
Regression residuals at the observation stations are interpolated through a kriging method using an exponential variogram model. It has been chosen to vary the variogram range along the considered time period to deal with heterogeneities in the observation network density. This allows to obtain large enough samples in each distance class. The followings ranges are used: 300 km between 1947 and 1976, 250 km between 1976 and 1985, 200 km between 1986 and 1993, 100 km from 1994. Note that a single variogram is used across the country. Indeed producing several fields (one per region) would impose joining them to maintain spatial consistency, which is not an easy task. Using a single variogram also allows to reduce the computational cost that is important for real-time production. Once the variogram is determined, ordinary kriging is done using 30 stations in the neighbourhood, a number chosen to have enough observations data over the range of the variogram.
-
The final spatialized field is the addition of the two previous spatialized fields.
3.1 Scores
The daily dataset has been produced from 1947 to present days. A leave-one-out cross-validation method is used in order to evaluate the quality of the spatial analysis with a subset of validation stations varying from ∼70 to ∼150 along the period. Two statistical criteria are used to quantify the performance: the bias and the Root Mean Square Error (RMSE). Results on Fig. 1 show the impact of the observation network density over the quality of the analysis:
-
RMSE decrease from ∼2 ∘C at the beginning of the covered period for both variables to reach ∘C for maximum/minimum temperature in the last 20 years.
-
Before 1960 bias is around 0.6 ∘C for maximum temperature and −0.3 ∘C for minimum temperature. But during the 1960's it is reduced with better values for minima ( ∘C) than for maxima ( ∘C).
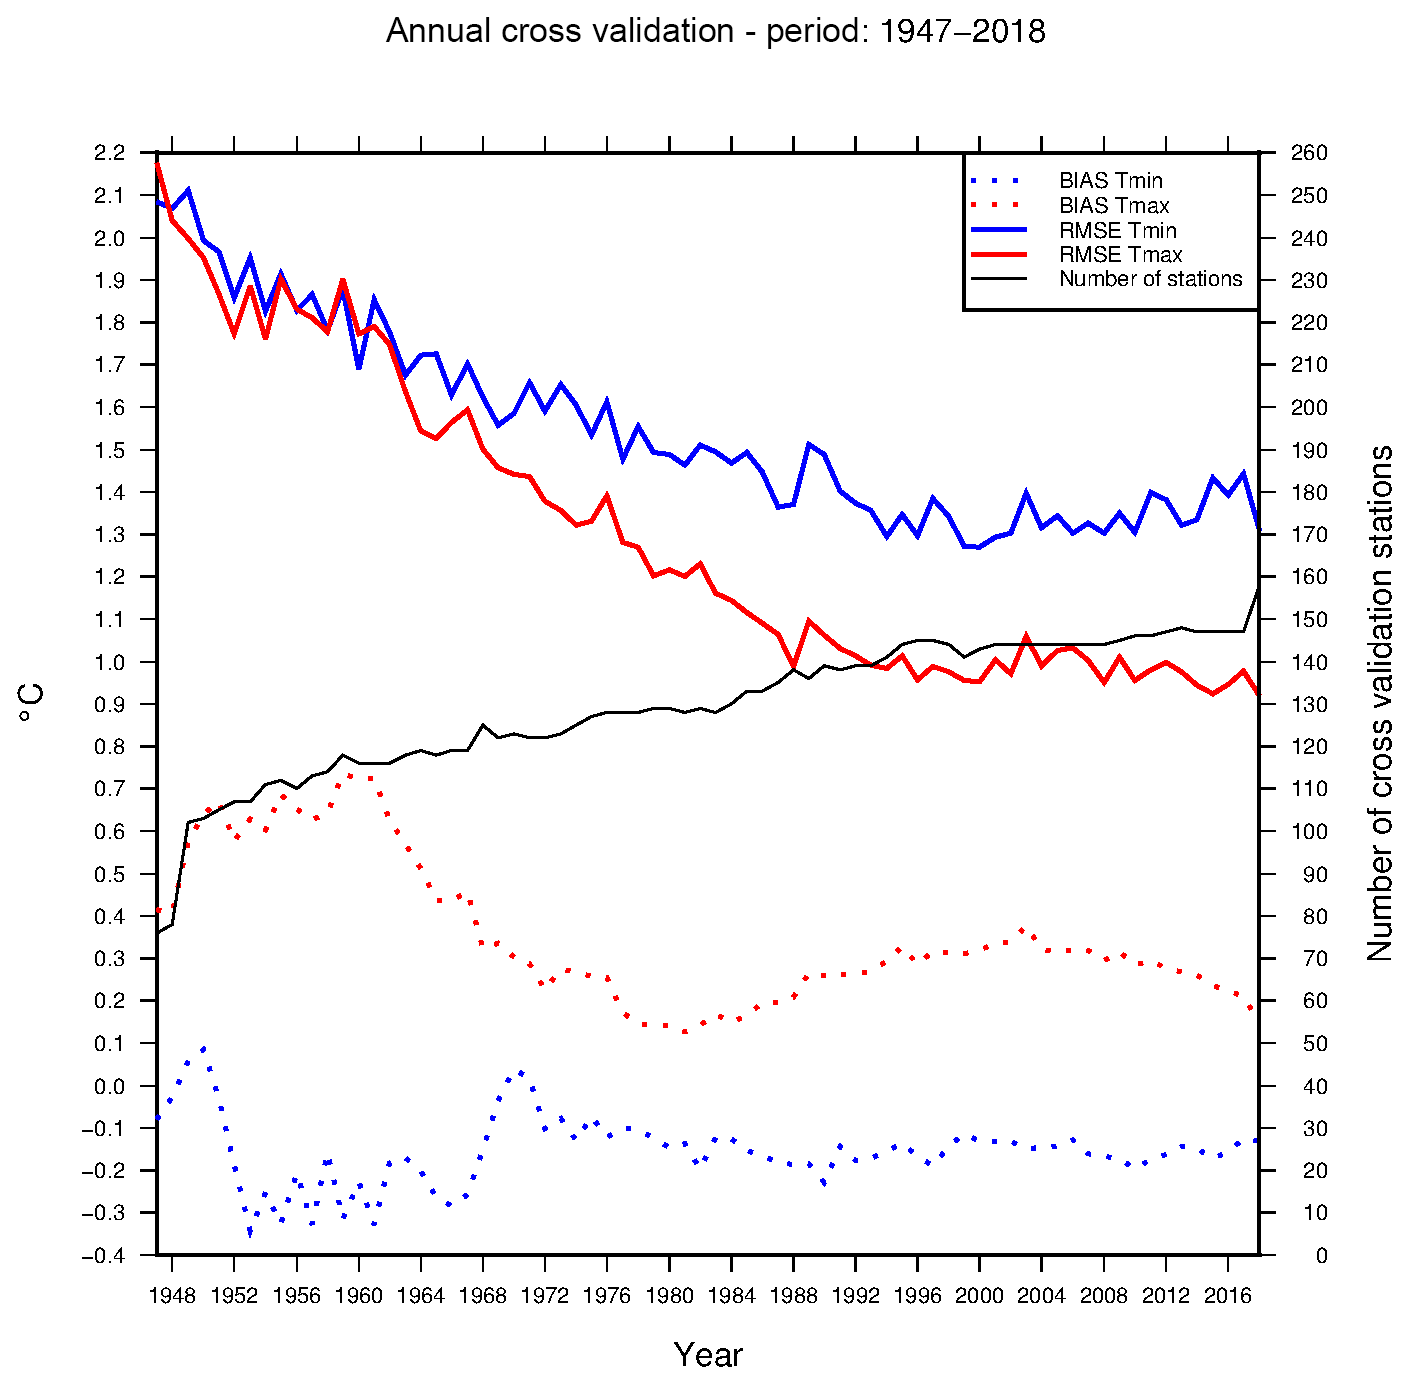
Figure 1Evolution of bias (dashed curve) and RMSE (plain line) from 1947 to 2018 for minimum (in blue) and maximum (in red) temperatures. The number of stations used for cross validation is represented with the black plain line.
3.2 Temporal homogeneity
A way to evaluate the temporal homogeneity is to compare our production at a national scale with the current operational national thermic index used as a reference in this study.
This index, available since 1900 at monthly time scale (and since 1947 at daily time scale), is computed by averaging temperatures from a constant subset of 30 stations. They have been selected for having long-term series, being spread all over the country (cf. Fig. 3) and located in flat areas (maximum elevation 865 m). This index is known to be homogeneous at monthly to annual time scale in comparison with homogeneous long-term series (Gibelin et al., 2014).
ANASTASIA gridded analysis for both minimum and maximum temperatures have been aggregated at the national scale (averaging grid cell values over France) to produce a new index. In addition an index for mean temperature has been calculated averaging minimum and maximum temperatures indices. Monthly and annual anomalies of these three indices have been computed (with respect to the 1981–2010 climate normals). Those anomalies compared with anomalies based on the current national thermic index inform about the homogeneity of ANASTASIA based indices.
At the annual time scale, the maximum temperature anomalies differences are closed to zero from the 1970s but much higher before. For minimum (respectively mean) temperature, results are more satisfying than for maximum temperature with absolute differences lower than 0.2∘ (respectively 0.1∘) since the 1950s (cf. Fig. 2). Results are similar at a monthly time scale (not shown). Note that even if low differences are obtained from the 1970s, it still remains some oscillations and trends. So this dataset should not be used to compute trends to quantify the impact of climate change on temperature.

Figure 2Differences between annual anomalies from the national thermic index and annual anomalies from ANASTASIA production over 1947–2018 period for minimum temperature (in blue), maximum temperature (in red) and mean temperature (in black).
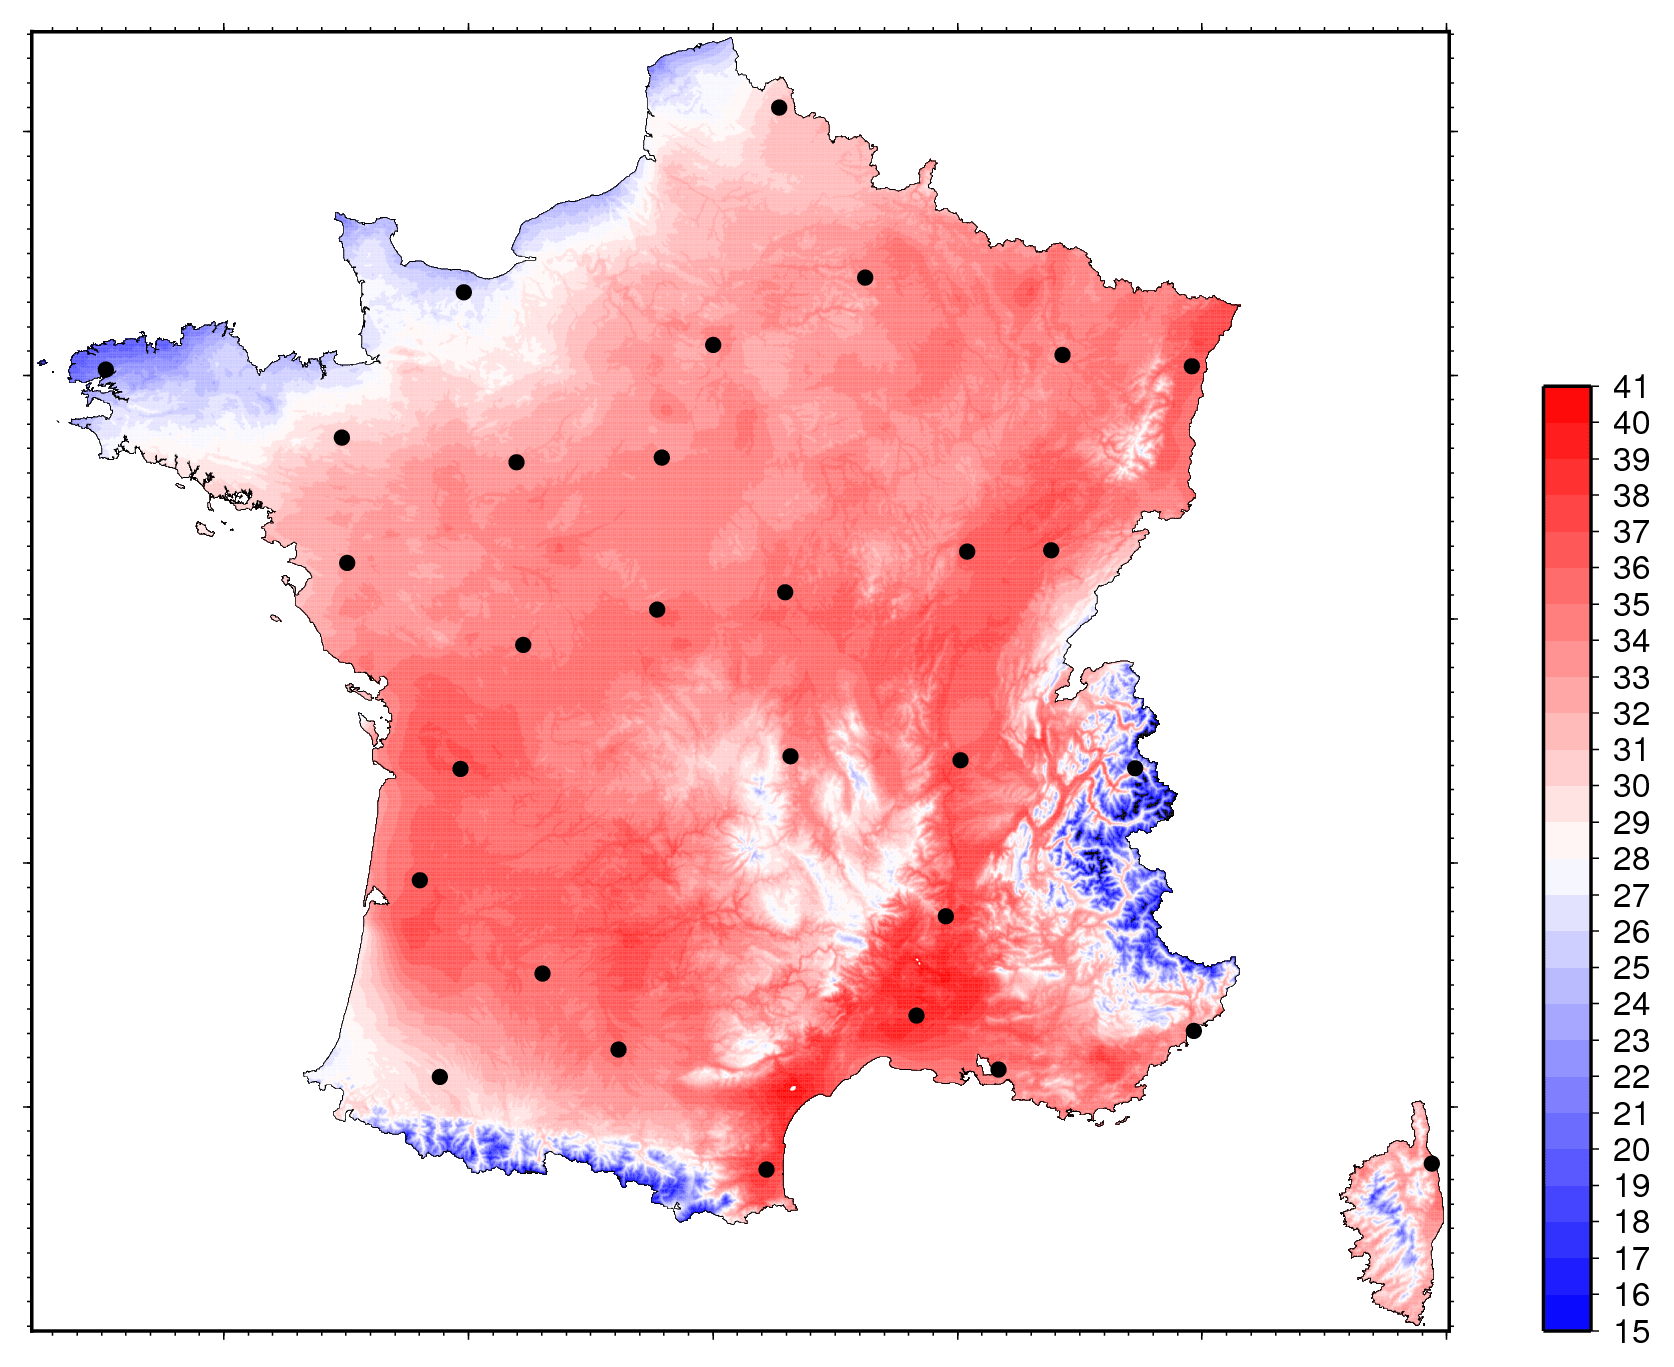
Figure 3Spatialization of maximum temperature 4 August 2018 over France from ANASTASIA analysis over France. Black dots correspond to stations used to compute the national thermic index.
Two main applications using the ANASTASIA analysis have been set up.
4.1 Real-time monitoring
ANASTASIA analysis is operated every day enabling the monitoring of thermic anomalies over France, daily anomalies of minimum and maximum temperatures are obtained using daily pseudo-normals (1981–2010). To compute daily pseudo-normals we use a modified Fournier analysis of the usual monthly normals (1981–2010). This is done in order to have smoother values than the usual computation method which consists in averaging daily values over the normal period and which can lead to somewhat noisy values.
The ANASTASIA based national index can be compared with the reference thermic index (cf. Sect. 3.2). For instance, last 2018 summer the two time series of daily indices proved to be highly correlated, with a correlation exceeding 0.99. The evolutions of the daily anomalies obtained for both productions are also highly correlated (0.99) and the same days are found above or below the pseudo-normals in both productions.
One advantage of the new indices is the higher spatial resolution: while the current thermic index provides only information at a national scale, a local scale monitoring of temperature is now possible. Precise maps (cf. Fig. 3) can be produced (temperatures in the mountainous area are finely depicted, coastal effects are better represented etc.) and climate diagnostics can be derived at local spatial scales. For example, last 2018 summer was recorded as the 2nd hottest summer at the national scale for both minimum (+1.6∘) and maximum (+2.1∘) temperature. Thanks to ANASTASIA analysis, the main affected areas can be located more precisely. The 2018 summer minimum temperature anomaly (cf. Fig. 4) has been the highest since 1947 for 6 counties. The maximum temperature anomaly did not reach the first rank but the second one in many counties in the Northeastern France (cf. Fig. 5).
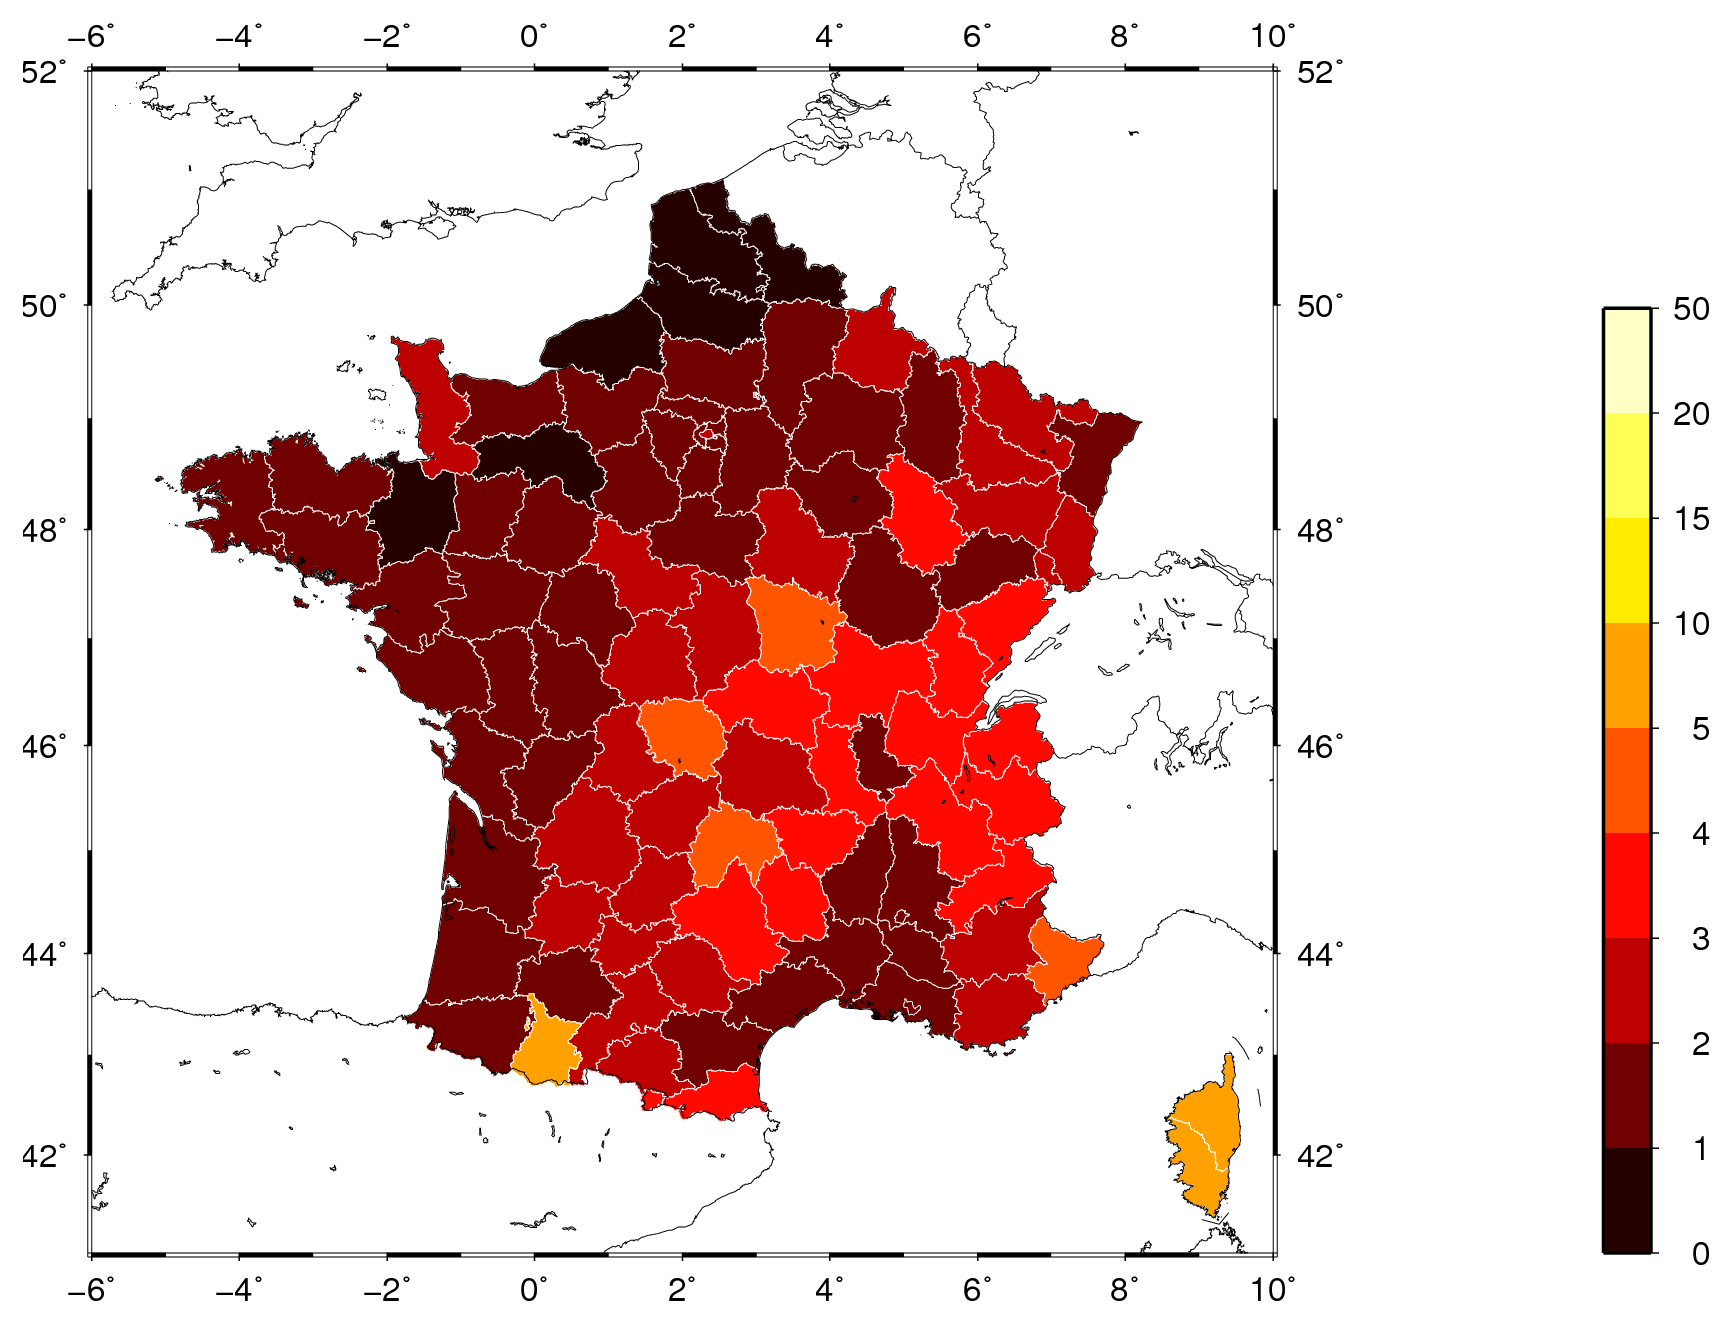
Figure 4Rank of summer 2018 minimum temperature anomaly per county.
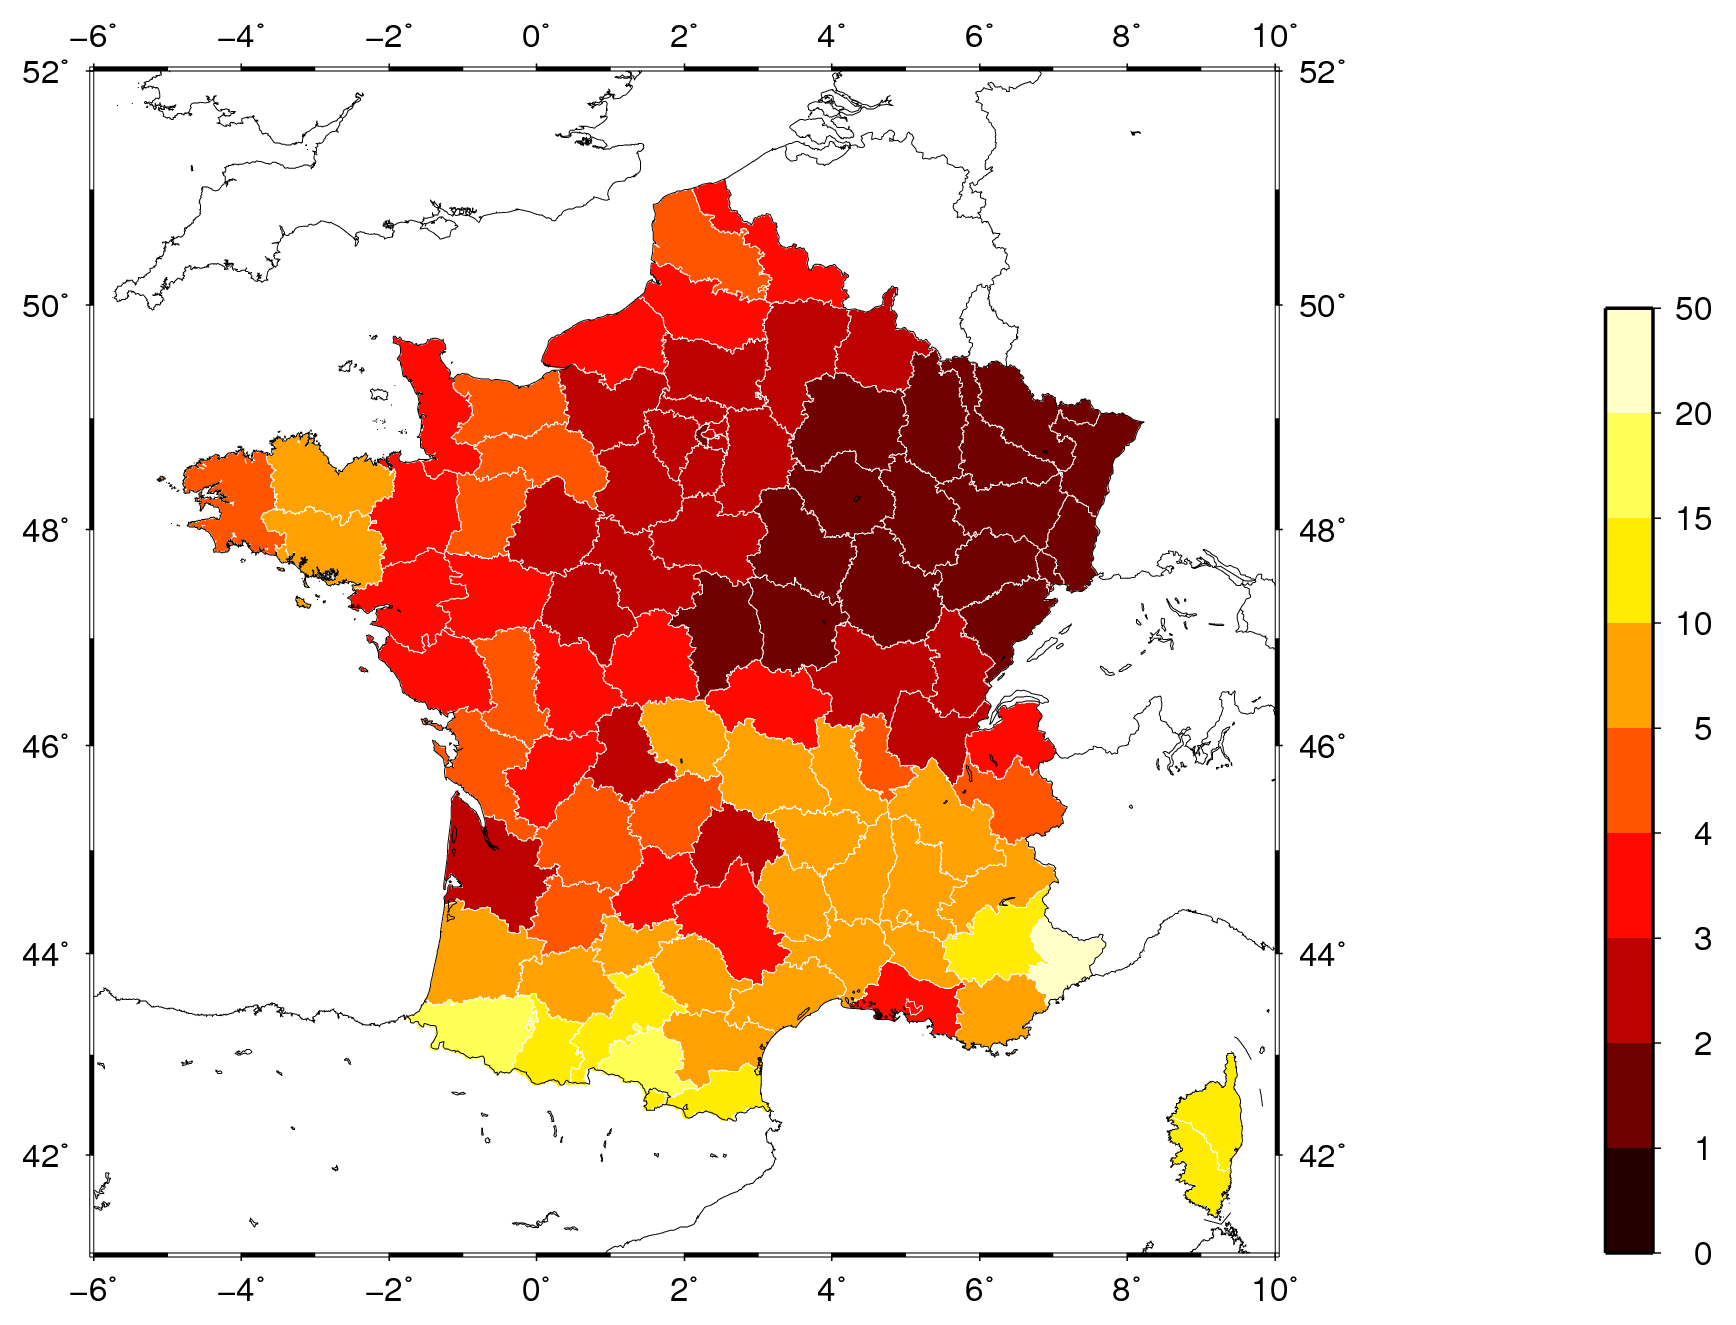
Figure 5Rank of summer 2018 maximum temperature anomaly per county.
4.2 Ability to detect heat and cold waves
4.2.1 Method
The method used to detect heat/cold wave fully described by Ouzeau et al. (2016) is based upon three settings: the temperature threshold beyond which an event is detected (Spic), the threshold that defines the beginning and the end of the heat/cold wave (Sdeb), and the interruption threshold (Sint) which allows merging two consecutive episodes without a significant drop/increase in temperature (cf. Fig. 6). The temperature used is the mean temperature defined as the average of the daily minimum and maximum temperature. Spic, Sdeb and Sint threshold values are defined as three percentiles of the temperature distribution: 99.5, 97.5 and 95 for heat waves; 0.5, 2.5 and 5 for coldwaves. The heat/cold waves detection have been applied from 1947 with thresholds determined with percentiles computed over 1981–2010 period.
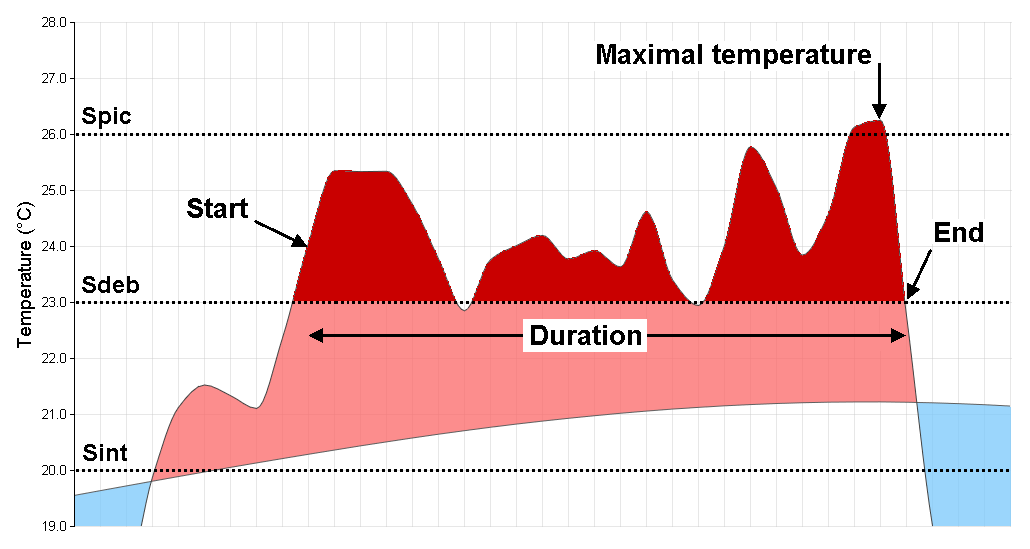
Figure 6Principle of the characterization of a heat wave from a daily mean temperature indicator over France showing: duration (start and end) of the episode, maximal temperature and global intensity (red area). Temperatures above (resp. below) climatological line (1981–2010 reference period) are represented by pink (resp. blue) area.
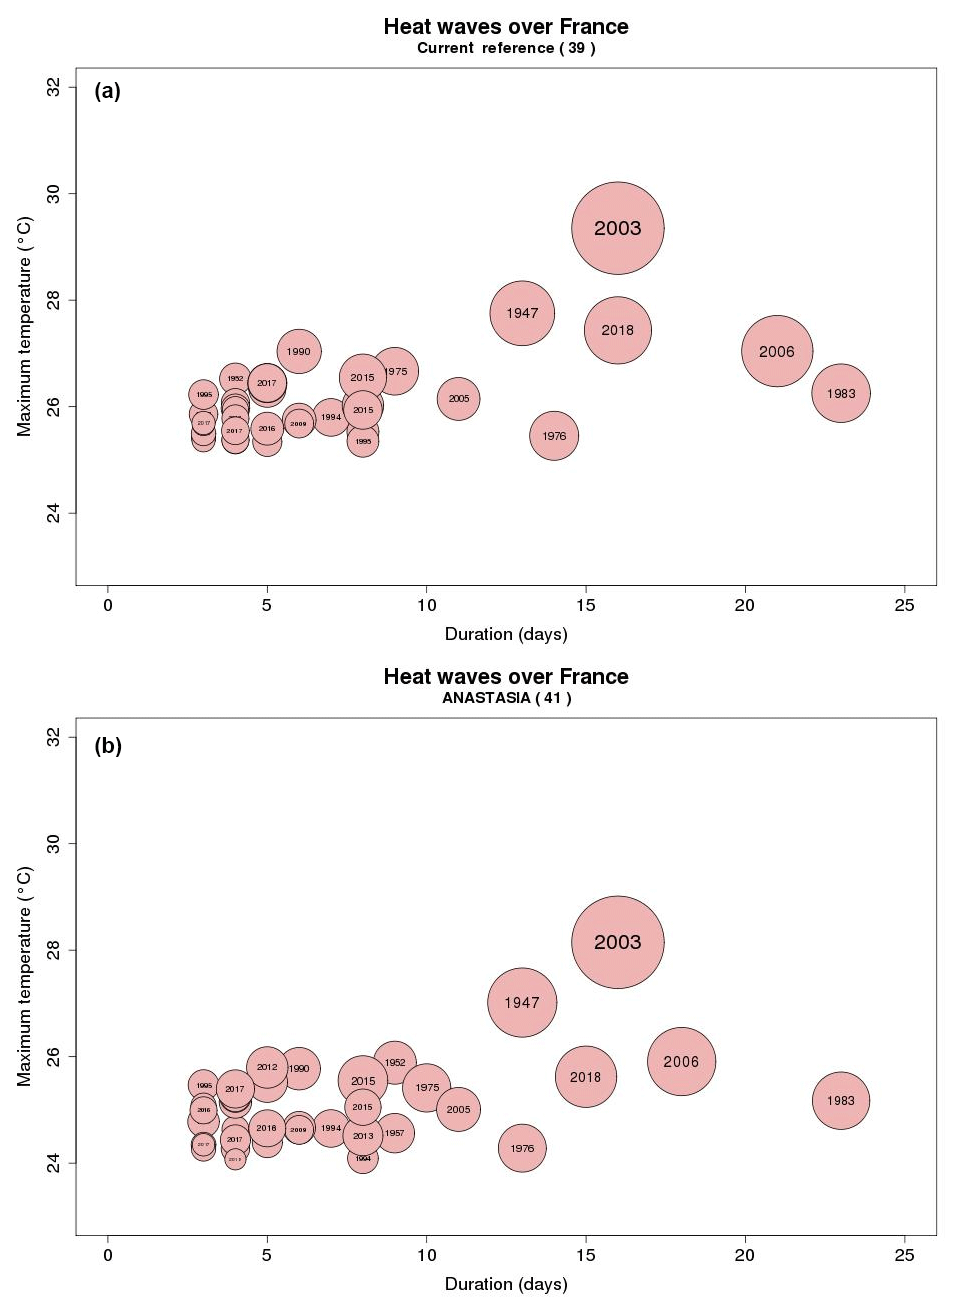
Figure 73-D graphic representations of heat waves (1947–2018 period) over France for the current reference (a) and for ANASTASIA production (b). Each bubble represents a heat wave event: the duration (x-axis), the maximum temperature (y-axis), the global intensity (diameter of each bubble) and the year can be found on the graphic.
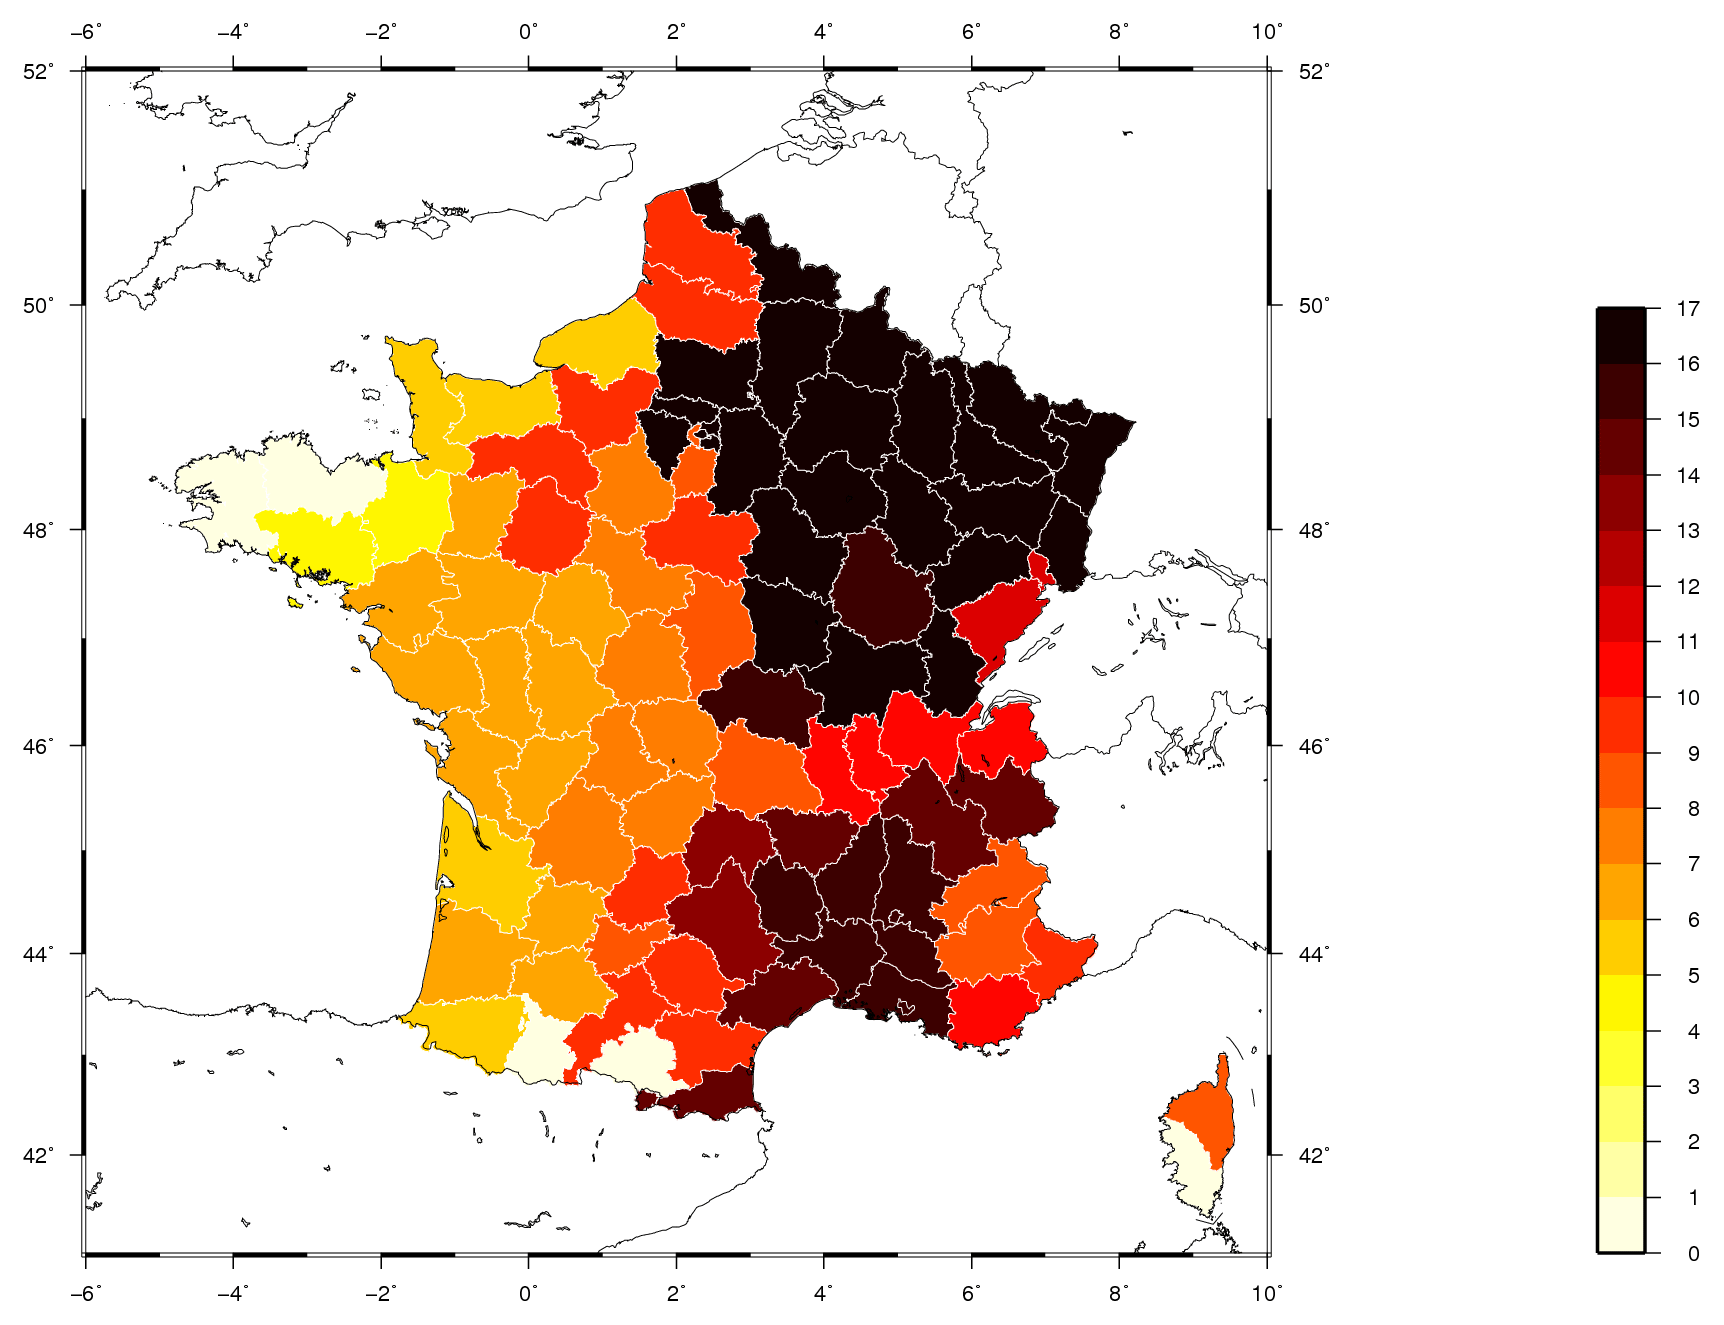
Figure 8Duration (number of days) of the 2018 heat wave county per county.

Figure 9Rank per county in term of global intensity for the 2018 heat wave. White colour corresponds to a county with no wave detected.
4.2.2 Results
At the national scale, waves detected with ANASTASIA analysis are compared with the ones obtained with current reference indices. Waves can be ordinated in terms of duration, maximum temperature and global intensity (cf. Fig. 7). For heat waves, the number of detected waves is quite similar (39 vs. 41) and waves ranking for each criterion is also quite close (same results for cold waves, not shown). The slight differences are due to representativeness differences between time series used to detect waves. Using ANASTASIA data enables to take into account temperature over the whole country (including mountainous and coastal areas) while the current reference only depends on 30 specific stations. In particular, this explains why:
-
For the 2003's heat wave, the difference between the two maximum temperatures reaches 1.2∘ C. Indeed, the warmest day of the episod (5 August) did not affect equally the 30 stations used by the current reference and the whole country.
-
The duration of the 2006's heat wave is 3 d shorter with ANASTASIA than with the current reference. Indeed, the daily mean temperature on 27 July 2006 exceeded the Sdeb threshold by 0.04 ∘C with the current reference while it was below this threshold by only 0.2∘ with ANASTASIA. So the wave's last day was 27 July for ANASTASIA while it continued until 30 July for the current reference.
-
ANASTASIA analysis provides information at local spatial scales and enables to precise the area affected by a heat wave. The last 2018 heat wave lasted longer in eastern France (cf. Fig. 8). North-eastern France and some counties of the Mediterranean region was affected by a wave that reached the second or the third rank in terms of global intensity (cf. Fig. 9). In comparison, the Atlantic coast was much less affected.
The ANASTASIA analysis of daily minimum and maximum temperatures uses a regression-kriging method with in situ observations and monthly climatological fields as input data. The 1 km gridded analysis over France covers more than 70 years starting in 1947 (this dataset is available upon request to the author for research purposes only). Due to the evolution of the observation network density since 1947 the quality of the analysis is not constant with relatively high bias before the 1960s, and RMSE being steadily reduced from 1947 to present years. In addition, heterogeneities are detected at national scale along the period in comparison to the national thermic index known as homogeneous. Nevertheless, comparisons with current operational products used for temperature monitoring over France show good results for present and recent past periods. Moreover ANASTASIA analysis enables to get information at final space scales than before. This was illustrated in this paper for the 2018 summer characterisation.
Further works could concern the improvement of the methodology (e.g. adding new relevant predictors, dealing with non-linear temperature altitudinal profiles in mountainous area etc.). However, the impact of the detected heterogeneities on the indices used for real-time applications will be first investigated. Indeed the evolution of the observation network density during the 20th century may induce gaps in the indices homogeneity even with a more accurate spatialization method. A first step could be to compare the ANASTASIA based indices with those computed from a spatialization using the same number of observing stations over time.
This dataset is available upon request to the author for research purposes only (Météo-France data policy).
PL developped the spatialisation code. FB and PL performed the simulations. FB, BD, MS, PL designed the experiments and carried them out. FB prepared the original draft. FB, BD, BV, PL finalized the manuscript. BV, PE and ALG supervised the study.
The authors declare that they have no conflict of interest.
This article is part of the special issue “18th EMS Annual Meeting: European Conference for Applied Meteorology and Climatology 2018”. It is a result of the EMS Annual Meeting: European Conference for Applied Meteorology and Climatology 2018, Budapest, Hungary, 3–7 September 2018.
The authors would like to thank the reviewers for their comments and suggestions, which improved the quality of this manuscript.
This paper was edited by Mojca Dolinar and reviewed by Melita Perčec Tadić and one anonymous referee.
Benichou, P. and Le Breton, O.: Prise en compte de la topographie pour la cartographie des champs pluviométriques statistiques, La Météorologie, 19, 23–34, 1987.
Blanchet, G.: L'été caniculaire 1947, Météo et Climat Info, 43, 4–5, available at: https://meteoetclimat.fr/wp-content/uploads/2017/03/43-METEOetCLIMAT-INFO_juillet2014.pdf (last access: 6 August 2019), 2014.
Canellas, C., Gibelin, A. L., Lassègues, P., Kerdoncuff, M., Dandin, P., and Simon, P.: Les normales climatiques spatialisées Aurelhy 1981–2010: températures et précipitations, La Météorologie, 85, 47–55, 2014.
Frei, C.: Interpolation of temperature in a mountainous region using non linear profiles and non Euclidean distances, Int. J. Climatol., 34, 1585–1605, https://doi.org/10.1002/joc.3786, 2014.
Gibelin, A. L., Dubuisson, B., Corre, L., Deaux, N., Jourdain, S., Laval, L., Piquemal, J. M., Mestre, O., Dennetière, D., Desmidt, S., and Tamburini, A.: Évolution de la température en France depuis les années 1950, La Météorologie, 87, 45–53, 2014.
Haylock, M. R., Hofstra, N., Klein Tank, A. M. G., Klok, E. J., Jones, P. D. and New, M.: A European daily high-resolution gridded dataset of surface temperature and precipitation, J. Geophys. Res.-Atmos., 113, D20119, https://doi.org/10.1029/2008JD010201, 2008.
Hengl, T., Heuvelink, G. B. M., and Rossiter, D. G.: About regression-kriging: From equations to case studies, Comput. Geosci., 33, 1301–1315, https://doi.org/10.1016/j.cageo.2007.05.001, 2007.
Hiebl, J. and Frei, C.: Daily temperature grids for Austria since 1961 – concept, creation and applicability, Theor. Appl. Climatol., 124, 161–178, https://doi.org/10.1007/s00704-015-1411-4, 2016.
Lussana, C., Tveito, O. E., and Uboldi, F.: senorge v2.0: an observational gridded dataset of temperature for norway, Met. No report 14, Norwegian Meteorological Institute, Oslo, Norway, 2016.
Ouzeau, G., Soubeyroux, J.-M., Schneider, M., Vautard, R., and Planton, S.: Heat waves analysis over France in present and future climate: application of a new method on the EURO-CORDEX ensemble, Clim. Serv., 4, 1–12, https://doi.org/10.1016/j.cliser.2016.09.002, 2016.
Sanson, J.: Les principales anomalies météorologiques de l'année 1947 en France, Annales de Géographie, 57, 178–181, 1948.
Sanson, J.: La sécheresse et la chaleur du printemps et de l'été 1947 et leurs conséquences agricoles, La Météorologie, 1948/01, 40–56, 1948.
Soci, C., Bazile, E., Besson, F., Landelius, T., Mahfouf, J.-F., Martin, E., and Durand, Y.: D2.6 Report describing the new system in D2.5 EURO4M report, 26 pp., available at: http://www.euro4m.eu/downloads/D2.6_Report_describing_the_new_system_in_D2.5.pdf (last access: 6 August 2019), 2013.