 | 05 Sep 2019
Impact of additional AMDAR data in the AROME-France model during May 2017
Alexis Doerenbecher
Jean-François Mahfouf
From 1 May 2017 until 15 June 2017, the E-AMDAR operational service from EUMETNET disseminated more commercial aircraft data than usual on the Global Telecommunication System (GTS). Météo-France specifically requested the implementation of such a trial. It lead to an increase in the number of aircraft data over France, especially vertical profiles (ascents and descents). Though Météo-France routinely buys additional data with respect to the basic E-AMDAR service, this trial aimed at assessing the potential of French airlines to produce further data in collaboration with E-AMDAR and yield an observation network as dense as possible. This was the opportunity to check the impact of these additional data on forecast skill scores of the limited area and convective scale model AROME-France. A data denial experiment (OSE) was carried out on May 2017, by removing E-AMDAR profiles (about 14 % of data) to mimic the routine observing system. The reference was the operational AROME-France 3D-Var that assimilated all extra data in real-time. However, no dedicated flag allowed to distinguish supplementary data from routine ones. Therefore, a necessary step of the experimental methodology was to identify which data profile could be considered as supplementary. The examination of forecast skill scores from the denial experiment showed that the impact of the removal of the additional observations is rather small and mixed, depending upon the parameter of interest, the atmospheric level, and the forecast range. The case studies done did not exhibit any particular additional skill for the suite with augmented observations.
The experimental set-up is described and the results are discussed on the basis of forecast scores, including precipitation scores. Finally, a number of recommendations are given for a more optimal assimilation of AMDAR data in the AROME-France model.
- Article
(2953 KB) - Full-text XML
- BibTeX
- EndNote


In Europe, the Economical Interest Group (EIG) EUMETNET (http://eumetnet.eu/, last access: 8 July 2019) collects and disseminates in-flight aircraft measurements, also known as AMDAR observations, through the E-AMDAR service. EUMETNET is supported by its European member states. E-AMDAR produces anonymous observations from commercial aircraft. In 2017, it included 14 airlines, among which KLM, Air France, British Airways, SAS, Lufthansa and EasyJet.
Figure 1 shows a simplified E-AMDAR flight with the 3 typical flight phases (ascent, en-route and descent) and the corresponding data collection frequencies. Pace and constraints on data transmission are also shown on the picture. The red and green chains of dots in Fig. 1 are the (slanted) profiles discussed in this paper. In E-AMDAR, profile data from ascent and descent phases are preferred to data collected at cruise level (en-route, in blue), because of the better vertical sampling of troposphere. Ascents are also preferred to descent because of the steeper slope and the larger depth of sampling.
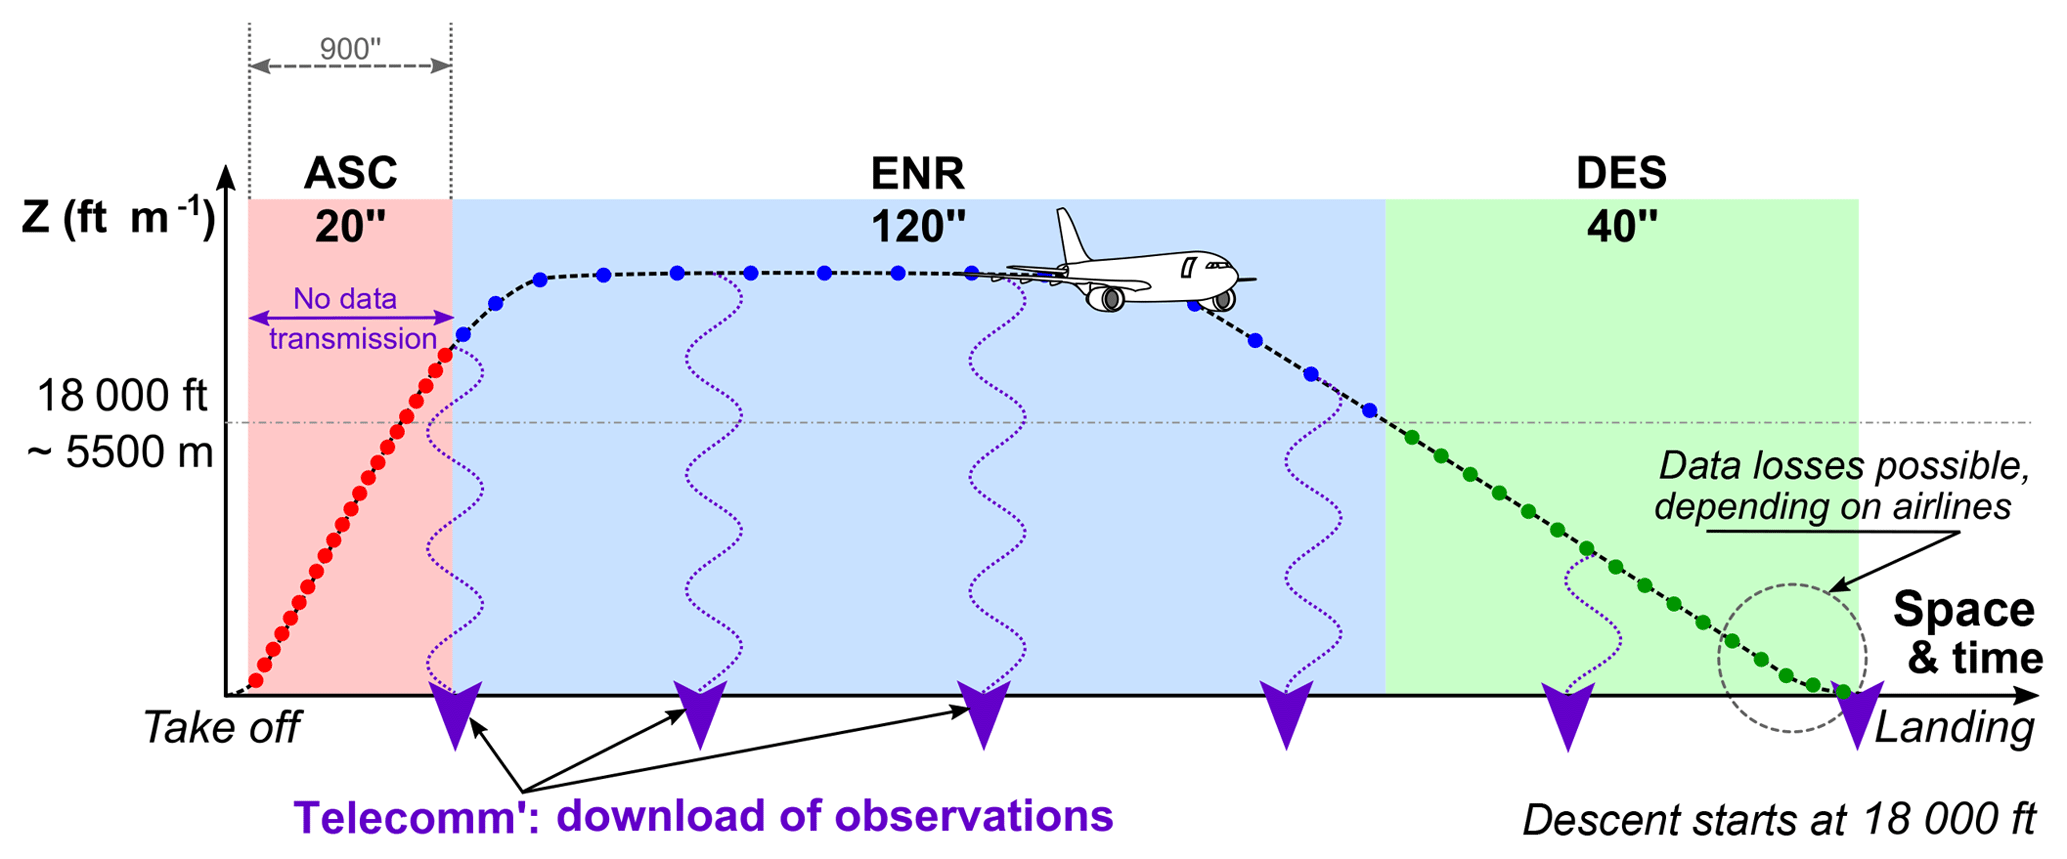
Figure 1Schematic diagram with the three flight phases: ASC (ascent, in red), ENR (en-route, in blue) and DES (descent, in green). The sampling period is shown below the name of the phase. The DES phase starts when the plane flies below the 18 000 ft limit. Thus, these data sample a thinner atmospheric layer than ASC. The first communication to download observations to the ground is done after the ascent phase. For most companies, the last DES data packet is transmitted during taxi on runways after landing. But for some companies, the last data packet at the end of the descent is not transmitted if the aircraft lands before this last data packet is transmitted to the ground. In such a case, a substantial loss of data is possible.
Presently the aircraft data are sent to the ground using expensive radio downlinks. To save money, E-AMDAR does not buy all aircraft data but instead selects flights. This allows to optimize the spatial coverage. Such an optimal geographical distribution is very different from the actual distribution of air traffic. But this optimization generates costs due to installation of dedicated software on aircraft and flight selection management.
The basic offer of E-AMDAR to EUMETNET members consists of 3-hourly profiles with roughly 250 km spacing which has been tailored for global and regional models, some years ago. When necessary, additional profiles are paid by the National Meteorological and Hydrological Services (NMHS) requiring more data for their own needs such as kilometre-scale NWP. Presently, MÉTÉO-FRANCE buys additional (60 min frequency) data on large airports in the South of France. There are also additional requirements (120 min frequency) for airports in Corsica and Balearic islands.
Most NMHS have easy access to all E-AMDAR data through the Global Telecommunication System. But it is not straightforward for a given country to measure whether it receives enough E-AMDAR data with respect to its own needs. The question whether the current provision is sufficient for the needs of AROME-France system has not been answered yet. Moreover, is it better to pay for optimization or for the totality of observations?
To investigate these questions, MÉTÉO-FRANCE planned with E-AMDAR a test period in May 2017 during which geographical and temporal optimization would be reduced, letting more observations being distributed and enter data assimilation. The evaluation of the benefits related to this increase of observations implied to carry out an observation denial experiment.
AMDAR data are essential for numerical weather prediction (NWP) at global (Kelly and Thépaut, 2007; Petersen, 2016) and kilometre scale (Benjamin et al., 2010; Brousseau et al., 2014; James and Benjamin, 2017). These data are known to be of (very) good quality, as soon as quality indices are accounted for in data assimilation and to yield significant impact on forecast skill.
Both ARPÈGE (Courtier et al., 1991) global model and AROME (Seity et al., 2011; Brousseau et al., 2016) kilometre scale model at MÉTÉO-FRANCE make a wide use of AMDAR observations in their data assimilation systems. AMDAR observations are controlled through blacklisting based on monitoring statistics, only assumed good observations (small bias and small deviation) enter minimizations. Three-dimensional thinning is applied to individual aircraft, identifier (tail-number) per identifier, thus collocated data with differing aircraft identifier will not compete through thinning. Moreover, because of the high speed of planes, only a small fraction of aircraft data are removed due to thinning. The addition of supplementary profiles with new identifiers does trigger higher rejection through thinning. Observation errors are prescribed about 1 K for temperature and for wind stretch from 2 to 2.8 m s−1 from 850 to 200 hPa. In ARPÈGE, they represent 6.7 % of the data (72 % of non-satellite data) and control 16.5 % of the signal (64.5 % for non-satellite) according to DFS (Degree of Freedom for Signal) diagnostics (Rodgers, 2000; Desroziers et al., 2009). In AROME, on dry days (few weather radar data), they represent 17.8 % and 20.3 % respectively, but only 5.9 % and 5.6 % on rainy days.
It is interesting to note that except when many radar data are in concurrence with AMDAR data, the latter have a larger ratio in DFS than in number. This implies that these data have an higher impact than the average observation. But still, AROME 3D-Var data assimilation system lacks large amounts of data to constraint its initial state. Is the AMDAR density sufficient for kilometre-scales models over France? Is it possible to increase the AMDAR coverage and exhibit strong impact despite the constraints on this network (no data at night, no profiles above ocean, etc.)?
Despite the importance of aircraft data has not to be proven again, one can wonder whether a small change in their distribution would yield significant impact in NWP. Moreover, with the new coming Mode-S aircraft data (de Haan, 2016), it is of importance to reassess the impact of current AMDAR data.
Observation impacts are not linear, so deleting a fraction of data may not reduce skill as much as the addition of the same quantity of observations can improve forecasts. E-AMDAR allowing some flexibility and possibilities to increase the number of data, MÉTÉO-FRANCE asked E-AMDAR to organize a kind of “no flight selection” test-period in May 2017. All profiles departing from or arriving to a French airport, whatever the company (in E-AMDAR) should be collected and transmitted. E-AMDAR service accepted the challenge and collected more aircraft data from 1 May until 15 June 2017, leading to a minimum 30 minutes interval during two subsequent profiles. This is not the actual maximum collection, but it represents at least a doubling of profiles on busiest French airport platforms. The objectives were twofold:
- i.
to increase the number of E-AMDAR profiles on French airports from which routine AMDAR data are already collected and
- ii.
to provide data (E-AMDAR profiles) from smaller French airports that are not selected usually.
Indeed, major airports are not evenly distributed on the French territory, leaving wide areas without data.
Figure 2 shows the density of E-AMDAR data in the minimization of AROME 3D-Var operational suite during May 2017. One can see that the highest profile density in the AROME domains is over Paris with up to 1200 reports per day in a 1∘ × 1∘ box. Paris is surrounded by a region with low density of profiles where a few small airports allow to collect a few profiles. The efficiency of high-speed train network in France also explains lower density areas.
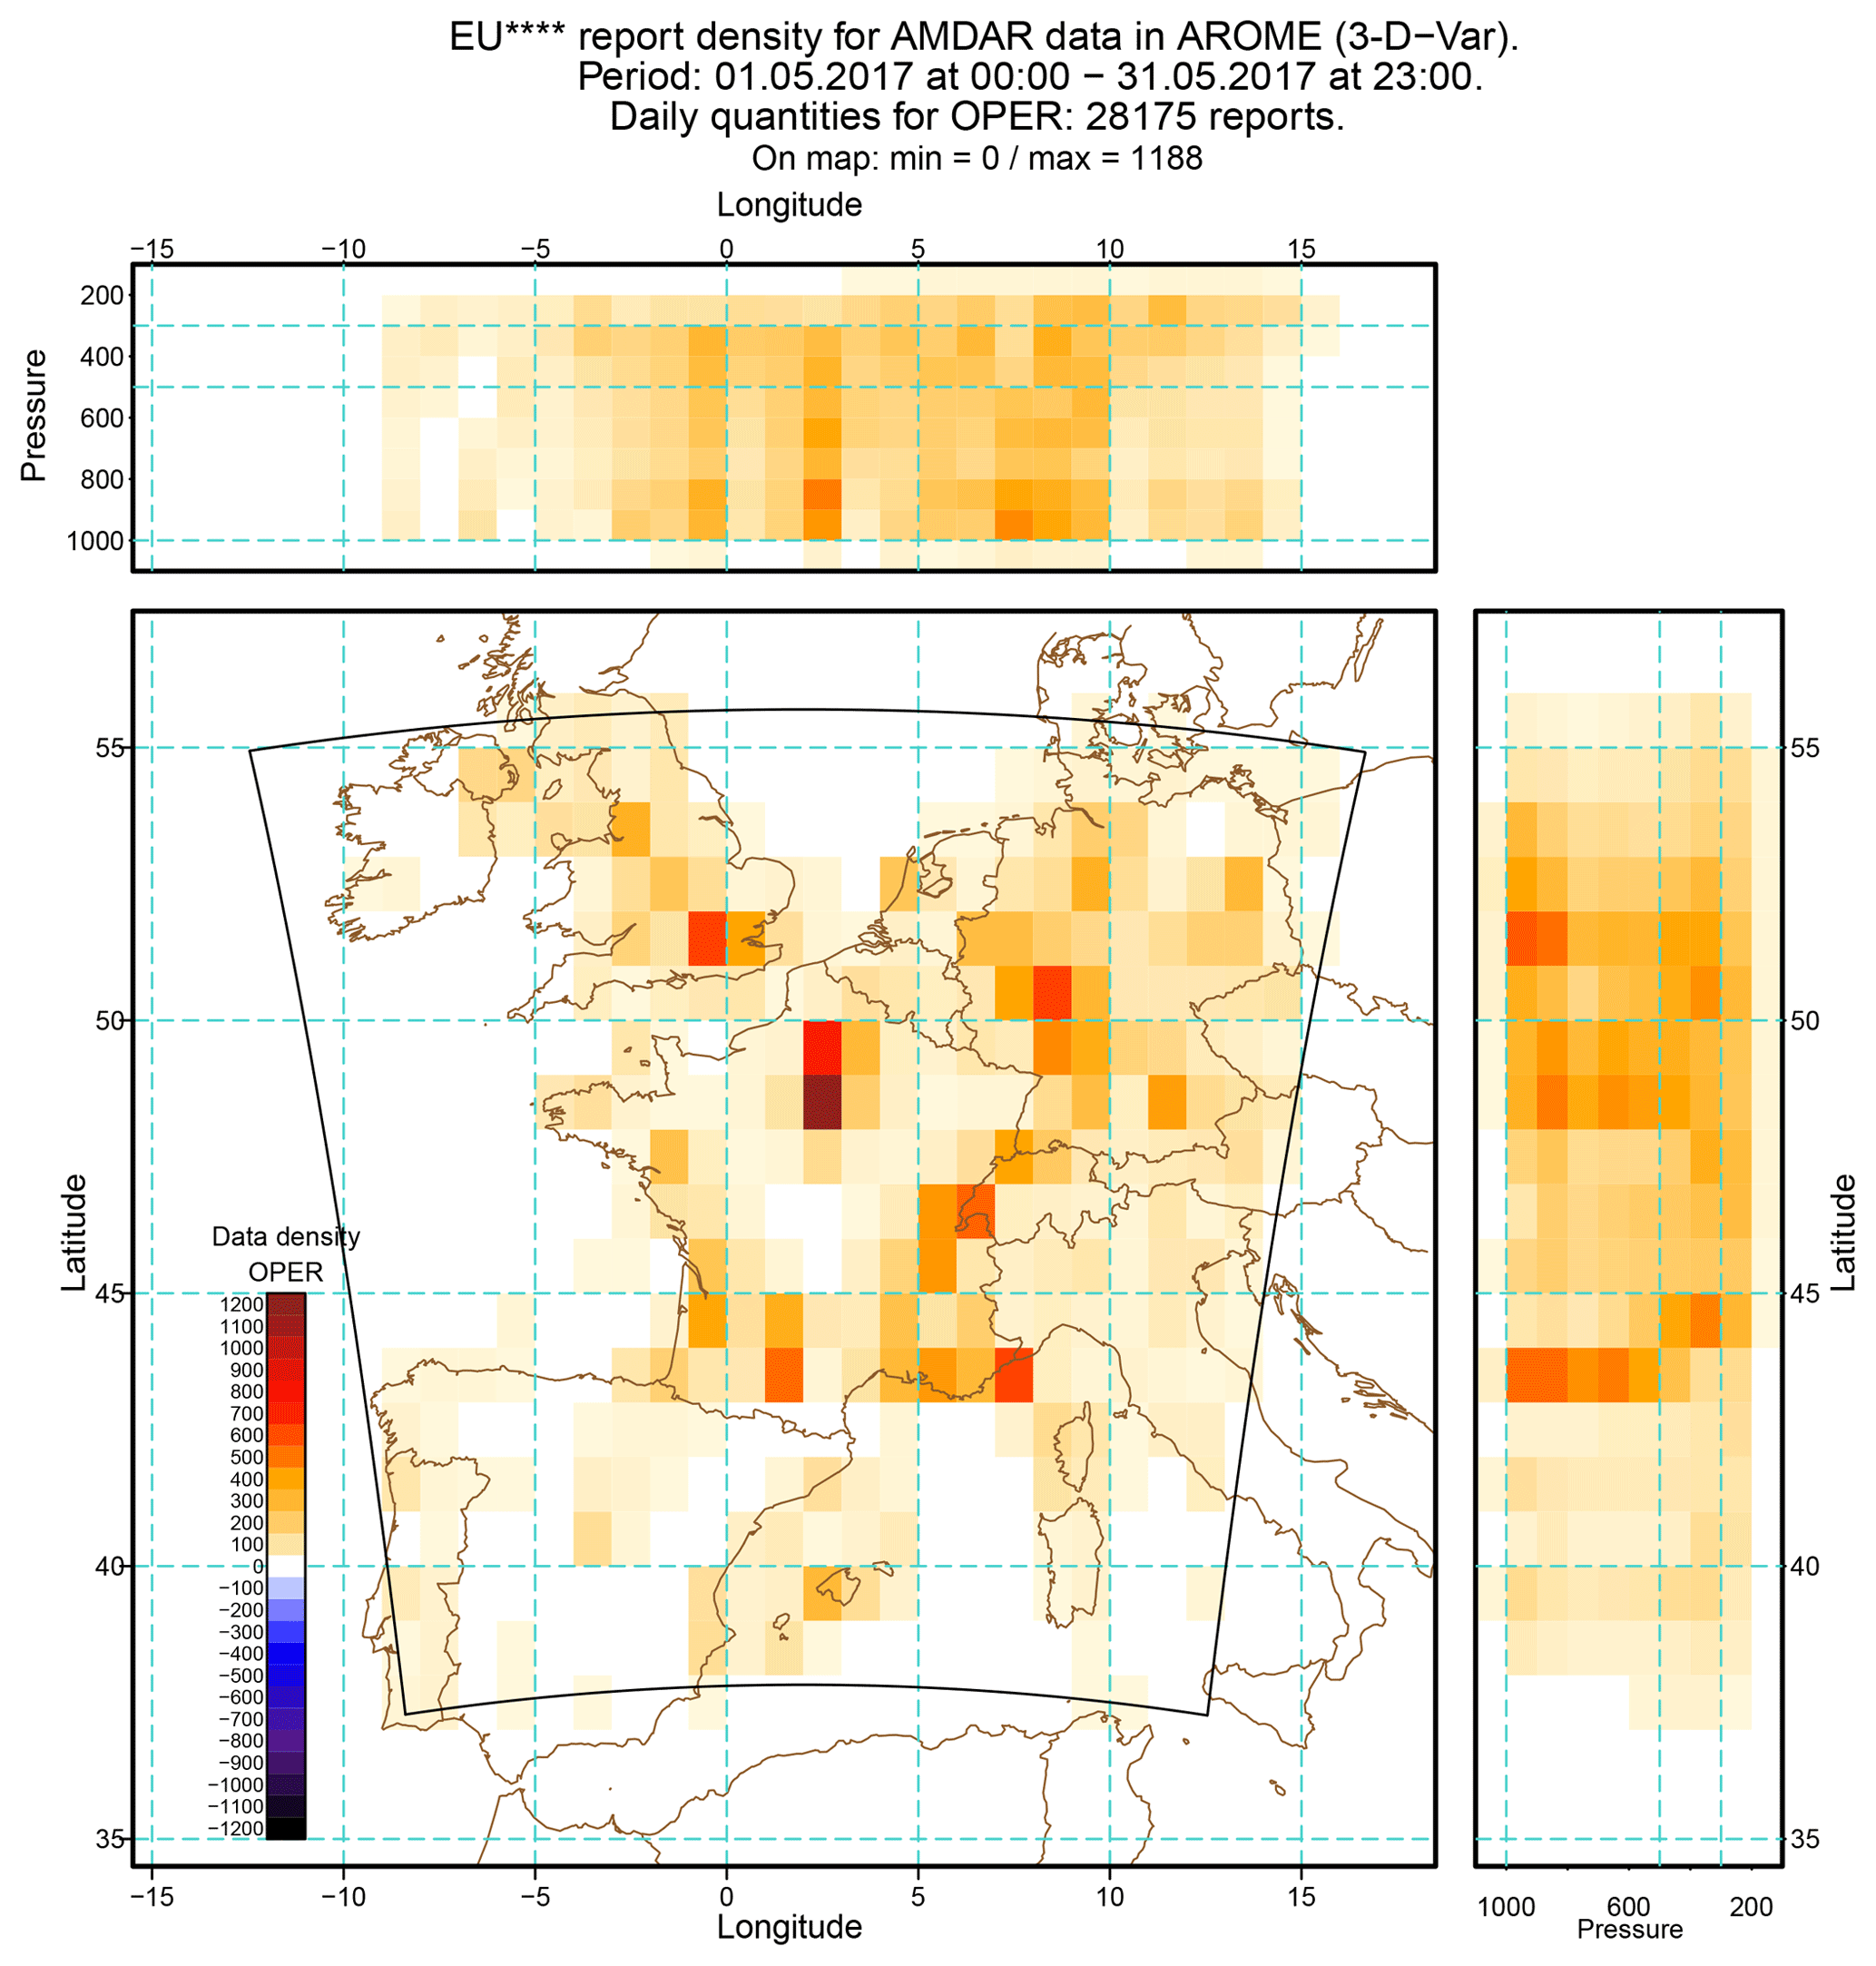
Figure 2Map and vertical cross-sections of E-AMDAR data density for the operational suite in May 2017. The density is computed using 1∘ × 1∘ geographical bin. For vertical cross-sections, bins are 1∘ × 100 hPa. Top panel shows a longitude-pressure cross-section, right panel is a pressure-latitude view. The black line frame highlights the geographical extent of the AROME-France model.
From Fig. 2 it is obvious that the E-AMDAR network has a strong space and time variability related to large cities and airport geographical distribution, business habits as well as routes usually flown by airlines in partnership with E-AMDAR. Some areas are densely observed when some are sparse. The coverage of the French territory is contrasted, Paris above all, then Alps and the South-East and also the South-West of France show an acceptable coverage, quite as similar as the average coverage above Germany. But it is also noticeable that there are 3 white 1∘ × 1∘ boxes in the centre of France, 3 empty boxes over the Pyrenees when North-East is not very well sampled, showing a clear difference with nearby Germany.
This May 2017 observation trial was the opportunity to measure the impact of these supplementary observations on data assimilation and forecast quality. The typical approach to assess this impact on NWP is to carry out an OSE (Observation System Experiment) also called observation denial experiment.
It was expected that the observation change would be of limited spatial extension so it would fit in the domain of AROME-France. The operational AROME-France NWP suite assimilated all available observations, including the supplementary AMDAR data. The observation denial experiment is designed with an experimental AROME-France NWP suite that assimilates all observations except the E-AMDAR data flagged as May-2017-extra data. The coupling model, i.e. ARPÈGE, is exactly the same in both the experiment and the reference.
The observation denial strategy is mainly limited to the flagging of the May-2017-extra observations. We stress the transient/punctual character of this extra data-set (in green in Fig. 3) as it comes in addition to the routinely additional E-AMDAR data MÉTÉO-FRANCE pays for (in red in Fig. 3), in order to get hourly profiles on a selection of French (but not only) airports. This flagging activity is not straightforward. Nothing in the data distinguishes a routine from a May-2017-extra observation. E-AMDAR just relaxed the time constraint on the optimization of flights in relation with the French territory. There is no dedicated and identified data flux coming on top of routine data flow.

Figure 3Diagram of the proportion of May-2017-extra observations with respect to the other categories of E-AMDAR data. The exact proportion of the additional data bought by NMHSs (France, UK, Germany) in the AROME-France system is not known exactly.
In this study the authors wanted to design an observation denial strategy as realistic as possible. It was out of question to consider a basic space-time thinning as it would have not correctly reflected the addition of full profiles. Consequently, the granularity of the data selection/flagging process is not the single-level, multi-parameter observation report, which is the usual granularity in data assimilation systems, but the vertical profile as a whole.
Only the profiles in relation with French airports had to be impacted by the flagging procedure. Due to anonymous E-AMDAR identifiers, no link with the airline companies and with the flight number could be deduced from the observation reports. Origin/destination airports were determined thanks to the first/last position of each profile. A minimal distance (height and altitude) was requested. Thus each (single-level) AMDAR data entering the data assimilation process was associated to a profile (ascent or descent) and each profile (ascent or descent) was associated with an airport.
This was done for May 2017, and for a reference period: May 2016 in that case. The difference between the reference period and the trial period (May 2017) helped in finding the May-2017-extra profiles. But to be valid this comparison with the reference period had to be done airport by airport, hour by hour, day by day and week per week in order to preserve the time variability of the AMDAR data-set.
In the denial experiment (called “59B5” in some figures) all May-2017-extra profiles are removed. On top of the high-resolution (1.3 km) hourly 3D-Var of AROME-France (Brousseau et al., 2016), 42 h range forecasts have been computed four times a day at 00:00, 06:00, 12:00 and 18:00 UTC. On the input observation file, removing the May-2017-extra profiles yielded a 14 % decrease of the E-AMDAR data. In the minimisation of data assimilation system, it was 16 %, see Fig. 3. Figure 4 shows the difference between the operational AROME-France suite (OPER) and the test denial experiment (59B5) in terms of data density. The difference can be detected only where aircraft profiles are available, so no signal can be found in the centre of France, in its very far South (except Corsica) and in the North-East. As stressed earlier no signal can be found outside France. The E-AMDAR data above neighbouring countries have not been modified. The signal that can be seen above the Piedmont and Gulf of Genoa in the South-East is mostly related to the descents toward Nice airport. It is easy to spot the busiest airports: Paris first, then Geneva (which was also included in the E-AMDAR trial as a French airport), followed by Nice, Toulouse, Bordeaux, and then Basel (which is another multi-national Swiss-French-German airport). These differences are those identified in the data assimilation system of AROME-France. It does not reflect the totality of the additional observations as some of them may have been discarded because of screening quality checks such as geographical thinning or first guess departure.
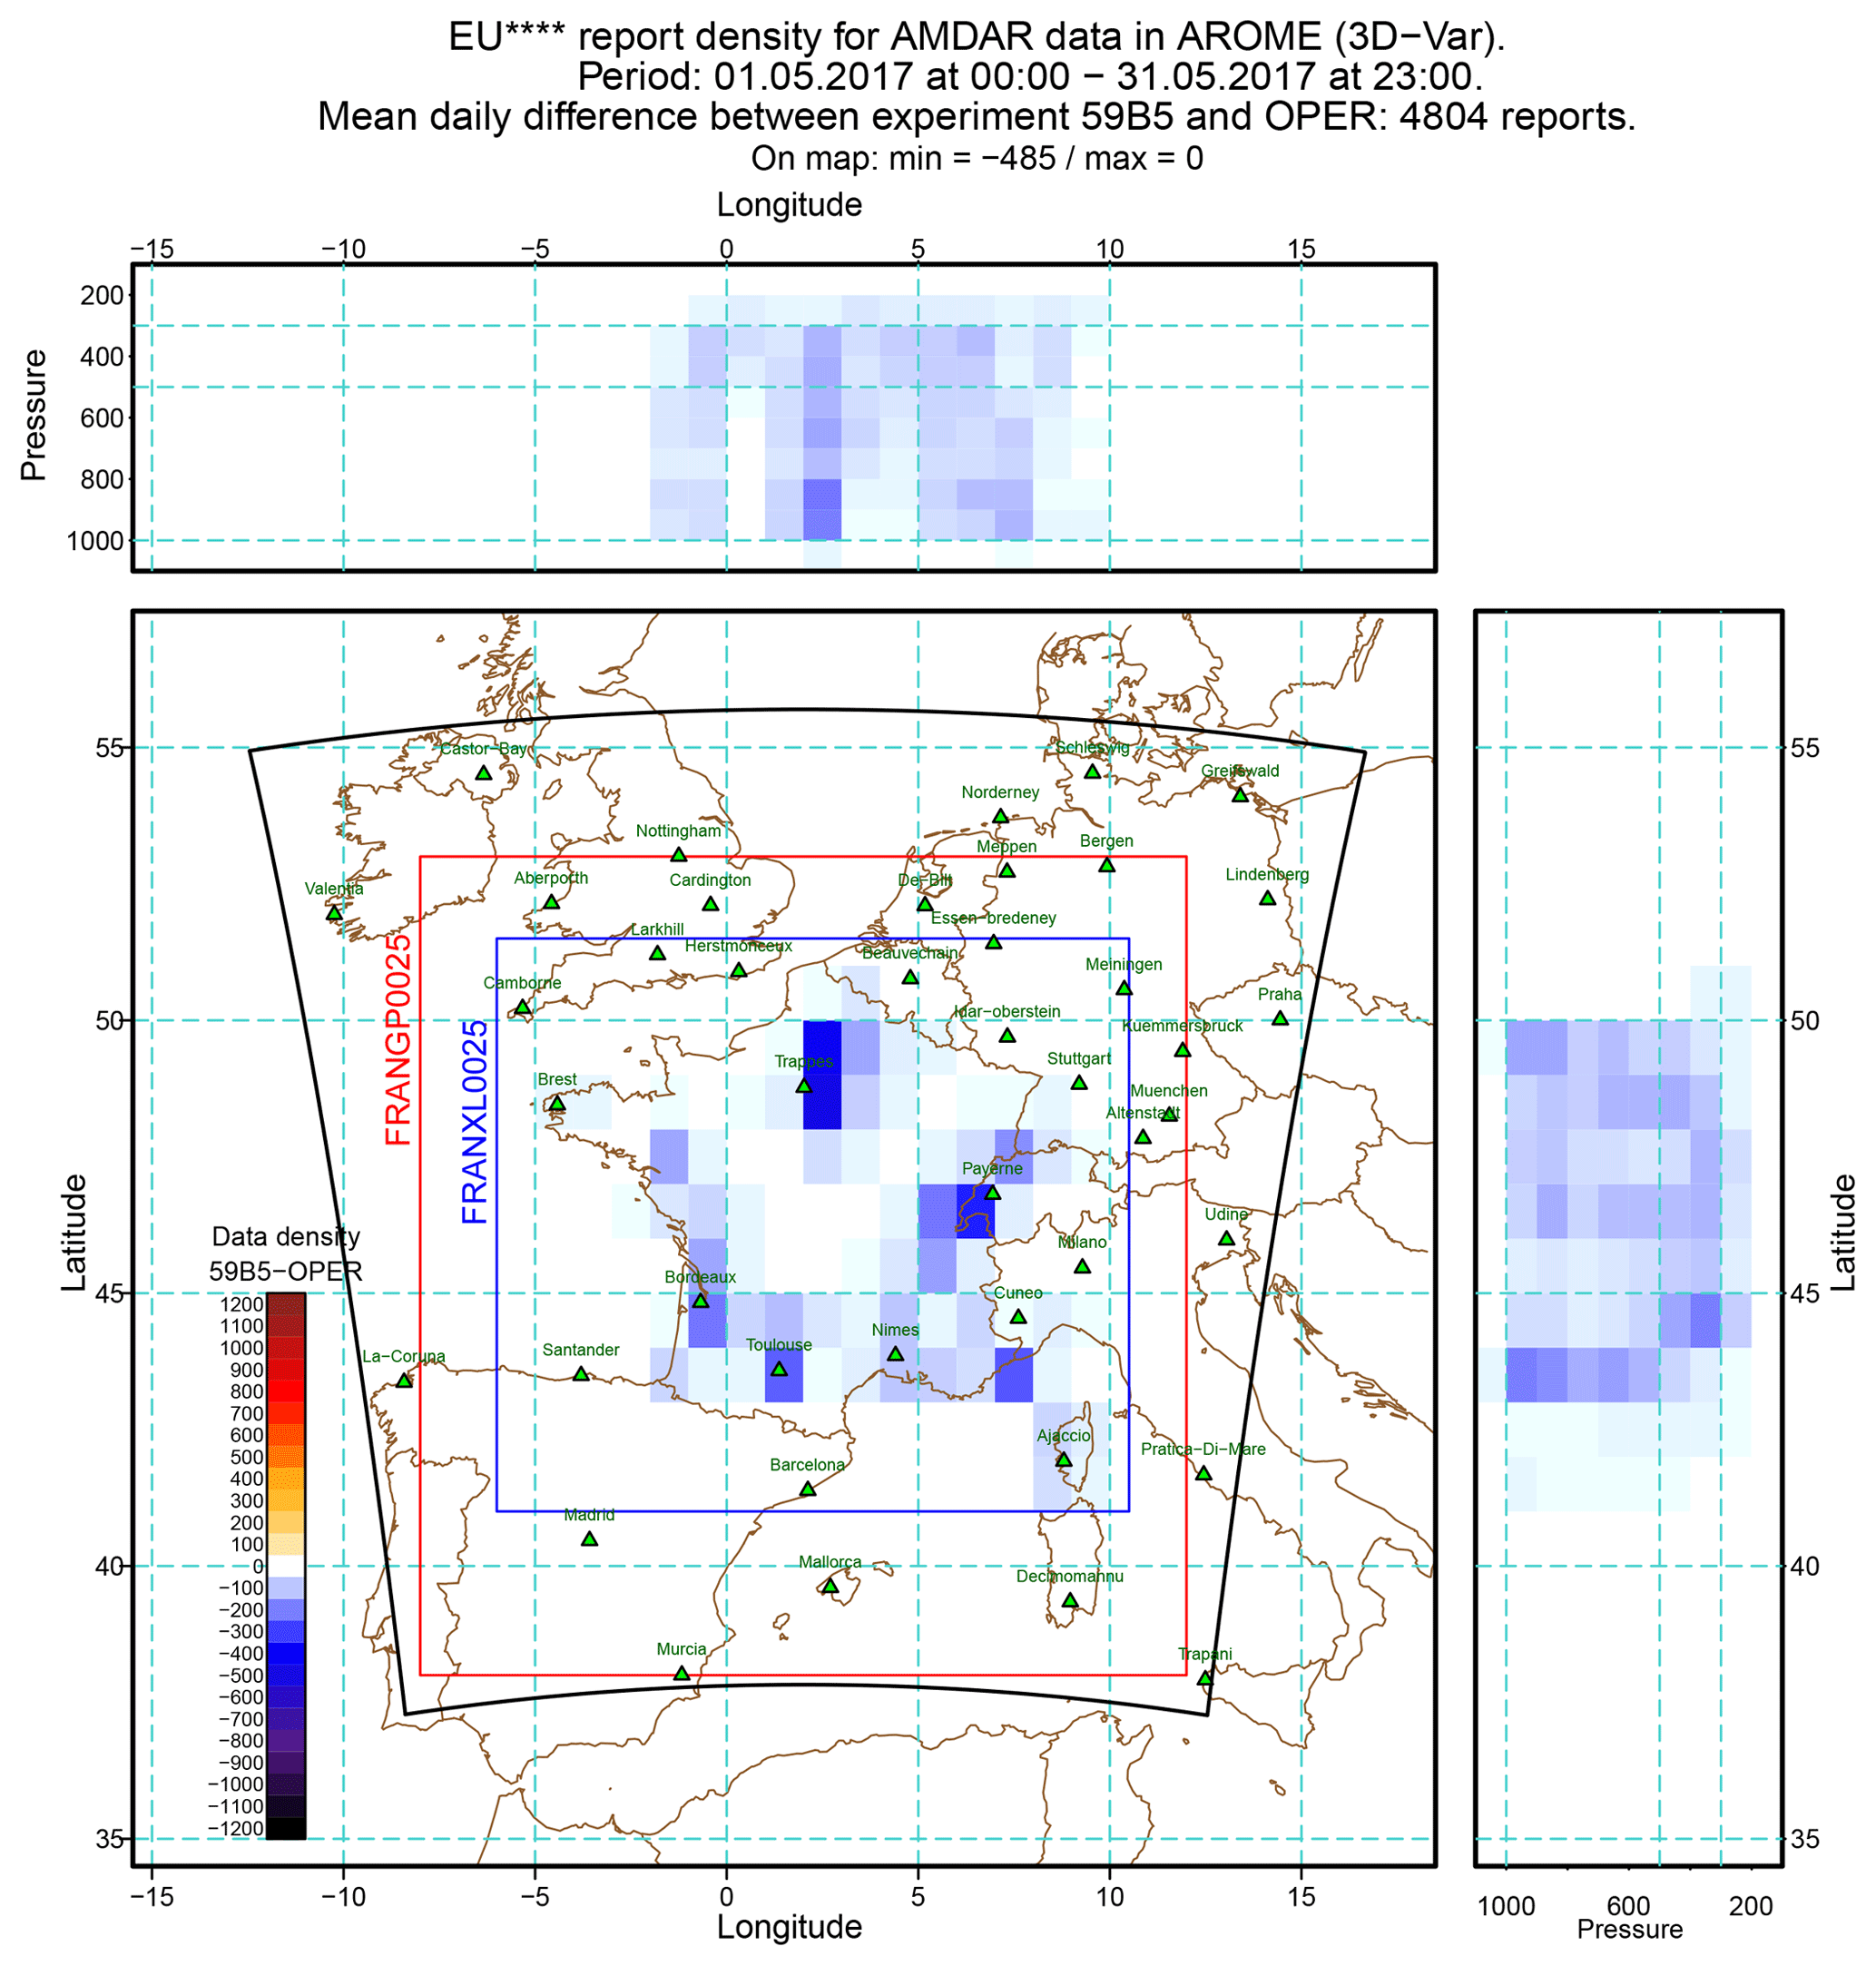
Figure 4E-AMDAR data density map and vertical cross-sections for the difference between the test experiment and the operational suite in May 2017. The horizontal and vertical resolution of the bins are the same than in Fig. 2. The black line frame highlights the geographical extent of the AROME-France model. The observation change occurs far from the model limits. The red and blue box show the domain on which the verification is performed. Green triangle shows verification radiosounding sites that operate around noon.
The evaluation of the impact of the additional AMDAR data was based on forecasts scores with respect to observations. Scores allow to assess the skills of forecasts. They provide statistics on the differences between the forecast fields and a given reference when available. The references can either be independent observations, own model analyses or even another model state. The quantities computed are the bias (i.e. the mean difference between the reference and the evaluated state), the standard deviation of the differences and the root mean square error (RMSE). The smaller the absolute value of the bias and of the RMSE, the better the forecast. The scores have been computed separately for the 4 forecast base times (00:00, 06:00, 12:00 and 18:00 UTC), every 3 h range, on the two areas shown in Fig. 4. The resolution of these post-processing grids is coarser than the one of the model (0.025∘). FRANXL0025 is more tightly focussed on the French inland territory (see Fig. 4).
In this study the signals (impacts of the E-AMDAR denial) are very weak. This differs from recent OSEs (local or global) where the removal of all aircraft data causes tremendous impacts, even larger than for radiosoundings (Moninger et al., 2010; Bormann et al., 2019). In the present study, only a fraction of aircraft data are removed and only over a fraction of the model domain. Score differences are very small and most of them are identified at analysis time with limited spatial coherence. They generally vanish with forecast range that is commonly the case with limited area systems. The latter behaviour emphasized by the fact that the coupling model (ARPÈGE) is the same for both the reference and the denial experiment. So no different signal can enter the AROME-France domain through the lateral boundaries governed by ARPÈGE.
The strongest signals have been found over the FRANXL0025 domain. Very little impact is found at 00:00 UTC, due to the lack of E-AMDAR data at that time of the day. When comparing to radiosoundings, only the 00 and 12:00 UTC-based forecasts were evaluated at 00, 12, 24 and 36 h range because European radiosounding sites generally operate at 00:00 and 12:00 UTC only. The largest impacts are generally found on 12:00 UTC-based forecasts between 850 and 200 hPa. When compared to own analysis the denial experiment is worse than operational suite, especially between 6 and 24 h range, at low levels for temperature and above boundary layer for wind. This means that operational suite with more AMDAR data performs better. The parameters that exhibit the largest impact are temperature and wind as those are the parameters observed by the aircraft and are directly assimilated in the model. The influence of the E-AMDAR data denial on surface parameters (pressure, temperature, precipitation, cloudiness, wind speed, wind direction and humidity) is smaller than on upper-air parameters (geopotential, temperature, humidity, wind vector and wind speed). When a signal is detected, it is not always statistically significant.
Figure 5 shows vertical profiles of bias and RMSE for 24 h wind forecasts for both the operational suite (in red) and the denial test experiment 59B5 (in blue). The ordinate shows the pressure levels. The reference are the 12:00 UTC radiosounding observations. All forecasts are based on 12:00 UTC. For both bias and RMSE, the closer from zero the better the forecast. From surface to 100 hPa, for both bias and RMSE, the red curve is often on the left side of the blue curve. This means that the forecast based on the operational suite that ran with the maximum of E-AMDAR data performs better than the denial test experiment. The stars on the right hand side of Fig. 5 highlight the levels where the difference between oper and test is statistically significant, that are just 400 and 500 hPa. Significant impact has been found on 12 h temperature forecasts at 250, 300 and 850 hPa with respect to radiosoundings (not shown).

Figure 5Scores (bias and RMSE or EQM) of 24 h range wind forecast with respect to radiosoundings on FRANXL0025 area. The stars show the levels where the distance between the red and blue curves is statistically significant.
However a counter-intuitive signal was also found at low-levels, suggesting that too many E-AMDAR data can have a negative impact on the prediction in the boundary layer (not shown). Most of the time, this signal was significant, especially on low level winds when compared to observations. Scores based on dry days only, with fewer radar data (humidity from reflectivity and radial winds) exhibit an even larger negative impact for low-level winds, increasing with forecast range. This finding should deserve a dedicated investigation on the boundary layer, but is outside the scope of this study.
Scores on quantitative precipitation forecast have been computed, using either rain gauges or radar-based rainfall estimates (not shown here). The scores use a fuzzy logic approach assuming a spatial tolerance on the location of precipitation. The geographical tolerance is about 11 km. The detection is evaluated using the best model point (using a 0.025∘ grid) in the vicinity of the reference value which is the observation (Amodei and Stein, 2009).
This score holds for the French territory only as the reference data-set (rain gauges or radar-based rainfall estimates) is contained within the borders of France.
Figure 6 shows results for 12 h precipitation forecasts based on the 12:00 UTC forecasts with respect to rain gauges. For each precipitation threshold in 10, 5, 2, 1 and 0.5 mm, a detection rate (DR) and a false alarm rate (FAR) are computed. The higher the DR and the lower the FAR, the better the forecast. In Fig. 6 the forecast is better when the point is close to the lower left corner of the plot.
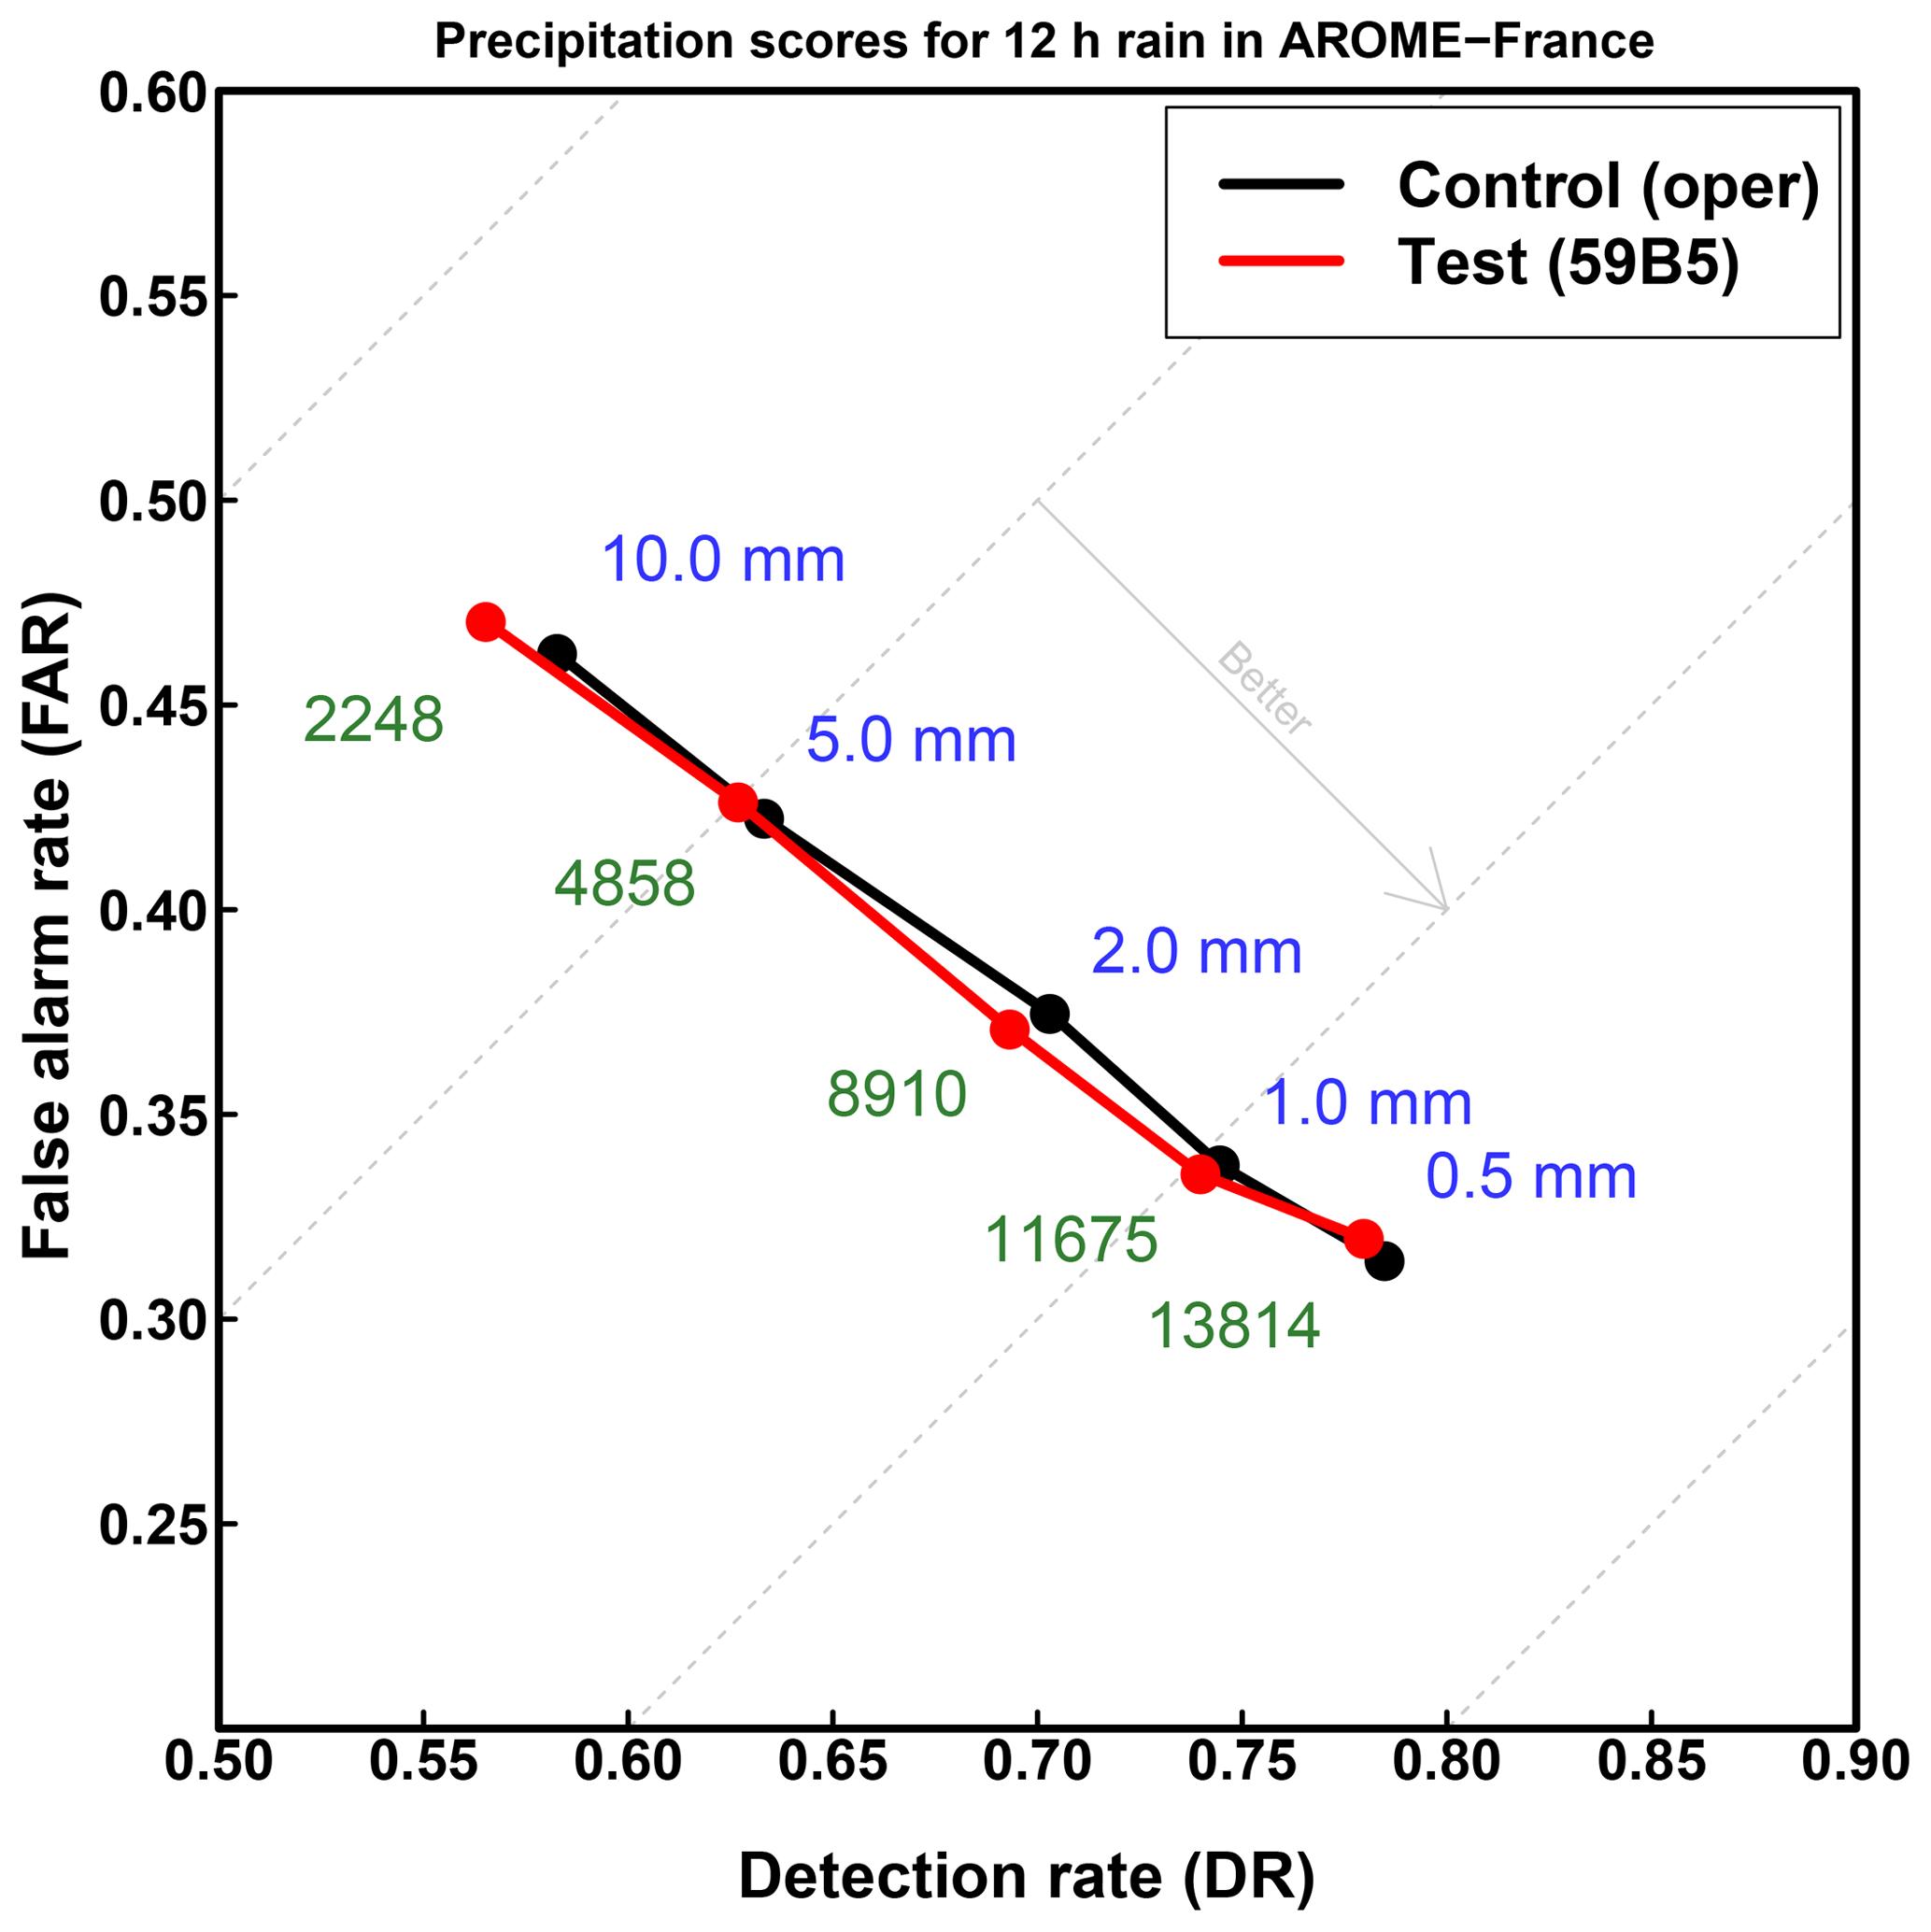
Figure 6Detection rate (DR) and false alarm rate (FAR) plot for each of 10, 5, 2, 1 and 0.5 mm precipitation thresholds computed on 12 h precipitation forecast issued at 12:00 UTC (30 cases). Reference is given by the rain gauge measurements. Red dots are for the denial experiment, black dots represent the operational AROME-Fr suite. Close to each plot is given the threshold (in blue) and the number of data points (in green).
The graph is gathered and the numbers overlay on each-other, however one can see that the red (test experiment) dots are very close from the reference in black. The highest threshold (10 mm per 12 h) has generally the lowest DR and the highest FAR, when the lowest threshold (0.5 mm per 12 h) has the best scores. The small size of the heavy rain sample may explain this.
Despite the fact that both systems have very similar scores at a first glance, one can notice that for the highest 10 mm threshold (heavy rain), the operational suite as both a better (smaller) FAR and a better (higher) DR. For other thresholds, the test experiment is slightly worse than the operational suite.
The present study strictly focussed on ascent and descent profiles. Further investigation could evaluate the role of the unsteady (UNS) flagged E-AMDAR reports. These data were not considered in this study, assuming that they were a very small amount, but this depends on aircraft and routes. This means that UNS data part of May-2017-extra profile were assimilated in the denial experiment. For an even more realistic data denial strategy, any unsteady data included in a deleted ascent or descent profile, should have been deleted as well.
A similar issue holds for en-route data as the authors are not fully sure that the E-AMDAR trial did not trigger a slight increase of en-route data above France. This was not investigated in this data-set, assuming there was no change. Despite the authors do not know the technical details of the E-AMDAR data purchasing system, they know that in practice, E-AMDAR does not exactly get from commercial airlines what was ordered a priori. Generally, it gets a little bit more. In that perspective a slight increase of en-route data in the vicinity of France is not excluded.
These ideas could be implemented to check if 8 % or 10 % less E-AMDAR data, with respect to the denial experiment that has been already run, could further influence AROME's forecast skills to produce a much clearer and more significant signal.
The E-AMDAR programme allowed to significantly increase the number of aircraft data above France in May and June 2017. The impact of these additional data has been assessed in the AROME kilometre-scale NWP system.
Because E-AMDAR does not manage data as single reports but as consistent series of reports (either profiles or full flights) and without any status flag (routine or supplementary), the design of the denial experiment requested to focus on profiles, to identify and pair them with French airports. Referring to May 2016, a deletion/selection algorithm allowed to identify which profile could be labelled as supplementary and discarded. This was the first time such a denial approach was implemented at MÉTÉO-FRANCE/CNRM.
The AROME 3D-Var assimilation and forecasts were re-run over the May 2017 period, using new observation files from which extra aircraft data were removed. The lateral boundary conditions were exactly the same as in the operational AROME model.
Scores have been computed to assess the impact of the additional E-AMDAR observations. These scores show that the overall impact of assimilating extra AMDAR profiles on forecast skills is small and neutral. Forecasts issued at 00:00 UTC show quite no changes, due to the lack of E-AMDAR data at night-time (so no change in the denial accordingly) and the limited transport of the impact through data assimilation cycles. The largest impacts are identified on 12:00 and 18:00 UTC-based forecasts as these correspond to times at which many observations are removed. Denying E-AMDAR profiles impacts wind and temperature forecasts which are the two parameters assimilated in the E-AMDAR observation reports.
This study suggests that an increase of E-AMDAR data larger than 14 % is necessary to yield major impact. Also, questions remain on the unexpected detrimental impact of additional observation on the boundary layer wind forecasts, but these may not be strictly linked to AMDAR data assimilation.
The code of AROME NWP System is not public. It is available for developers and researchers in national meteorological services which are members of ALADIN or HIRLAM consortia. It also available at ECMWF. Please contact the corresponding author if the code is required.
Please contact the corresponding author if any data are required.
AD prepared the observation selection software and ran the AROME-France numerical experiments and scores within the OLIVE environment. JFM helped analysing the results. Both AD and JFM contributed to the manuscript.
The authors declare that they have no conflict of interest.
This article is part of the special issue “18th EMS Annual Meeting: European Conference for Applied Meteorology and Climatology 2018”. It is a result of the EMS Annual Meeting: European Conference for Applied Meteorology and Climatology 2018, Budapest, Hungary, 3–7 September 2018.
A special thanks goes to Pierre Brousseau and Yann Seity from MÉTÉO-FRANCE for their help and answers on the AROME-France data assimilation system and rain-related scores, as well as to Francis Pouponneau for his help on all other scores. We would like to express our gratitude to colleagues from MÉTÉO-FRANCE Observation Department and E-AMDAR programme.
This paper was edited by Balázs Szintai and reviewed by Stan Benjamin and one anonymous referee.
Amodei, M. and Stein, J.: Deterministic and fuzzy verification methods for a hierarchy of numerical models, Meteorol. Appl., 16, 191–203, https://doi.org/10.1002/met.101, 2009. a
Benjamin, S. G., Jamison, B. D., Moninger, W. R., Sahm, S. R., Schwartz, B. E., and Schlatter, T. W.: Relative Short-Range Forecast Impact from Aircraft, Profiler, Radiosonde, VAD, GPS-PW, METAR, and Mesonet Observations via the RUC Hourly Assimilation Cycle, Mon. Weather Rev., 138, 1319–1343, https://doi.org/10.1175/2009MWR3097.1, 2010. a
Bormann, N., Lawrence, H., and Farnan, J.: Global observing system experiments in the ECMWF assimilation system, ECMWF Technical Memoranda, ECMWF, Reading, UK, https://doi.org/10.21957/sr184iyz, 2019. a
Brousseau, P., Desroziers, G., Bouttier, F., and Chapnik, B.: A posteriori diagnostics of the impact of observations on the AROME-France convective-scale data assimilation system, Q. J. Roy. Meteorol. Soc., 140, 982–994, https://doi.org/10.1002/qj.2179, 2014. a
Brousseau, P., Seity, Y., Ricard, D., and Léger, J.: Improvement of the forecast of convective activity from the AROME-France system, Q. J. Roy. Meteorol. Soc., 142, 2231–2243, https://doi.org/10.1002/qj.2822, 2016. a, b
Courtier, P., Freydier, C., Geleyn, J., Rabier, F., and Rochas, M.: The ARPEGE project at Météo-France, in: ECMWF Seminar Proceedings, vol. II, ECMWF, Reading, 193–231, 1991. a
de Haan, S.: Estimates of Mode-S EHS aircraft derived wind observation errors using triple collocation, Atmos. Meas. Tech., 9, 4141–4150, https://doi.org/10.5194/amt-9-4141-2016, 2016. a
Desroziers, G., Berre, L., Chabot, V., and Chapnik, B.: A Posteriori Diagnostics in an Ensemble of Perturbed Analyses, Mon. Weather Rev., 137, 3420–3436, https://doi.org/10.1175/2009MWR2778.1, 2009. a
James, E. P. and Benjamin, S. G.: Observation System Experiments with the Hourly Updating Rapid Refresh Model Using GSI Hybrid Ensemble–Variational Data Assimilation, Mon. Weather Rev., 145, 2897–2918, https://doi.org/10.1175/MWR-D-16-0398.1, 2017. a
Kelly, G. and Thépaut, J.-N.: Evaluation of the impact of the space component of the Global Observing System through Observing System Experiments, Ecmwf newsletter, ECMWF, Shinfield Read, Reading, UK, 2007. a
Moninger, W. R., Benjamin, S. G., Jamison, B. D., Schlatter, T. W., Smith, T. L., and Szoke, E. J.: Evaluation of Regional Aircraft Observations Using TAMDAR, Weather Forecast., 25, 627–645, https://doi.org/10.1175/2009WAF2222321.1, 2010. a
Petersen, R. A.: On the Impact and Benefits of AMDAR Observations in Operational Forecatsing – Part I: A Review of the Impact of Automated Aircraft Wind and Temperature Reports, B. Am. Meteorol. Soc., 97, 585–602, https://doi.org/10.1175/BAMS-D-14-00055.1, 2016. a
Rodgers, C.: Inverse Methods for Atmospheric Sounding Theory and Practice, World Scientific Publishing, Singapore, 256 pp., 2000. a
Seity, Y., Brousseau, P., Malardel, S., Hello, G., Bénard, P., Bouttier, F., Lac, C., and Masson, V.: The AROME-France Convective-Scale Operational Model, Mon. Weather Rev., 139, 976–991, https://doi.org/10.1175/2010MWR3425.1, 2011. a