 | 14 Oct 2019
Assessment of five different methods for the estimation of surface photosynthetically active radiation from satellite imagery at three sites – application to the monitoring of indoor soft fruit crops in southern UK
Claire Thomas
Stephen Dorling
William Wandji Nyamsi
Lucien Wald
Stéphane Rubino
Laurent Saboret
Mélodie Trolliet
Etienne Wey
This paper assesses several methods for the retrieval of Photosynthetically Active Radiation (PAR) from satellite imagery. The results of five different methods are compared to coincident in-situ measurements collected at three sites in southern UK. PAR retrieval methods are separated into two distinct groups. The first group comprises three methods that compute PAR by multiplying the satellite-retrieved solar broadband irradiance at the surface (SSI) by a constant coefficient. The two methods in the second group are based on more sophisticated modelling of the radiative transfer in the atmosphere involving advanced global aerosol property analyses and physically consistent total column water vapour and ozone produced by the Copernicus Atmosphere Monitoring Service (CAMS). Both methods compute a cloud modification factor from satellite-retrieved SSI. The five methods have been applied to two satellite-retrieved SSI datasets: HelioClim-3 version 5 (HC3v5) and CAMS Radiation Service (CAMS-Rad). Except at the seashore site, Group 2 methods combined with the cloud extinction from the HC3v5 dataset deliver the best results with small biases of −5 to 0 µmol m−2 s−1 (−1 % to 0 % relative to the mean of the measurements), root mean square errors of 130 µmol m−2 s−1 (28 %) and correlation coefficients exceeding 0.945. For all methods, best results are attained with the HC3v5 data set. These results demonstrate that all methods capture the temporal and spatial variability of the PAR irradiation field well, although several methods require a posteriori bias adjustments for reliable results. Combined with such an adjustment, the Udo et Aro method is a good compromise for this geographical area in terms of reliability, tractability and its ability to run in real-time. Overall, the method performing a spectral discretization in cloud-free conditions, combined with the HC3v5 dataset, outperforms other methods and has great potential for supporting an operational system.
- Article
(1187 KB) - Full-text XML
- BibTeX
- EndNote


In southern UK, many growers are involved in outdoor vegetable production, however soft fruit production is most commonly polytunnel-based. The confined space created by tunnels defines phytoclimates that can be optimized for instance to extend the length of the growing season through temperature and venting regulation and by enabling a precision irrigation approach.
Tunnels consequently offer a powerful control of the plant's growing environment.
In the case of soft fruits, their rate of development is both temperature and radiation dependent. The spectral part of the solar radiation responsible for the growth of plants, algae, and of certain microorganisms is called the Photosynthetically Active Radiation (PAR), and typically lies in the wavelength range [400, 700] nm. During early summer 2018, May–July, a long period of hotter and sunnier than average growing conditions led to a very focused peak in production, resulting in a significant reduction in price and a marked increase in wastage. The management of crops through the ventilation or the shadowing of tunnels offers some potential to regulate the production schedule and therefore to enhance economic performance. An accurate knowledge of climatological and real-time PAR is valuable here. The relative scarcity of PAR measurements performed at terrestrial stations motivated researchers to seek alternatives by estimating PAR from satellite imagery (PAR-satellite methods). The purpose of this study is to compare five methods to estimate PAR against the measurements performed at three stations located in the area of soft fruit cultivation. Results will be discussed taking into account the constraints and challenges in accessing reliable long-term and real-time PAR datasets that are needed for this type of application.
This study has four main advantages: first, the PAR-satellite methods anterior to 2010 have never been confronted to each other in UK. Second, this analysis includes the most recent outcomes in terms of models for the delivery of spectral radiation values (2015 onwards). Third, it enables growers to immediately access long-term, regularly distributed and worldwide databases of PAR radiation values, which is essential in particular when the size of their exploitation is too small to support the costs of installation and maintenance of a complete meteorological station. Finally, the fourth strength is that the recent and reliable methods also cover water areas, opening new opportunities for other application domains such as the monitoring of the phytoplankton in the ocean.
In-situ measurements and quality checks are presented in Sect. 2. Section 3 describes the five methods explored in this analysis to derive PAR-satellite methods, separated into two groups. All methods are applied to two satellite-derived datasets of the solar broadband irradiance received at the surface (SSI) in all-sky conditions: HelioClim-3 version 5 (HC3v5) and CAMS Radiation Service (Copernicus Atmosphere Monitoring Service, abbreviated CAMS-Rad in the rest of the paper). The two datasets are briefly presented in Sect. 3.1. Section 3.2 and 3.3 respectively introduce group 1 and group 2 PAR-satellite methods. Section 4 is dedicated to the validation protocol. Results are presented in Sect. 5. Section 6 proposes an interpretation of the results and explore the cause of the underestimation observed for all methods at one of the three sites. Section 7 provides a few perspectives on potential improvements of the service and to widen the work carried out in the framework of these activities. Section 8 concludes the present document.
The three UK stations are located as depicted on Fig. 1:
-
Aberystwyth University, located on the west coast of Wales, provides six years of relevant PAR measurements between 2012 and 2017;
-
Abbotts Hall, in south-east England, provides two years of relevant data in 2013 and 2014;
-
finally, Cartmel Sands is a coastal site in north-west England, providing one year and a half of PAR measurements from mid-2013 to 2014.
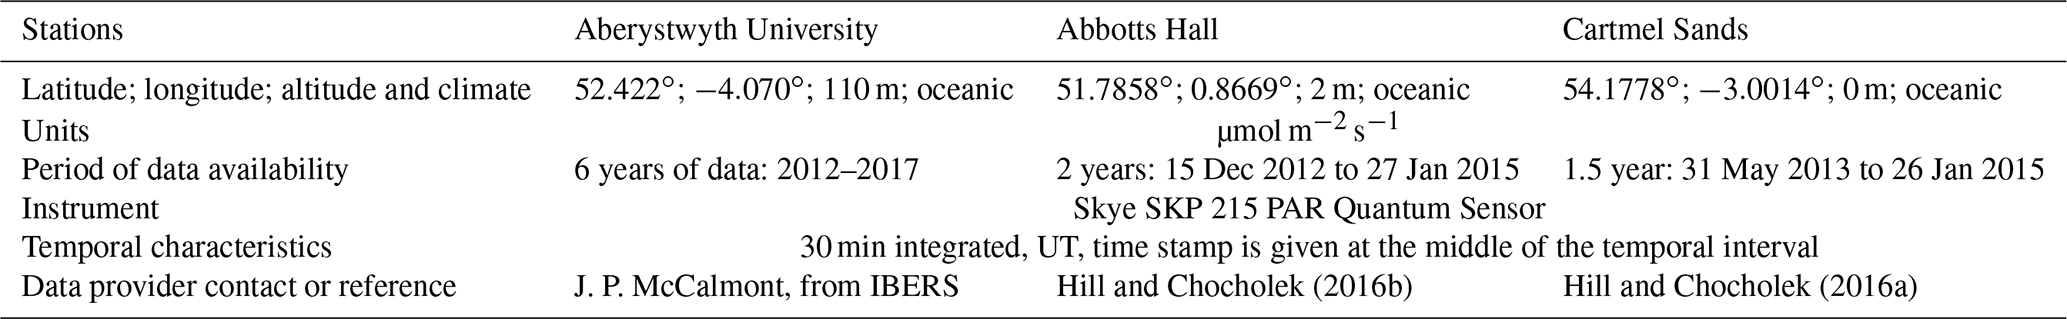
The sites are equipped with Skye SKP 2015 PAR Quantum Sensors, which count quanta of photons per unit time per unit surface, i.e. the Photosynthetic Photon Flux Density (PPFD), in µmol m−2 s−1. The PPFD can be linked to irradiances expressed in W m−2 using the widely used approximation 1 W m µmol m−2 s−1 (McCree, 1972). Data consists of 30 min measurements aggregated over this duration. Time stamp is given at the middle of this interval in UTC. Characteristics of the three stations are summarized in Table 1.
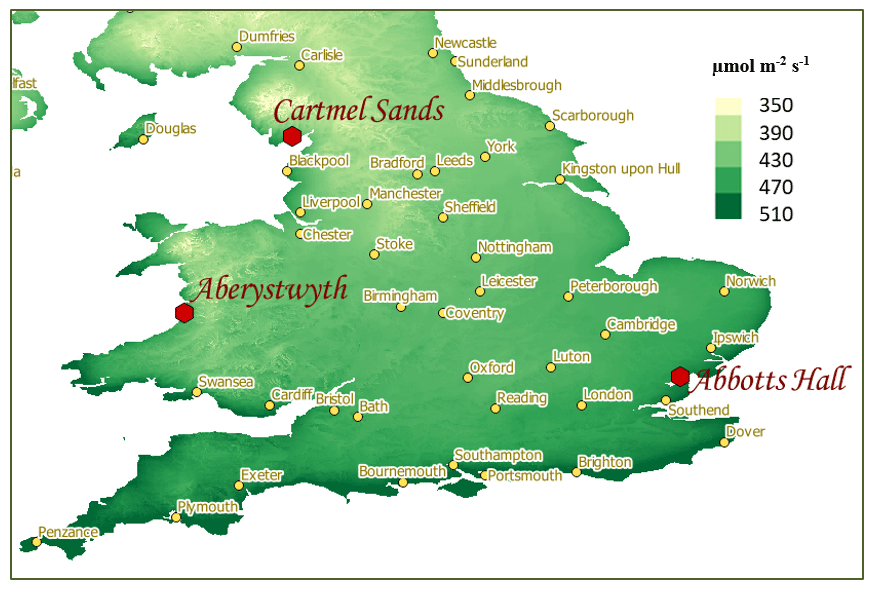
Figure 1Geographical locations, coordinates, and period of measurements of the three stations. Background: yearly average map of PAR computed with the method Jacovides et al. (2004) with the SSI HC3v5.
The quality of the measurements was assessed following the approach of Opálková et al. (2018). This quality check corresponds to an adaptation of the quality control of Korany et al. (2016) that applies to broadband measurements. This QC consists of checking that each measurement of PPFD at ground level and for a given instant t falls into the range [0.03, 1] ⋅ PPFDToA, where PPFDToA represents the same quantity but at the top of atmosphere. PPFDToA was computed from the solar spectral irradiance at the top of atmosphere defined by Gueymard (2004) by summing up the irradiances within the band [400, 700] nm.
The Aberystwyth University and Abbotts Hall sites provide measurements of good quality. The quality check has only discarded a few isolated data. The quality check applied on Cartmel Sands measurements discards a few slots, but it seems that this quality check procedure is not perfectly suited or sufficient to take rid of all issues at this site. This aspect is discussed in Sect. 6.2.
At least for Aberystwyth University and Abbotts Hall, all data points shadowed or flagged as suspicious were rejected, leading to trustful data sets ready to serve as references.
Numerous geostationary satellites have been operating for decades now, providing a significantly long record from which fields of SSI have been estimated. Consequently, several companies and governmental agencies are now providing access to different data sets of SSI worldwide. Given this opportunity, numerous methods exist to exploit the SSI to derive spectral radiation values. We applied the five methods to the HC3v5 and CAMS-Rad SSI, yielding an ensemble of results to compare with the surface PAR measurements. The two SSI data sets are described in the following sub-section. The two following sub-sections describe the five methods which have been separated into two groups. The first group comprises three methods that apply a constant coefficient directly to the SSI to derive the surface PAR in all weather conditions and are presented in Sect. 3.2. The second group comprises two methods which combine an accurate estimation of the spectral radiation in cloud-free conditions with a cloud extinction factor and are described in the Sect. 3.3.
3.1 HC3v5 and CAMS-Rad
HC3v5 and CAMS-Rad are the two SSI data sets selected for this study. They are both available on the SoDa website (http://www.soda-pro.com/, last access: 4 October 2019) (Gschwind et al., 2006). The HC3v5 dataset results from the application of the Heliosat-2 model (Blanc et al., 2011; Rigollier et al., 2004) to images acquired by the Meteosat Second Generation series of satellites combined with outputs from the CAMS McClear clear-sky model (Lefèvre et al., 2013) as proposed by Qu et al. (2014). The principle of Heliosat is that the appearance of a cloud over a pixel yields an increase in radiance in the images taken in the visible range by the satellite. A cloud index is computed that quantifies the change between the observed radiance and the radiance that should be observed if the sky were cloud-free. The greater the cloud index, the greater the extinction of the downwelling radiation by the atmosphere. Heliosat-2 makes use of a clear-sky model, which is a model that estimates the SSI in cloud-free conditions. The previous version of HelioClim-3 (version 4) uses a fixed climatology of the atmospheric turbidity as input to the ESRA clear-sky model (Rigollier et al., 2000; Remund et al., 2003). This limitation has been overcome in version 5 built on (i) the approximation of Oumbe et al. (2014) wherein the global or direct SSI under all-sky conditions is the product of the cloud-free SSI and a factor that is a function of the solar zenithal angle, cloud properties and ground reflective properties, (ii) the recent CAMS McClear clear-sky model, and (iii) the recent results on aerosol properties, and total column water vapour and ozone content produced by the CAMS that are input to McClear. At the origins of McClear, these high quality atmospheric variables were injected into radiative transfer models (RTM) to reach the best accuracy of the components of the radiation in cloud-free conditions. As RTMs are computationally expensive, McClear could not run in real time. Consequently, the strategy adopted in the development of McClear was to reduce the number of runs by using pre-computed abaci (also known as look-up tables) while conserving a satisfactory level of accuracy.
The more recent Heliosat-4 method (Qu et al., 2017) which generates the CAMS-Rad dataset is entirely based on the approximation of Oumbe et al. (2014). The cloud-free SSI is given by the McClear model with CAMS atmospheric constituents as inputs (Lefèvre et al., 2013; Gschwind et al., 2019). The German Aerospace Center (DLR) processes the multispectral images of the Meteosat satellite every day using the APOLLO method (Qu et al., 2017) and provides the cloud properties as input to Heliosat-4. The other inputs to Heliosat-4 are the solar angles computed using the SG2 algorithm (Blanc and Wald, 2012) and the dataset of quantities describing the bidirectional reflectance of the ground of Blanc et al. (2014).
3.2 Group 1 methods: computing the PAR by multiplying the satellite-retrieved SSI by a constant coefficient
Numerous publications have been proposing empirical methods which apply coefficients to SSI to derive PAR. One advantage of such simple approaches is to meet the speed of calculation constraint of a real-time operational service, while also providing an immediate availability of long-term archives of PAR based on similar archives of SSI. We selected the methods of Udo and Aro (1999), and Jacovides et al. (2004). We also referred to Yu et al. (2015) which provides an excellent summary of previous studies to add a third method originally optimised for England: Szeicz (1974). The methods will respectively be named Udo et Aro, Jacovides and Szeicz in the rest of the document. The form of these methods is PPFD = aSSI, where a is respectively 1.919 for Jacovides, 2.079 for Udo et Aro, and 2.285 for Szeicz and the PPFD and SSI is in µmol m−2 s−1.
3.3 Group 2 methods: combining a spectral distribution of the solar radiation in cloud-free conditions with a cloud extinction derived from the SSI
As in the case of the difference of HC3v4 and HC3v5, a few publications have also demonstrated the limitation of the approaches of group 1 methods described above due to their dependency on sky conditions and atmospheric properties (Wandji Nyamsi et al., 2015). An enhanced description of the atmosphere as a function of the wavelength can be obtained by running RTMs every 0.5 or 1 nm. However, once again to limit the number of computations, the idea was to rely on abaci and to work on a limited number of spectral bands as the k-distribution method and correlated-k approximation (Kato et al., 1999; Wandji Nyamsi et al., 2014). A spectral version of these abaci for each Kato band has been implemented in McClear.
In order to provide an implementation of McClear specifically for the PAR range, another variable had to be adjusted: the albedo of the ground. The original McClear implementation relies on the albedo of MODIS in the broadband range (Blanc et al., 2014). Nevertheless, the PAR range corresponds to only part of the whole solar spectrum, and consequently the ground in this range only reflects part of the incoming radiation. Bosch et al. (2009) carried out a study to evaluate the multiplication factor to obtain PAR radiation from broadband one for numerous different ground covers. This analysis leads to an average coefficient of 0.47 to apply on the broadband albedo to derive the one in the PAR range. This factor has been implemented in the Kato version of McClear when requesting PAR datasets.
The two methods selected for this work are those described in Wandji Nyamsi et al. (2015,2019). Both methods output PAR in cloud-free conditions: we will name the first one “Weighted-Kato” as it corresponds to a weighting of the spectral bands defined in Kato et al. (1999) to fit the PAR [400, 700] nm range. The second method proposes a resampling technique of the Kato bands every 1 nm and is called “Discretized-Kato”.
We propose an extension of these two methods to assess the PAR in all-sky conditions by multiplying the cloud-free PAR by a factor relating to the cloud extinction. This factor is equal to the clear-sky index Kclear, which is the ratio of the SSI in all-sky conditions to the SSI in cloud-free conditions. The SSI in all-sky conditions is given by either HC3v5 or CAMS-Rad; the SSI in cloud-free conditions is given by the CAMS McClear clear-sky model for the broadband range. Doing so bears the underlying assumption that Kclear is independent on the spectral range, which is, of course, not fully correct. In the perspectives of improvements for these services proposed in Sect. 5, we will discuss the most recent and promising achievements to come up with a spectral version of this cloud extinction factor. Figure 2 provides a recapitulative scheme of the assessment of the performance of the PAR satellite methods.
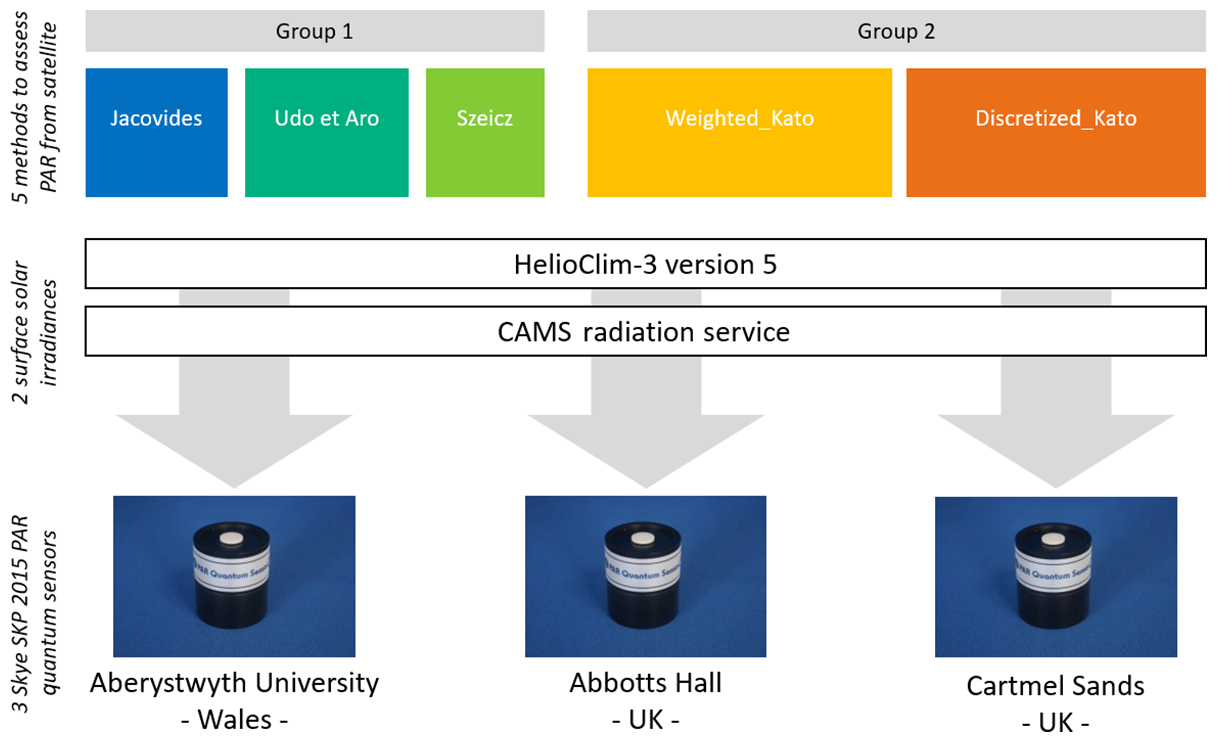
Figure 2Recapitulative scheme of the quality assessment of five methods to derive PAR from satellite imagery (a) against the measurements collected at three different sites in UK and Wales (c). Methods are separated into two groups: group 1 methods compute the PAR by multiplying the satellite-retrieved SSI by a constant coefficient, while group 2 methods combine a spectral distribution of the solar radiation in cloud-free conditions with a cloud extinction derived from the SSI. All these methods have been tested using two different SSIs: HC3v5 and CAMS-Rad (b).
Time series of 30 min means of SSI were generated from 15 min native values of HC3v5 and CAMS-Rad. At each station, the five PAR methods were applied to each SSI data set, leading to a total of 10 time series to assess per station.
The selected validation protocol is the usual one; time and space coincident estimates are compared to the corresponding measurements. Night values are discarded. Correlation coefficients are computed. The sets of differences (estimatesmeasurements) are computed and summarized by their bias, and the root mean square error (RMSE). Relative values are computed by dividing the bias or the RMSE by the mean of the measurements and are given in percent. 2-D histograms between measurements and estimates are also drawn.
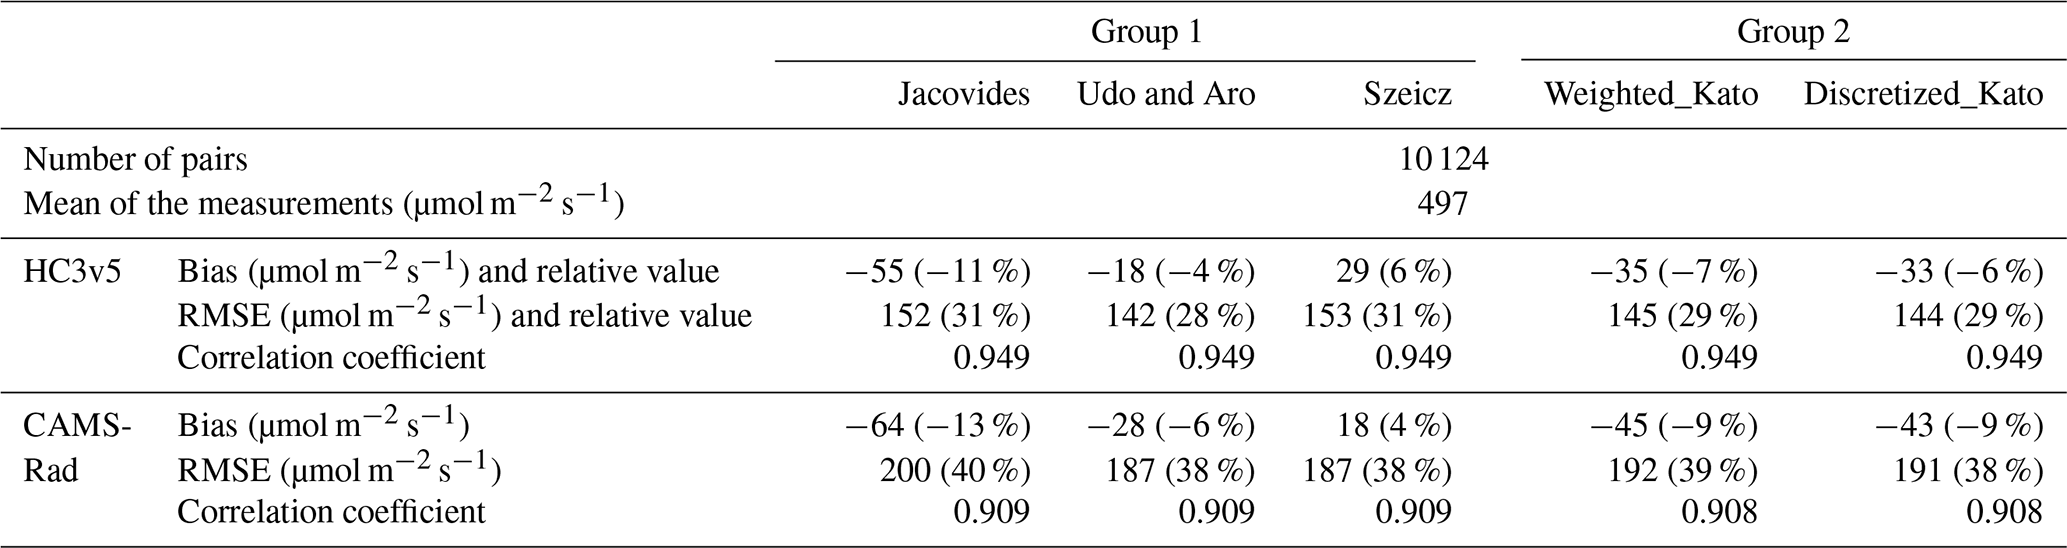
Results at Aberystwyth University, Abbotts Hall and Cartmel Sands are respectively given in Tables 2–4. Each column of the tables represents each PAR-satellite method; the first three columns correspond to the methods in group 1, and the two final columns to group 2. The two first lines respectively report the number of samples used for validation and the mean of the ground-based measurements. Then for each SSI, the next three lines correspond respectively to the bias and its relative value, the RMSE and its relative value, and the correlation coefficient.
Table 2Aberystwyth University. Number of coincident data, mean of measurements, bias and root mean square error (RMSE) and correlation coefficient for the five PAR-satellite methods and for both HC3v5 and CAMS-Rad data sets.

Table 3Abbotts Hall. Number of coincident data, mean of measurements, bias and root mean square error (RMSE) and correlation coefficient for the five PAR-satellite methods and for both HC3v5 and CAMS-Rad data sets.

Table 4Cartmel Sands. Number of coincident data, mean of measurements, bias and root mean square error (RMSE) and correlation coefficient for the five PAR-satellite methods and for both HC3v5 and CAMS-Rad data sets.
The number of coincident samples available for validation at Aberystwyth University (line 1 of Table 2) is the largest of the three sites with 49 882 samples. The best performing method for HC3v5 is Discretized-Kato, with a bias of −4 µmol m−2 s−1 (−1 % in relative value), a RMSE of 130 µmol m−2 s−1 (28 %) and a correlation coefficient of approx. 0.96 (Table 2). Similar results are obtained with the method Weighted-Kato. The range of variation for the bias of the group 1 methods is large, with values ranging from −24 µmol m−2 s−1 (5 %) for Jacovides up to 61 µmol m−2 s−1 (13 %) for Szeicz. Correlation coefficients are identical for all methods. The RMSE exhibits more or less the same values for all methods and ranges from 131 µmol m−2 s−1 (28 %) for Udo and Aro up to 153 µmol m−2 s−1 (33 %) for Szeicz.
Results obtained for CAMS-Rad exhibit a weaker performance throughout than for HC3v5 for all methods, except for the bias of Jacovides (−4 µmol m−2 s−1, −1 %). The absolute values of the bias and the RMSEs are greater for CAMS-Rad than for HC3v5 and the correlation coefficients are smaller. All methods exhibit similar performances, though the Szeicz method offers slightly weaker performances than the others.
The results at Abbotts Hall are fairly similar to those at Aberystwyth University. The number of available samples is 15 365, with a mean of the measurements of 486 µmol m−2 s−. The best performing methods are Weighted-Kato and Discretized-Kato combined with HC3v5: the bias is respectively 0 and 2 µmol m−2 s−1, leading to a relative bias of 0 % in both cases. The RMSE is 142 µmol m−2 s−1 (29 %) for both methods. The correlation coefficients are the same for the five methods: 0.944–0.945 with HC3v5 and 0.918–0.919 for CAMS-Rad. As at Aberystwyth University, the results obtained for CAMS-Rad exhibit a weaker performance throughout than for HC3v5.
Cartmel Sands exhibits similar results in terms of RMSE and correlation coefficients. The level of performance of all the methods based on CAMS-Rad is also lower than based on HC3v5. Nevertheless, the situation at Cartmel Sands is very different compared to the two other sites in terms of bias. Results obtained for the biases are as if all biases for either Aberystwyth University or Abbotts Hall had lost 5%. Szeicz method demonstrated an over estimation at the two other sites (bias of 13 % to 18 %), is now performing good with a bias of for 29 µmol m−2 s−1, 6 % HC3v5 and 18 µmol m−2 s−1, 4 % for CAMS-Rad. The smaller bias in absolute value is given by the Udo and Aro method for HC3v5 (−18 µmol m−2 s−1, −4 %) and Szeicz for CAMS-Rad (18 µmol m−2 s−1, 4 %).
As an example, 2-D histograms of PAR computed with Discretized-Kato combined with HC3v5 are presented in Figs. 3–5 corresponding to the three sites. The number of samples in each bin is coded in colour, increasing from dark blue, representing 1 sample, to dark red, representing a few tens of samples for this bin. For this method, the points are fairly aligned along the 1:1 line at the three sites (low bias) with a limited scattering of the points (low RMSE). The underestimation observed at Cartmel Sands is explained by the green cloud of points around 400 µmol m−2 s−1 just below the 1:1 line.
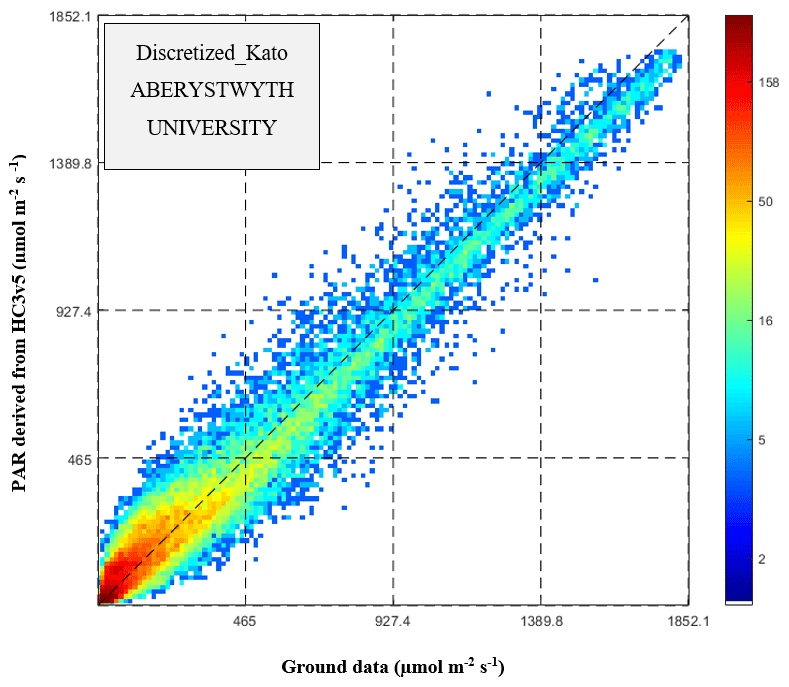
Figure 32-D histogram of the PAR in-situ measurements (horizontal axis) and PAR derived from HC3v5 estimates using the Discretized_Kato method (vertical axis) at Aberystwyth University.
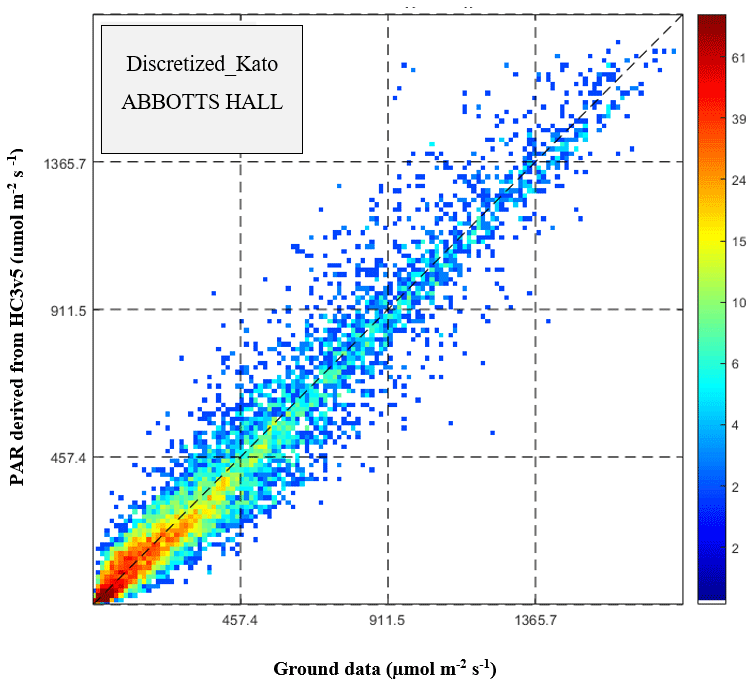
Figure 42-D histogram of the PAR in-situ measurements (horizontal axis) and PAR derived from HC3v5 estimates using the Discretized_Kato method (vertical axis) at Abbotts Hall.
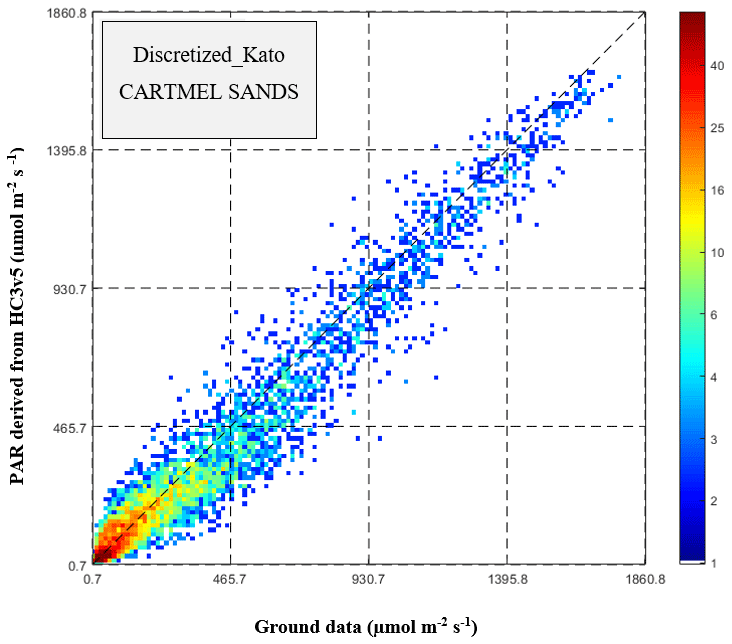
Figure 52-D histogram of the PAR in-situ measurements (horizontal axis) and PAR derived from HC3v5 estimates using the Discretized_Kato method (vertical axis) at Cartmel Sands.
The 2-D histograms of the other methods exhibit similar shapes and scattering, in line with the fact that all RMSE values lies in the range [30, 35] % and correlation coefficients always exceeds 0.91. Only the slopes of the clouds of points differ from one method to another. These results confirm that the temporal variability of the measurements is well reproduced by all the PAR-satellite methods, despite a necessary post-processing to adjust bias for some of the presented methods.
6.1 General remarks
The PAR-satellite methods are relatively ranked the same whatever the considered site, with similar values at Aberystwyth University and Abbotts Hall. For group 1 methods, Jacovides is always giving the lowest bias, followed by Udo et Aro and then Szeicz in agreement with the increasing coefficient value to compute PAR from the SSI. The Weighted-Kato and Discretized-Kato methods give excellent results at these two sites when combined with the clear-sky index from HC3v5.
One may note a global overestimation of methods based on CAMS-Rad compared to HC3v5. Looking in detail at graphs of the PAR-satellite methods against the measurements one day after the other, it is obvious that the CAMS-Rad SSI is failing in reproducing a few overcast situations. This issue has already been pointed out in several previous validation analyses (Eissa et al., 2015; Marchand et al., 2017, 2018; Thomas et al., 2016a, b).
Statistical results were also generated in clearness index KT−PAR, which corresponds to the PAR received at ground level divided by the same quantity but received from the sun at the top of the atmosphere. The advantage of the normalisation is to minimize the dependence of PPFD with sun elevation. KT−PAR is thus a stricter indicator of the ability of a database in assessing the optical state of the atmosphere in different weather conditions. The results for this indicator do not change the conclusions drawn in this analysis.
A final observation is that the best performing method turns out to be Discretized-Kato. As results are very close to those for Weighted-Kato and taking into consideration that the discretization every 1 nm required by the Discretized-Kato method is quite time consuming, one may wonder if such a precision is necessary depending on the application. In the present case of soft fruit production forecasting under plastic tunnels in southern UK, the Udo and Aro method is the best compromise, applied to HC3v5, given the need to operate in real-time.
6.2 Analysis of the underestimation observed at Cartmel Sands
Cartmel Sands exhibits a tendency to underestimation contrary to the other sites, whatever the PAR satellite method. Two causes are possible: either all the PAR-satellite methods are underestimating what is actual measured on-site, or the instrument at Cartmel Sands is facing calibration issues.
Let us explore the PAR-satellite methods. Cartmel Sands is located very close to the sea shore. This site could potentially experience moisture-laden breezes from the ocean with many small and broken clouds that may not be detectable individually in the Meteosat images (Marchand et al., 2018). This leads to an overestimation of the irradiances, not an underestimation as observed at Cartmel Sands. This meteorological phenomenon cannot explain the underestimation.
Marchand et al. (2019) propose an analysis of the spatial consistency of the uncertainties of the satellite estimates for both CAMS-Rad and HC3v5 for the Netherlands, in particular regarding the sea shore proximity for each station. There was a clear influence of the proximity to the coast for CAMS-Rad with a tendency of underestimate the occurrence of cloud-free conditions leading to an underestimation of the irradiance, observation in line with the results obtained here at Cartmel Sands. However, this paper also shows that no specific trend of feature was observed for HC3v5. As the underestimation affected both SSIs in the same way, the situation of Cartmel Sands is not similar to the stations close to the sea shore in the Netherlands.
We have investigated the possibility that the pixel seen from the satellite that contains Cartmel Sands station was potentially mixing both water and soil, leading to a wrong value for the albedo that would transversally affect all PAR-satellite methods. This could also be the case if the geographical coordinates of Cartmel Sands station were rounded and would have erroneously been placed offshore instead of inland. We first checked the sea mask used within HC3v5 to label the Meteosat pixel as water or inland area and serve to define the albedo. This first check confirmed that the pixel in which is located the station has always been considered as inland during the period of data acquisition. Then, we ran the PAR-satellite methods at several locations in the neighbourhood of the considered location. Results were worst in all cases, leading to the conclusion that the issue was not due to a problem of albedo or of a wrong location of the instrument.
As CAMS McClear is common for both data sets, a remaining option could have been a problem of the estimation of the radiation in cloud-free conditions, showing a stronger opacity of the atmosphere than the one actually observed at site. However, given the large number of cloudy days in this region, it is highly improbable that this could explain the magnitude of the underestimation, especially given the very good results obtained when validating the McClear model. However, we tested this assumption by the computation of the statistical quantities in cloud-free conditions, first for the summer season and then for the winter one. It appears that the underestimation was already visible in the cloud-free data, and was very strong the winter period with bias that ranges in −14 % to −37 % for all methods, which has never been observed before in the assessment of CAMS McClear in the broadband range (Lefèvre et al., 2013; Gschwind et al., 2019 and their references).
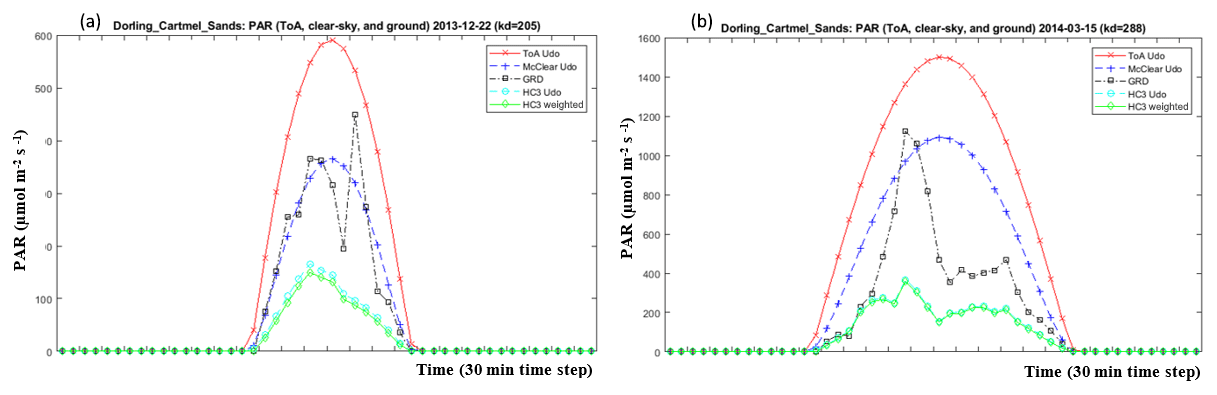
Figure 6Overestimation of the ground measurements compared to PAR-satellite methods at Cartmel Sands – PAR values (vertical axis) against time (horizontal axis) on respectively 22 December 2013 on (a), and on 15 March 2014 on (b). Red line is PARTOA, blue is PAR in cloud-free conditions, black is ground PAR measurements, and cyan and green lines correspond to 2 PAR-satellite methods: Udo et Aro and Weighted_Kato applied on the SSI HC3v5.
To confirm that this underestimation could not be imputed to PAR-satellite methods, we had the opportunity to start a collaboration with the Deutcher WetterDienst (DWD) in Germany with the team in charge of the next generation of solar products of the Climate Monitoring Satellite Application Facility (CM-SAF) in 2021 (Mueller et al., 2012, 2015). In the next release of SARAH (version 3) scheduled for 2021, they contemplate to provide PAR datasets with a monthly time step and we offer them the opportunity to join this comparison. The DWD PAR-satellite method is very similar to the Weighted_Kato method as they are running an implementation equivalent to McClear Kato named SPECMAGIC, in which abaci have also been optimized for each Kato band. Results are fully in line with the ones obtained for the ten other PAR-satellite methods, with a relative bias in percent of approx. 4 % for Aberystwyth University or Abbotts Hall and less than −4 % for Cartmel Sands.
As a consequence, the remaining option is that the instrument faces a problem of calibration. Figure 6 displays two days of PAR data for the site of Cartmel Sands. The selected days are 22 December 2013 for the left hand side picture, and on 15 March 2014 for the right hand side one. For these specific days which belong to the winter period, several 30 min PAR datasets are displayed: the red line corresponds to the PARTOA, blue is PAR in cloud-free conditions, black is ground PAR measurements, and cyan and green lines represents the values for two PAR-satellite methods: Udo et Aro and Weighted_Kato applied on the SSI HC3v5. The type of weather for these days are mostly covered with broken clouds, nevertheless the ground measurements are very close and sometimes strongly exceeds cloud-free PAR model. The two PAR-satellite models are collected the temporal variation correctly, and the discrepancy between satellite and ground PAR data is very strong due to problem of calibration of the instrument.
As a conclusion concerning the observations made at Cartmel Sands, we do not recommend to use this station for further developments and validation of PAR products.
Concerning the Weighted_Kato and the Discretized_Kato method, authors are currently working on a spectral version of the clear-sky index Kclear adjusted for the PAR range. Preliminary results demonstrated that the hypothesis that clouds are not spectrally dependant led to an under-estimation of approximately 10 % in the resulting PAR values. This will be the topic of another publication.
Another mean of potential improvement is to provide a better model of the albedo in the PAR range by exploring data sets of bidirectional reflectance distribution functions (BRDF) available from the MODIS mission to estimate the albedo in the PAR range. This could be based on the monthly average maps of BRDF parameters built by Blanc et al. (2014) available in the broadband range as well as in ten spectral bands.
Collaboration has already been set up to extend this validation activity across Europe, mainly in France, Spain, and Czech Republic with more than 15 sites in total. PAR data have been collected for a site in Kenya.
Discussions have also been initiated with users working in different domains, such as the monitoring of algal blooms along sea shores or in lakes, and for the monitoring of the phytoplankton. They have observed that phytoplankton of the northern hemisphere in the Atlantic Ocean is migrating further north due to global warming and climate change. They are investigating the opportunity to exploit PAR-satellite methods in their monitoring tool.
This paper reports on a comparison of five methods to derive PAR from two SSI datasets derived from satellite imagery against the measurements performed at three UK stations. A great attention has been paid to the quality of the measurements prior to the comparison. An in-depth analysis of the measurements available for the Cartmel Sands station demonstrated that this dataset should not be used. The variability of the measurements in time is well reproduced by all methods for this area. Overall, methods based on HC3v5 exhibit better results. Those using the CAMS-Rad data set globally overestimates irradiances as it misses cloudy situations, which is in agreement with the literature. Group 2 methods, and in particular Discretized-Kato combined with the cloud extinction of the SSI HC3v5, outperform methods of group 1 confirming the importance of successfully modelling the spectral distribution of the solar radiation in cloud-free conditions, with a bias equal to zero or slightly negative, a RMSE of 140 µmol m−2 s−1 (approx. 30 %) relative to the mean of the measurements) and a correlation coefficient of 0.95. This methods turns to be satisfactory to meet the diverse challenges of the specific application of assessment of the PAR potential and the real-time monitoring at more than sixty soft fruit farms relying upon tunnel production.
The validation carried out in this analysis will be extended to other sites in Europe and in Kenya in a forthcoming effort. To help in understanding the merits and drawbacks of the different PAR-satellite methods, they will be confronted to other methods, such as the alternative proposed by EUMETSAT which plans to enlarge the panel of the CM-SAF products with monthly PAR data sets as part of the next version of SARAH (version 3) developed and maintained by the DWD.
This work belongs to a wider project which aims at providing irradiances in any spectral range to meet the numerous requirements from users in various applications, for instance in solar energy, human health, agro-meteorology and e-cosmetics.
In-situ measurements are available on-demand using contacts indicated in the “Acknowledgment” section. PAR-satellite datasets for each measurement location will be available on the SoDa website (http://www.soda-pro.com/, last access: 4 October 2019) and also on demand using our mailing list support-sales@soda-is.com. The SoDa website xists since 2003.
CT coordinates the action of validation of several methods to estimate spectral radiation values from satellites and numerical weather models. This paper represents the results for the first four stations to assess the quality of PAR-satellite methods. CT has accordingly developed a benchmarking architecture in Matlab from which validation results have been extracted. SD has been the key person who initiated this work, by contacting SoDa and as our contact to reach more than 60 soft fruits growers and more than 100 vineyard owners in UK. He also brings his support in the access to the in-situ measurements. WWN is a major contributor of this paper; he developed and validated both Weighted_Kato and Discretized_Kato methods in cloud-free conditions. LW contributed to the writing of the paper together with WWN, LS, MT and EW. SR is in charge of the operationalisation of a few models to estimate spectral radiation values to the SoDa users, and gave precious elements for the implementation and optimization of Matlab routines. LS and EW helped the main author with the interpretation of the validation results. The expertise and the network of MT in the domain climate and the ocean has permitted a better understanding of authors of global warming and its potential incidence on agriculture. She permits the writing of an interesting perspective by opening new horizons of applications toward the ocean.
The authors declare that they have no conflict of interest.
This article is part of the special issue “18th EMS Annual Meeting: European Conference for Applied Meteorology and Climatology 2018”. It is a result of the EMS Annual Meeting: European Conference for Applied Meteorology and Climatology 2018, Budapest, Hungary, 3–7 September 2018.
The authors praise Jon Paul McCalmont from Institute of Biological, Environmental and Rural Science (IBERS), for the supply of the measurements at Aberystwyth University. For the measures collected at Cartmel Sands and Abbotts Hall, authors would like to thank Tim Hill and Melanie Chocholek from the Coastal Biodiversity and Ecosystem Service Sustainability (CBESS) institute, NERC Environmental Information Data Centre. We are grateful to the Copernicus Atmosphere Monitoring Service (CAMS) of the European Union for making available CAMS McClear and CAMS-Rad data sets.
This paper was edited by Josef Eitzinger and reviewed by Gheorghe Stancalie and one anonymous referee.
Blanc, P. and Wald, L.: The SG2 algorithm for a fast and accurate computation of the position of the Sun, Sol. Energy, 86, 3072–3083, https://doi.org/10.1016/j.solener.2012.07.018, 2012.
Blanc, P., Gschwind, B., Lefèvre, M., and Wald, L.: The HelioClim project: Surface solar irradiance data for climate applications, Remote Sens. Basel, 3, 343–361, https://doi.org/10.3390/rs3020343, 2011.
Blanc, P., Gschwind, B., Lefèvre, M., and Wald, L.: Twelve monthly maps of ground albedo parameters derived from MODIS datasets, in: Proceedings of IGARSS 2014, 13–18 July 2014, Quebec, Canada, 3270–3272, 2014.
Bosch, J. L., López, G., and Batlles, F. J.: Global and direct photosynthetically active radiation parameterizations for clear-sky conditions, Agr. Forest Meteorol., 149, 146–158, https://doi.org/10.1016/j.agrformet.2008.07.011, 2009.
Eissa, Y., Korany, M., Aoun, Y., Boraiy, M., Abdel Wahab, M., Alfaro, S., Blanc, P., El-Metwally, M., Ghedira, H., and Wald, L.: Validation of the surface downwelling solar irradiance estimates of the HelioClim-3 database in Egypt, Remote Sens.-Basel, 7, 9269–9291, https://doi.org/10.3390/rs70709269, 2015.
Gschwind, B., Ménard, L., Albuisson, M., and Wald, L.: Converting a successful research project into a sustainable service: the case of the SoDa Web service, Environ. Model. Softw., 21, 1555–1561, https://doi.org/10.1016/j.envsoft.2006.05.002, 2006.
Gschwind, B., Wald, L., Blanc, P., Lefèvre, M., Schroedter-Homscheidt, M., and Arola, A.: Improving the McClear model estimating the downwelling solar radiation at ground level in cloud-free conditions – McClear-v3, Meteorol. Z., 28, 147–163, https://doi.org/10.1127/metz/2019/0946, 2019.
Gueymard, C. A.: The sun's total and spectral irradiance for solar energy applications and solar radiation models, Solar Energy, 76, 423–453, 2004.
Hill, T. C. and Chocholek, M.: Coastal Biodiversity and Ecosystem Service Sustainability (CBESS) meteorological data from Cartmel Sands, Morecambe, NERC Environmental Information Data Centre, https://doi.org/10.5285/b1e2fb9c-8c34-490a-b6ae-2fdf6b460726, this resource is made available under the terms of the Open Government Licence at: https://catalogue.ceh.ac.uk/documents/b1e2fb9c-8c34-490a-b6ae-2fdf6b460726, (last access: 4 October 2019), 2016a.
Hill, T. C. and Chocholek, M.: Coastal Biodiversity and Ecosystem Service Sustainability (CBESS) meteorological data from Abbotts Hall, Essex, NERC Environmental Information Data Centre https://doi.org/10.5285/dd2f7d23-6f11-4053-bc18-3cf2431c1963, this resource is made available under the terms of the Open Government Licence at https://catalogue.ceh.ac.uk/documents/dd2f7d23-6f11-4053-bc18-3cf2431c1963, (last access: 4 OctOBER 2019), 2016b.
Jacovides, C. P., Timvios, F. S., Papaioannou, G., Asimakopoulos, D. N., and Theofilou, C. M.: Ratio of PAR to broadband solar radiation measured in Cyprus, Agr. Forest Meteorol., 121, 135–140, 2004.
Kato, S., Ackerman, T., Mather, J., and Clothiaux, E.: The k distribution method and correlated k approximation for shortwave radiative transfer model, J. Quant. Spectrosc. Ra., 62, 109-121, 1999.
Korany, M., Boraiy, M., Eissa, Y., Aoun, Y., Abdel Wahab, M. M., Alfaro, S. C., Blanc, P., El-Metwally, M., Ghedira, H., Hungershoefer, K., and Wald, L.: A database of multi-year (2004–2010) quality-assured surface solar hourly irradiation measurements for the Egyptian territory, Earth Syst. Sci. Data, 8, 105–113, https://doi.org/10.5194/essd-8-105-2016, 2016.
Lefèvre, M., Oumbe, A., Blanc, P., Espinar, B., Gschwind, B., Qu, Z., Wald, L., Schroedter-Homscheidt, M., Hoyer-Klick, C., Arola, A., Benedetti, A., Kaiser, J. W., and Morcrette, J.-J.: McClear: a new model estimating downwelling solar radiation at ground level in clear-sky conditions, Atmos. Meas. Tech., 6, 2403–2418, https://doi.org/10.5194/amt-6-2403-2013, 2013.
Marchand, M., Al-Azri, N., Oumbe-Ndeffotsing, A., Wey, E., and Wald, L.: Evaluating meso-scale change in performance of several databases of hourly surface irradiation in South-eastern Arabic Pensinsula, Adv. Sci. Res., 14, 7–15, https://doi.org/10.5194/asr-14-7-2017, 2017.
Marchand, M., Ghennioui, A., Wey, E., and Wald, L.: Comparison of several satellite-derived databases of surface solar radiation against ground measurement in Morocco, Adv. Sci. Res., 15, 21–29, https://doi.org/10.5194/asr-15-21-2018, 2018.
Marchand, M., Lefèvre, M., Saboret, L., Wey, E., and Wald, L.: Verifying the spatial consistency of the CAMS Radiation Service and HelioClim-3 satellite-derived databases of solar radiation using a dense network of measuring stations: the case of The Netherlands, Adv. Sci. Res., 16, 103–111, https://doi.org/10.5194/asr-16-103-2019, 2019.
McCree, K. J.: Test of current definitions of photosynthetically active radiation against leaf photosynthesis data, Agric. Meteorol., 10, 443–453, 1972.
Mueller, R., Behrendt, T., Hammer, A., and Kemper, A.: A New Algorithm for the Satellite-Based Retrieval of Solar Surface Irradiance in Spectral Bands, Remote Sens., 4, 622–647, https://doi.org/10.3390/rs4030622, 2012.
Mueller, R., Pfeifroth, U., Träger-Chatterjee, C., Trentmann, J., and Roswitha Cremer, Digging the METEOSAT Treasure – 3 Decades of Solar Surface Radiation, Remote Sens., 7, 8067–8101, https://doi.org/10.3390/rs70608067, 2015.
Opálková, M., Navrátil, M., Špunda, V., Blanc, P., and Wald, L.: A database of 10 min average measurements of solar radiation and meteorological variables in Ostrava, Czech Republic, Earth Syst. Sci. Data, 10, 837–846, https://doi.org/10.5194/essd-10-837-2018, 2018.
Oumbe, A., Qu, Z., Blanc, P., Lefèvre, M., Wald, L., and Cros, S.: Decoupling the effects of clear atmosphere and clouds to simplify calculations of the broadband solar irradiance at ground level, Geosci. Model Dev., 7, 1661–1669, https://doi.org/10.5194/gmd-7-1661-2014, 2014.
Qu, Z., Gschwind, B., Lefèvre, M., and Wald, L.: Improving HelioClim-3 estimates of surface solar irradiance using the McClear clear-sky model and recent advances in atmosphere composition, Atmos. Meas. Tech., 7, 3927–3933, https://doi.org/10.5194/amt-7-3927-2014, 2014.
Qu, Z., Oumbe, A., Blanc, P., Espinar, B., Gesell, G., Gschwind, B., Klüser, L., Lefèvre, M., Saboret, L., Schroedter-Homscheidt, M., and Wald, L.: Fast radiative transfer parameterisation for assessing the surface solar irradiance: The Heliosat-4 method, Meteorol. Z., 26, 33–57, https://doi.org/10.1127/metz/2016/0781, 2017.
Remund, J., Wald, L., Lefèvre, M., Ranchin, T., and Page, J.: Worldwide Linke turbidity information, in: Proceedings of ISES Solar World Congress, 16–19 June 2003, Göteborg, Sweden (CD-ROM published by International Solar Energy Society), 2003.
Rigollier, C., Bauer, O., and Wald, L.: On the clear sky model of the ESRA – European Solar Radiation Atlas – with respect to the Heliosat method, Sol. Energy, 68, 33–48, https://doi.org/10.1016/S0038-092X(99)00055-9, 2000.
Rigollier, C., Lefèvre, M., and Wald, L.: The method Heliosat-2 for deriving shortwave solar radiation from satellite images, Sol. Energy, 77, 159–169, https://doi.org/10.1016/j.solener.2004.04.017, 2004.
Szeicz, G.: Solar radiation for plant growth, J. Appl Ecol., 11, 917–636, https://doi.org/10.2307/2402214, 1974.
Thomas C., Wey, E., Blanc, P., Wald, L., and Lefèvre, M.: Validation of HelioClim-3 version 4, HelioClim-3 version 5 and MACC-RAD using 14 BSRN stations, SHC 2015, Istanbul, Turkey, 2–4 December 2015, Energy Procedia, 91, 1059–1069, 2016a.
Thomas, C., Wey, E., Blanc, P., and Wald L.: Validation of three satellite-derived databases of surface solar radiation using measurements performed at 42 stations in Brazil, Adv. Sci. Res., 13, 81–86, https://doi.org/10.5194/asr-13-81-2016, 2016b.
Udo, S. O. and Aro, T. O.: Global PAR related to global solar radiation for central Nigeria, Agr. Forest Meteorol., 97, 21–31, https://doi.org/10.1016/S0168-1923(99)00055-6, 1999.
Wandji Nyamsi, W., Espinar, B., Blanc, P., and Wald, L.: How close to detailed spectral calculations is the k distribution method and correlated k approximation of Kato et al. (1999) in each spectral interval?, Meteorol. Z., 23, 547–556, https://doi.org/10.1127/metz/2014/0607, 2014.
Wandji Nyamsi, W., Espinar, B., Blanc, P., and Wald, L.: Estimating the Photosynthetically Active Radiation in clear sky conditions from the k-distribution method and correlated-k approximation of Kato et al. (1999), Adv. Sci. Res., 12, 5–10, https://doi.org/10.5194/asr-12-5-2015, 2015.
Wandji Nyamsi, W., Blanc, P., Augustine, J. A., Arola, A., and Wald, L.: A New Clear-Sky Method for Assessing Photosynthetically Active Radiation at the Surface Level, Atmosphere, 10, 219, https://doi.org/10.3390/atmos10040219, 2019.
Yu, X., Wu, Z., Jiang, W., and Guo, X.: Predicting daily photosynthetically active radiation from global solar radiation in the Contiguous United States, Energy Convers. Manage., 89, 71–82, https://doi.org/10.1016/j.enconman.2014.09.038, 2015.
- Abstract
- Introduction
- Description of measurements used for comparison and quality control
- Five methods to derive PAR from satellite monitoring are compared with these measurements
- Validation protocol
- Results
- Interpretation of results
- Perspectives
- Conclusion
- Data availability
- Author contributions
- Competing interests
- Special issue statement
- Acknowledgements
- Review statement
- References