 | 11 Jun 2019
Raindrop shapes and fall velocities in “turbulent times”
Merhala Thurai
Michael Schönhuber
Günter Lammer
Viswanathan Bringi
Raindrop shapes and fall velocities measured by 2-dimensional video disdrometer are presented for 2 high-wind/turbulent events. The shapes were reconstructed using a relatively new technique. 10 m height wind sensor data are used to derive proxy-indicators for turbulent intensities. Our results show strong gusts, directional wind shifts (i.e. shear) and/or inferred high turbulence intensity are correlated with reduced fall speeds, reaching values ∼25 %–30 % less than the expected values, i.e. sub-terminal fall speeds. Significant percentage (20 %–35 %) of asymmetric drops (> 2 mm) deviating from the most probable axisymmetric shapes were also detected for some events with high turbulent intensities.
- Article
(4440 KB) - Full-text XML
- BibTeX
- EndNote


Raindrop shapes and their fall speeds have been examined by many researchers in the past several decades using wind tunnel as well as under still-air laboratory conditions (e.g. Szakáll et al., 2010; Beard et al., 2010 and the references therein). In the last 15 years, measurements from 2D-video disdrometers (2DVD: Schönhuber et al., 2007, 2008) have contributed greatly to studies of drop shapes and fall speeds in both artificial rain as well as natural rain. In 2004, an artificial rain experiment was conducted with an 80 m fall, where 2DVD measurements of shapes and fall velocities were made for more than 115 000 drops in the diameter range 1.5 to 9.5 mm (Thurai and Bringi, 2005; Thurai et al., 2007). This experiment resulted in the most probable shapes being derived in terms of the equi-volume drop diameter (Deq) and their variations due to drop oscillations. Fall velocity distributions were also derived and their mean values versus Deq were found to be close to the laboratory measurements of Gunn and Kinzer (1949), with relatively narrow and symmetric Gaussian-shaped distributions around the mean. The knowledge of fall velocity is of obvious importance in hydrometeorology for calculating mass flux (or, rain rate) and kinetic energy of raindrops which is important in soil erosion (Fernández-Raga et al., 2017) and ultimately to changes in, for example, the coastal ecosystem by land-falling hurricanes.
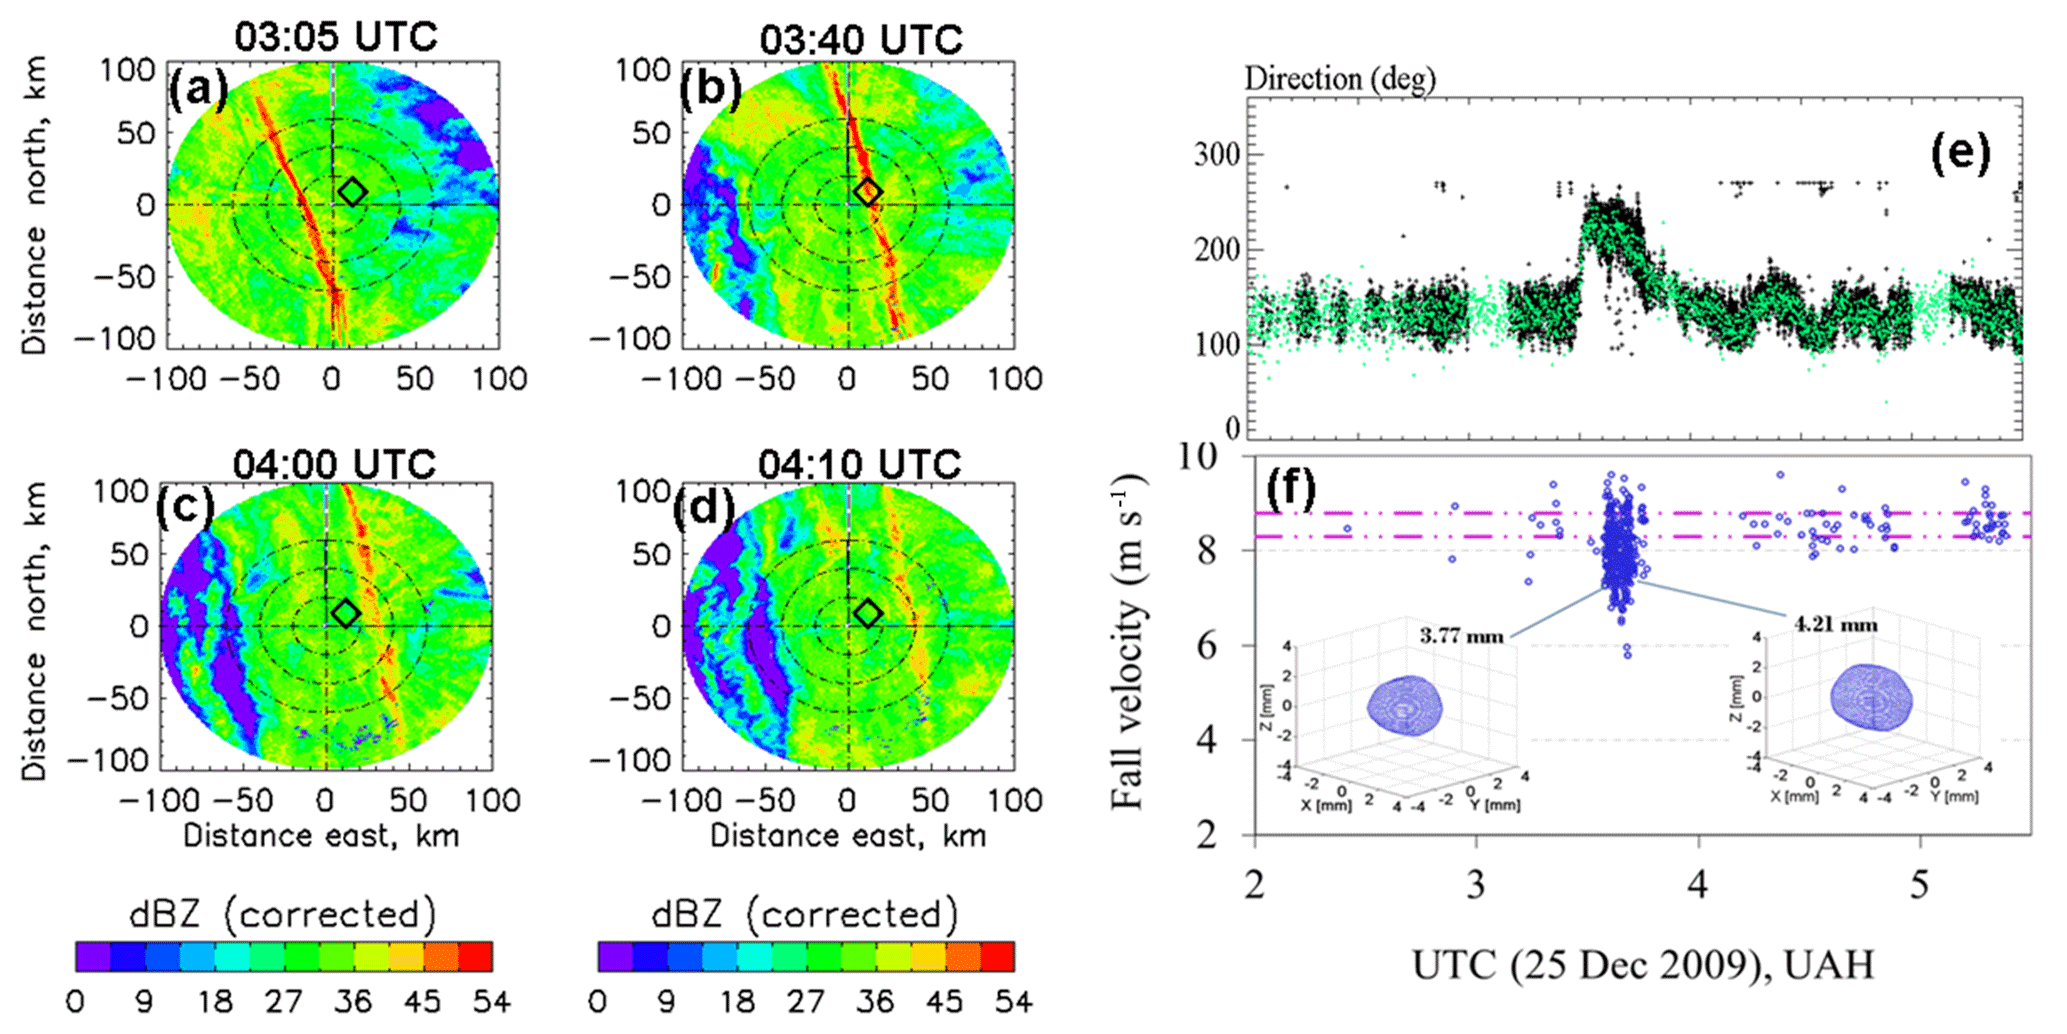
Figure 1(a–d) show the attenuation corrected radar reflectivity from the C-band ARMOR radar at four time periods during the 25 December 2009 event; (e) Wind direction with UTC from the 10 m height wind sensor measurements (grey) and the 2DVD-based estimates of drop horizontal velocity direction of all moderate-to-large drops with rotational symmetry axis (black points); (f) fall velocities of 4±0.25 mm drops with UTC (blue points) and the expected (i.e., fit to Gunn-Kinzer laboratory data) fall velocity range as dashed purple lines, and two examples of reconstructed asymmetric drops are shown as insets.
Since then, drop shapes and fall velocities measurements have been made in numerous locations around the globe (Thurai and Bringi, 2008). They range from measurements at sea level (e.g. Okinawa, Japan) to 1.4 km above sea level (Greeley, Colorado). In vast majority of the cases, drop shape measurements show that they largely conform to “intrinsic” low amplitude axisymmetric oscillations that can be maintained against viscous dissipation, and the velocity measurements show good agreement with the Gunn-Kinzer variation, with altitude adjustments in the appropriate cases. However, there have been very few studies of shapes and fall speeds in windy conditions (i.e., turbulence) (e.g., Tokay and Beard, 1996; Bringi et al., 2018; Montero-Martinez and Garcia-Garcia, 2016; Stout et al., 1995) and the possible coupling between the two.
In this paper, we present two events as illustrative examples which had turbulence (wind-induced or shear-induced) associated with the events, and which showed deviations from the most probable drop shapes and reduced fall velocities. The first of the two events was a widespread event with highly-organized embedded line convection and the second corresponds to outer bands of hurricane Irma. In all cases, 10 m height wind-sensor data were also recorded at the instrument site in Huntsville, Alabama, USA.
2.1 Event on 25 December 2009
This was a widespread rain event which had a highly-organized embedded line convection that traversed the instrument site. A detailed description of the event can be seen in Thurai et al. (2013). There were two 2DVD instruments, side-by-side, which had recorded fall velocity, size, and shape measurements during the entire event.
Figure 1a–d show a set of plan position indicator (PPI) scans from the nearby C-band polarimetric radar, ARMOR (Petersen et al., 2007), which made routine observations during this event. These scans (which were part of volume scans) were taken at 1.3∘ elevation, at 03:05, 03:40, 04:00, and 04:10 UTC respectively. The colour scale represents the (attenuation-corrected) radar reflectivity. The line convection can be seen to move in a north-easterly direction; at 03:40 UTC, it lies directly over the instrument site, marked as black diamond. The radial velocity from the ARMOR radar (not presented here) had clearly shown that a narrow convergence zone at the leading edge of the convection line was present near the 2DVD site (see Fig. 8 of Thurai et al., 2013).
Table 1Mean, standard deviation, and the skewness of the histograms of these fall velocities for various time periods corresponding to Fig. 1, namely, (i) prior to 03:30 UTC, (ii) 03:30–03:35 UTC, (iii) 03:35–03:40 UTC, (iv) 03:40–03:45 UTC, and (v) after 03:45 UTC. Also shown are the total numbers of the 4 mm drops during these time intervals.
The green-points in panel (e) of Fig. 1 show the wind-direction from the 10 m wind-sensor between 02:00 and 05:30 UTC. The sudden change in wind-direction during the passage of the line-convection can be seen between ∼03:35 and 03:45 UTC. Panel (f) shows the fall velocity measurements for all drops with equi-volumetric drop diameter in the 4.0–4.2 mm range (blue points) from one of the 2DVDs. The expected range of fall velocities are shown as dashed purple lines. The significant reduction in the fall velocity at the time of the line convection can be seen clearly. To quantify the extent of deviation, Table 1 shows the mean, standard deviation, and the skewness of the histograms of these fall velocities for various time periods, namely, (i) prior to 03:30 UTC, (ii) 03:30–03:35 UTC, (iii) 03:35–03:40 UTC, (iv) 03:40–03:45 UTC, and (v) after 03:45 UTC. Also shown are the total numbers of the 4 mm drops during these time intervals. Most of these drops were detected during the 03:30–03:40 UTC interval, and in particular, during the 03:35–03:40 period (which corresponds to a period soon after a sharp change in the wind direction was observed), negative skewness is seen whose magnitude is much higher than other time periods. Also to note is the reduced mean values during 03:30–03:45 UTC.
The inset pictures show two examples of drop shapes reconstructed from the two orthogonal camera images after correcting for drop horizontal velocity (Schönhuber et al., 2016). These horizontal velocity directions, determined for all moderate-to-large drops with axis of rotational symmetry, are shown as black points in panel (e). Excellent agreement is seen between the 2DVD-based drop horizontal velocity direction and the 10 m wind sensor measurements.
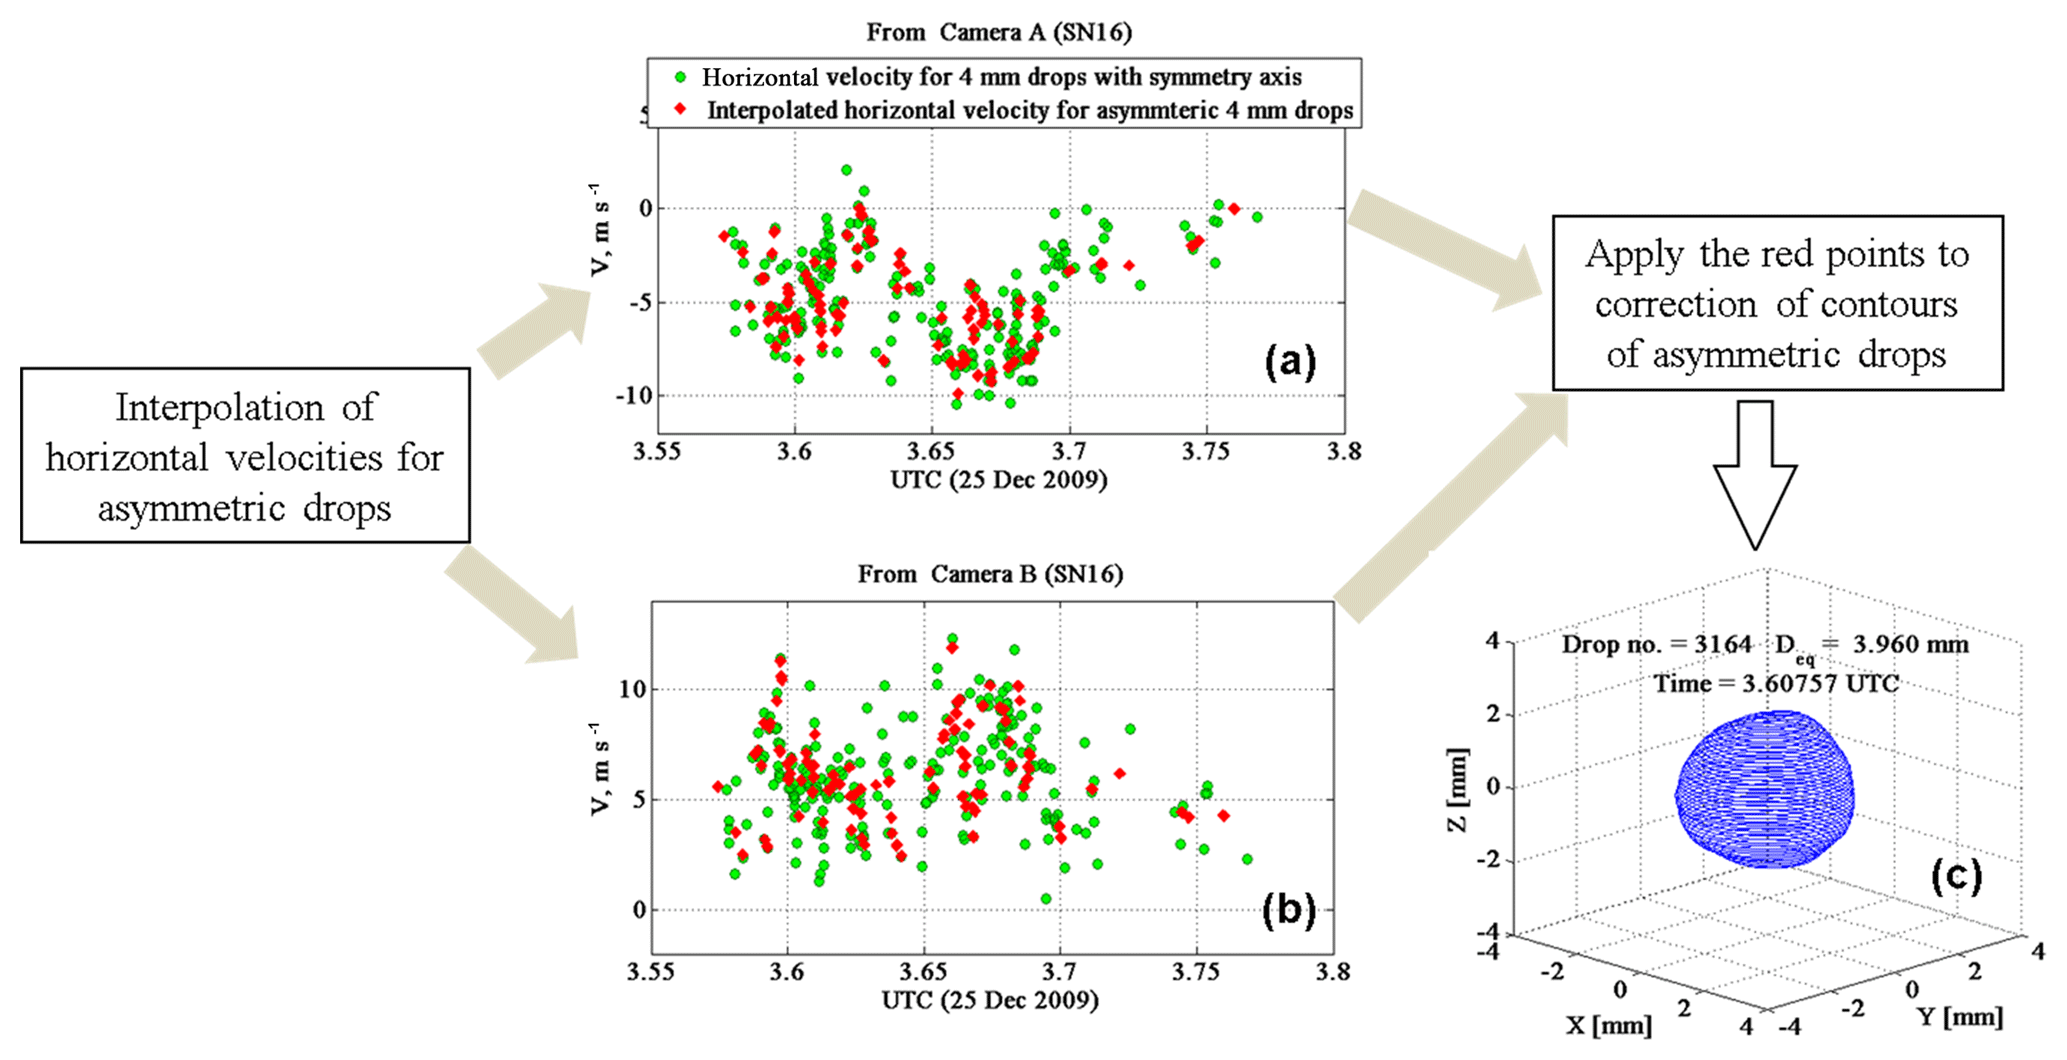
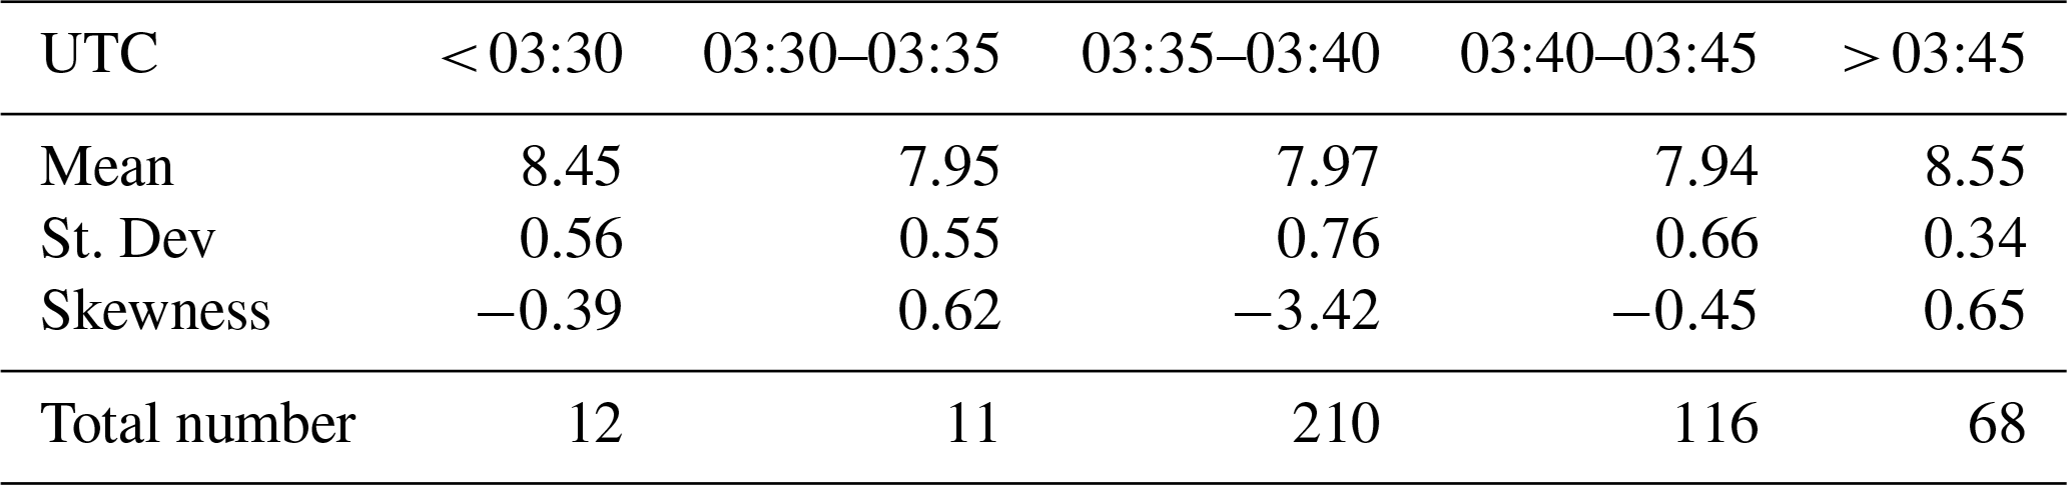
Figure 2(a) Drop horizontal velocities of all symmetric drops (red) derived from camera A measurements and the time interpolated velocities for the asymmetric drops (green); (b) same as (a) except for camera B; (c) an example of a large asymmetric drop reconstructed from the camera A and B contoured images after correcting for the drop horizontal velocity components.
The reconstruction of the asymmetric drops from the two images from the two line scan cameras have been described in detail by Schönhuber et al. (2016) and Schwinzerl et al. (2016). The procedure first derives the horizontal velocities (from both 2DVD cameras) for all moderate-to-large drops which possess rotational symmetry axis and for which the 2DVD data processing software can determine those velocities (magnitude and direction). This set of values is then interpolated in time for the asymmetric drops. Panels (a) and (b) of Fig. 2 show the horizontal velocities derived for the symmetric drops (green points) and the time interpolated velocities for the asymmetric drops (red points) from the two line scan cameras. The velocity vectors so derived are then used for correcting the recorded contours in the x–z and the y–z planes for each individual drop, and the corrected contours are subsequently used to construct the corresponding 3-D shapes, an example of which is shown in panel (c). Note Fig. 2 corresponds to the rain drops recorded during the passage of the line convection over the 2DVD site.
Between 03:30 and 03:40 UTC, around 35 % of the moderate-to-large drops (D > 2 mm) did not possess an axis of symmetry. This percentage (∼35 %) is substantially higher than most other rain events, often associated with very little or no turbulence. The shapes fluctuations often associated with mixed mode, large amplitude drop oscillations clearly correspond to the change in wind direction (shear-induced turbulence) and a resulting reduction in drop fall velocities. The reduced fall velocities shown in Fig. 1f are also seen for a substantial percentage of large drops (D > 4 mm) during the same time period (not shown here).
2.2 Outer bands of hurricane Irma
On 12 September 2017, 2DVD measurements were made during strong wind/gust conditions associated with the outer bands of hurricane Irma (category-1 in Huntsville). Panel (a) of Fig. 3 shows the radar mosaic map of the Irma outer bands at 00:55 UTC. The instrument site is marked with an arrow.
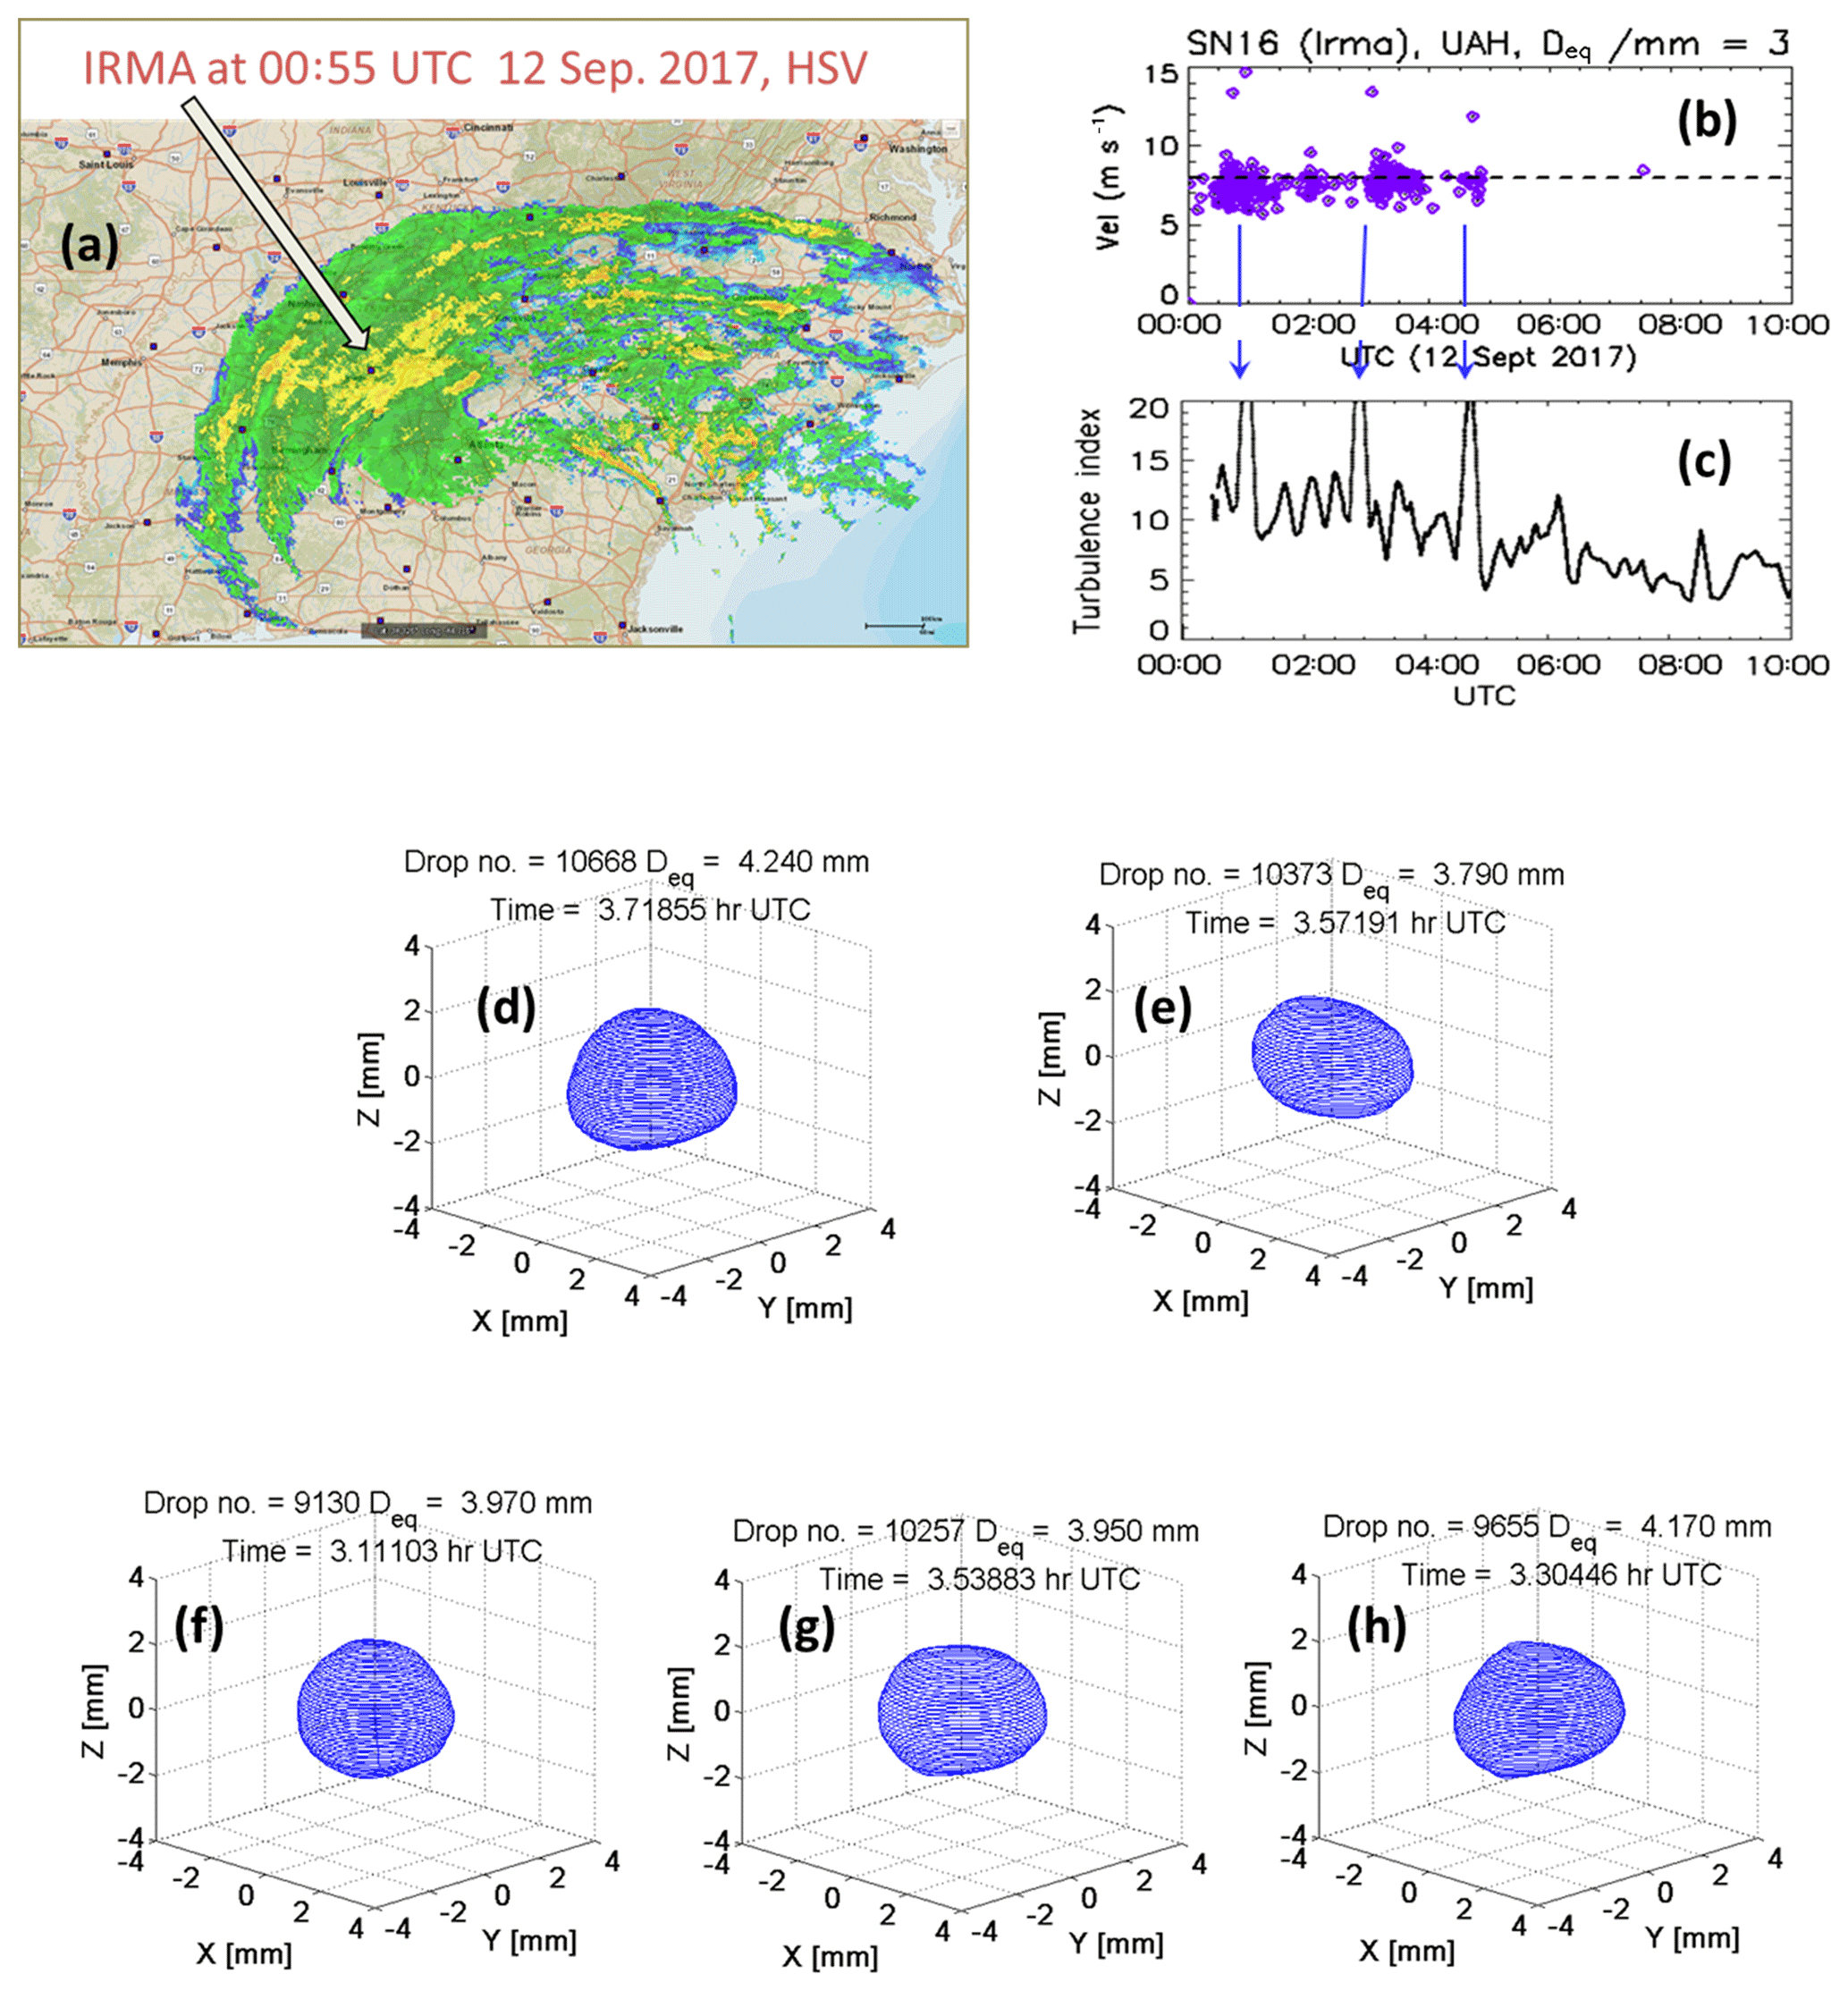
Figure 3(a) Composite radar reflectivity image of Category-1 Hurricane Irma over Huntsville at 00:55 UTC on 12 September 2017. The arrow marks the instrument site; (b) fall velocities of 3 mm drops as UTC; (c) turbulence index, E, determined from the wind-sensor data (the blue arrows connect high E values with reduced fall velocities; (d) to (h) show examples of 4 mm (±0.25 mm) drops undergoing mixed-mode, asymmetric drop oscillations.
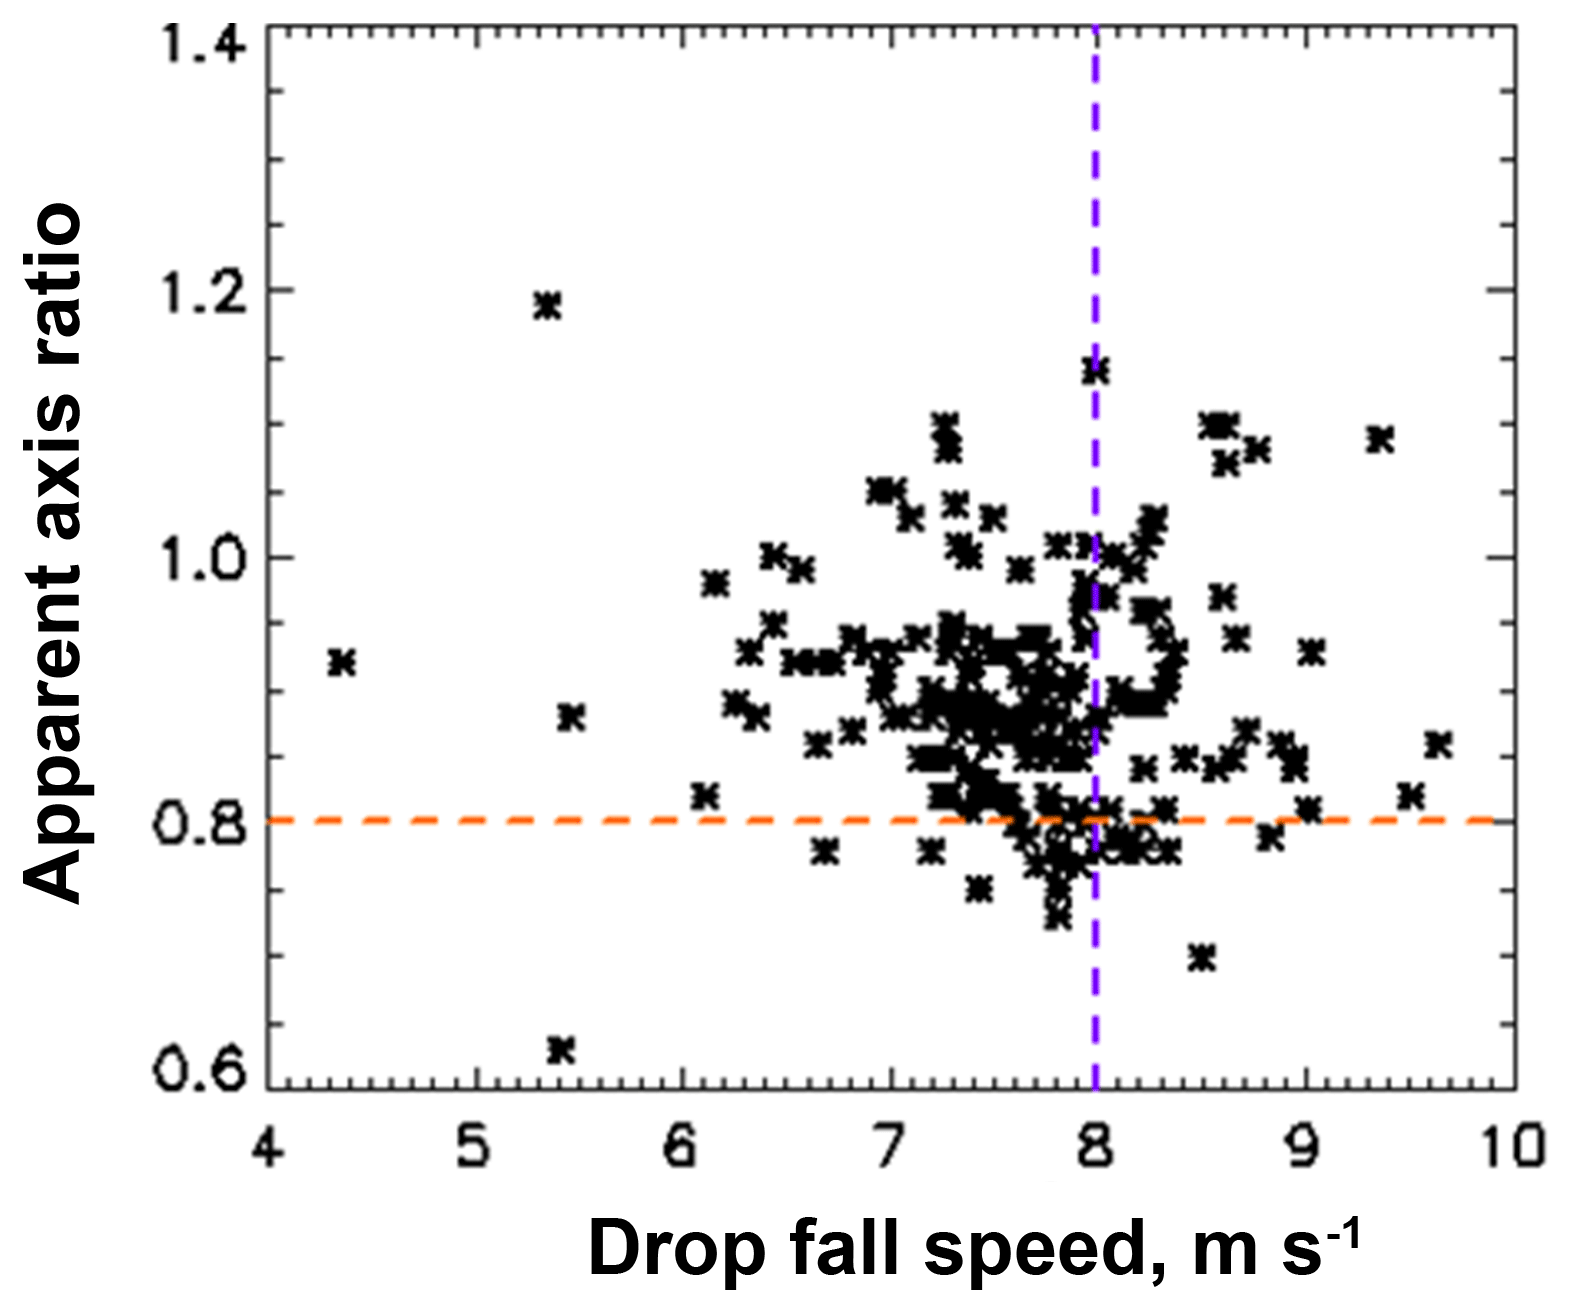
Figure 4Variation of drop fall speeds with apparent axis ratios for the 3 mm drops corresponding to Fig. 3b. Shown in dotted purple and red lines are the expected fall speed and axis ratio.
Panel (b) of Fig. 3 shows the fall velocities of all drops with Deq in the range 3±0.1 mm for the time period from 00:00–10:00 UTC on 12 September 2017. The dashed line shows the expected value for this diameter range. Panel (c) shows the “turbulence index” (E) derived from the 10 m height wind sensor data. This is estimated using the gusts and the average wind speeds from successive 5 min intervals, using the approach described in Garrett and Yuter (2014). The peaks in the index values correspond to the time periods where ∼20 % of the 3 mm drops show lower than the expected fall speeds value i.e., deviating from Gunn-Kinzer terminal fall speeds. (Note the data in Fig. 1f is from a highly convective line with large drops; on the other hand, data from the outer bands of hurricanes are well-known to contain larger concentrations of smaller drops relative to continental convective storms. Hence, we used smaller drops in Fig. 3b.)
Panels (d) to (h) show examples of asymmetric drop shapes reconstructed using the abovementioned procedure. They correspond to time periods associated with high turbulence intensity periods and indicate asymmetric drop oscillations. Such asymmetric oscillations occur in a background state of the more dominant steady state axisymmetric oscillations. The time periods also (once again) correlate with significant fraction of drops with sub-terminal fall speeds.
Bringi et al. (2018) have related the mean fall speeds with turbulence (see for example, panel (e) of their Fig. 5) and found that lower fall speeds were associated with high turbulence index values. To highlight the effect of turbulence on drop shapes, we show in Fig. 4 the variation of drop fall speeds with apparent axis ratios for the 3 mm drops. Shown in dotted purple and red lines are the expected fall speed and axis ratio. The drops with higher deviation from the expected fall speed can be seen to have higher deviation from the expected axis ratio, in fact tending towards more spherical shapes. Hence one can conclude that the turbulence index also affects extent of deviation of drops from their most probable (or equilibrium-like) shapes.
Measurements of the terminal fall speed of drops by Gunn and Kinzer (1949) under calm laboratory conditions with pressure correction of Beard (1976) has been the “gold” standard since 1949. More recently, Bringi et al. (2018) using an optical array probe and 2DVD reported that under calm conditions the fall speeds of raindrops from 0.1 mm and larger were in excellent agreement with Gunn-Kinzer laboratory data (Foote and du Toit, 1969). However, under windy conditions they found significant “slowing” down of the mean fall speeds (relative to Gunn-Kinzer) along with a significant broadening of the distribution. Such “slowing down” was illustrated for an event which occurred on 30 November 2016 in Huntsville during passage of a supercell and several squall lines with high winds/gusts and E values of 7–8 m2 s−2 for the supercell and 2–4 m2 s−2 for the squall lines (peak rain rates of 80 mm h−1). These results, together with those presented here are also supported by previous study by Montero-Martinez and Garcia-Garcia (2016) who reported “sub-terminal” fall speeds for mm-sized drops under windy conditions.
Stout et al. (1995) simulated the motion of drops in isotropic turbulence and determined that there would be a significant reduction of the average drop settling velocity (relative to terminal velocity) of greater than 35 % for drops around 2 mm size when the ratio of rms velocity fluctuations (due to turbulence) relative to drop terminal velocity is around 0.8. It was found that relative motion between the drop and the air velocity vector gives rise to non-linear drag forces that have a net upward component that slows down the drop. Whereas we did not have a direct measure of the rms velocity fluctuations, the proxy for turbulence intensity (E) related to wind gusts during supercell passage (very large E) clearly indicated a significant reduction in mean fall speeds of 25 %–30 % relative to terminal speed for 1.3 and 2 mm sizes with significant broadening of the fall speed distributions relative to calm conditions. Here we define E as E= (gusts − average wind)2∕2.
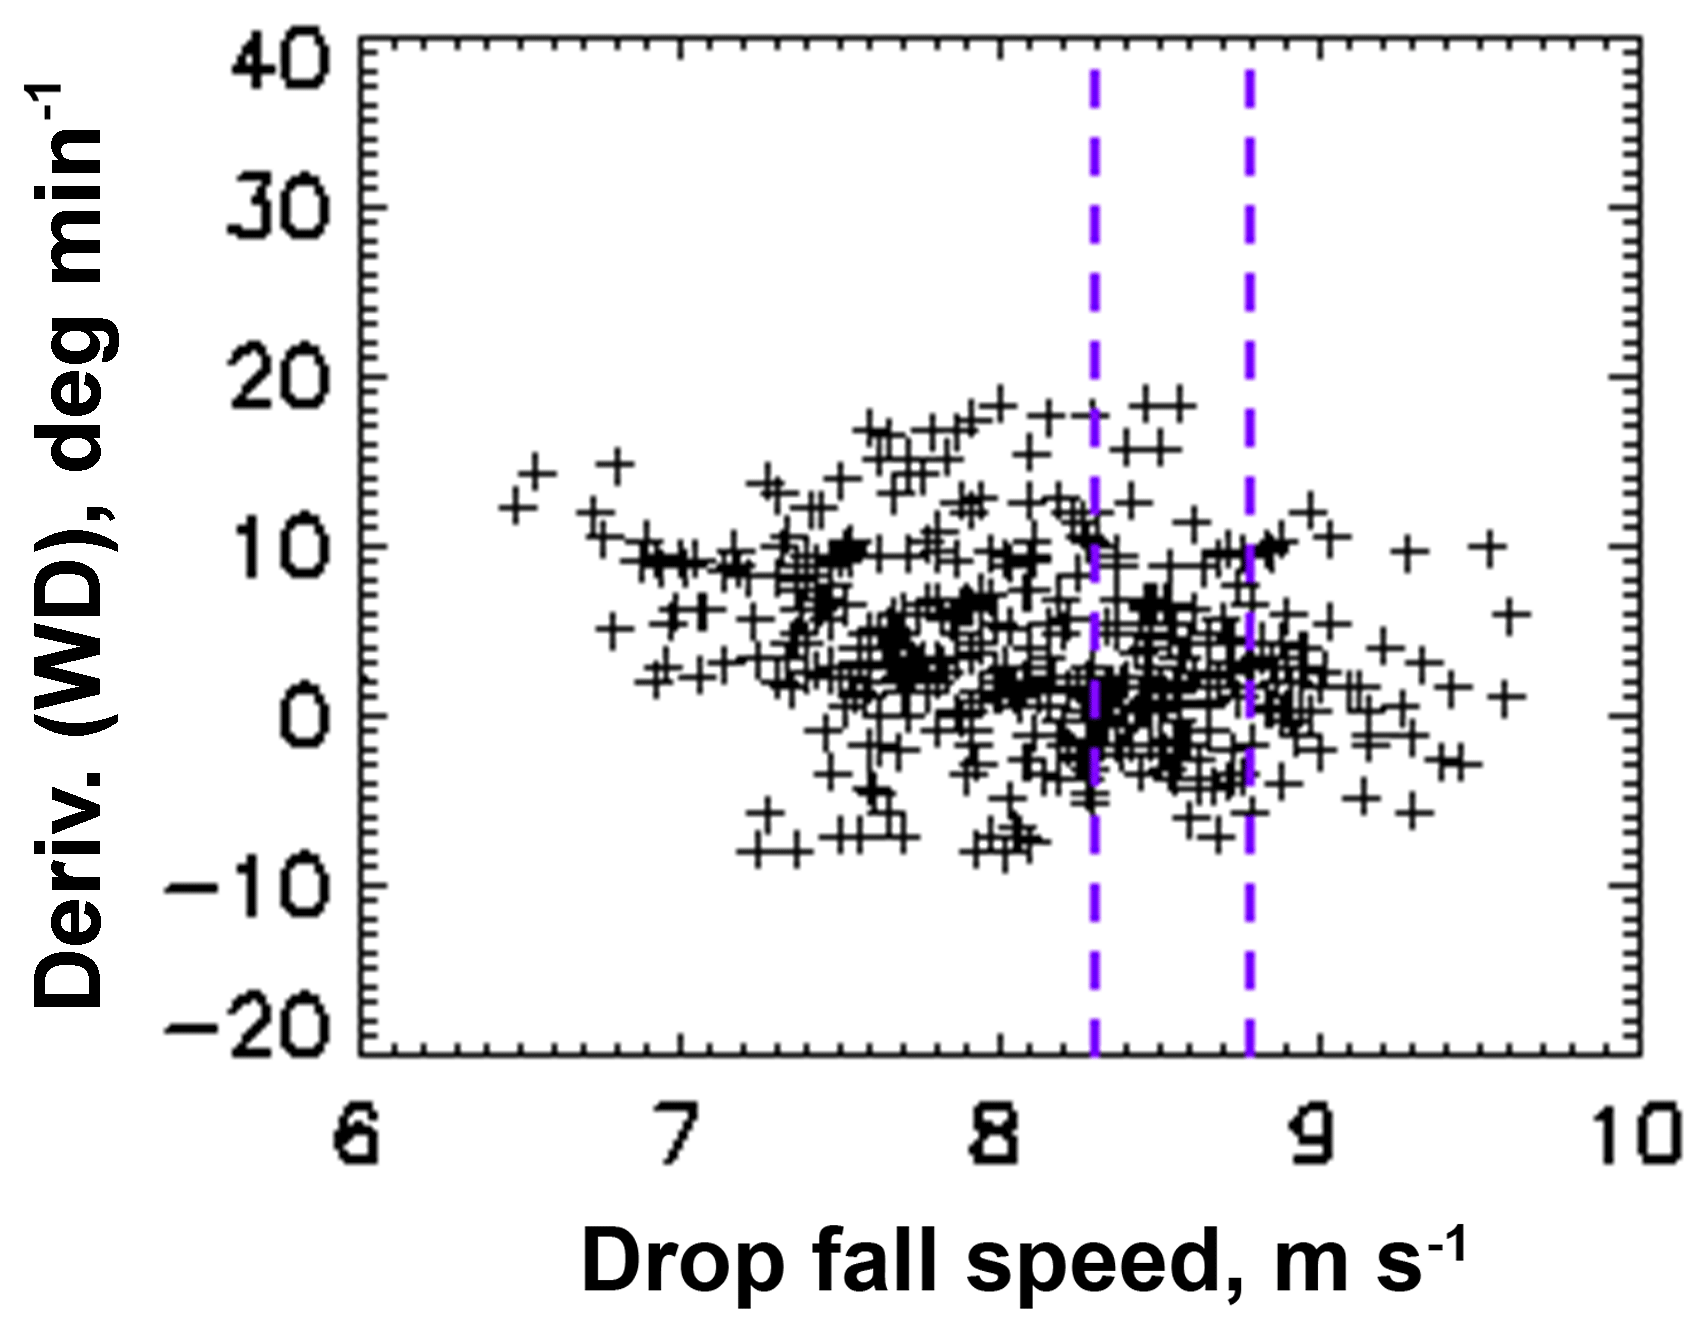
Figure 5Rate of change of wind direction from the wind sensor for the 25 December 2009 event (Fig. 1) versus the 3.75–4.25 mm drop fall speeds from the 2DVD. The purple dashed lines represent the expected fall speed range of drop fall speeds.
Several of our event analyses have shown that very strong gusts, directional wind shifts (i.e. shear) and/or inferred high turbulence intensity are correlated with significant broadening of the fall speed distributions with negative skewness. The mean fall speeds were found to decrease almost linearly with increasing turbulent intensity reaching values as low as 25 %–30 % less than the expected values, i.e. sub-terminal fall speeds. To illustrate the relation between shear on one hand and the deviation from the terminal fall velocity on the other, Fig. 5 shows the rate of change of wind direction (δD) from the wind sensor for the 25 December 2009 event (Fig. 1) versus the 3.75–4.25 mm drop fall speeds. The purple dashed lines represent the expected fall speeds. Within this region, δD appears to be close to 0∘ min−1. Below this region, the drops tend to show more reduced fall speeds with increasing δD.
The following points summarize our study thus far:
-
In vast majority of the cases, 2DVD drop shape measurements show that they largely conform to low amplitude axisymmetric oscillations, and the velocity measurements show good agreement with the G−K variation, with altitude adjustments in the appropriate cases.
-
There have been notable exceptions. In such cases, 10 m height wind sensor data were used to derive proxy-indicators for turbulent intensities. Our results for Deq > 2 mm clearly show that very strong gusts, directional wind shifts (i.e. shear) and/or inferred high turbulence intensity are correlated with reduced fall speeds, reaching values ∼25 %–30 % less than the expected values, i.e. sub-terminal fall speeds.
-
Drop horizontal velocities (magnitude and direction) derived from the 2DVD measurements show remarkable agreement with the 10 m wind sensor measurements.
-
Significant percentage (20 %–35 %) of asymmetric drops (> 2 mm) deviating from the most probable axisymmetric shapes were also detected for some events with high turbulent intensities.
There are potentially other causes for asymmetric shapes and slowing down of fall velocity even under calm conditions. For example, in heavier rain rates drop collisions can cause asymmetric shapes (due to multi-mode oscillations) which dampen quickly consistent with viscous dissipation and the shape reverts back to the steady state (axisymmetric) mode (Szakáll et al., 2014). Another possibility for slowing down of fall velocity could be attributed to partially melting graupel/hail (due to lower “effective” density). This is discounted for the hurricane Irma event which had a distinct bright-band at a height near 4 km allowing for complete melting to take place in the humid sub-cloud environment. For the intense line convection the drops likely originated as graupel/hail aloft (around −10 ∘C) with warm rain processes in the leading edge of the convection. The vertical profiles of dual-polarization radar data did not indicate partial melting ice (which “effective” near the surface so slowing down due to this effect can also be discounted.
Over the past decades the understanding and interpretation of polarimetric weather radar observations has continuously been enhanced by a wealth of research work. Still, noticeable differences to ground truth are sometimes observed. Especially for near-to-ground radar measurements our results provide a further contribution and enhancement, being based on new findings on precipitation microstructure.
The 2DVD data can be made available via email request to any of the co-authors: merhala@colostate.edu, michael.schoenhuber@joanneum.at, bringi@colostate.edu, guenter.lammer@joanneum.at. The radar data can be made available by contacting the corresponding author.
Software development for the reconstruction of drops from 2DVD data, MS and GL. Data analyses, MT, VNB, MS. Writing-Original Draft Preparation, MT, MS. Writing-Review and Editing, VNB.
The authors declare that they have no conflict of interest.
This article is part of the special issue “18th EMS Annual Meeting: European Conference for Applied Meteorology and Climatology 2018”. It is a result of the EMS Annual Meeting: European Conference for Applied Meteorology and Climatology 2018, Budapest, Hungary, 3–7 September 2018.
We would like to thank Patrick Gatlin (NASA/MSFC) and Matt Wingo (University of Alabama, Huntsville) for their support in maintaining the 2D video disdrometers and enabling access to data from other instruments used in this paper. We also would like to thank the reviewers for their very helpful comments.
This research has been supported by the National Science Foundation, Directorate for Geosciences (grant no. AGS-1431127).
This paper was edited by Fred C. Bosveld and reviewed by Miklós Szakáll and Hidde Leijnse.
Beard, K. V.: Terminal velocity and shape of cloud and precipitation drops aloft, J. Atmos. Sci., 33, 851–864, https://doi.org/10.1175/1520-0469(1976)033<0851:TVASOC>2.0.CO;2, 1976.
Beard, K. V., Bringi, V. N., and Thurai, M.: A new understanding of raindrop shape, Atmos. Res., 97, 396–415, https://doi.org/10.1016/j.atmosres.2010.02.001, 2010.
Bringi, V., Thurai, M., and Baumgardner, D.: Raindrop fall velocities from an optical array probe and 2-D video disdrometer, Atmos. Meas. Tech., 11, 1377–1384, https://doi.org/10.5194/amt-11-1377-2018, 2018.
Fernández-Raga, M., Palencia, C. Keesstra, S., Jordán, A., Fraile, R., Angulo-Martínez, M., and Cerdà, A..: Splash erosion: A review with unanswered questions, Earth-Sci. Rev., 171, 463–477, https://doi.org/10.1016/j.earscirev.2017.06.009, 2017.
Foote, G. B. and Du Toit, P. S.: Terminal velocity of raindrops aloft, J. Appl. Meteor., 8, 249–253, https://doi.org/10.1175/1520-0450(1969)008<0249:TVORA>2.0.CO;2, 1969.
Garrett, T. J. and Yuter, S. E.: Observed influence of riming, temperature, and turbulence on the fallspeed of solid precipitation, Geophys. Res. Lett., 41, 6515–6522, https://doi.org/10.1002/2014GL061016, 2014.
Gunn, R. and Kinzer, G. D.: The terminal velocity of fall for water droplets in stagnant air, J. Meteorol., 6, 243–248, https://doi.org/10.1175/1520-0469(1949)006<0243:TTVOFF>2.0.CO;2, 1949.
Montero-Martinez, G. and Garcia-Garcia, F.: On the behavior of raindrop fall speed due to wind, Q. J. Roy. Meteor. Soc., 142, 2794, https://doi.org/10.1002/qj.2794, 2016.
Petersen, W. A., Knupp, K. R., Cecil, D. J., and Mecikalski, J. R.: The University of Alabama Huntsville THOR Center instrumentation: Research and operational collaboration, Preprints, 33rd Int. Conf. on Radar Meteorology, Cairns, Australia, Amer. Meteor. Soc., 5.1, available at: https://ams.confex.com/ams/33Radar/webprogram/Paper123410.html (last access: : 6 June 2019), 2007.
Schönhuber, M., Lammer, G., and Randeu, W. L.: One decade of imaging precipitation measurement by 2D-video-distrometer, Adv. Geosci., 10, 85–90, https://doi.org/10.5194/adgeo-10-85-2007, 2007.
Schönhuber, M., Lammar, G., and Randeu, W. L.: The 2-D-videodistrometer, in: Precipitation: Advances in Measurement, Estimation and Prediction, edited by: Michaelides, S. C., Springer, Berlin, Heidelberg, Germany, 3–31, 2008.
Schönhuber, M., Schwinzerl, M., and Lammer, G.: 3D reconstruction of 2DVD-measured raindrops for precise prediction of propagation parameters, 2016 10th European Conference on Antennas and Propagation (EuCAP), IEEE, 3403–3406, https://doi.org/10.1109/EuCAP.2016.7481929, 2016.
Schwinzerl, M., Schönhuber, M., Lammer, G., and Thurai, M.: 3D reconstruction of individual raindrops from precise ground-based precipitation measurements. Extended Abstracts, 16th EMS Annual Meeting/11th European Conf. on Applied Climatology, Trieste, Italy, European Meteorological Society, EMS2016-601, available at: http://meetingorganizer.copernicus.org/EMS2016/EMS2016-601.pdf (last access: 6 June 2019), 2016.
Stout, J. E., Arya, S. P., and Genikhovich, E. L.: The effect of nonlinear drag on the motion and settling velocity of heavy particles, J. Atmos. Sci., 52, 3836–3848, https://doi.org/10.1175/1520-0469(1995)052<3836:TEONDO>2.0.CO;2, 1995.
Szakáll, M., Mitra, S. K., Diehl, K., and Borrmann, S.: Shapes and oscillations of falling raindrops – A review, Atmos. Res., 97, 416–425, https://doi.org/10.1016/j.atmosres.2010.03.024, 2010.
Szakáll, M., Kessler, S., Diehl, K., Mitra, S. K., and Borrmann, S.: A wind tunnel study of the effects of collision processes on the shape and oscillation for moderate-size raindrops, Atmos. Res., 142, 67–78, https://doi.org/10.1016/j.atmosres.2013.09.005, 2014.
Thurai, M. and Bringi, V. N.: Drop Axis Ratios from a 2D Video Disdrometer, J. Atmos. Oceanic Technol., 22, 966–978, https://doi.org/10.1175/JTECH1767.1, 2005.
Thurai, M., Huang, G. J., Bringi, V. N., Randeu, W. L., and Schönhuber, M.: Drop shapes, model comparisons, and calculations of polarimetric radar parameters in rain, J. Atmos. Oceanic Technol., 24, 1019–1032, https://doi.org/10.1175/JTECH2051.1, 2007.
Thurai, M. and Bringi, V. N.: Polarimetric radar and advanced disdrometers, in: Precipitation: Advances in Measurement, Estimation and Prediction, edited by: Michaelides, S. C., Springer, Berlin, Heidelberg, Germany, 3–31, 2008.
Thurai, M., Bringi, V. N., Petersen, W. A., and Gatlin, P. N.: Drop shapes and fall speeds in rain: Two contrasting examples, J. Appl. Meteor. Climatol., 52, 2567–2581, https://doi.org/10.1175/JAMC-D-12-085.1, 2013.
Tokay, A. and Beard, K. V.: A field study of raindrop oscillations. Part I: Observation of size spectra and evaluation of oscillation causes, J. Appl. Meteor., 35, 1671–1687, https://doi.org/10.1175/1520-0450(1996)035<1671:AFSORO>2.0.CO;2, 1996.