 | 31 Oct 2020
Assessing groundwater irrigation sustainability in the Euro-Mediterranean region with an integrated agro-hydrologic model
Emiliano Gelati
Zuzanna Zajac
Andrej Ceglar
Simona Bassu
Bernard Bisselink
Marko Adamovic
Jeroen Bernhard
Anna Malagó
Marco Pastori
Fayçal Bouraoui
Ad de Roo
We assess the sustainability of groundwater irrigation in the Euro-Mediterranean region. After analysing the available data on groundwater irrigation, we identify areas where irrigation causes groundwater depletion. To prevent the latter, we experiment with guidelines to restrict groundwater irrigation to sustainable levels, simulating beneficial and detrimental impacts in terms of improved environmental flow conditions and crop yield losses. To carry out these analyses, we apply the integrated model of water resources, irrigation and crop production LISFLOOD-EPIC. Crop growth is simulated accounting for atmospheric conditions and abiotic stress factors, including transpiration deficit. Four irrigation methods are modelled: drip, sprinkler, and intermittent and permanent flooding. Hydrologic and agricultural modules are dynamically coupled at the daily time scale through soil moisture, plant water uptake, and irrigation water abstraction and application. Water abstractions of other sectors are simulated based on requirement data. Water may be withdrawn from groundwater, rivers, lakes and reservoirs. As groundwater is abstracted to buffer the effects of drought, we use groundwater depletion to detect unsustainable water exploitation. We characterise reported data of annual groundwater abstractions for irrigation available at country and sub-national levels. Country data are the most complete, but their spatial resolution is often coarse. While the resolution of sub-national data is finer, their coverage is heterogeneous. Simulated and reported irrigation groundwater abstractions compare well in several areas, particularly in France, while some structural discrepancies emerge: simulated values tend to be larger than those reported, especially in southern Spain; and simulated inter-annual variability is significantly smaller than reported in some areas, most remarkably in Turkey. Potential causes of these discrepancies are simplified model assumptions influencing irrigation frequency and amounts; lack of high temporal and spatial resolution data on irrigated areas, and irrigation technologies and distribution; and possible unreported abstractions in areas where groundwater irrigation is significant. We identify areas undergoing groundwater depletion from model simulations. In the southern Iberian Peninsula, Greece, Middle East and northern Africa, most simulated depletion is caused by irrigation. In other Mediterranean areas, depletion is caused by all sectors combined. From well measurements of groundwater table depth in Spain, we find statistically significant decline rates affecting large areas of the south, thus in agreement with the model, but also areas in the north-eastern and central parts where model estimates detect no depletion. The comparison of model- and well-based depletion rates is limited by spatial scale differences and groundwater model assumptions, for which we suggest potential research directions. We design rules restricting irrigation groundwater abstraction to prevent groundwater depletion and minimise severe irrigation shortages. We optimise them and simulate their effects in the southern Iberian Peninsula. Irrigation restrictions cause crop yield reductions in groundwater-dependent irrigated areas, particularly in the Algarve and Segura river basin districts. At the same time, they positively impact environmental flows. This study shows the potential of integrated agro-hydrologic modelling for detecting water resources over-exploitation and exploring trade-offs between crop production, sustainable irrigation and ecosystem support.
- Article
(15281 KB) - Full-text XML
-
Supplement
(1335 KB) - BibTeX
- EndNote


Freshwater availability is put under increasing pressure by global warming, land use changes, and water abstractions (IPCC, 2019). Large alterations of continental water storages and flows already occur in (semi-)arid regions where irrigation is the main water use (Döll et al., 2009, 2012, 2016; Siebert et al., 2010; Famiglietti, 2014; Long et al., 2017).
Changes in the water cycle, increasing food demand, soil degradation, and the use of agricultural land for urban development and bio-fuel production pose the challenge of adapting agriculture to achieve food security within planetary boundaries, among which water limitation is crucial (Rockström et al., 2009; Rockström and Karlberg, 2010; Falkenmark, 2013; Elliott et al., 2014; Hunter et al., 2017). Therefore, we investigate here to which extent irrigation can be sustainably applied, and which crop production levels can be achieved under sustainable water abstraction conditions.
Irrigation accounts for 70 % of water withdrawals and 90 % of consumptive water use globally (Shiklomanov, 2000; Molden et al., 2007; IAASTD, 2009). These figures reflect the growth of irrigated agriculture during the XX century: areas equipped for irrigation have more than quadrupled (Siebert et al., 2015), while irrigation water use has more than doubled (IPCC, 2019). In the future, freshwater allocation to agriculture may be further constrained by the compounding effects of global warming and increasing requirements by other sectors (Haddeland et al., 2006, 2014; Molden et al., 2007; Rosegrant et al., 2009; Chartres and Sood, 2013). However, unsustainable groundwater abstraction for irrigation – including the mining of fossil aquifers – is already taking place in several regions, leading to long-term water storage depletions (Konikow and Kendy, 2005; Scanlon et al., 2007; Siebert et al., 2010; Wada et al., 2012; Dalin et al., 2019). Groundwater has been increasingly used to expand irrigated agriculture, especially since the 1970s decline in the availability of sites for building new dams, which had been the main source of irrigation development until then (Brown, 2012). In 2010, Siebert et al. estimated that 43 % of global consumptive water use for irrigation was drawn from groundwater.
Groundwater is used to buffer drought impacts in (semi-)arid regions, due to its generally larger reliability and availability compared to surface water (Garrido et al., 2006; Siebert et al., 2010; Dalin et al., 2019). Therefore, surface water scarcity during dry periods may lead to groundwater depletion, exhausting or making aquifers not economic to exploit. Irrigated agriculture based on unsustainable groundwater use may not guarantee current levels of crop production in the long term, potentially threatening future food security (Seckler et al., 1999; Moench et al., 2003; Giordano, 2009; Garduño and Foster, 2010; Brown, 2012). Moreover, groundwater depletion may trigger intertwined positive feedback mechanisms that reduce freshwater availability even further: decrease of streamflow, reduction in capillary rise from groundwater and therefore in soil moisture, loss of springs and wetlands, ecosystem damage, land subsidence, sea level rise, and salt-water intrusion in coastal aquifers (Levine and Salvucci, 1999; Llamas and Custodio, 2002; Konikow and Kendy, 2005; Pokhrel et al., 2012; Gleeson and Richter, 2018; Rodell et al., 2018; de Graaf et al., 2019). At the same time, projected growth in population, economy, agricultural land use, and drought intensity and frequency may increase groundwater demand even further (Taylor et al., 2012).
In the Euro-Mediterranean region, global warming is progressively increasing frequency, intensity, duration and extent of droughts (Planton et al., 2012; Lehner et al., 2017; Samaniego et al., 2018; Bisselink et al., 2018b). The Mediterranean basin has been identified as a “climate change hot spot”, with projected drier summer seasons due to the increasing gap between potential evapotranspiration and precipitation (Giorgi, 2006; Greve et al., 2018). This drying trend is likely to be worsened by ecosystem degradation caused by human land management (Guiot and Cramer, 2016). According to AQUASTAT data (FAO, 2020), agriculture accounts for over 60 % of water withdrawals in several Mediterranean countries (Algeria, Cyprus, Egypt, Greece, Iraq, Israel, Libya, Morocco, Portugal, Spain, Syria, Tunisia, Turkey). Regional adaptation of irrigated agriculture and water management may become necessary in light of the projected water scarcity increases (García-Ruiz et al., 2011; Daccache et al., 2014; Fader et al., 2016; Malek and Verburg, 2017).
Climate change and growth of human activities are interlinked challenges to water and food systems, whose security will require improving water resources management and allocation (Rodell et al., 2018). Design of adequate actions should be informed by integrated models that can represent the dynamic interactions between climate, water resources and human activities, including crop growth (Gleeson et al., 2012; Dalin et al., 2019).
Reported statistics on irrigation water abstraction and consumption are generally based on rough assumptions on crop water requirements and are available at coarse spatial and temporal resolutions (Döll and Siebert, 2002; Döll et al., 2016). Therefore, integrated water resources models can be useful not only to project future trends, but also to complement historical records (Hejazi et al., 2014; Huang et al., 2018).
We present a large-scale assessment of irrigation sustainability, using groundwater depletion as marker of water resources overdraft, and of the potential agro-hydrologic effects of regulating groundwater abstractions. We apply the integrated model LISFLOOD-EPIC (Gelati et al., 2020) that simulates dynamically hydrology, crop growth and irrigation, accounting for water abstractions for household, livestock, industry and energy sectors. Groundwater depletion rates are estimated over the 1990–2018 period in the Euro-Mediterranean region, using LISFLOOD-EPIC on daily time steps at 5 km horizontal resolution with sub-grid land use classes taken into account. In this paper, we focus on the southern Iberian Peninsula to optimise abstraction rules that avoid groundwater depletion and minimise severe water shortages under current climatic conditions. Ensuing crop yield losses and positive effects on environmental flows are simulated by LISFLOOD-EPIC. The southern Iberian Peninsula is chosen because of the following features: aquifer over-exploitation cases are documented for Spain (MITECO, 2000; Llamas and Garrido, 2007; Molinero et al., 2008; Giordano, 2009; Fuentes, 2011; Brown, 2012; Werner et al., 2012; Bierkens et al., 2019) and Portugal (APA, 2015); irrigation amounts to 75 % of groundwater abstraction in Spain (Custodio et al., 2017b; Hernández-Mora et al., 2010); in Portugal, 74 %–77 % of groundwater abstractions supply irrigation and livestock (Gruere, 2015; APA, 2015); several Spanish aquifers, especially in the south-eastern part, have undergone depletion (Kahil et al., 2015; Llamas et al., 2015; Custodio et al., 2016, 2017a; Foster and Custodio, 2019); depletions have also been detected in Portugal, in particular in the coastal aquifers of Algarve (Ribeiro and Veiga da Cunha, 2010); and well measurements of water table depth are published by the Government of Spain (2020).
Numerous large-scale hydrologic modelling studies have focused on irrigation sustainability and groundwater depletion (e.g. Siebert et al., 2010; Wada et al., 2010, 2012; Döll et al., 2014; Joodaki et al., 2014). However, they did not compute the crop production effects of (regulating) irrigation. Grogan et al. (2017) combined a hydrologic model with a crop production model to estimate the contribution of groundwater mining to crop yield. Bierkens et al. (2019) estimated the crop yield effects of agronomic inputs, including irrigation, with an econometric regression model. Compared to these studies, which did not simulate crop growth and hydrology in a dynamically integrated model, our methodology can assess simultaneously crop production and hydrologic impacts of restricting groundwater irrigation to sustainable levels. We test our approach on an agriculturally significant area (southern Iberian Peninsula), and envisage to apply it at continental and global scale.
The remainder of the article is structured as follows. In Sect. 2 we describe the methods. In Sect. 3 we present model input data for the Euro-Mediterranean setup. Results are presented in Sect. 4 and discussed critically in Sect. 5. Finally, Sect. 6 summarises the main findings of this study.
The integrated model of irrigation, crop growth and water resources LISFLOOD-EPIC is described in Sect. 2.1. First, LISFLOOD-EPIC is applied in the Euro-Mediterranean region assuming irrigation water abstraction to be unrestricted although limited by surface water availability. Groundwater depletion rates are estimated from groundwater level time series as described in Sect. 2.2. Section 2.3 defines the groundwater abstraction rules for irrigation, which are optimised in the southern Iberian Peninsula to avoid groundwater depletion due to irrigation while trying to minimise severe irrigation deficits. Finally, these optimised rules are implemented in LISFLOOD-EPIC to assess the agro-hydrologic impacts of regulating groundwater irrigation abstractions.
2.1 Integrated model of irrigation, crop growth and water resources (LISFLOOD-EPIC)
The distributed water resources model LISFLOOD (de Roo et al., 2000; van der Knijff et al., 2010; Burek et al., 2013; Bisselink et al., 2018a) is coupled with crop growth processes from the EPIC model (Williams et al., 1989; Williams, 1995; Sharpley and Williams, 1990) and a newly developed irrigation module. The resulting integrated model (LISFLOOD-EPIC) simulates the interactions between catchment hydrology, crop growth, irrigation, and water abstraction and allocation at the daily time scale.
The full description of LISFLOOD-EPIC is provided by Gelati et al. (2020), together with an evaluation in the Euro-Mediterranean region. Here we present briefly the simulated processes that are relevant for this study.
2.1.1 Hydrology
The model simulates the following land surface water processes: snow accumulation and melting, soil freezing, canopy interception, infiltration, runoff, three-layer soil moisture fluxes, evapotranspiration, macro-pore flow and deep soil percolation, subsurface (interflow) and groundwater (baseflow) discharge to rivers, and surface water routing through the river network, lakes and regulated reservoirs.
The mass balance equation of a grid-cell groundwater storage s is
where r is recharge, a is abstraction, b is baseflow to the river segment in the grid-cell, and h is net flow from neighbouring grid-cells. Groundwater recharge from river seepage is not explicitly simulated.
Baseflow b is modelled as the outflow of a linear reservoir, conditioned on groundwater storage being above a threshold level:
where H is the unit step function returning 1 when its argument is positive and 0 otherwise; θ is an inverse time constant parameter that is calibrated, along with other hydrologic parameters, using river discharge observations (Feyen, 2005; Zajac et al., 2013); and σ is a storage threshold parameter. If storage s is below σ, groundwater is disconnected from the river segment and no baseflow is simulated. As the model does not use explicit information about riverbed elevation, σ is assumed to be constant across the simulated domain.
Net lateral groundwater flow h is simulated by a weighted spatial smoothing process:
where is the average storage level of the grid-cells within the smoothing window that have active aquifers (Sect. 3.4); and κ is the smoothing weight taking value between 0 (no smoothing, thus there would be no lateral flow) and 1 (full smoothing, thus the grid-cell storage would equal the average over the smoothing window). As we use a 5 by 5 grid-cell window, the maximum number of neighbouring grid-cells involved in the smoothing is 24. h is proportional to storage level difference through κ, which may be seen as a pseudo-conductivity parameter. However, due to the simplified representation of lateral flow in Eq. (3), κ is assumed to be constant across the domain.
The groundwater component of the model is meant to represent large scale groundwater balance processes, rather than fine scale fluxes and heterogeneities. Thus we follow a volume-based approach, which consists of simulating the groundwater balance of each grid-cell independently (Collins, 2017), with the addition of the smoothing representation of lateral flow of Eq. (3). The volume-based approach was used in previous large-scale modelling studies of groundwater depletion (Wada et al., 2010; Döll et al., 2012, 2014; Pokhrel et al., 2015). While the relatively coarse spatial resolution of these studies (0.5 or 1∘ latitude/longitude) allowed simulating realistically the impact of groundwater abstractions on groundwater storage of each grid-cell separately, the higher spatial resolution of ours (5 km) does not. Therefore, we include a simplified representation of lateral flow, to redistribute local groundwater storage anomalies caused by large abstractions concentrated in small areas such as industrial districts and cities. Water abstraction and allocation in LISFLOOD-EPIC are described in Sect. 2.1.4. In Sect. 5.2, we discuss possible improvements of the current simplified model representation of groundwater processes.
2.1.2 Crop growth
Plant development processes are simulated accounting for weather conditions, atmospheric CO2 concentration, and abiotic stress factors (transpiration deficit, soil over-saturation, heat and cold stresses, and frost damage). The model simulates rainfed and irrigated cultivation of annual and perennial crops. It is fully coupled with the hydrologic components through soil moisture, plant water uptake, canopy interception, freshwater availability for irrigation, and return flows from irrigation water conveyance and application.
2.1.3 Irrigation
Four irrigation methods are represented: drip, sprinkler, and temporary (surface) and permanent (paddy) flooding. Irrigation is required when plant transpiration deficit exceeds a threshold, which is set to 0 in this study in order to simulate optimal irrigation requirements. Such threshold can be modified to simulate deficit irrigation scenarios. Irrigation water requirement is function of root zone soil moisture, and application and conveyance losses.
Application losses are water amounts allocated on the field that do not contribute to plant transpiration or canopy interception evaporation. Conveyance losses are function of the technology used to transport water from source to field. Non-evaporative components of both application and conveyance losses re-enter the hydrologic system as return flows. Therefore, they are regarded as (local) losses at field scale but not at larger spatial scales. At the catchment scale, for example, return flows ensuing from upstream local losses may be abstracted for downstream water use.
Application losses are simulated dynamically depending on the irrigation method, potential evaporation, and the state of the plant-soil composite. In flooding systems (surface and paddy irrigation), application losses occur via open water evaporation, surface runoff and macropore flow. Sprinkler application losses occur via droplet evaporation and wind advection. In drip irrigation, as well as in the other systems, water is lost locally via evaporation and drainage of soil moisture not used by plants, part of which may contribute to aquifer recharge.
Irrigation parameters are described in Sect. 3.5.
2.1.4 Water abstraction and allocation
While irrigation requirements are simulated dynamically, those of other sectors (household, industry, energy and livestock) are model input, which are described in Sect. 3.2. All withdrawals are partitioned among surface water and groundwater bodies according to water use statistics, conditioned on the availability of active (exploitable) aquifers. Surface water abstractions are drawn from rivers, lakes and reservoirs proportionally to (and limited by) available water storage within each water use region (WUR). WURs are used because large-scale information about water supply source locations is missing. In case of surface water shortage, irrigation allocation is reduced first. If this is not enough, allocations for other uses are reduced evenly. This simplified approach is motivated by the lack of large-scale information about water shortage management. Groundwater is abstracted on the same grid-cell where the water requirement is located, provided that the local aquifer is exploitable. In the absence of exploitable aquifers, water supply is entirely derived from surface water. If not regulated, groundwater abstractions are not limited so that unsustainable water use can be simulated. Return flows from water users are simulated dynamically. Parameters of water abstraction and allocation are described in Sect. 3.4 and 3.5.
2.2 Groundwater depletion
We compute groundwater depletion rates as statistically significant negative linear trend slopes of storage time series:
where are groundwater levels recorded at times t; var and cov are the variance and covariance operators; H is the unit step function defined after Eq. (2); and M is the Mann–Kendall test at significance level α, returning 1 if the trend is statistically significant and 0 otherwise (Mann, 1945; Kendall, 1975; Hussain and Mahmud, 2019). Therefore D returns either 0 (no depletion) or a negative rate (statistically significant depletion).
2.3 Regulation of groundwater abstraction for irrigation
We define groundwater abstraction rules for irrigation (Sect. 2.3.1). To evaluate their agro-hydrologic impacts, we design a control model simulation not allowing irrigation water use (Sect. 2.3.2). Rules are optimised to avoid irrigation-induced groundwater depletion while trying to minimise severe impacts on crop production (Sect. 2.3.3).
2.3.1 Abstraction rules
Drawing on similarities between exploited aquifers and regulated surface water reservoirs (Tian et al., 2018), we simulate abstraction regulation using rule curves, which are used to guide reservoir releases given storage and season (Wurbs, 1993; Chen, 2003; Ngo et al., 2007; Gelati et al., 2011, 2014). We regard groundwater storage levels at a given time of year as effective state descriptors that can guide abstraction. At the same time, we assume that other potentially useful information, e.g. recharge forecasts, is not available.
Monthly rule curves determine the fraction of required irrigation abstraction that is actually pumped, given the WUR-averaged groundwater storage. Regulation is defined at WUR level because detailed information about abstraction source locations is not available at the modelling scale. By introducing this regulation, the abstraction term in Eq. (1) becomes
where qi is the required abstraction for irrigation; qo is the required abstraction for other uses (household, livestock and industry; we assume the energy sector to use only surface water), which are not regulated for the purposes of this study; m is the calendar month corresponding to time t; is the average storage of the WUR w the grid-cell belongs to. Fm,w is the piece-wise linear rule curve function for month m and WUR w:
where lw(m) is the level below which irrigation abstraction is halted for grid-cells in WUR w during month m. Conversely, above uw(m) irrigation abstraction is unrestricted.
As surface water abstraction for irrigation is is assumed to be unregulated, the total water amount allocated to irrigation is
2.3.2 Control simulation without irrigation
To assess the effects of regulation, we use storage z from a LISFLOOD-EPIC simulation without irrigation ( as control:
where ro is recharge when no irrigation is applied.
Surface water irrigation is also turned off not to include irrigation-caused recharge, which would otherwise contribute to groundwater balance and thus lead to underestimation of depletion by other uses. As we use groundwater depletion to assess irrigation sustainability, the control simulation is designed to represent groundwater dynamics driven by hydrologic processes and other water uses (rainfed conditions).
Given a model simulation in which irrigation is active (be it regulated or not) and its total recharge r, the portion of recharge due to irrigation is computed by subtracting the rainfed conditions recharge r0 obtained from the control simulation:
2.3.3 Optimisation
Here we describe the methods used to optimise the groundwater irrigation rule curves described in Sect. 2.3.1.
We begin by defining the objective and constraint functions constituting the optimisation problem. Ideally, we would seek to calibrate rule curves in order to avoid groundwater depletion due to irrigation while minimising crop yield losses. However, due to the relatively large computational cost of the full LISFLOOD-EPIC model, we define an optimisation problem that only requires the simulation of groundwater flows, including abstraction and recharge. This approach reduces the computational cost by over 103 times compared to using the full model, which also simulates surface water hydrology and crop growth processes.
As we do not explicitly seek to minimise crop yield losses, the objective function is designed to limit severe irrigation shortages. Minimising the occurrence of large irrigation deficits when crop water requirement – and therefore potential biomass growth – is large, we assume severe irrigation shortages to be proxies of severe crop production losses. Furthermore, because of spatial interdependence of groundwater storage, all rule curves of any set w of adjacent WURs are optimised simultaneously. To avoid analysing trade-offs between irrigation deficits at multiple WURs, we define a single aggregate objective function. Based on the above considerations, we seek to minimise the sum of square irrigation deficits, constraining all WUR depletion rates not to be smaller (worse) than those computed for the control simulation without irrigation:
where , ; is the average storage of WUR w under rainfed conditions (Sect. 2.3.2); Fm,w is the rule curve function defined in Eq. (6); and required irrigation abstractions (qi) are integrated over the irrigated area A of each WUR.
The objective function and constraints of Eq. (10) are evaluated using the groundwater component of LISFLOOD-EPIC (Sect. 2.1.1). In Eq. (1), however, the recharge term r is an exogenous input, as it is influenced by plant and soil processes that are not included in the groundwater scheme. Following the r decomposition in Eq. (9), the rainfed conditions component r0 is obtained from the control simulation without irrigation (Eq. 8), while its other component ri is function of applied irrigation amounts and of the state of the plant-soil composite. When rule curves are enforced, applied irrigation is computed as the sum of unrestricted surface water irrigation and of regulated groundwater irrigation (Eq. 7). In contrast, plant-soil composite state variables are not simulated by the groundwater scheme and thus are unknown. Therefore, ri needs to be approximated for the objective and constraint functions of Eq. (10) to be evaluated. To do so, we use a fast surrogate model computing ri as a lagged response function of applied irrigation i. The surrogate model, which is described in Appendix A, is a linear reservoir inflow-outflow transfer function. It is calibrated against ri values obtained by decomposing the recharge simulated under full irrigation conditions (Eq. 9). We choose the linear reservoir analogy because, in the full model, a linear reservoir partitions macro-pore flow and deep soil drainage among interflow and recharge. Also, it outperforms approximating irrigation-caused recharge as a constant fraction of irrigation (e.g. Werner et al., 2012).
The groundwater balance equation used to evaluate the functions of the optimisation problem defined in Eq. (10) is
where is recharge simulated by the surrogate model defined in Eq. (A1) of Appendix A.
The decision variables to be optimised are defined as follows. To limit the decision space dimension, we parameterise the monthly levels lw(m) and uw(m), which define the rule curves in Eq. (6), as quantiles of the groundwater storage cumulative distribution function Gm,w(z) obtained from the control simulation without irrigation (Sect. 2.3.2):
where the cumulated frequencies jw and vw are the decision variables to be optimised for WUR w. Given the parameterisation of monthly levels l and u given in Eq. (10), there are decision variables, namely and . If, instead, we optimised directly lw(m) and uw(m) for each month and WUR, there would be decision variables.
Our choice of decision variables implies that rule curve isolines approximate the seasonal cycles of storage quantiles in absence of irrigation. Therefore, this parameterisation may be seen as an implicit constraint forcing the regulated groundwater balance to converge towards rainfed conditions. Also, at the same storage level, it allocates larger fractions of required irrigation abstraction during dry seasons compared to wet ones.
We calibrate the decision variables j and v by approximating the solution of Eq. (10), using a genetic algorithm (Blank and Deb, 2020) to search the decision space, in a simulation-optimisation approach (Gorelick and Zheng, 2015).
Model input data and their processing are described in full detail by Gelati et al. (2020). Hydrologic, land surface and soil parameters are also described by Bisselink et al. (2018b). Here we present the input datasets that are most relevant for the purposes of this study. Parameter maps characterising crop types, water abstraction and irrigation, which are presented in Sect. 3.3–3.5, are assumed not to change over time. The horizontal resolution of all spatially distributed model input data is 5 km. The model grid is defined using the INSPIRE (2014) Lambert azimuthal equal area projection (ETRS89-LAEA). The Euro-Mediterranean model domain is shown in Fig. 1.
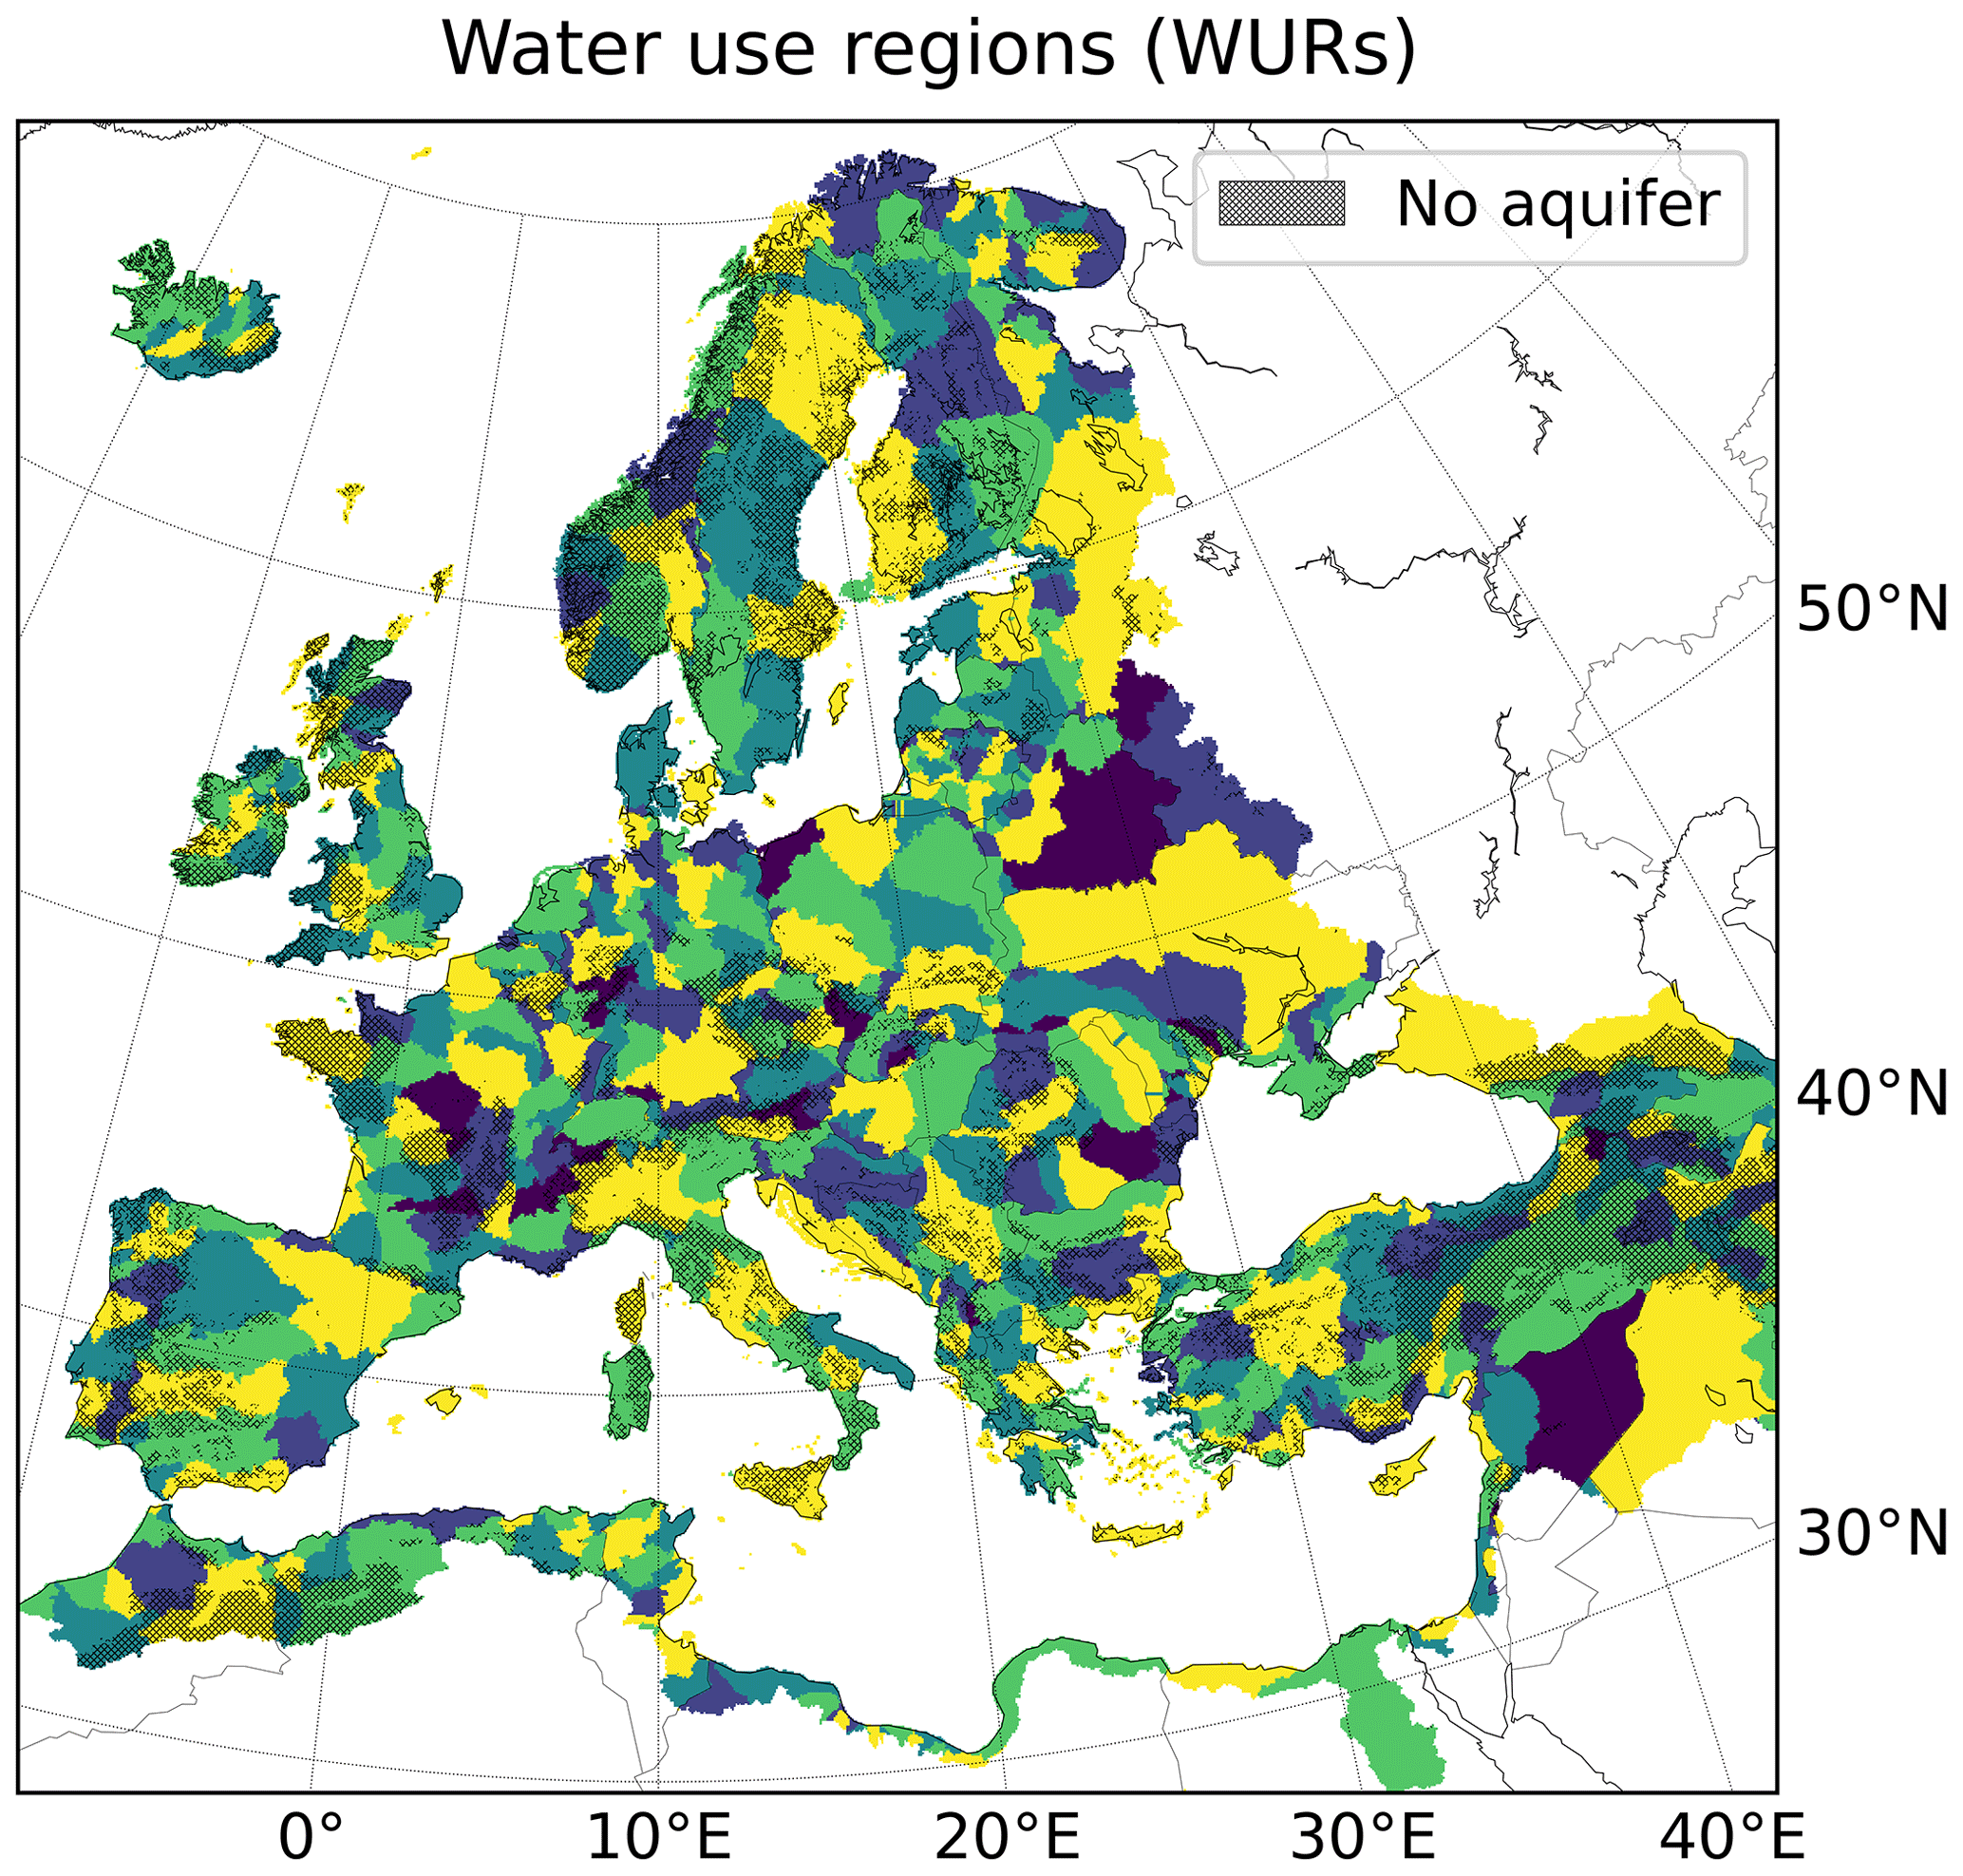
Figure 1Water use regions (WURs) over the Euro-Mediterranean model domain, where areas without exploitable aquifers are barred. Adjacent WURs are mapped with distinct colours.
3.1 Atmospheric forcing
Simulations are forced with 1990–2018 near-surface atmospheric data from the daily EFAS-Meteo dataset (Ntegeka et al., 2013; Thiemig et al., 2020), which is available on the model grid and includes the following variables: precipitation, downward shortwave radiation, wind speed, water vapour pressure, and minimum and maximum air temperature.
Near-surface CO2 concentration and barometric pressure are derived from the global Copernicus Atmosphere Monitoring Service (CAMS) Greenhouse Gases Flux Inversions v18r2 reanalysis dataset (Chevallier et al., 2010; Copernicus, 2020), which provides 3-hourly data at 1.875∘ latitude by 3.75∘ longitude resolution on 40 atmospheric pressure levels from 1979 to 2018. After computing daily averages, these are assigned to model grid-cells via nearest-neighbour interpolation. Then, values are linearly corrected for altitude based on the elevation of model grid-cells and CAMS geopotential heights.
3.2 Water requirements of sectors other than irrigation
While irrigation water requirements are simulated dynamically, those of other sectors are fed into the model as spatially distributed daily time series (1990–2018), which are downscaled from national statistics. Domestic requirements are obtained from multi-variate regressions of economic, demographic and climate data (Vandecasteele et al., 2014; Bernhard et al., 2020a). Energy (cooling) requirements are interpolated from country-level values using power plant locations from the European Pollutant Release and Transfer Register database (EEA, 2020a) and electricity consumption projections from the POLES model (Keramidas et al., 2017). Livestock requirements are based on literature values and animal population density maps (Mubareka et al., 2013). Industrial requirements are downscaled from country-level values, accounting for the locations of sites belonging to manufacturing, mining and construction sectors (Bernhard et al., 2020b).
3.3 Crop parameters
The Euro-Mediterranean model setup includes 23 crop types, for which we simulate rainfed and irrigated fractions separately: winter and spring wheat, winter and spring barley, rye and oat, maize, rice, millet, sorghum, sunflower, rapeseed, olive, soybean, pulses, vegetables, potatoes, sugarbeet, temperate and tropical fruit, tobacco, fibres, and a lumped type for the rest of crops.
Spatial distribution of crops is derived from the SPAM v3.2 dataset (You et al., 2014; IFPRI and IIASA, 2020), which provides rainfed and irrigated areas (ha) of 42 crop categories on a global 5′ latitude/longitude grid for the year 2005. SPAM cultivated areas are transformed into cultivated land fractions by dividing them by SPAM pixel areas in the ETRS89-LAEA projection. These fractions are then assigned to model grid-cells via nearest-neighbour interpolation. Where necessary, LISFLOOD sub-grid land use classes based on Corine 2006 data (EEA, 2006) are adapted to accommodate SPAM-derived rainfed and irrigated crop areas.
Most modelled crop types are defined as either a single SPAM category or by merging several SPAM categories. Exceptions are some SPAM cereal categories (wheat, barley and other cereals) that are disaggregated into seasonal types (winter/spring wheat and barley, and rye and oat): we use 2000–2016 average country-level cultivated areas of winter and spring varieties from Eurostat (2020a, b) to compute the partitioning ratios; and we prioritise the assignment of irrigated cropland to spring-planted varieties. Furthermore, the modelled olive type is defined and distributed spatially by assigning cultivated areas from the “other oil crops” SPAM category using a binary mask resampled from the olive area map of the Global Agro-Ecological Zones v3.0 dataset (GAEZ; Fischer et al., 2012; FAO and IIASA, 2020), which reports crop statistics globally at 5′ latitude/longitude resolution for the year 2000. The mask is computed by applying a 20 km buffer around non-null olive area GAEZ pixels, to reduce fine scale heterogeneities in crop distribution due to the reference year discrepancy with SPAM. These disaggregations are performed to represent regionally relevant crops that are grouped into broad categories by the global SPAM dataset.
Sowing and harvesting date ranges are obtained from the Crop Calendar Dataset of the University of Wisconsin-Madison (Sacks et al., 2010; Sacks, 2020), which reports data for 25 crop classes at 5′ latitude/longitude resolution, This dataset is used for all annual crops except tobacco, for which we use GAEZ calendar data.
Plant physiologic parameters are adapted from crop types used in previous studies (Bouraoui and Aloe, 2007; Wriedt et al., 2009a, b) and those defined in the EPIC source code (Texas A&M AgriLife Research, 2020).
Nearest-neighbour interpolation is used to map all spatially distributed crop input data to the 5 km model grid.
3.4 Water abstraction parameters
Exploitable (active) aquifers are identified from the International Hydrogeological Map of Europe v1.1 (BGR, 2020), using classes I, II and IIIa displayed in Fig. 2 of Duscher et al. (2015). Figure 1 shows model domain areas where exploitable aquifers are not available. For all water uses except irrigation, withdrawal fractions taken from groundwater are mapped from AQUASTAT country-level figures of total and groundwater abstraction (FAO, 2020), accounting for exploitable aquifer locations. The estimation of the shares of irrigation abstraction withdrawn from groundwater are described in Sect. 3.5.
WUR definitions are adapted from EU Water Framework Directive (WFD) river basin districts (EEA, 2020b), of which some of the largest are split into smaller units along watershed borders (Fig. 1).
Locations and characteristics of lakes and reservoirs are obtained from the Global Reservoir and Dam database v1.01 (Lehner et al., 2011a, b) and the Global Lakes and Wetlands Database (Lehner and Döll, 2004; WWF, 2020). Lacking detailed data on lake and reservoir abstraction, we assume that 25 % of daily surface water abstraction in each WUR is withdrawn from lakes and reservoirs, conditioned on stored water availability.
3.5 Irrigation parameters
The distribution of irrigation systems and the fraction of irrigation supplied by groundwater are derived from sub-national data (Eurostat, 2020c), where available. Eurostat provides the following data, grouped by farm size classes, on NUTS2 administrative units (Eurostat, 2020h): irrigated area, number of irrigated farms, number of farms by irrigation system (flooding, sprinkler, drip), and number of farms by irrigation water supply source (on-farm ground water, on- and off-farm surface water, off-farm water from water supply networks and other sources). Data about sources of irrigation water supply and irrigation application systems are available for 2010 only.
Within each administrative unit, the fractions of irrigation water abstracted from groundwater are mapped assuming that irrigation is completely supplied from surface water on grid-cells without exploitable aquifers. We also assume that irrigation withdrawals from water supply networks and other sources are partitioned among surface water and groundwater bodies according to the country-level AQUASTAT-derived fractions used for the other sectors (Sect. 3.4). The latter fractions are also used directly as irrigation groundwater supply shares of irrigation in areas where Eurostat data are unavailable. Moreover, we assume groundwater fractions of irrigation to be irrespective of the crop type. Estimation of groundwater and surface-water abstraction shares from Eurostat data involves two steps: first, Eurostat data on irrigation supply sources are averaged over farm size classes, to obtain fractions of irrigated cropland by water supply source for each NUTS2 unit; then, assuming that such areal fractions are equivalent to water abstraction shares, grid-cells with exploitable aquifers are assigned groundwater irrigation withdrawal fractions such that their NUTS2 averages match the areal shares derived from Eurostat.
Administrative-level irrigation system fractions are disaggregated spatially and by crop type using irrigated area maps (Sect. 3.3) and information on allowed crop-specific irrigation systems. The latter is compiled from Sauer et al. (2010), Fischer et al. (2012) and Jägermeyr et al. (2015), among which discrepancies are solved by taking the union of allowed systems for each crop type. The disaggregation is performed assuming that, for each crop, the resulting areal fraction assigned to each irrigation system does not change across grid-cells of the same administrative unit. Where Eurostat NUTS2 data are not available, we disaggregate country-level irrigation system shares from Table S1 of Jägermeyr et al. (2015), who summarised data from Rohwer et al. (2007), ICID (2012) and FAO (2020).
Irrigation conveyance efficiency values are based on Table 7 of Brouwer et al. (1989) and adapted to the available water supply source data: on-farm ground water (0.95), on-farm surface water (0.80), off-farm surface water (0.70), off-farm water from water supply networks (0.9), and other sources (0.85). These values are averaged on each model grid-cell using local irrigation supply source fractions as weights. We assume 50 % of conveyance losses to evaporate and the rest to leak as macro-pore flow.
We begin by characterising available data on groundwater abstraction for irrigation in the Euro-Mediterranean area and comparing them with simulated values (Sect. 4.1). In Sect. 4.2 we discuss groundwater depletion estimates. Finally, we present the outcomes of regulating groundwater abstraction for irrigation in the southern Iberian Peninsula (Sect. 4.3).
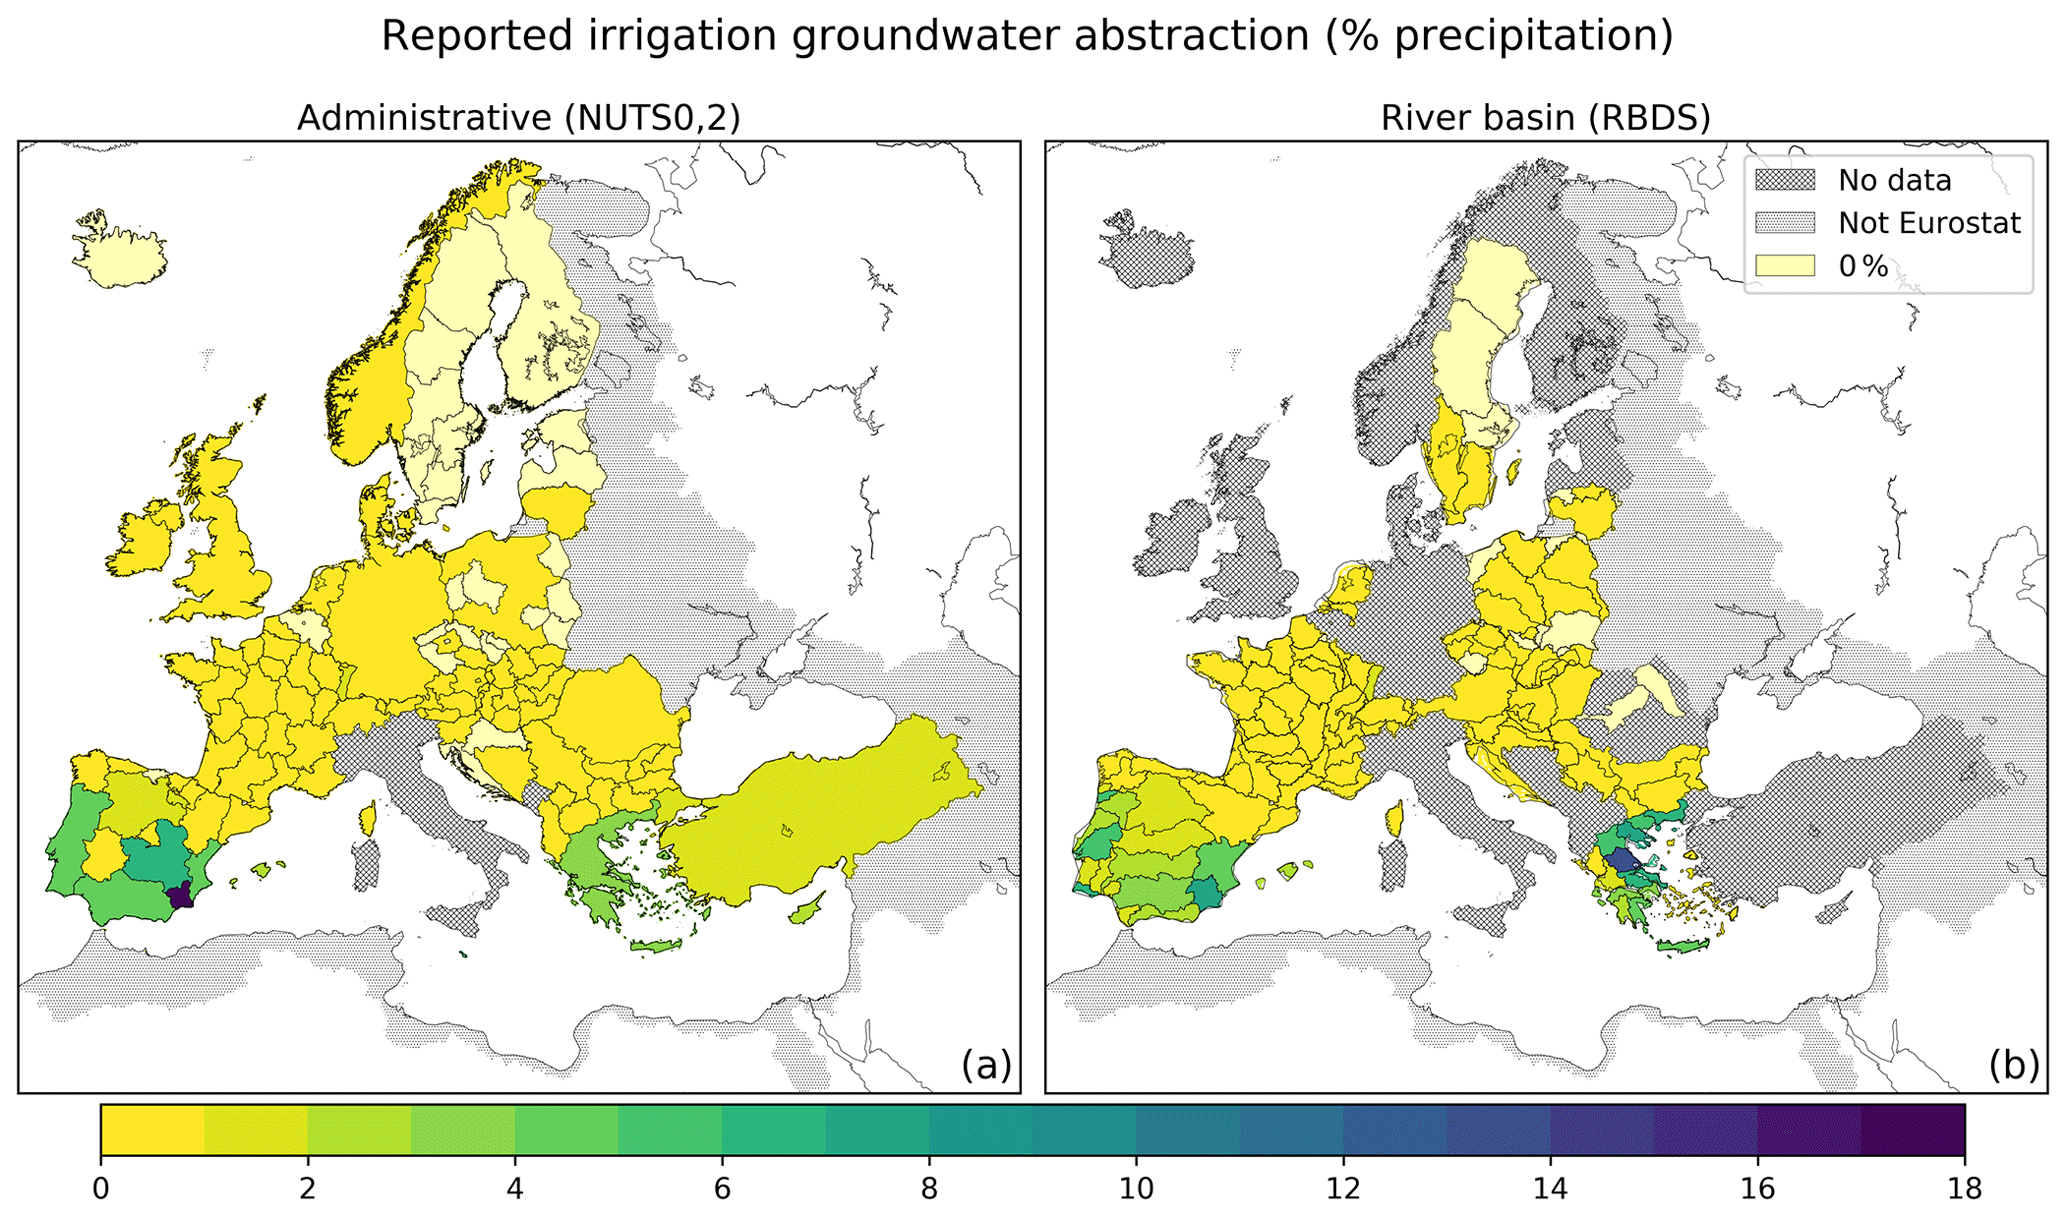
Figure 2Reported groundwater abstraction for irrigation as percentage of observed precipitation averaged over (a) administrative units (NUTS0, NUTS2), and over (b) WFD river basin districts and sub-basins (RBDs). Where available, NUTS2 and sub-basin figures overlay those reported at NUTS0 and basin levels. Country-wide RBDs are defined for Cyprus, Malta, Albania, Iceland, Kosovo, North Macedonia and Turkey, for which data are mapped only at NUTS0 level. White land areas are outside the Euro-Mediterranean model domain (Fig. 1).
4.1 Irrigation groundwater abstraction
Annual groundwater abstractions for irrigation in the Euro-Mediterranean region are published by Eurostat (2020d, e, f) at country, sub-national and river basin levels (Fig. 2).
Basin data are reported for WFD river basin districts and sub-basins (RBDs) for the following countries (years): Austria (2010), Bulgaria (2005–2017), Croatia (2014–2017), Czech Republic (2008, 2010–2017), France (2007–2016), Greece (2011–2016), Hungary (2010–2015), Lithuania (2012–2017), Netherlands (2005–2012), Poland (2010–2017), Portugal (2017), parts of Romania (2014–2015), Serbia (2012–2017), Slovakia (2005–2017), Slovenia (2010–2017), Spain (2011–2014), Sweden (2005, 2010, 2015), Switzerland (2012), and the Brussels area in Belgium (2012–2017).
Sub-national data are available for administrative areas (NUTS2) of Austria (2010), Bulgaria (2005–2013), Croatia (2012–2013), Czech Republic (2012–2013), France (2007–2012), Hungary (2011–2013), parts of Poland (2013), Slovakia (2012–2013), Spain (2011), Sweden (2005, 2010), and Brussels (2012–2013).
National (NUTS0) data are available for all EU member states except Italy, and for several neighbouring countries. The 1990–2017 NUTS0 reporting frequency is over 75 % for Bulgaria, Romania, Slovenia, Spain and Turkey; over 50 % for Cyprus, Czech Republic, Denmark, Greece, Hungary, Lithuania, Malta, Netherlands, Serbia, Slovakia and Sweden; and over 25 % for Austria, Estonia, France, North Macedonia, Norway, Poland, and UK. To our knowledge, no groundwater irrigation abstraction data are available for the remaining countries: FAO (2020) reports total groundwater abstractions without sector disaggregation, and irrigation water abstractions without source disaggregation.
NUTS0 reported abstractions, although more frequent and extensive than NUTS2 and RBD, generally have spatial resolutions that are too coarse for assessing impacts on groundwater bodies. NUTS2 data do not include several EU member states with ample irrigated cropland (Greece, Italy, Portugal and Romania), cover short time periods ending in 2013, and have been last updated in 2016. Moreover, administrative units often are not aligned with catchments, which are the fundamental spatial elements for implementing integrated water resources policies (UN, 1993): in the EU, WFD management plans are defined on RBDs. RBD reporting is also more extensive and frequent than NUTS2, featuring data up to 2017. In particular, data are available for RBDs in Greece and Portugal, which withdraw relatively large amounts of groundwater for irrigation. However, RBD data are not reported for some countries with significant irrigation water use, among which Italy is the sole EU member state not reporting any irrigation groundwater abstraction data.
Figure 2 displays average reported groundwater abstraction for irrigation as percentage of precipitation recorded during the reporting years. Rates are above 1 % in Portugal, Spain, Alsace (France), Malta, Greece, Cyprus and Turkey. The largest values (>5 %) are mapped at NUTS2 and RBD levels, highlighting the importance of sub-national scale reporting for assessing potential unsustainable groundwater use: in Murcia and Castile-La Mancha NUTS2 and Segura RBD in Spain; in Algarve, Tagus and Cavado RBDs in Portugal; and throughout RBDs in north-eastern Greece (Thrace; Eastern, Central and Western Macedonia; Thessalia; and Eastern Central Greece).
Data on irrigated cropland area are of great value when analysing, also by modelling, the spatial and temporal variability of irrigation abstraction volumes. The joint reporting of volume and area allows estimating irrigation intensity, which can be used to assess to which extent irrigation abstraction changes are caused by climate, cropping patterns and irrigation practices, provided that data about these factors are also available. Irrigated areas are reported on NUTS0 and NUTS2 by Eurostat (2020d, e) in 2005, 2007, 2010, and 2013. On NUTS2, volumes and areas are reported jointly four times for Bulgaria; twice for France and Sweden; and once for Austria, Belgium, Czech Republic, Croatia, Hungary, Poland and Slovakia. NUTS0 joint reporting is generally more frequent, but it does not cover 40 % of volume-reporting countries, such as Portugal and Turkey among others. Moreover, reported areas are not disaggregated by water supply source. This information can be inferred from Eurostat (2020c), which reports the number of holdings supplied by each water source aggregated by farm size class on NUTS2. However, these data are available only for 2010. To our knowledge, irrigated areas are not reported for RBDs.
4.1.1 Comparison of simulated and reported abstractions
Simulated and report-based irrigation intensity estimates at country level are compared in Gelati et al. (2020). Here we compare simulated and reported volumes over the 1990–2018 period, to assess how the model simulates the pressure on groundwater due to irrigation abstractions (Fig. 3).
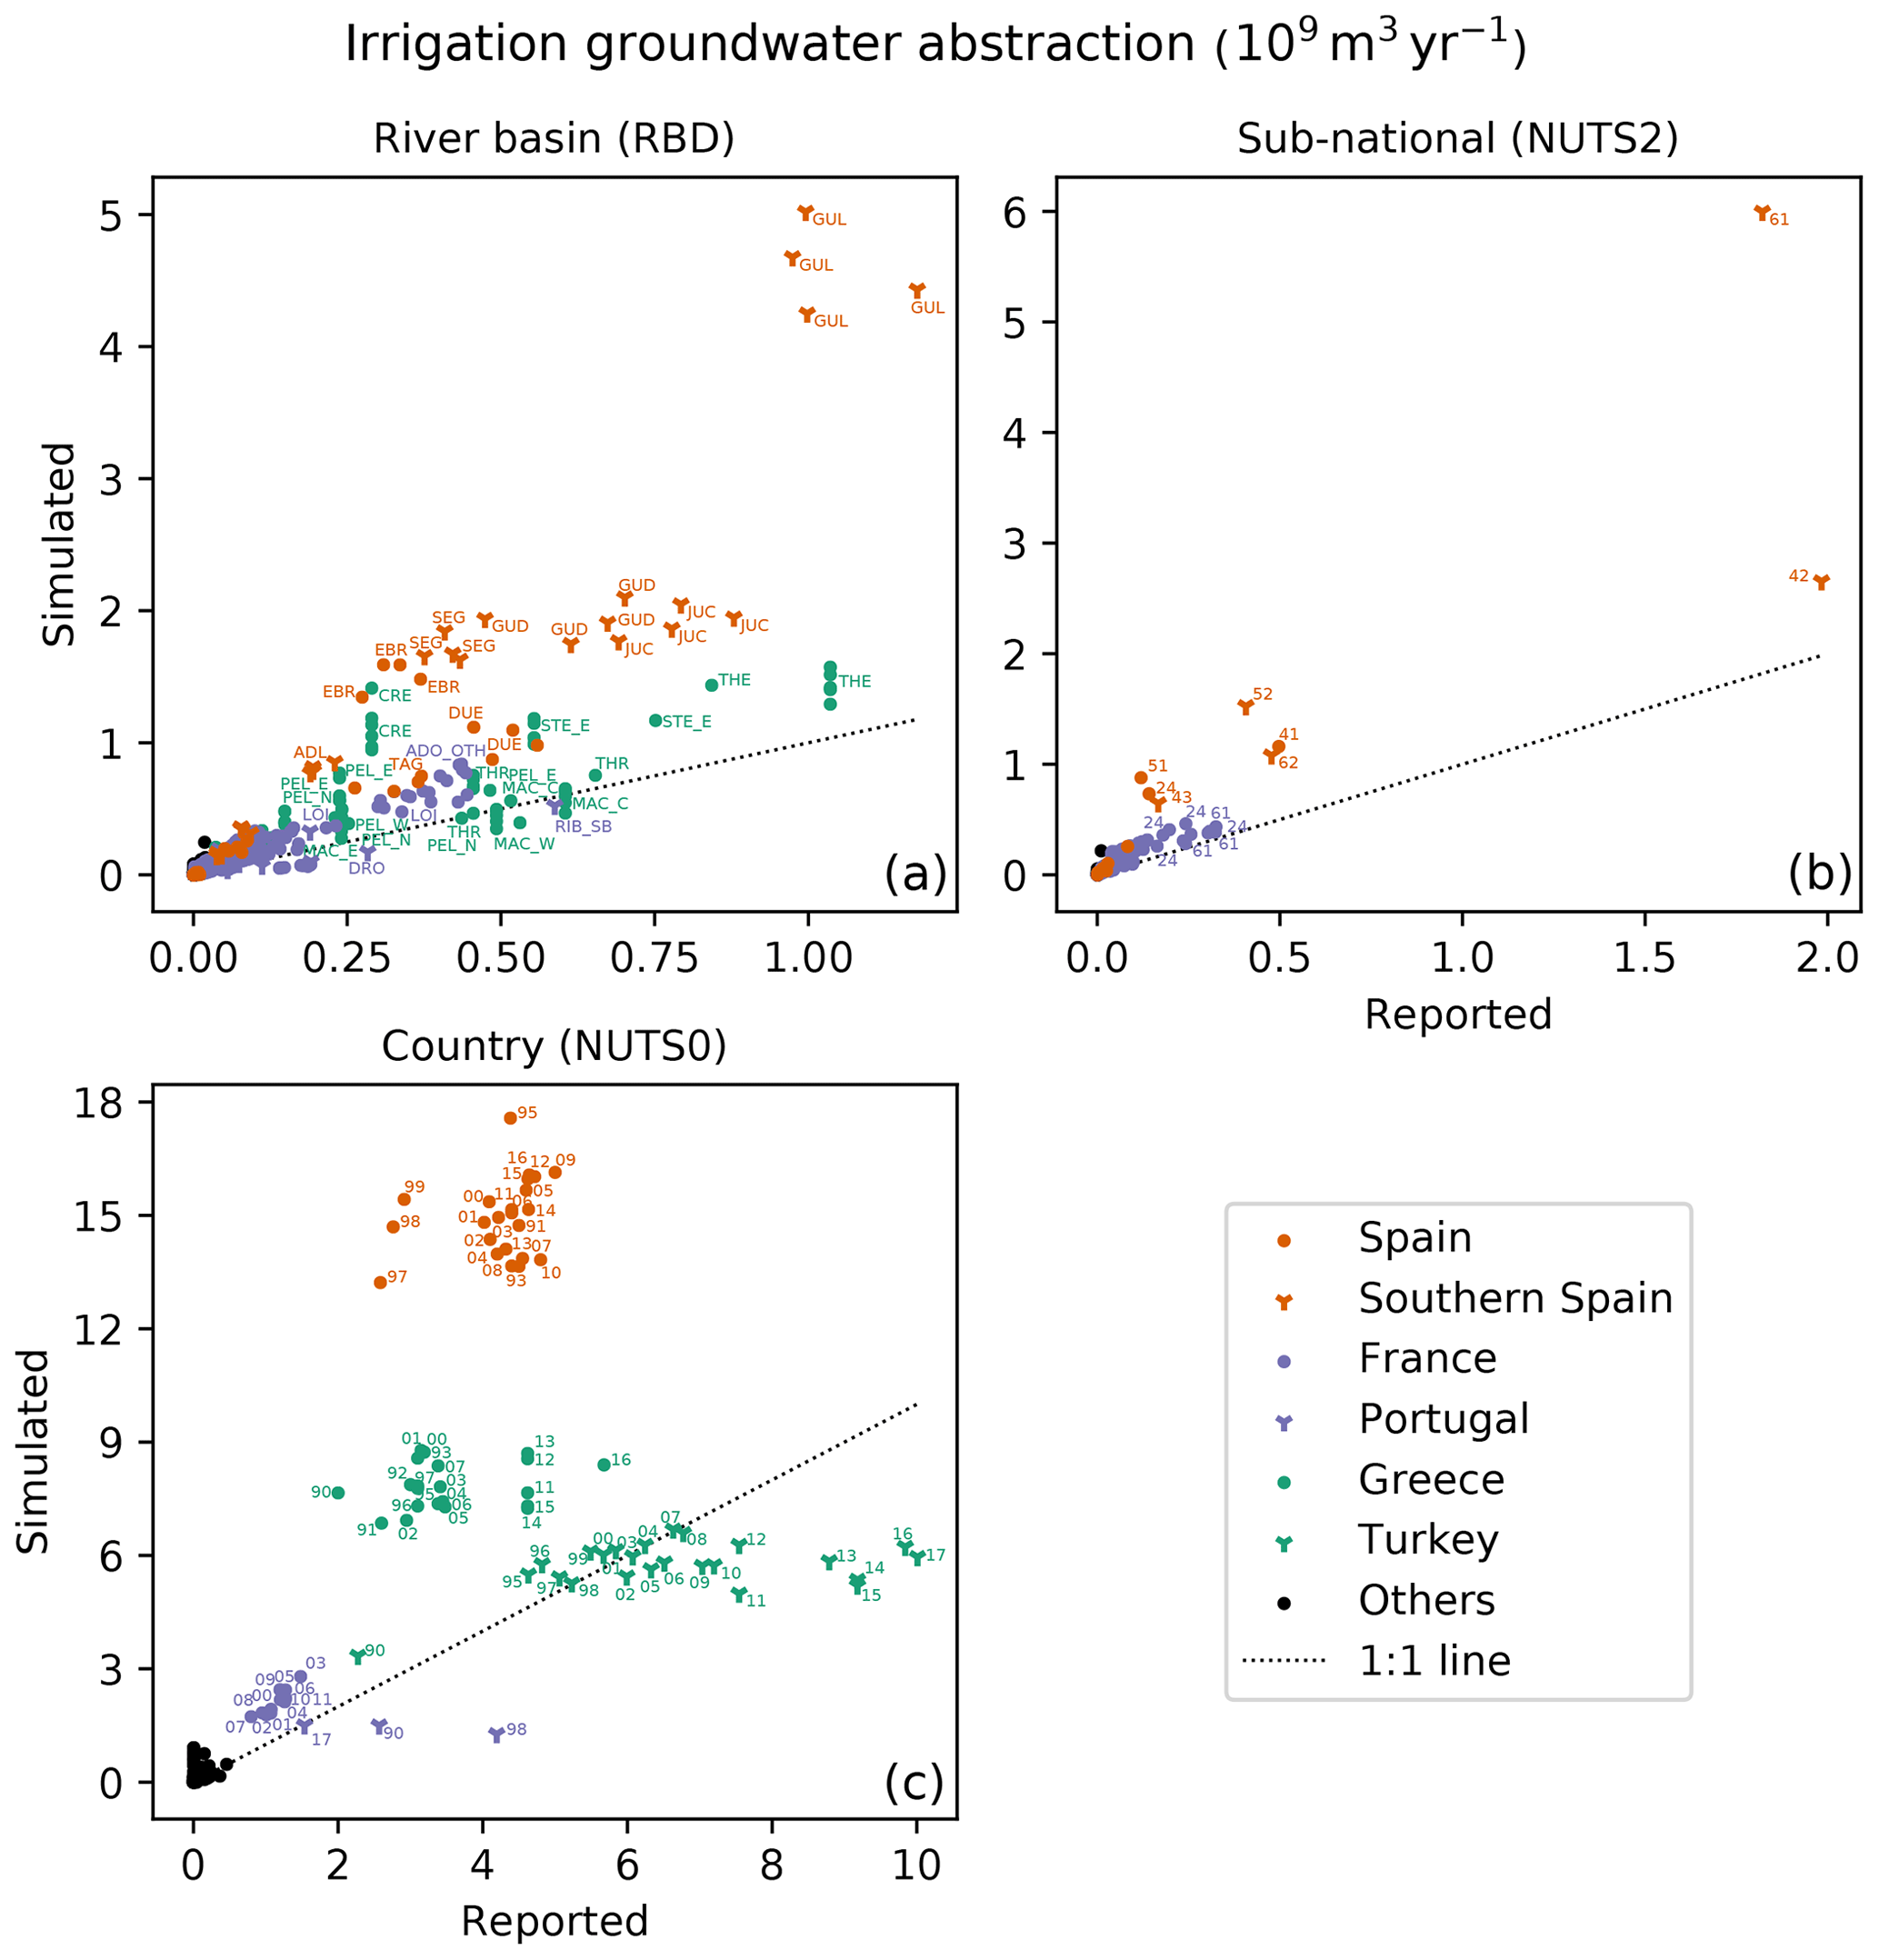
Figure 3Simulated versus reported groundwater volumes abstracted for irrigation at RBD, NUTS2 and NUTS0 levels (1990–2018). Southern Spain is defined either as Andalusia (61), Castile-La Mancha (42), Extremadura (43), Murcia (62) and Valencia (52) NUTS2 (b); or as Mediterranean Andalusia (ADL), Guadalete (GUA), Guadiana (GUD), Guadalquivir (GUL), Júcar (JUC), Segura (SEG), and Tinto (TIN) RBDs (a). These definitions overlap over 80 % of their union area. Other RBDs (a): Douro (DUE), Ebro (EBR) and Tagus (TAG) in Spain; Crete (CRE), Eastern Central Greece (STE_E), Eastern and Northern Peloponnese (PEL_E, PEL_N), Eastern, Central and Western Macedonia (MAC_E, MAC_C, MAC_W), Thessalia (THE) and Thrace (THR) in Greece; Douro (DRO) and Tagus (RIB_SB) in Portugal; Adour, Garonne, Dordogne, Charente and Aquitaine coastal streams (ADO_OTH) and Loire, and the coastal rivers of Vendée and Bretagne (LOI) in France. Other NUTS2 (b): Aragon (24), Catalonia (51) and Castile and Leon (41) in Spain; Centre (24) and Aquitaine (61) in France. NUTS0 data points (c) are labelled by year of reporting.
At RBD and NUTS2 levels, most largest reported volumes are significantly smaller than the corresponding simulated values. The ratios of simulated to reported volumes are particularly large in southern Spain, up to over 4 times in the Guadalquivir RBD and Andalusia NUTS2, which largely overlap. Similar volume ratios occur in the Ebro, Segura and Mediterranean Andalusia RBDs, and Aragon, Catalonia and Extremadura NUTS2 in Spain; and the Crete RBD in Greece. Simulated abstractions of other RBDs (Guadiana and Júcar) and NUTS2 (Castile and Leon, Murcia, Valencia) of Spain are between 2 and 3 times those reported. Smaller ratios – generally below 2 – occur in several RBDs across Spain (Douro and Tagus), Greece (Eastern Central Greece, Eastern Peloponnese and Thrace) and France (Adour, Garonne, Dordogne, Charente and Aquitaine coastal streams; Loire, and the coastal rivers of Vendée and Bretagne). The same applies for most NUTS2 in France, where the largest abstractions are recorded for Aquitaine and Centre. Compared to the largest values reported at sub-national levels in Spain (Castile-La Mancha) and Greece (Thessalia), the corresponding simulated values are from 25 % to 35 % larger.
For Portuguese and some Greek RBDs (Northern Peloponnese, and Eastern, Central and Western Macedonia), simulated values are fairly unbiased. For RBDs of Portugal, France and Spain (excluding the Ebro and southern RBDs), simulated and reported volumes correlate well (Fig. 3a). This is also the case for NUTS2 in France (Fig. 3b).
It is noteworthy that for several RBDs the same non-zero abstraction is reported on different years: in Greece, out of six annual volumes, Crete features a unique value, Eastern Central Greece three, and the remaining RBDs two; each RBD of Croatia reports a value repeated four times; and in the Morava, and the Ohre and lower Elbe RBDs (Czech Republic), 105 m3 is reported for both whole series, which are 7 and 8 year long.
At NUTS0 level, the ratios of simulated to reported abstractions in Spain are roughly between 3 and 5. The linear correlation coefficient between simulated and reported values is positive but relatively small (0.28), indicating inter-annual variability discrepancies. From 1997, reported volumes show an overall increasing trend with local maxima in 2000, 2005, 2009 and 2012, for which the model also simulates anomalously large abstractions. Reported total irrigated area declines linearly from 2005 (3.36×10¹⁰ m2) to 2013 (2.90×10¹⁰ m2) through 2007 and 2010, thus not correlating with the volume trend.
Compared to Spain, Greece reported data span a similar range and the corresponding simulated values are between 1.5 and 4 times larger. They form two groups, with smaller volumes in the 1990s and 2000s and significantly larger values after 2010. This shift is not explained by reported irrigated areas, which are larger in 2005 (1.31×10⁹ m2) and 2007 (1.28×10⁹ m2) than in 2013 (1.16×10⁹ m2). Repeated volume values are reported for 1993 and 1995–1997 (3.10×10⁹ m3), and for 2011–2015 (4.62×10⁹ m3).
For Portugal, abstractions are reported only for 3 years. Compared to these, simulated values have a much smaller variability, leading to an accurate prediction in 2017 but underestimations in 1990 and 1998. Areas and volumes are not reported jointly.
Simulated abstractions for Turkey are comparable with reported values until 2008, underestimating thereafter. From 1995, their range of variability is an order of magnitude smaller than that of reported values, which increase at a nearly constant rate (1.82×10⁸ m3 yr−1) until 2011. Afterwards, the average growth rate of reported abstractions is more than double (4.11×10⁸ m3 yr−1), although annual rates are much more variable. Reported abstractions grow more than fourfold from 1990 to 2017, while no irrigated area values are reported.
For France, the ratios between simulated and reported abstractions are between 1.7 and 2.2. Their linear correlation coefficient is 0.90, indicating that the model reproduces well the variability of reported volumes. In particular, both simulated and reported abstractions peak in 2003, when a severe drought affected several European countries including France (Ciais et al., 2005). Both series have their minima in 2007, a year with above-average summer precipitation in France (van der Velde et al., 2012). The 2007 reported irrigation area is smaller than those of 2010 (−5 %) and 2005 (−11 %). However, this may explain only in part the lower 2007 abstraction compared to 2010 (−34 %) and 2005 (−37 %).
In Sect. 5.1 we discuss possible causes of the mismatches between simulated and reported groundwater abstractions for irrigation.
4.2 Groundwater depletion estimates
We estimate groundwater depletion rates from 1990–2018 simulated groundwater storage time series. Those statistically significant (Mann–Kendall trend test at α=0.01) are mapped in Fig. 4. Rates are computed at WUR level to avoid local model artefacts due to the lack of detailed data on the locations of water withdrawals. Being averaged over relatively large areas, they may hide significant depletions detectable at finer spatial scales.
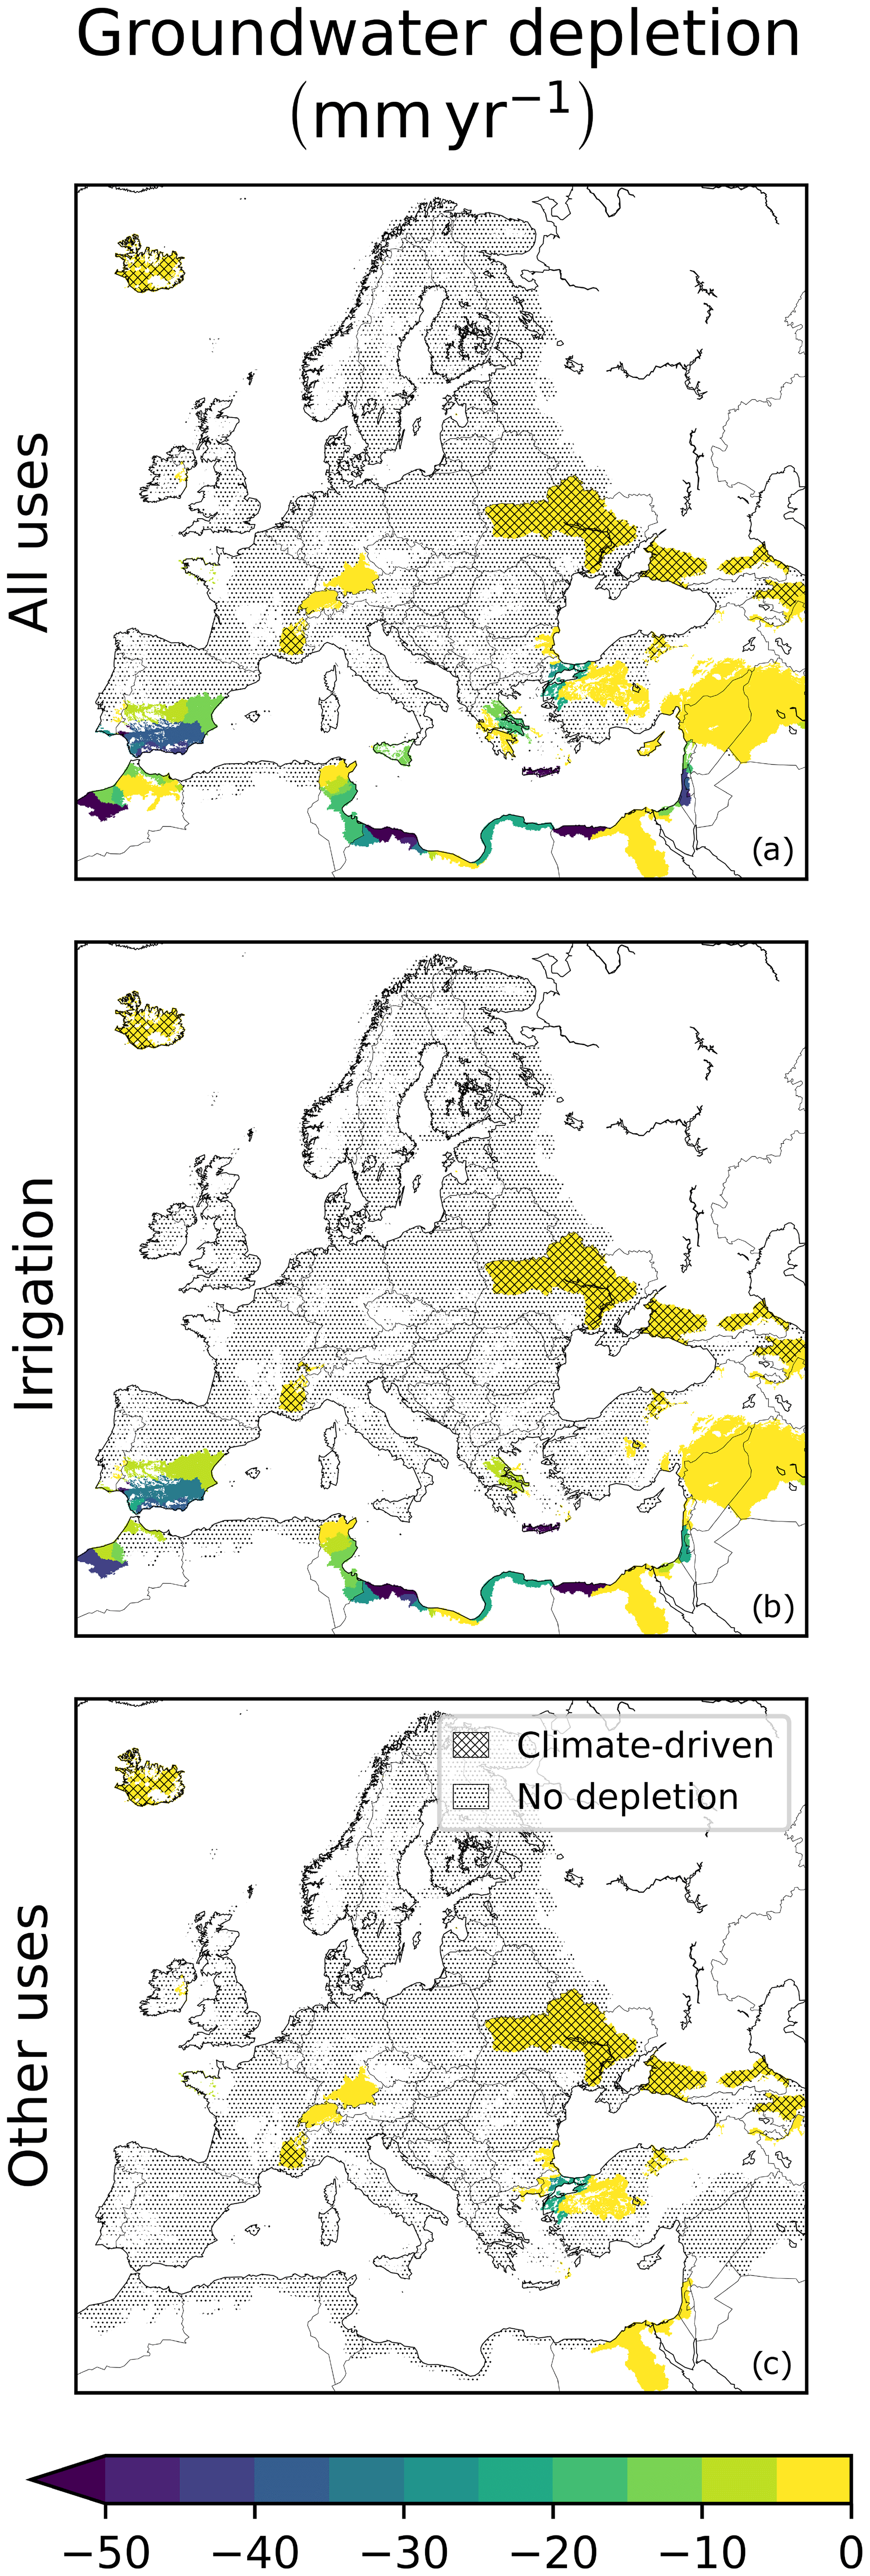
Figure 4Groundwater depletion rates simulated by the LISFLOOD-EPIC model for the 1990–2018 period, including (a) abstractions by all sectors; (b) abstractions by irrigation only; and (c) abstractions by all sectors except irrigation (household, industry, livestock and energy). Displayed rates are linear trend slopes computed over WURs and tested for statistical significance. Dotted are aquifer locations where no statistically significant depletion is found. Over barred areas, at least 90 % of total depletion rates are also simulated without water abstractions and thus are mostly driven by climate (Fig. S1 in the Supplement). White land areas within the Euro-Mediterranean model domain have no exploitable aquifers (Fig. 1).
Total depletion rates are computed allowing abstractions from all water users (Fig. 4a). Sector contributions are estimated by means of two simulations: one allowing only irrigation water use (irrigation-only simulation; Fig. 4b); and another allowing only the household, industry, livestock and energy sectors (rainfed simulation; Fig. 4c), as described in Sect. 2.3.2.
Significant depletion is simulated for several areas across the Mediterranean, with the largest values in the southern Iberian Peninsula, Crete, Israel, Palestinian territories, Egypt, Lybia and Morocco. Estimates in the Middle East and northern Africa may be affected by larger uncertainties compared to other areas, due to lower availability of irrigation and water use data. Moreover, the simulated domain does not include some exploited water bodies, such as the Jordan river (Al-Weshah, 2000) or the Nubian sandstone fossil aquifer (Abdelrhem et al., 2008).
Non-irrigation water uses are largely responsible for depletions in northwestern Turkey, Thrace (Greece), coastal areas of Bulgaria, Switzerland and southern Germany.
The contribution of irrigation is prevailing in Attica, Crete and Central Eastern Greece; in the southern Iberian Peninsula; and across northern Africa and the Middle East. Except for northwestern Turkey, irrigation is the leading cause of the most severe groundwater depletion rates. In these areas, simulations indicate that groundwater irrigation is not sustainable by itself.
Several areas, for which irrigation-only and rainfed simulations do not result in significant depletion, are affected by depletion when all uses are allowed: Sicily (Italy), Cyprus, Middle Atlas (Morocco), and Northern and Eastern Peloponnese and Eastern Central Greece. In these areas, simulations indicate that groundwater irrigation is sustainable by itself, but not if combined with other water uses.
An additional simulation not permitting any water abstraction is performed to identify areas where groundwater depletion may be caused by climate variability or model uncertainties (Fig. S1 in the Supplement). This signal accounts for most (if not all) simulated depletion in Iceland, Caucasus, and the basins of Dnieper (Ukraine), Rhone (France and Switzerland), and Yeşilırmak and lake Tuz (Turkey); while it accounts for less than 10 % of the values in Israel and neighbouring areas. Removal of the climatic signal from model output is beyond the scope of this study as, due to the non-linearity of hydrologic processes influencing groundwater storage, it would require removing trends from atmospheric forcing data.
Water table depth measurements published by the Government of Spain (2020) are available from 1965 to 2017. Groundwater level decline rates are mapped in Fig. 5 for 916 wells with observations on at least 120 months from 1990 onward, after evaluating their statistical significance (Mann-Kendall test at α=0.01). When comparing Fig. 5 with Fig. 4 or 6, it should be taken into account that WURs and RBDs are identical in the Iberian Peninsula.
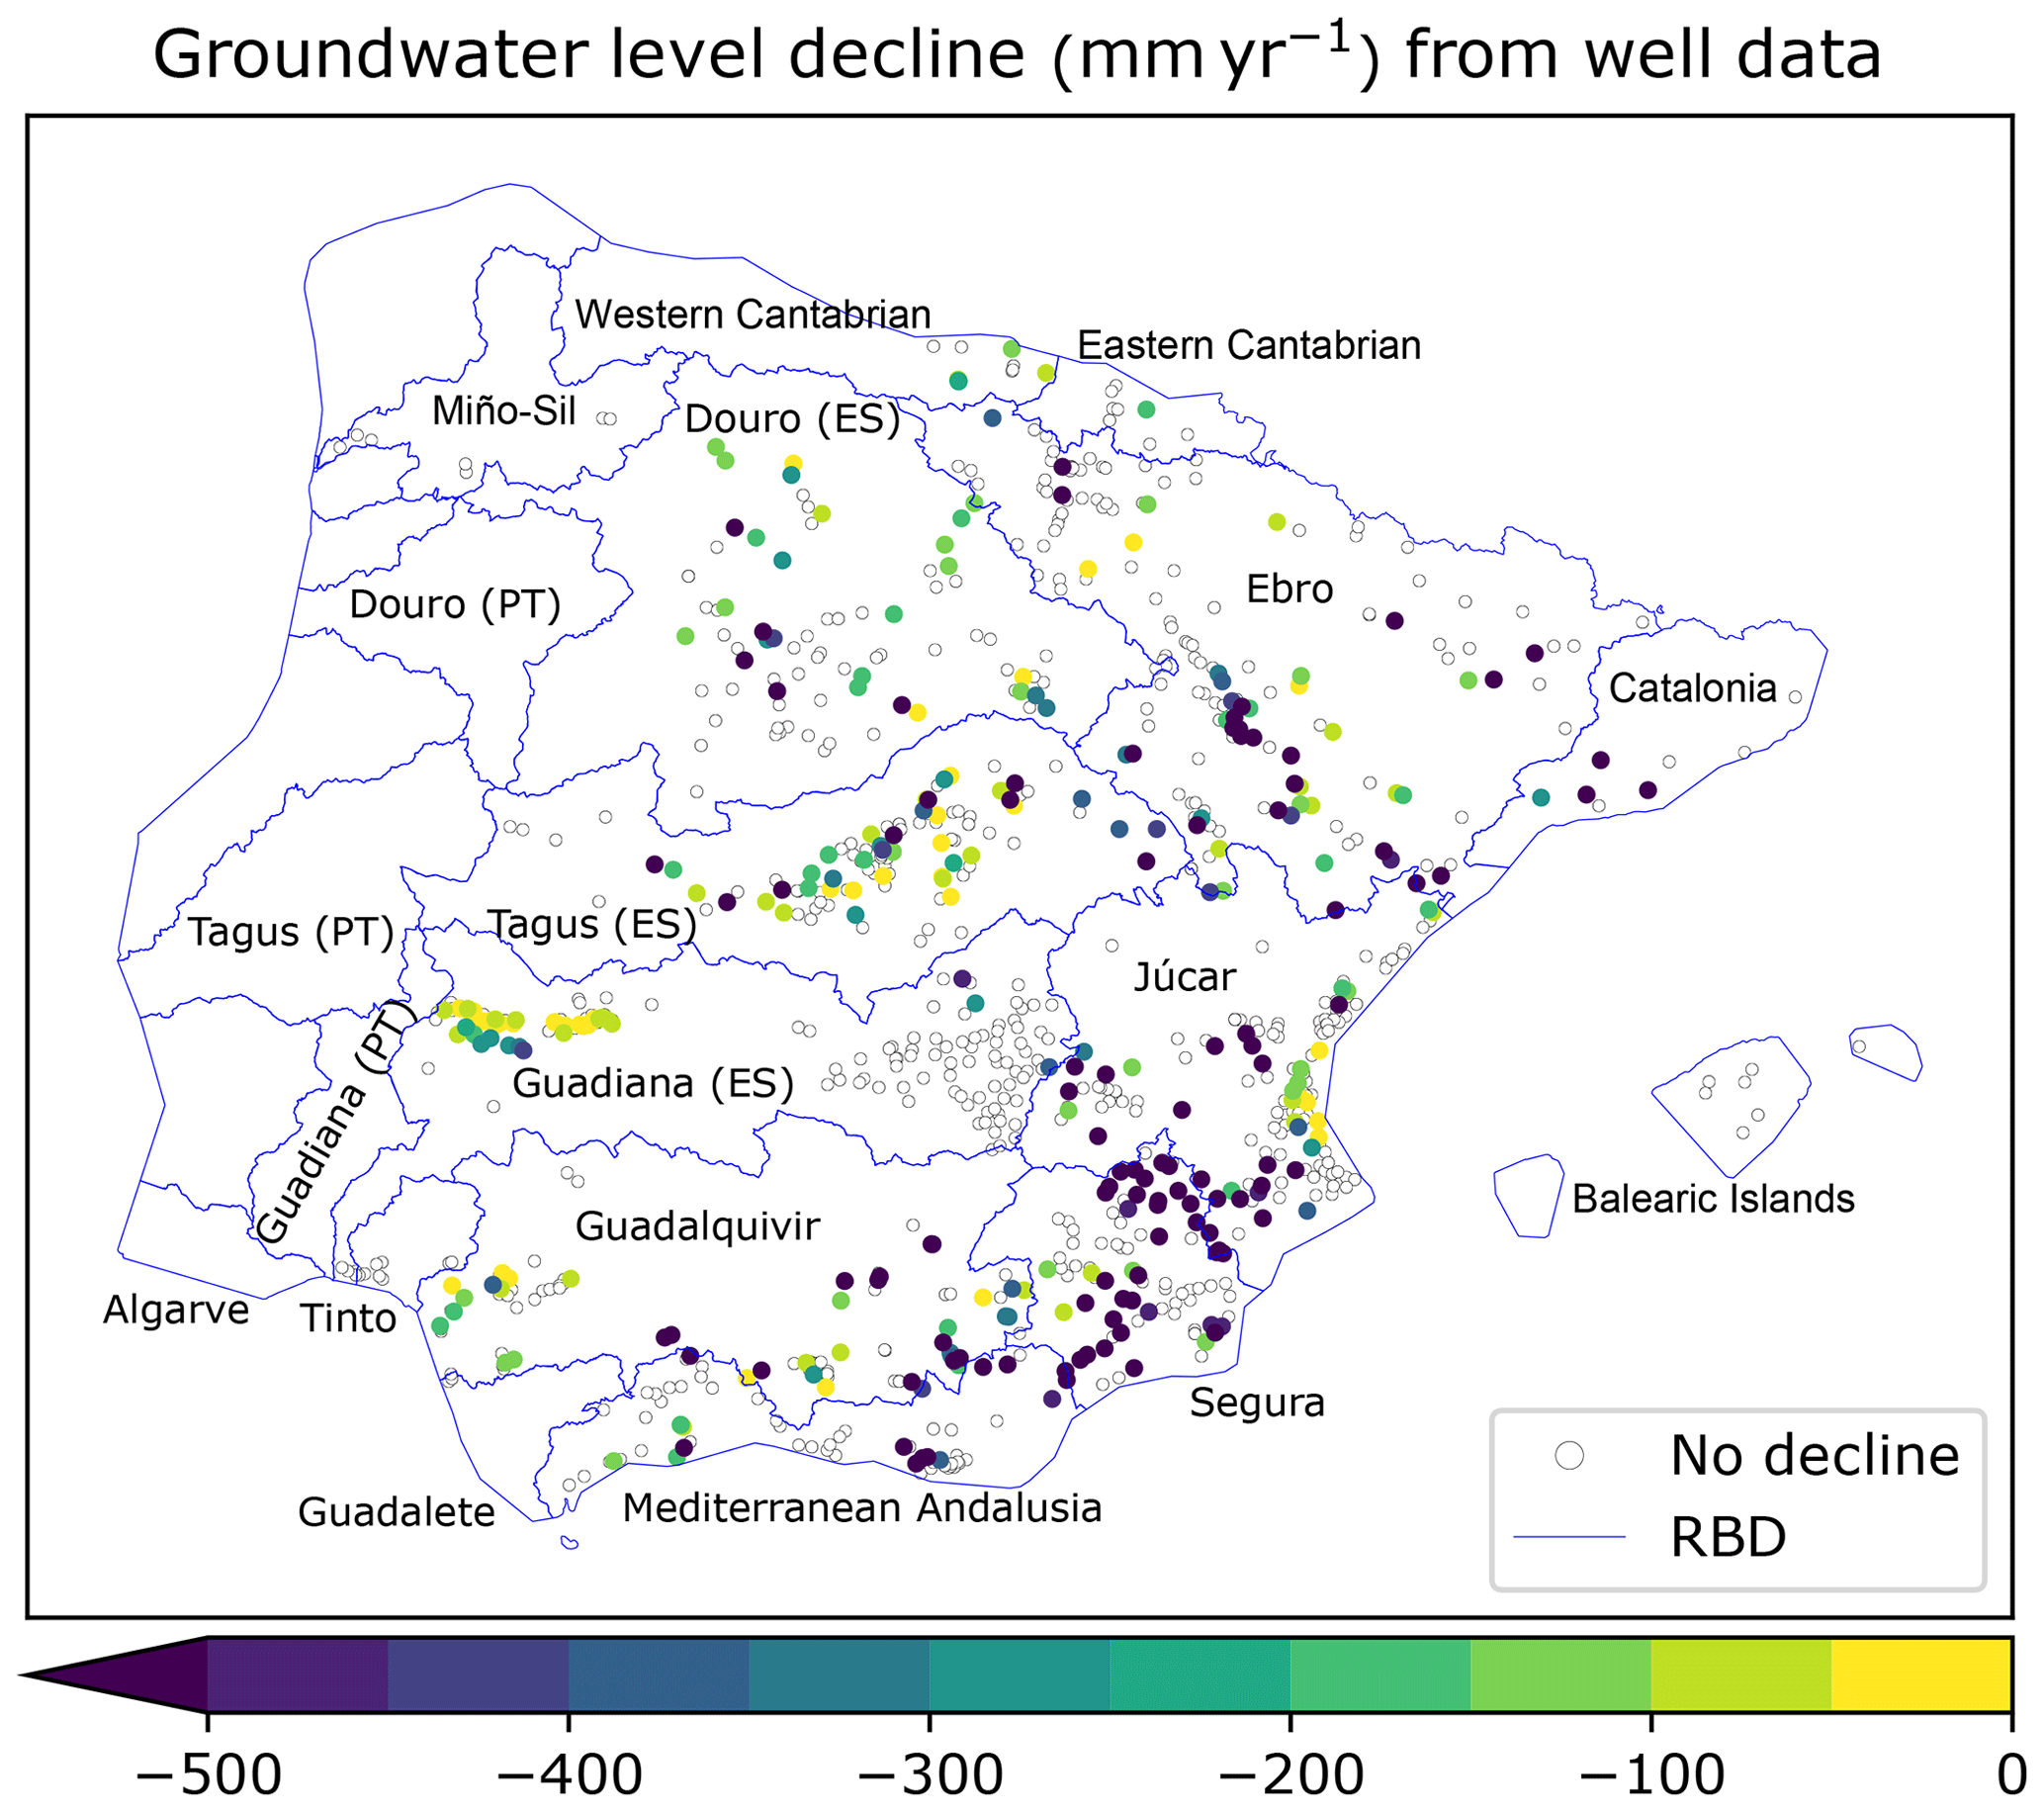
Figure 5Groundwater depletion rates estimated from 1990–2017 reported well measurements (Government of Spain, 2020). Displayed rates are statistically significant linear trend slopes. Iberian Peninsula RBDs are identical to WURs (Fig. 1).
The highest concentration of wells with severe groundwater decline ( mm yr−1) is in south-eastern Spain, spanning several RBDs: Segura, Júcar, and the eastern parts of Mediterranean Andalusia and Guadalquivir. Significant declines also occur in the downstream Guadalquivir. However, relatively few wells are located in its central part, which is extensively irrigated (Fig. 6a), and even fewer fulfil our selection criterion. In the Spanish Guadiana, groundwater declines prevail downstreams, while most upstream selected wells do not show significant drawdowns. By relaxing the well selection criterion to 60 monthly observations, the aforementioned dense cloud of severe decline rates extends the upper Guadiana, and other severely declining wells are flagged in the Guadalete and lower Spanish Guadiana (Fig. S2).
In southern Spain RBDs, where the model simulates groundwater depletion (Fig. 4a), sizeable percentages of selected wells undergo statistically significant groundwater level decline: Segura (45 %), Guadalquivir (41 %), Júcar (29 %), Mediterranean Andalusia (29 %), and Guadiana (25 %); exceptions are the Guadalete and Tinto, where no declining trend is detected at any well. Severely depleting wells are scattered over central and north-eastern Spain, where the model does not simulate depletion. These are located in the following RBDs (percentage of selected wells): Catalonia (50 %), Western Cantabrian (50 %), Tagus (41 %), Duero (33 %), Ebro (32 %), Eastern Cantabrian (12 %); while no declining trend is detected for wells in Miño-Sil and Balearic Islands.
The large difference between depletion rate ranges displayed in Fig. 4a (model-based) and Fig. 5 (well-based) are partly explained by the following factors. While model-based rates are net water storage losses, well-based ones are groundwater table drawdowns through porous media. The latter should be multiplied by aquifer porosity to yield (smaller) net water losses. Yet such losses would reflect local conditions that cannot be easily extrapolated to represent larger areas, without detailed knowledge of aquifer hydraulic properties as well as of groundwater recharge and pumping. Conversely, due to the coarse spatial resolution of abstraction-related model input (Sect. 3.4 and 3.5) and the simplified model representation of groundwater dynamics (Sect. 2.1.1), model-based rates are computed at RBD (WUR) scale and thus cannot be used to detect local drawdowns. These factors, which limit the comparability of model- and well-based groundwater depletion, are discussed in Sect. 5.2 together with uncertainties affecting model representation of groundwater processes in general.
4.3 Regulating groundwater irrigation in the southern Iberian Peninsula
Figure 6 presents the southern Iberian Peninsula domain, where we assess the impacts of restricting groundwater irrigation abstractions to avoid groundwater depletion while trying to minimise severe irrigation shortages, as described in Sect. 2.3.3.
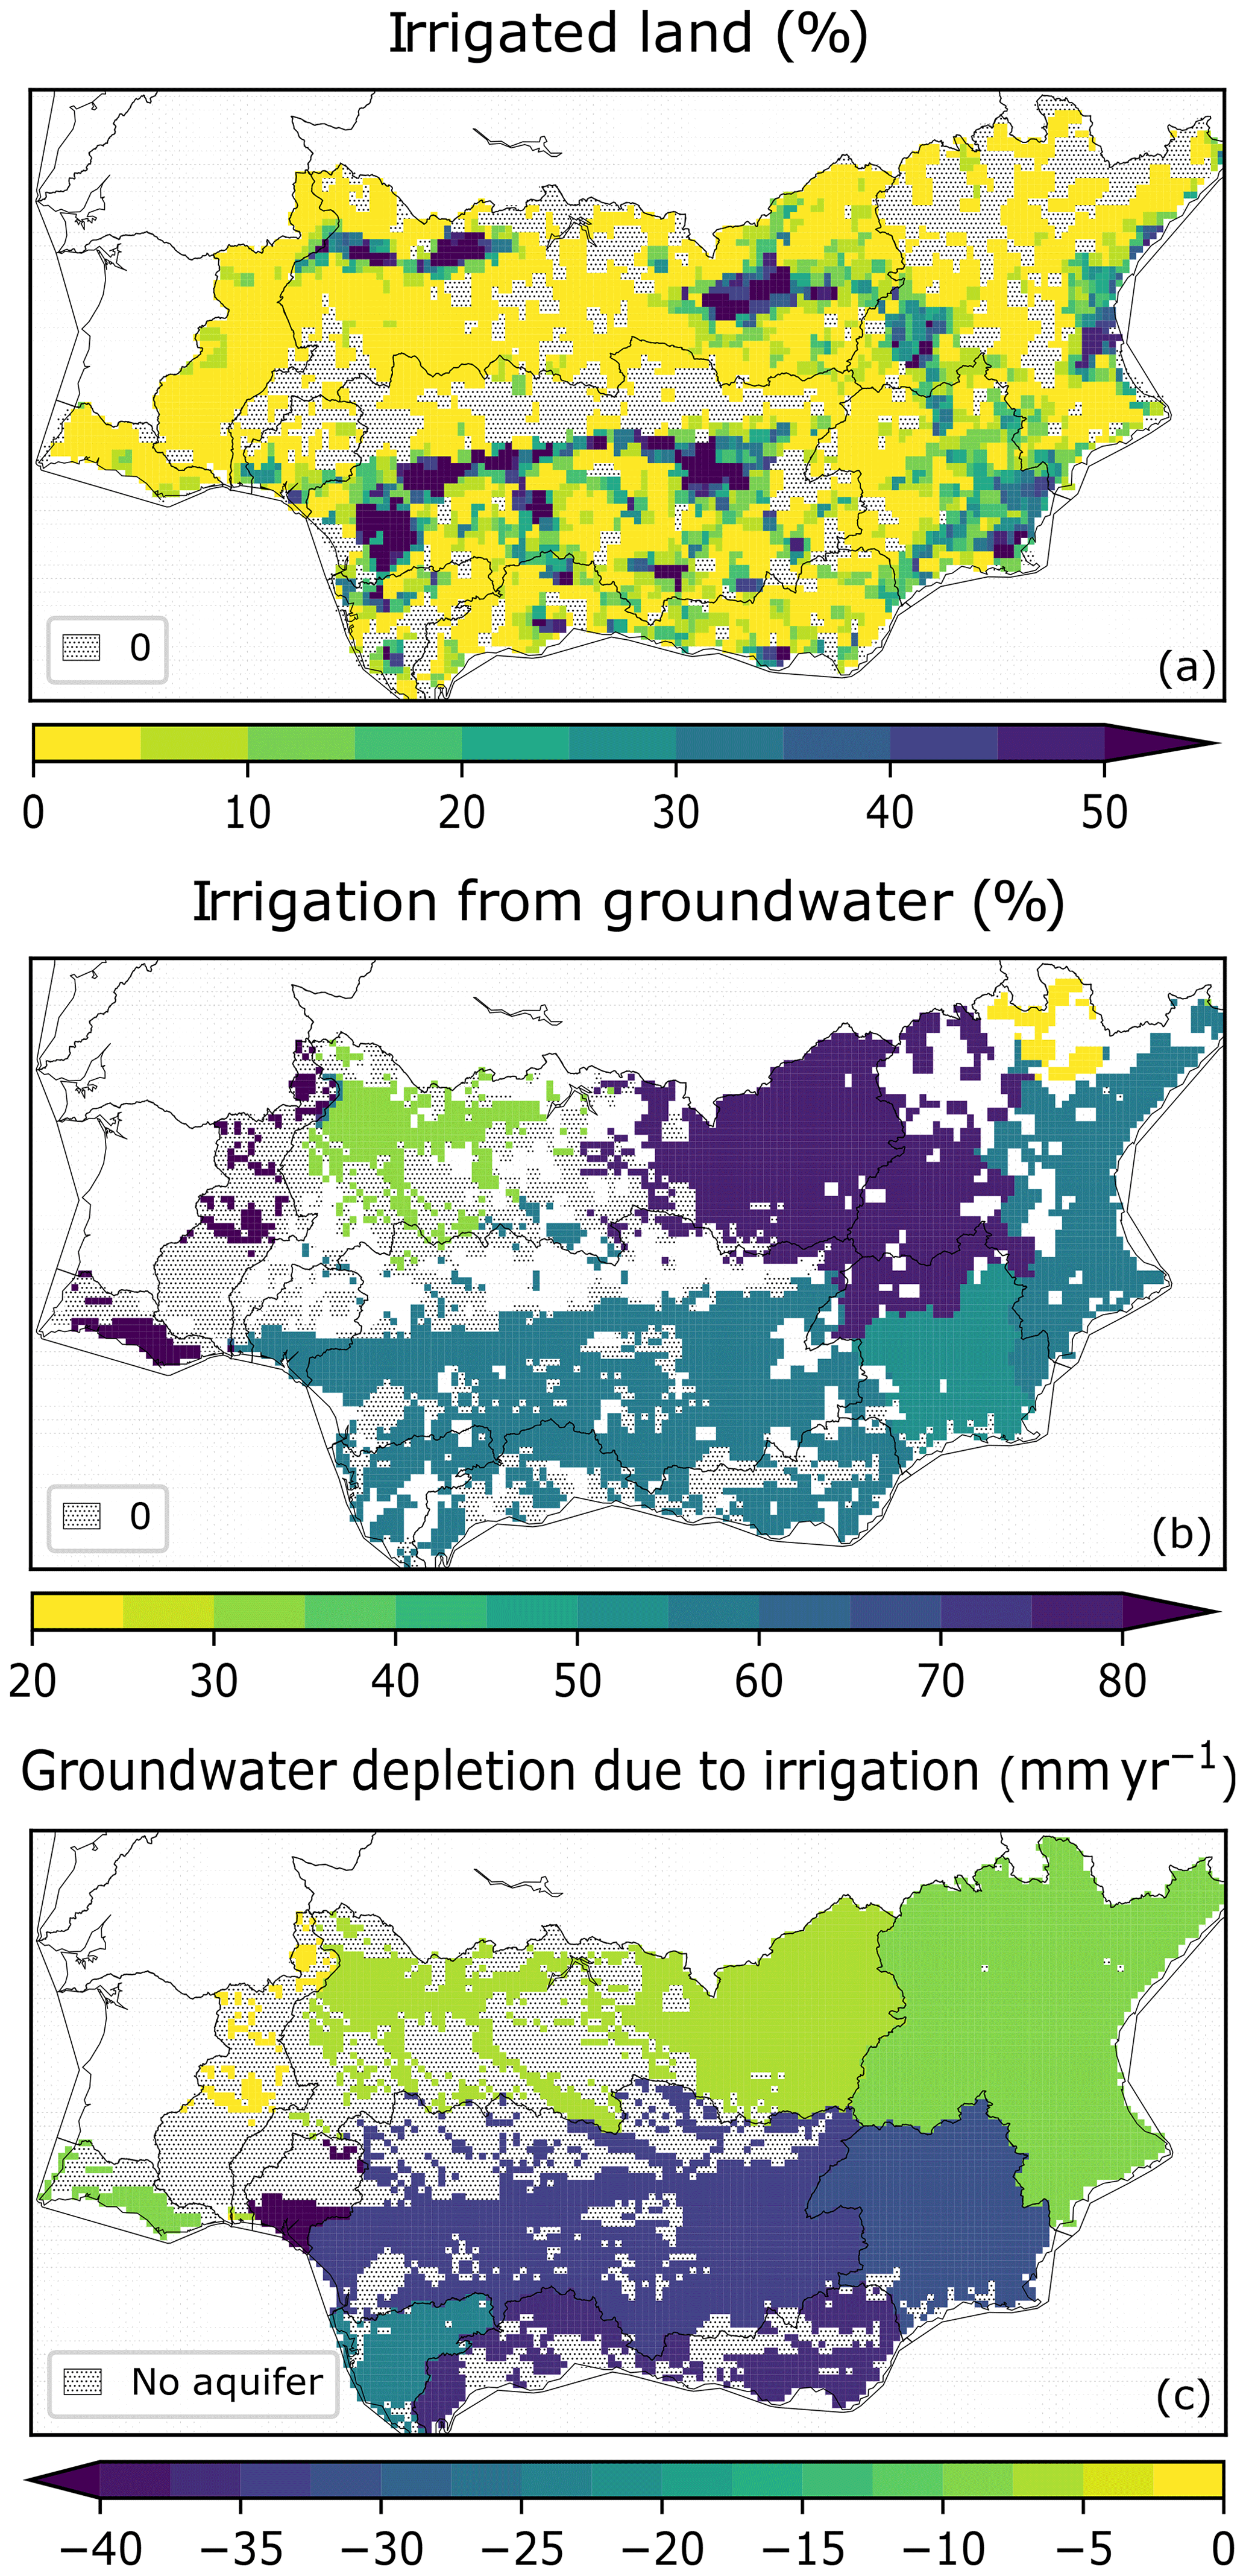
Figure 6The southern Iberian Peninsula model domain where the regulation of groundwater irrigation is tested: (a) map of the irrigated area as a fraction of the total area (Sect. 3.3); (b) the share of irrigation water that is abstracted from groundwater as reported by Eurostat (2020c); and (c) groundwater depletion due to irrigation as simulated by LISFLOOD-EPIC (from Fig. 4b).
The study area consists of RBDs in southern Spain (listed in the caption of Fig. 3) and Portugal (Algarve and Guadiana). Irrigated agriculture is widespread and particularly extensive in the Segura RBD, along the Guadalquivir river, in upper and lower parts of the Spanish Guadiana, and in the lower Júcar (Fig. 6a). More than half of irrigation is supplied by groundwater over 90 % of the domain with exploitable aquifers (Fig. 6b), with the largest values in Castile-La Mancha (75 %), Portuguese Guadiana (85 %) and Algarve (100 %). The resulting simulated groundwater depletions due to irrigation are largest in the southern part of the domain, reaching the maximum value (46 mm yr−1) in the Tinto RBD, followed by Mediterranean Andalusia, Guadalquivir and Segura (Figs. 6c and 4b).
We calibrate groundwater abstraction rules as described in Sect. 2.3.3 over the 1990–2018 period. As the domain consists of 9 WURs (RBDs), 18 decision variables are optimised simultaneously using a genetic algorithm that evolves a population of 200 solutions for 50 generations.
We evaluate the effects of the optimised rules by enforcing them in a 1990–2018 LISFLOOD-EPIC simulation with all model components and water users active. As a result, no statistically significant groundwater depletion is simulated on any WUR. Other impacts of the enforced regulation are discussed in the following.
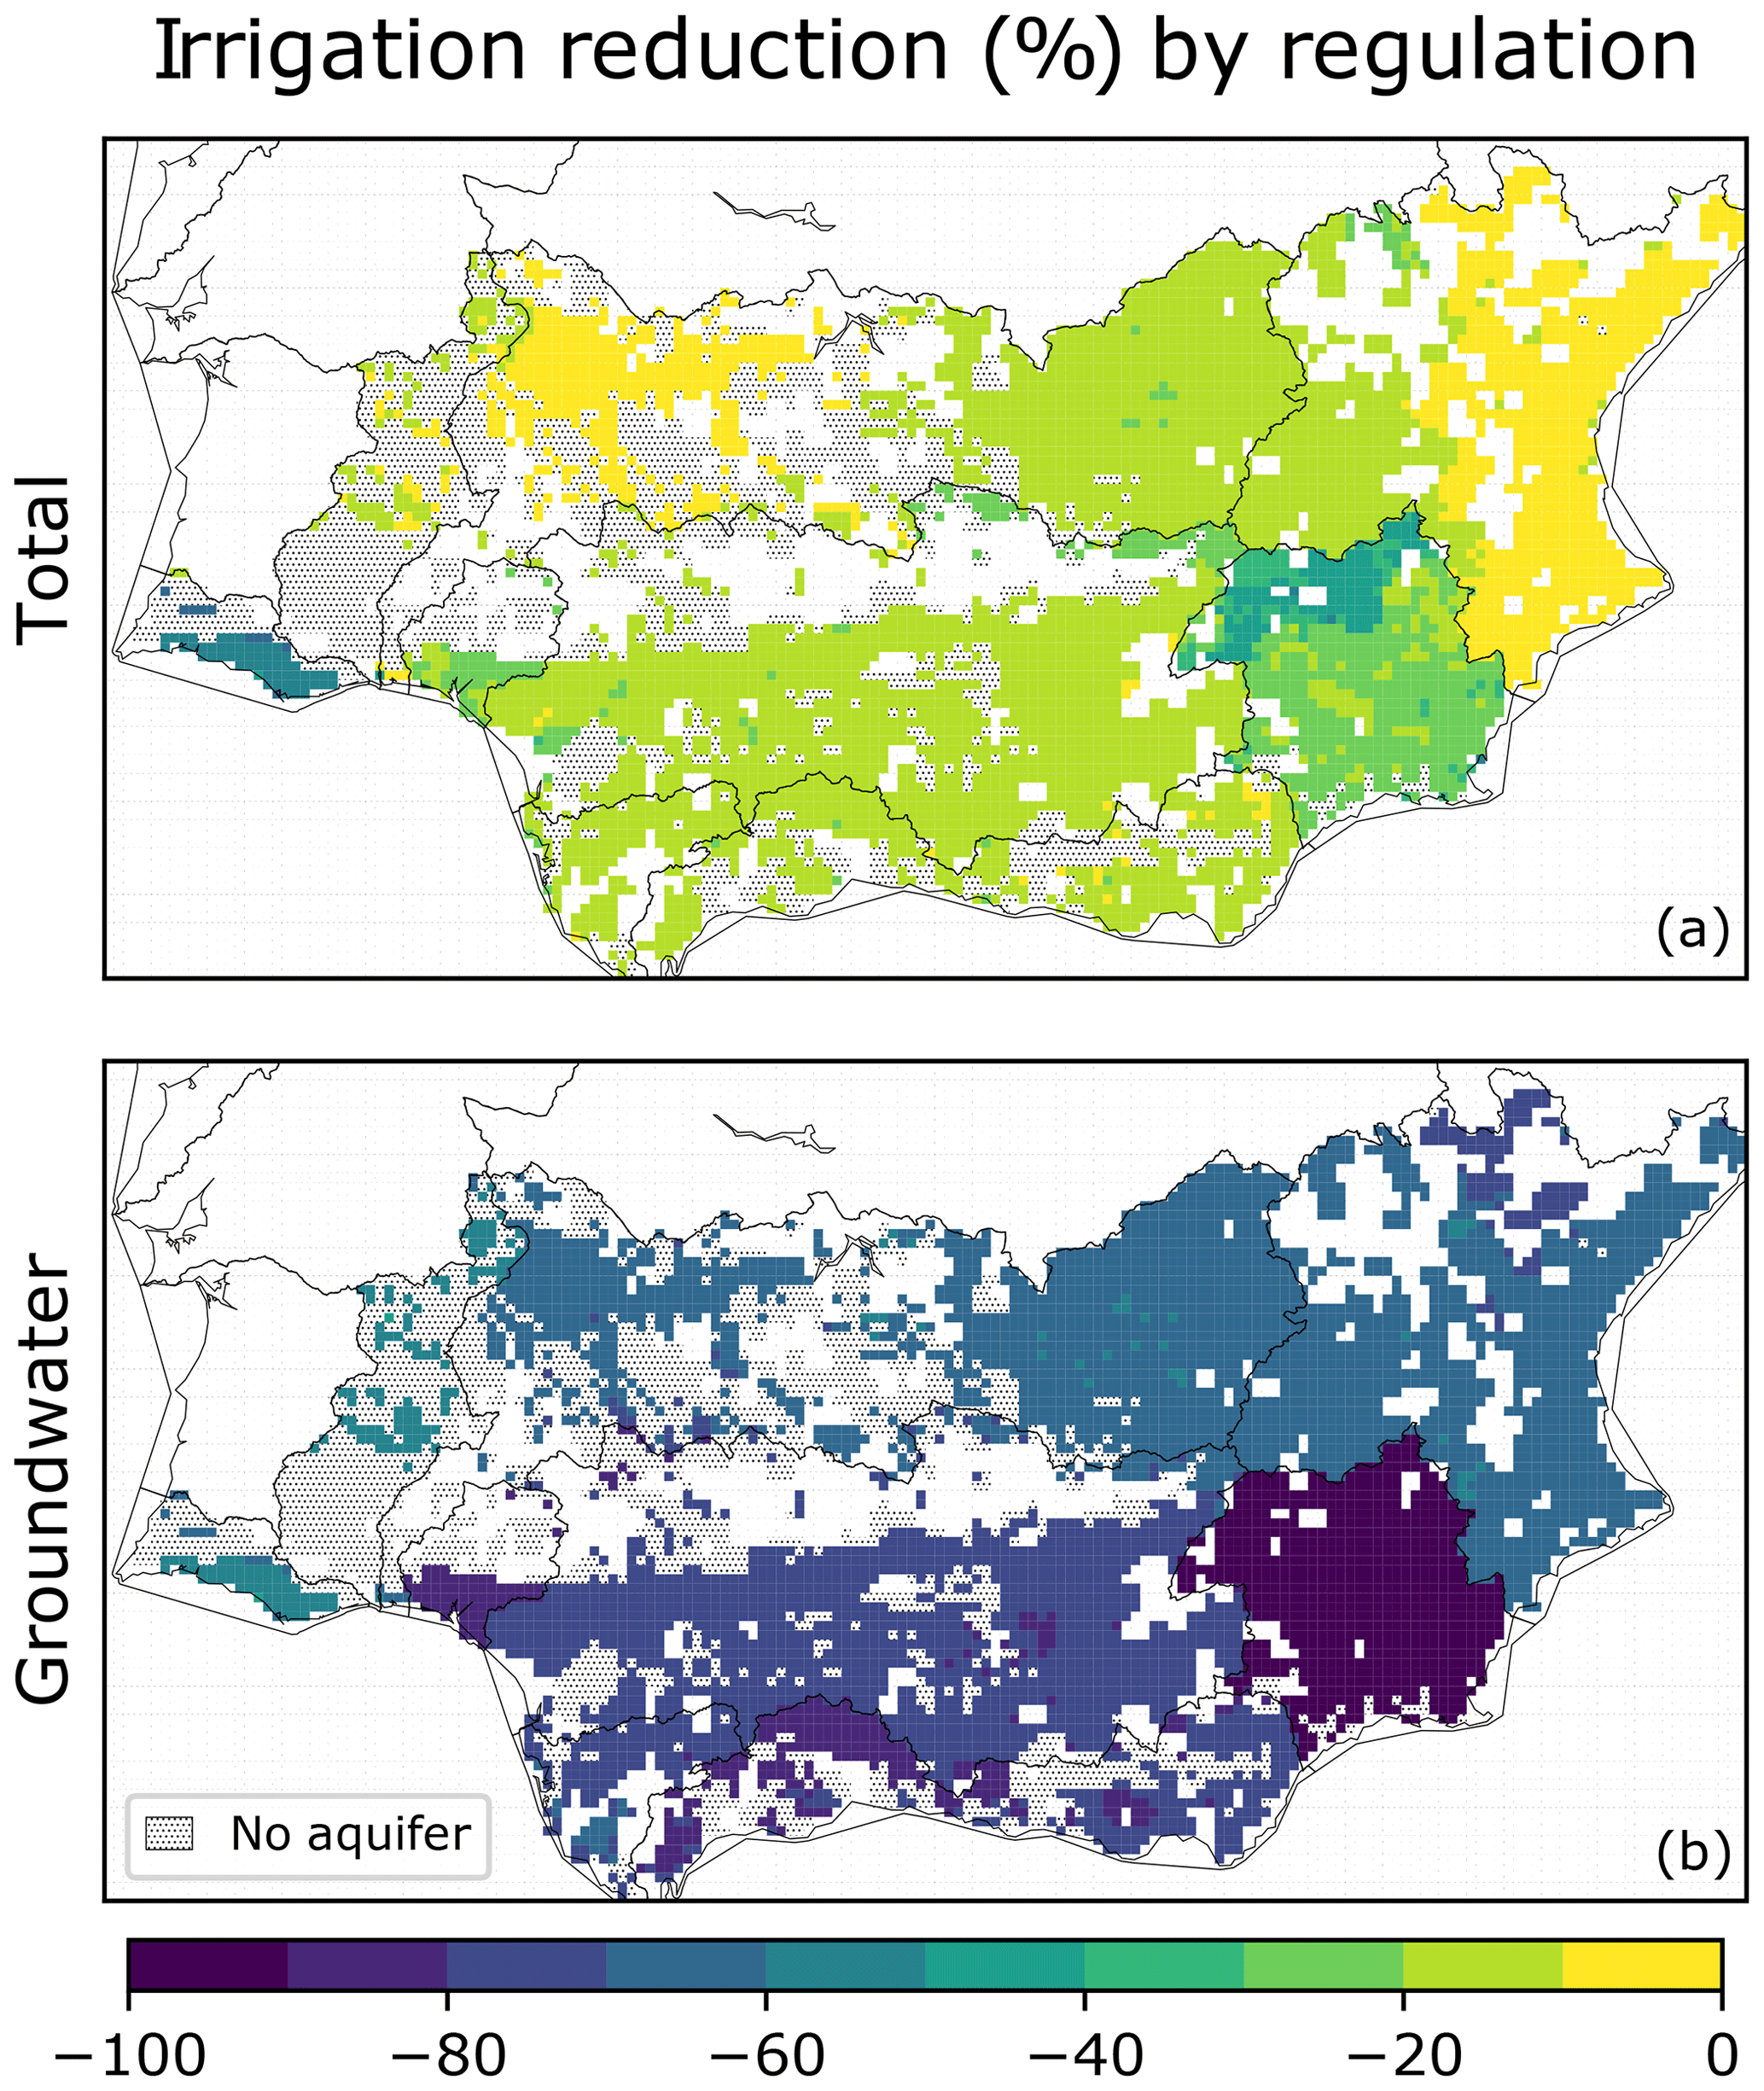
Figure 7Irrigation reduction simulated by restricting groundwater abstraction to sustainable levels in the southern Iberian Peninsula, as compared to unrestricted conditions: (a) total abstractions from surface water and groundwater, and (b) from groundwater only. Displayed reductions are 1990–2018 averages.
Total and groundwater irrigation simulated by limiting groundwater abstractions is compared to those obtained without restrictions (full irrigation) in Fig. 7. In relative terms, groundwater abstraction is reduced the most in the southern part of the domain: in the Segura RBD it is reduced by 97 %, followed by the Tinto (84 %), Mediterranean Andalusia (79 %) and Guadalquivir (78 %) RBDs. The particularly severe Segura reduction is due to the largely negative groundwater balance simulated with full irrigation, as groundwater irrigation more than doubles recharge. In all regulated WURs, average groundwater irrigation abstractions are less than half of unrestricted values.
Total irrigation reduction is largest in Algarve (up to 70 %), followed by Segura, particularly in the upper part, upper Guadiana, western Júcar, Mediterranean Andalusia, lower Guadalquivir, and Tinto (Fig. 7a). This is consistent with the large groundwater dependency of irrigation in Algarve and upper Segura. On roughly half of irrigated areas with active aquifers, total irrigation is reduced by less than 15 %. No reduction is simulated for areas without active aquifers. 65 % of the irrigation deficit caused by regulation occurs during summer (JJA) when crop water requirement is largest. However, significant deficit shares are simulated in autumn (18 %; SON) and spring (12 %; MAM). This is a consequence of calibrating rules to limit the concentration of severe irrigation shortages in critical periods of high demand, and thus to reduce acute plant drought stress.
As irrigation restrictions are irrespective of crop types, we quantify impacts on crop production as average yield anomalies using cultivated areas as weights. Anomalies are percentage losses with respect to the full irrigation simulation. As expected, the spatial pattern of irrigated crop yield loss (Fig. 8b) resembles that of total irrigation reduction, with 0.90 correlation. The impact on total crop yield is mitigated by rainfed production, which is not affected by regulation (Fig. 8a). The largest total yield anomalies occur in areas that are extensively irrigated or affected by large abstraction reductions: most of Segura, and parts of Mediterranean Andalusia, Guadalquivir and Algarve RBDs.
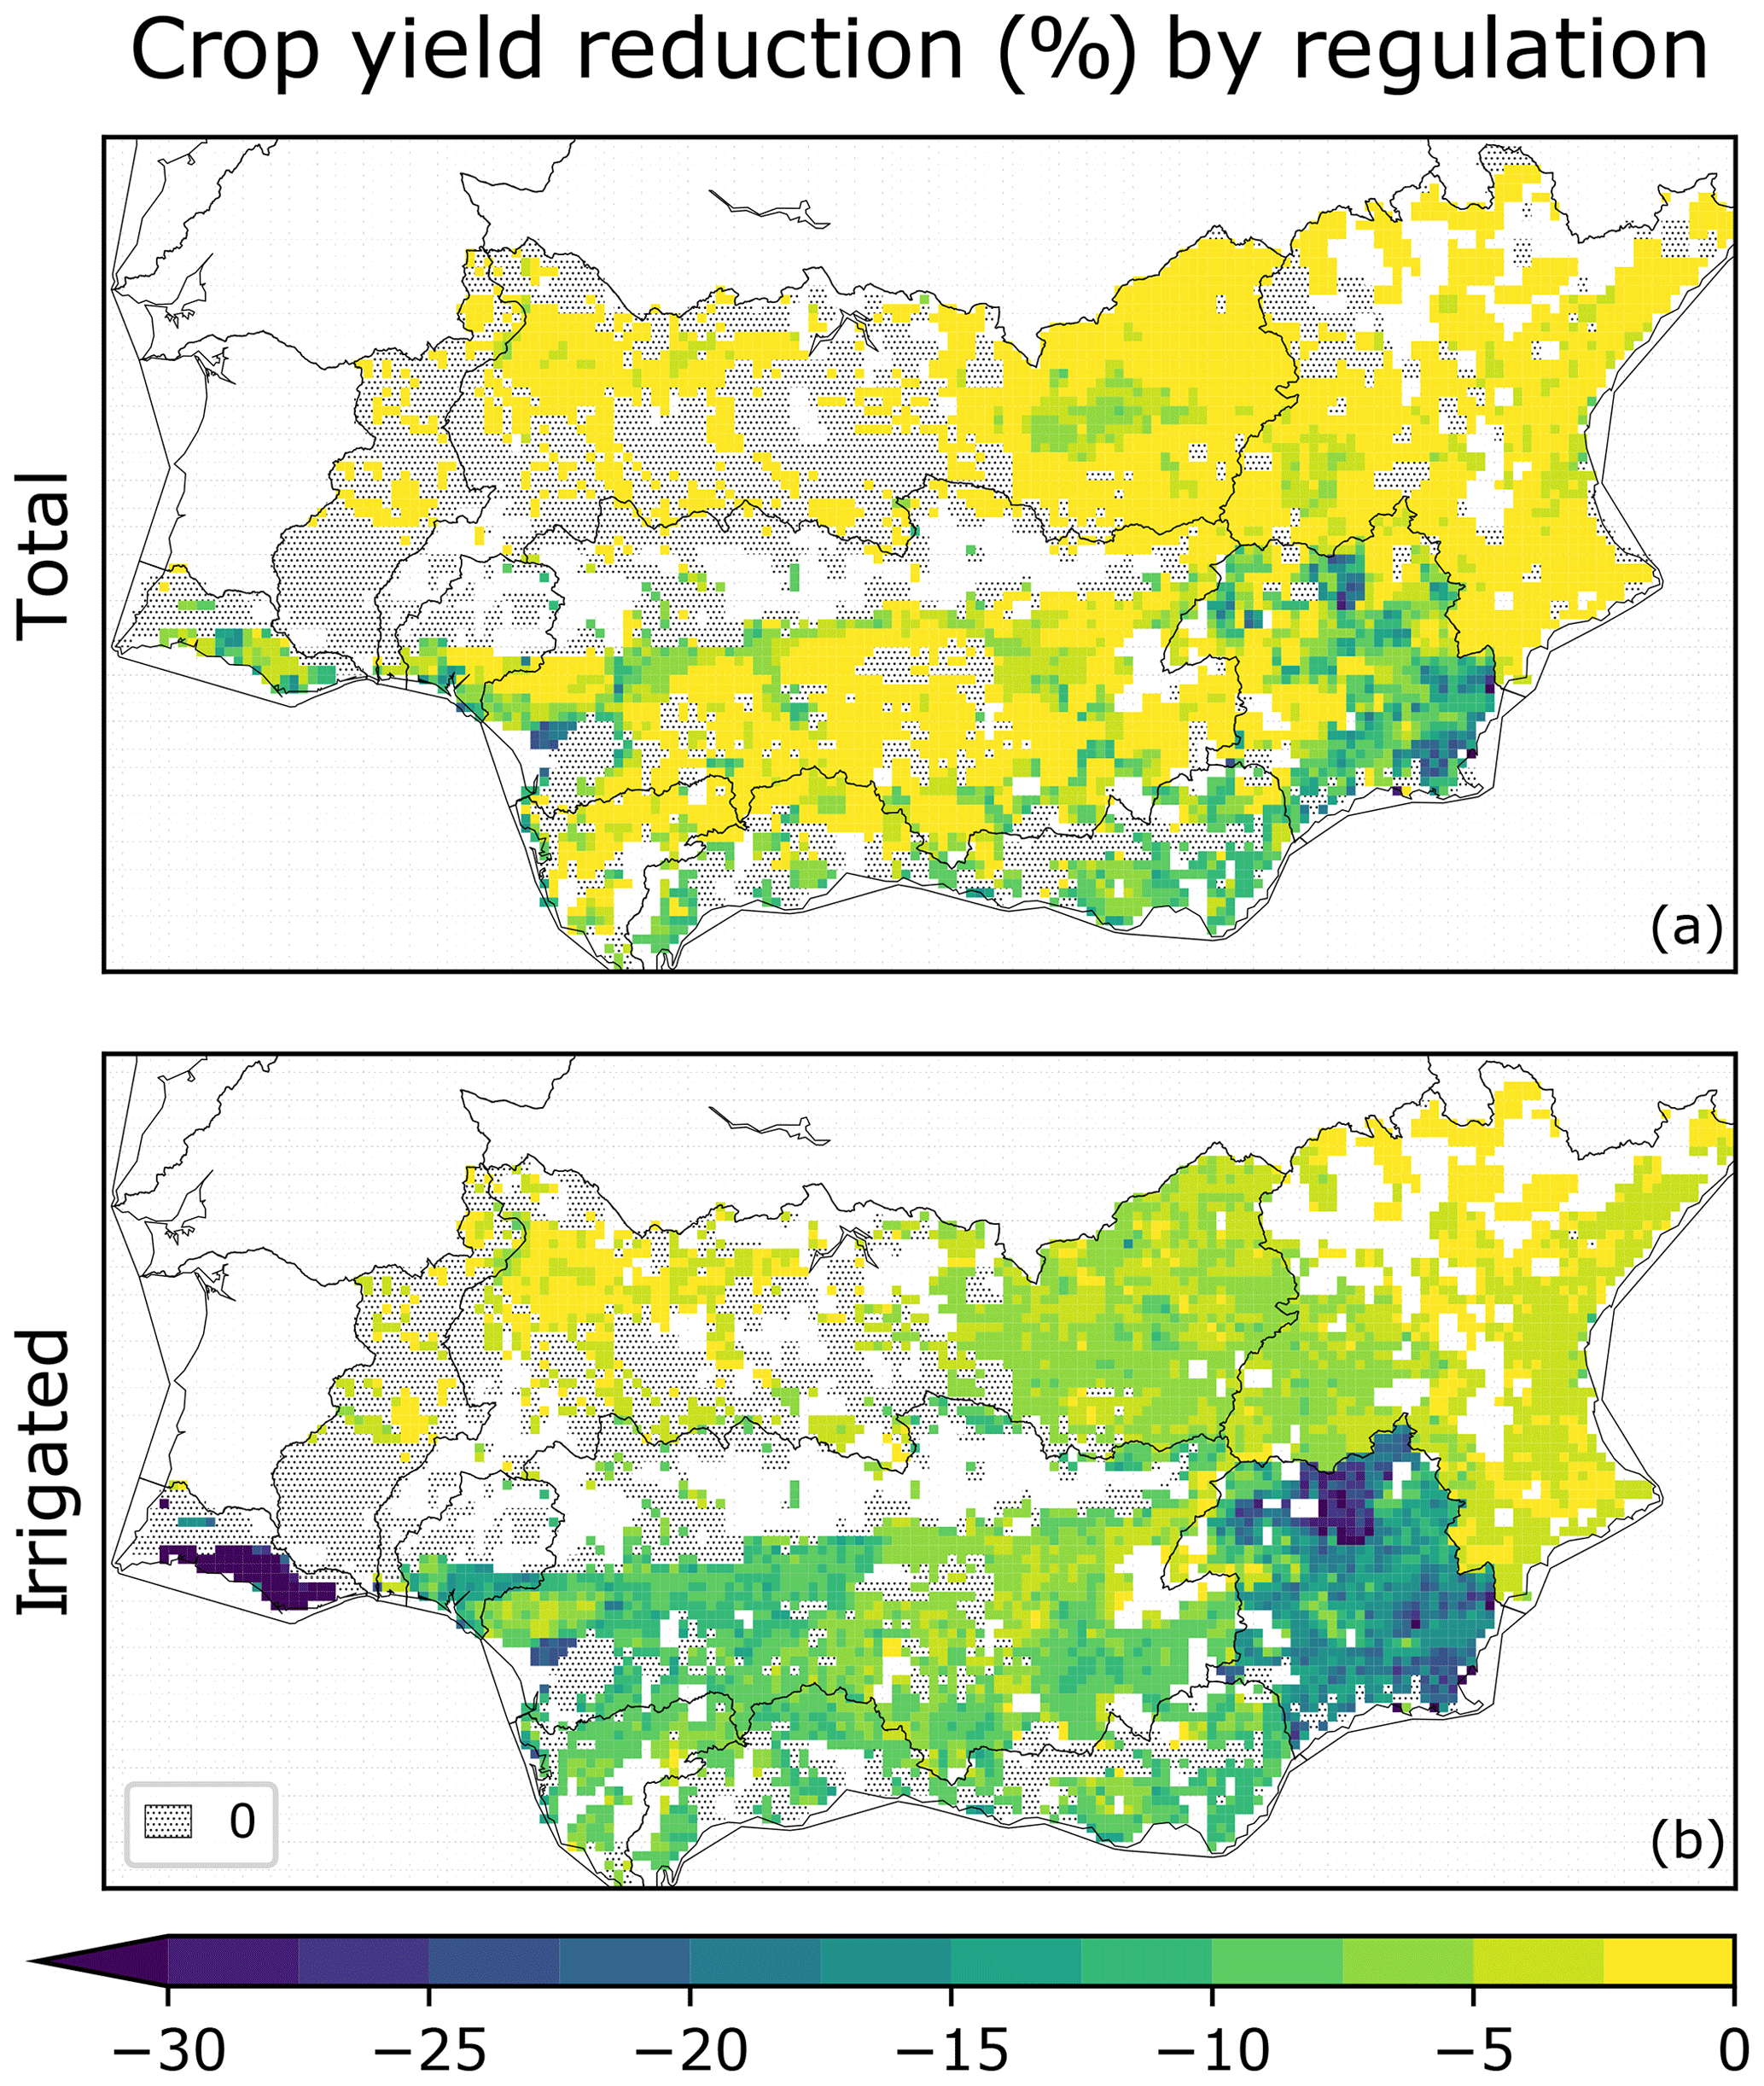
Figure 8Estimated reduction of crop yield caused by the restriction of groundwater irrigation abstraction to sustainable levels in the southern Iberian Peninsula: total (a) and irrigated (b) crop yield. Displayed reductions are 1990–2018 weighted averages, using cultivated areas of modelled crop types as weights.
Groundwater drainage contributes to baseflow, which is the streamflow component sustaining ecosystems during dry periods. Groundwater depletion increases the occurrence frequency of extremely low flows that may not provide sufficient ecosystem support. This effect of groundwater depletion is represented in the model by assuming that baseflow is proportional to groundwater storage if the latter is above a threshold level, below which baseflow stops (Sect. 2.1.1). On each grid-cell, low flows are defined as values below a minimum environmental flow threshold, which we set to the 0.1 quantile of the local daily streamflow frequency distribution under rainfed conditions (allowing all water withdrawals except irrigation, as described in Sect. 2.3.2). We use a simple hydrological approach to minimum environmental flows (Tharme, 2003), as detailed data about local morphology and ecosystem requirements, which are needed for more sophisticate methods (Pastor et al., 2014), are not available in a consistent fashion at the scale of our application domain.
The beneficial effect of regulation on baseflow is quantified by comparing low flow frequencies obtained by regulating groundwater irrigation with those simulated with full irrigation: we use the absolute difference between these frequencies as indicator of the improvement in environmental flow support (Fig. 9). We look at grid-cells with upstream catchment areas of at least 500 km2 to analyse the impact on the more sizeable segments of the river network. Decreases beyond 5 % are simulated for most selected grid-cells, except those hydrologically influenced by areas not irrigated with groundwater, most notably in the lower Guadiana, Tinto, and the Guadalquivir northern tributaries. The largest decreases are simulated in areas where extensive groundwater irrigation is regulated restrictively: the upper Guadiana, the southern tributaries of the Guadalquivir, parts of the Júcar and the upper Segura RBD.
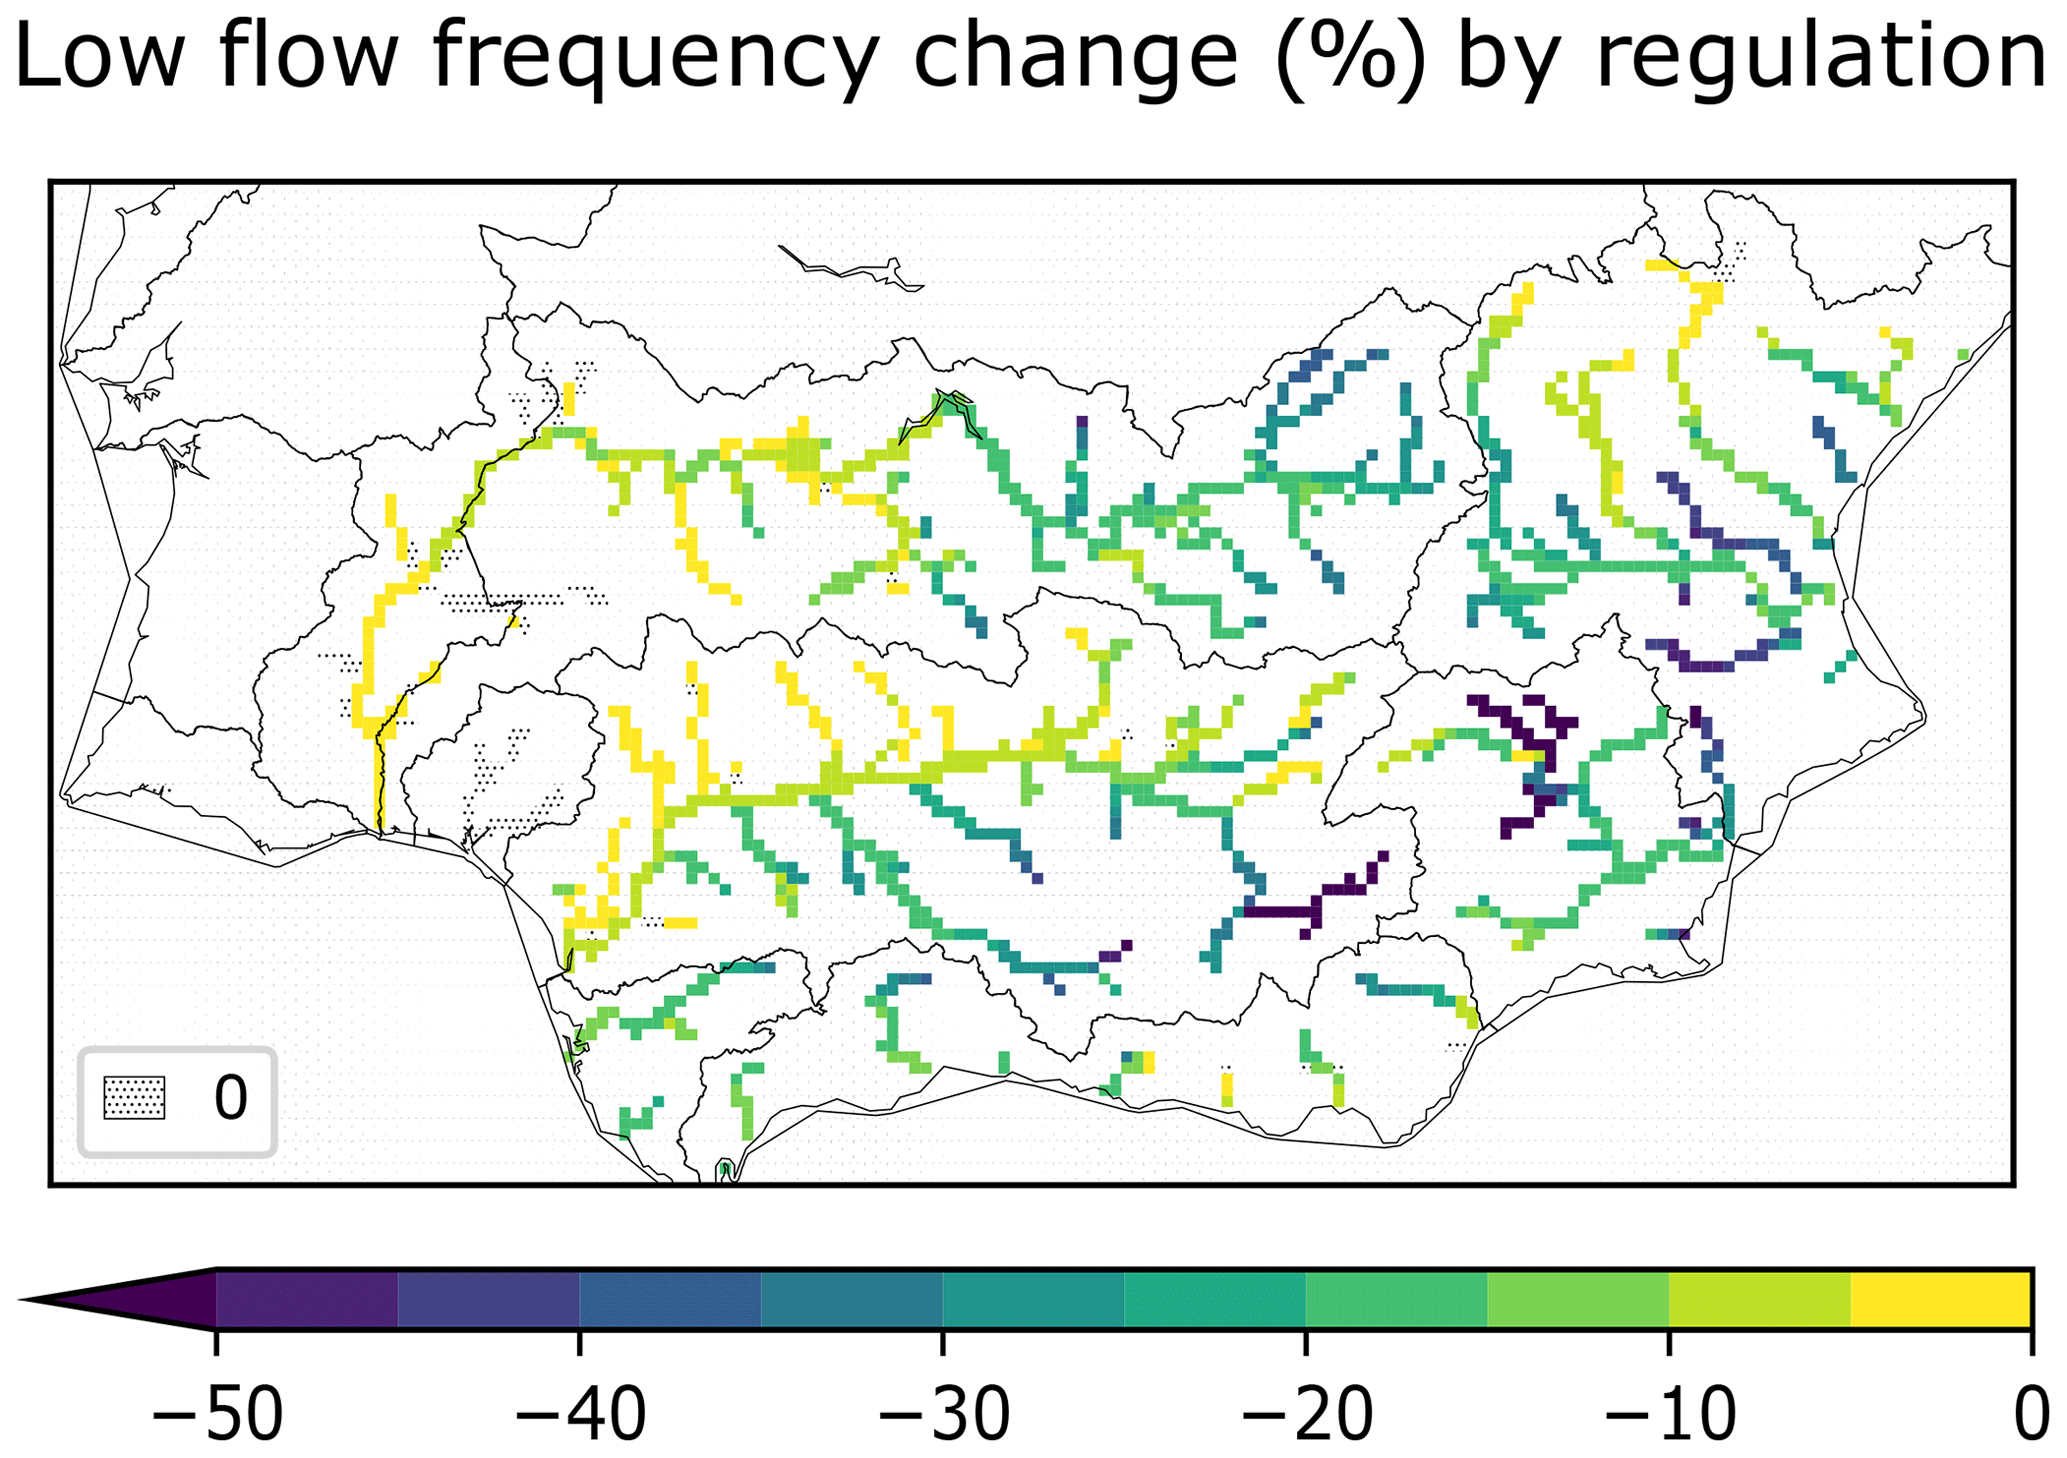
Figure 9Absolute change in low flow occurrence frequency simulated by reducing groundwater irrigation abstraction to sustainable levels, with respect to full irrigation. Reduced frequency indicates improvement. Changes are computed over the 1990–2018 period for grid-cells with upstream areas of at least 500 km2.
The tested abstraction rules show how an integrated agro-hydrologic model can be used to explore potential large-scale trade-offs between crop production, sustainable exploitation of groundwater, and safeguarding environmental flows.
To assess groundwater irrigation sustainability and the potential agro-hydrologic impacts of its enforcement, we apply an integrated model of hydrology, crop growth and irrigation. In light of the heterogeneous availability of groundwater irrigation data in the Euro-Mediterranean region (Sect. 4.1), we argue that integrated agro-hydrologic models are useful tools for simulating water requirement and crop production driven by scenarios of climate, land use, crop distribution, irrigation practices, and water management policies. However, such models are affected by several uncertainties that need to be taken into account when simulating historical and future conditions.
In the following, we discuss the uncertainties affecting the results of this modelling study and propose possible research directions to cope with them: Sect. 5.1 deals with simulated and reported irrigation groundwater abstractions; in Sect. 5.2, we discuss limitations of the current LISFLOOD-EPIC groundwater scheme, and how these affect model-based groundwater depletion estimates; and in Sect. 5.3, we discuss assumptions underlying the tested groundwater irrigation regulation.
5.1 Groundwater irrigation
Model estimates of groundwater irrigation abstraction are evaluated against reported values in Sect. 4.1.1. The comparison shows several cases where model estimates are fairly unbiased or well correlated with respect to reported data, e.g. in France and parts of Portugal, Spain and Greece. However, it also highlights some structural discrepancies, among which the most remarkable is the model overestimation of large reported values in Spain, especially in the South, and Greece. Another discrepancy is the smaller inter-annual variability of model estimates compared to reported data in Turkey and Portugal at country level, which is the reporting level with the longest available time series. In an opposite fashion, in Greece, Croatia and Czech Republic, some reported time series feature several repetitions, while model estimates are time-varying. We hypothesise that these structural discrepancies are caused by uncertainties in model assumptions, input data and reported abstractions.
The following assumptions may partly explain model overestimations: triggering irrigation whenever plants undergo transpiration deficit, thus not limiting irrigation frequency; and abstracting water amounts that completely fulfil irrigation requirements, conditioned on freshwater availability (Sect. 2.1.3). As such assumptions are motivated by the lack of systematic continent-wide information about irrigation regulations or practices, they constitute an example of intertwined model and input data uncertainty. Other uncertainties of this kind derive from using spatially coarse administrative-level statistics to partition water abstraction among surface water and groundwater sources (Sect. 3.4 and 3.5); and from assuming that withdrawals from groundwater are pumped on the same grid-cell where the requirement is located, while those from surface water are distributed within each WUR (Sect. 2.1.4). These assumptions are due to the lack of detailed data on location and type of water sources used to supply spatially distributed water users simulated by the model.
Major input data uncertainties derive from the lack of extensive and frequent data about structural parameters such as irrigated area, and irrigation system and crop distribution, which are therefore assumed not to change in time. In particular, cropland extents irrigated with groundwater are reported implicitly by Eurostat only for one year (Sect. 4.1). As a result, fluctuations in simulated abstractions reflect climate variability but not changes in these structural parameters that have large impacts on irrigation water use. On top of negatively affecting the abstractions comparison at large, these uncertainties may partly explain the observed smaller variation ranges of simulated compared to reported values.
Possible large unreported abstractions might explain part of model overestimations in countries where groundwater irrigation is significant, as for example in Spain (Custodio et al., 2009; Fuentes, 2011) and Greece (EASAC, 2010). Moreover, the above-mentioned instances of repeated volume reporting let us raise the question of whether some reported volumes are based on estimates rather than actual measurements. However, the generally unfrequent reporting of (groundwater) irrigated areas, especially their even less frequent simultaneous reporting with abstracted volumes, hinders the identification of the drivers of reported abstraction variability.
To reduce uncertainties affecting irrigation groundwater abstraction estimates, we believe that efforts should be aimed at collecting data on irrigated areas, irrigation technologies and regulations, and water distribution networks. In particular, newly collected data should have higher and more consistent temporal and spatial resolutions over the whole Euro-Mediterranean region than those currently available. Where feasible, remote sensing retrievals could be used to complement reported data, especially if availability of the latter is limited by confidentiality constraints.
5.2 Groundwater depletion
Uncertainties affecting model estimates of groundwater depletion are revealed by discrepancies with respect to decline rates computed from well measurements in Spain (Figs. 4a and 5, Sect. 4.2): the most severe well-based depletion rates are roughly an order of magnitude larger than model-based ones; and large groundwater drawdowns are detected in wells of central and north-eastern Spain, where no statistically significant depletion is computed from simulations.
These discrepancies are partly explained by fundamental differences between depletion definitions: model-based values are net water loss rates computed from groundwater storages averaged over large areas (RBDs/WURs); while well-based values are groundwater table level decline rates, thus including the soil matrix, computed from point measurements. Therefore, in contrast with well-based estimates, model-based values are representative at larger spatial scales and thus cannot detect localised depletions; and, while not amounting to groundwater table lowerings, they represent water storage volume losses. In fact, to extrapolate comparable water volume losses from well measurements of groundwater table depth, high resolution hydrogeologic modelling may be necessary as well as detailed data on aquifer properties and management (pumping).
Spatial averaging of simulated groundwater storages is motivated by the lack of fine scale input data on groundwater abstraction and distribution and by simplified model descriptions of groundwater processes. The groundwater component of LISFLOOD-EPIC is designed to represent large scale groundwater balance dynamics rather than small scale processes and heterogeneities. The simplified volume-based modelling approach (Sect. 2.1.1) is in turn motivated by the already mentioned lack of detailed data on human alterations of groundwater, which are the main object of our research. As input data issues are treated in Sect. 5.1, here we discuss groundwater model limitations, which are among the underlying reasons for simulating changes in groundwater storage volume but not in groundwater table depth.
Not simulating groundwater table depth with respect to topography or riverbed elevation, we do not explicitly model groundwater recharge from surface water bodies nor capillary rise from groundwater to unsaturated soil, and groundwater drainage to rivers is function of groundwater storage. Moreover, lateral groundwater flow between neighbouring grid-cells is simulated via a spatial smoothing process, not accounting for aquifer characteristics such as porosity and hydraulic conductivity.
These simplifications hinder model-based estimation of groundwater depletion rates at high spatial resolution, and therefore comparability with well-based estimates. They could be overcome by replacing the current groundwater scheme with, for example, a diffusive model (Vergnes and Decharme, 2012; Vergnes et al., 2014), or following one of the approaches reviewed by Collins (2017). However, the effectiveness of more sophisticate groundwater models will depend on the availability of detailed data on aquifer characteristics and exploitation.
5.3 Sustainable groundwater irrigation
Agro-hydrologic impacts of restricting groundwater irrigation to sustainable levels are simulated for the southern Iberian Peninsula (Sect. 4.3). They are assessed by enforcing abstraction rules optimised to avoid irrigation-induced groundwater depletion and minimise severe irrigation deficits. Ensuing reductions in crop yield and occurrence of low river flows are used to quantify detrimental and beneficial effects, respectively. Scope and results of this assessment are influenced by assumptions underlying the simulated water abstraction regulation, which are discussed in the following.
We optimise groundwater irrigation restrictions without altering surface water abstraction rules, thus constraining the operating space of irrigation regulation to groundwater. Compared to our approach, more efficient trade-offs between crop production and irrigation sustainability might be achieved by optimising abstractions from both groundwater and surface water bodies, including operations such as managed aquifer recharge (Taylor et al., 2012; Scanlon et al., 2016; Tian et al., 2018). Moreover, this broader framing of the irrigation sustainability problem would allow to include environmental flow preservation explicitly among the regulation objectives (Gleeson and Richter, 2018).
Key factors driving irrigation water use and agricultural production such as land allocation and irrigation efficiency are assumed not to change in the presented optimisation. To evaluate a broader range of pathways to irrigation sustainability, change scenarios of crop and irrigation system distributions (e.g. Jägermeyr et al., 2016; Davis et al., 2017) could be used as boundary conditions for several irrigation abstraction optimisation exercises.
In this study, we show how the integrated model of hydrology, water resources management, irrigation and crop growth LISFLOOD-EPIC can be used to evaluate large-scale irrigation-driven pressures on groundwater, identify unsustainable aquifer exploitation, and assess agro-hydrologic impacts of irrigation restrictions aimed at avoiding groundwater depletion.
We present an assessment of groundwater irrigation sustainability in the Euro-Mediterranean region. Groundwater, due to its steadier reliability compared to surface water, is often used to buffer drought impacts on human water uses. This is particularly relevant in the Mediterranean region, where climate change is causing increasingly frequent and severe droughts and irrigation is the largest water user. Therefore, we focus our assessment on groundwater abstraction for irrigation, using groundwater depletion as indicator of unsustainable water resources exploitation.
To characterise the current situation, we analyse reported and simulated values of groundwater abstraction for irrigation and of groundwater depletion for the 1990–2018 period. We argue that the available reported data are insufficient to evaluate the impacts of groundwater irrigation, due to their generally limited temporal and spatial coverage. Therefore, areas affected by unsustainable groundwater irrigation are identified by estimating groundwater depletion rates from model simulations. Among such areas, we choose the southern Iberian Peninsula to simulate the potential agro-hydrologic impacts of restricting groundwater irrigation to sustainable levels.
To assess how LISFLOOD-EPIC represents the current quantitative pressure on groundwater, we compare simulated and reported groundwater abstractions for irrigation. While simulated and reported values compare fairly well in some areas, e.g. in France and parts of Portugal; in several areas with large irrigation groundwater use such as Greece and southern Spain, simulated values are significantly and consistently larger than those reported. In other cases, simulated inter-annual variability tend to be smaller than reported, as for example in Portugal and Turkey. We argue that these discrepancies are caused by simplified model assumptions about key factors such as frequency and amount of irrigation applications, and the partitioning of abstractions among neighbouring surface water and groundwater bodies. These assumptions are motivated by the scarce reporting, or even complete lack in some cases, of relevant information in a consistent fashion across the Euro-Mediterranean region. Also due to data unavailability, model simulations are carried out by assuming spatial distributions of irrigated cropland and irrigation systems not to change in time, thus further limiting the comparability of simulated and reported abstractions.
Uncertainties do not arise exclusively from model assumptions and input, but also from reported abstraction data: the possibility of unreported abstractions is acknowledged in the literature for areas with large groundwater use for irrigation; and the repeated values found in some time series pose the question of how reported figures are calculated. Moreover, the unfrequent joint reporting of irrigation water volumes and areas hinders the identification of the drivers of abstraction variability. We believe that the intertwined uncertainties revealed by this comparison should be addressed by enriching the available information about irrigation and water abstraction and distribution systems.
Based on LISFLOOD-EPIC simulations, we can detect areas where groundwater is exploited unsustainably and identify to which extent the modelled water usages (irrigation, household, industrial and livestock) cause groundwater depletion. In the southern Iberian Peninsula, parts of Greece, and over most of Middle East and northern Africa, depletion can be mostly attributed to irrigation. In Sicily, Cyprus and parts of Greece, depletion is caused by the combination of all water uses. In southern Spain, especially in the south-east, well measurements of groundwater table depth show significant depletion. Also central and north-eastern Spain feature several depleting wells, but are not identified as undergoing depletion by the model.
An example assessment of the agro-hydrologic impacts of restricting groundwater irrigation to sustainable levels is carried out in the southern Iberian Peninsula. We simulate detrimental and beneficial effects in terms of crop yield losses and reduction of extremely low streamflow occurrence frequencies. The scope of the presented impact assessment could be broadened by optimising groundwater and surface water operations jointly, and by considering changes in other major drivers of irrigation water demand such as land use and irrigation technology.
In light of the presented results, we argue that enriching the currently available data on groundwater irrigation could benefit irrigation sustainability assessments, also by better informing the application of integrated models such as LISFLOOD-EPIC that can be used to evaluate water and land management policies.
The irrigation to recharge surrogate model is the inflow-outflow response function of a linear reservoir:
where the γ parameter is the fraction of irrigation i that becomes recharge during the time lag δ following application; λ is the rate parameter controlling the response rapidity.
We calibrate λ by minimising the mean square error of with respect to ri, which is unrestricted irrigation recharge computed in Eq. (9).
Minimisation is performed with the five-point bisection method (chap. 2, 20–21 in Bartholomew-Biggs, 2006), using multiple starting points to avoid local minima. Given λ, we set δ to truncate the integral at 99 % of its value computed over (, t]; and γ is estimated so that is unbiased with respect to ri.
We compare the performance of the surrogate model (Eq. A1) with a simple fraction benchmark:
In the southern Iberian Peninsula model domain (Fig. 6), the linear correlation of with ri is 0.82, while that scored by is 0.57.
Model input and other data obtained from publicly available sources are referenced throughout the text. Some model input data held by JRC are not publicly available yet as they are object of publications in preparation. Selected model output data will be published together with the LISFLOOD-EPIC model description manuscript (Gelati et al., 2020) that is currently in preparation.
The supplement related to this article is available online at: https://doi.org/10.5194/asr-17-227-2020-supplement.
EG defined the methodology, developed the software, processed the data, and wrote the manuscript. ZZ, AC, SB, FB and AdR contributed to defining the methodology. BB, MA, JB, AM and MP contributed to data processing. All authors revised and edited the manuscript.
The authors declare that they have no conflict of interest.
This article is part of the special issue “19th EMS Annual Meeting: European Conference for Applied Meteorology and Climatology 2019”. It is a result of the EMS Annual Meeting: European Conference for Applied Meteorology and Climatology 2019, Lyngby, Denmark, 9–13 September 2019.
We are thankful to the two anonymous reviewers, whose criticism and suggestions helped improve the manuscript. We are also grateful to participants of the HyMeX and PannEx initiatives for their feeback at the EMS Annual Meeting 2019.
This paper was edited by Monika Lakatos and reviewed by two anonymous referees.
Abdelrhem, I. M., Raschid, K., and Ismail, A.: Integrated groundwater management for great man-made river project in Libya, Eur. J. Sci. Res., 22, 562–569, 2008. a
Al-Weshah, R. A.: Optimal Use of Irrigation Water in the Jordan Valley: A Case Study, Water Resour. Manage., 14, 327–338, https://doi.org/10.1023/a:1011152318711, 2000. a
APA: Plano nacional da água – Análise dos principais problemas, diagnóstico, objetivos e medidas, Portuguese Environment Agency, available at: https://apambiente.pt/_zdata/Politicas/Agua/PlaneamentoeGestao/PNA/2015/PNA2015_Relatorio_2.pdf (last access: 1 January 2020), 2015. a, b
Bartholomew-Biggs, M.: Nonlinear optimization with financial applications, Springer US, https://doi.org/10.1007/b102601, 2006. a
Bernhard, J., Reynaud, A., de Roo, A., Karssenberg, D., and Jong, S. D.: Household water use in Europe at regional scale: analysis of trends and quantification of main drivers, in preparation, 2020a. a
Bernhard, J., Reynaud, A., de Roo, A., Karssenberg, D., and Jong, S. D.: Mapping industrial water use and water productivity levels in Europe at high sectoral and spatial detail, in preparation, 2020b. a
BGR: IHME1500 – International Hydrogeological Map of Europe ), available at: https://www.bgr.bund.de/EN/Themen/Wasser/Projekte/laufend/Beratung/Ihme1500/ihme1500_projektbeschr_en.html, last access: 1 January 2020. a
Bierkens, M. F. P., Reinhard, S., de Bruijn, J. A., Veninga, W., and Wada, Y.: The Shadow Price of Irrigation Water in Major Groundwater-Depleting Countries, Water Resour. Res., 55, 4266–4287, https://doi.org/10.1029/2018WR023086, 2019. a, b
Bisselink, B., de Roo, A., Bernhard, J., and Gelati, E.: Future projections of water scarcity in the Danube river basin due to land use, water demand and climate change, J. Environ. Geogr., 11, 25–36, https://doi.org/10.2478/jengeo-2018-0010, 2018a. a
Bisselink, B., Bernhard, J., Gelati, E., Adamovic, M., Guenther, S., Mentaschi, L., and De Roo, A., Impact of a changing climate, land use, and water usage on Europe's water resources, EUR 29130 EN, Publications Office of the European Union, Luxembourg, https://doi.org/10.2760/847068, 2018b. a, b
Blank, J. and Deb, K.: pymoo – Multi-objective Optimization in Python: Genetic Algorithm, available at: https://pymoo.org/algorithms/genetic_algorithm.html, last access: 1 January 2020. a
Bouraoui, F. and Aloe, A.: European Agrochemicals Geospatial Loss Estimator: Model Development and Applications, Office for Official Publications of the European Commission, Luxemburg, available at: http://publications.jrc.ec.europa.eu/repository/bitstream/JRC36611/6611 - EUR_22690_EAGLE_web.pdf (last access: 1 January 2020), 2007. a
Brouwer, C., Prins, K., and Heibloem, M.: Irrigation water management: irrigation scheduling, FAO, Rome, Italy, available at: http://www.fao.org/tempref/agl/AGLW/fwm/Manual4.pdf (last access: 1 January 2020), 1989. a
Brown, L.: Full Planet, Empty Plates: The New Geopolitics of Food Scarcity, Earth Policy Institute, Washington, D.C., USA, available at: http://www.earth-policy.org/images/uploads/book_images/FullPlanetAllChaps.pdf (last access: 1 January 2020), 2012. a, b, c
Burek, P., van der Knijff, J., and de Roo, A.: LISFLOOD Distributed Water Balance and Flood Simulation Model – Revised User Manual, Joint Research Centre, European Commission, Ispra (VA), Italy, https://doi.org/10.2788/24719, 2013. a
Chartres, C. and Sood, A.: The water for food paradox, Aquat. Proced., 1, 3–19, 2013. a
Chen, L.: Real coded genetic algorithm optimization of long term reservoir operation, J. Am. Water Resour. Assoc., 39, 1157–1165, https://doi.org/10.1111/j.1752-1688.2003.tb03699.x, 2003. a
Chevallier, F., Ciais, P., Conway, T. J., Aalto, T., Anderson, B. E., Bousquet, P., Brunke, E. G., Ciattaglia, L., Esaki, Y., Fröhlich, M., Gomez, A., Gomez-Pelaez, A. J., Haszpra, L., Krummel, P. B., Langenfelds, R. L., Leuenberger, M., Machida, T., Maignan, F., Matsueda, H., Morguí, J. A., Mukai, H., Nakazawa, T., Peylin, P., Ramonet, M., Rivier, L., Sawa, Y., Schmidt, M., Steele, L. P., Vay, S. A., Vermeulen, A. T., Wofsy, S., and Worthy, D.: CO2 surface fluxes at grid point scale estimated from a global 21 year reanalysis of atmospheric measurements, J. Geophys. Res.-Atmos., 115, D21307, https://doi.org/10.1029/2010JD013887, 2010. a
Ciais, P., Reichstein, M., Viovy, N., Granier, A., Ogée, J., Allard, V., Aubinet, M., Buchmann, N., Bernhofer, C., Carrara, A., Chevallier, F., Noblet, N. D., Friend, A. D., Friedlingstein, P., Grünwald, T., Heinesch, B., Keronen, P., Knohl, A., Krinner, G., Loustau, D., Manca, G., Matteucci, G., Miglietta, F., Ourcival, J. M., Papale, D., Pilegaard, K., Rambal, S., Seufert, G., Soussana, J. F., Sanz, M. J., Schulze, E. D., Vesala, T., and Valentini, R.: Europe-wide reduction in primary productivity caused by the heat and drought in 2003, Nature, 437, 529–533, https://doi.org/10.1038/nature03972, 2005. a
Collins, S.: Incorporating groundwater flow in land surface models: literature review and recommendations for further work, available at: http://nora.nerc.ac.uk/id/eprint/519389/1/OR17068.PDF (last access: 1 January 2020), 2017. a, b
Copernicus: Flux inversion reanalysis of global carbon dioxide – Fluxes and atmospheric concentrations, available at: https://atmosphere.copernicus.eu/catalogue#/product/urn:x-wmo:md:int.ecmwf::copernicus:cams:prod:rean:co2:pid286, last access: 1 January 2020. a
Custodio, E., Llamas, M., Hernández-Mora, N., Martínez Cortina, L., and Martínez-Santos, P.: Issues related to intensive groundwater use, in: Water Policy in Spain, chap. 14, edited by: Garrido, A. and Llamas, M., CRC Press, Boca Raton, FL, USA, 143–162, 2009. a
Custodio, E., Andreu-Rodes, J. M., Aragón, R., Estrela, T., Ferrer, J., García-Aróstegui, J. L., Manzano, M., Rodríguez-Hernández, L., Sahuquillo, A., and del Villar, A.: Groundwater intensive use and mining in south-eastern peninsular Spain: Hydrogeological, economic and social aspects, Sci. Total Environ., 559, 302–316, https://doi.org/10.1016/j.scitotenv.2016.02.107, 2016. a
Custodio, E., Albiac, J., Cermerón, M., Hernández, M., Llamas, M. R., and Sahuquillo, A.: Groundwater mining: benefits, problems and consequences in Spain, Sustain. Water Resour. Manage., 3, 213–226, https://doi.org/10.1007/s40899-017-0099-2, 2017a. a
Custodio, E., Sahuquillo, A., and Albiac, J.: Sustainability of intensive groundwater development: experience in Spain, Sustain. Water Resour. Manage., 5, 11–26, https://doi.org/10.1007/s40899-017-0105-8, 2017b. a
Daccache, A., Ciurana, J. S., Diaz, J. A. R., and Knox, J. W.: Water and energy footprint of irrigated agriculture in the Mediterranean region, Environ. Res. Lett., 9, 124014, https://doi.org/10.1088/1748-9326/9/12/124014, 2014. a
Dalin, C., Taniguchi, M., and Green, T. R.: Unsustainable groundwater use for global food production and related international trade, Global Sustain., 2, e12, https://doi.org/10.1017/sus.2019.7, 2019. a, b, c
Davis, K. F., Rulli, M. C., Seveso, A., and D'Odorico, P.: Increased food production and reduced water use through optimized crop distribution, Nat. Geosci., 10, 919–924, https://doi.org/10.1038/s41561-017-0004-5, 2017. a
de Graaf, I. E. M., Gleeson, T., van Beek, L. P. H. R., Sutanudjaja, E. H., and Bierkens, M. F. P.: Environmental flow limits to global groundwater pumping, Nature, 574, 90–94, https://doi.org/10.1038/s41586-019-1594-4, 2019. a
de Roo, A. P. J., Wesseling, C. G., and Van Deursen, W. P. A.: Physically based river basin modelling within a GIS: the LISFLOOD model, Hydrol. Process., 14, 1981–1992, https://doi.org/10.1002/1099-1085(20000815/30)14:11/12<1981::AID-HYP49>3.0.CO;2-F, 2000. a
Döll, P. and Siebert, S.: Global modeling of irrigation water requirements, Water Resour. Res., 38, 8-1–8-10, https://doi.org/10.1029/2001WR000355, 2002. a
Döll, P., Fiedler, K., and Zhang, J.: Global-scale analysis of river flow alterations due to water withdrawals and reservoirs, Hydrol. Earth Syst. Sci., 13, 2413–2432, https://doi.org/10.5194/hess-13-2413-2009, 2009. a
Döll, P., Hoffmann-Dobrev, H., Portmann, F., Siebert, S., Eicker, A., Rodell, M., Strassberg, G., and Scanlon, B.: Impact of water withdrawals from groundwater and surface water on continental water storage variations, J. Geodynam., 59–60, 143–156, https://doi.org/10.1016/j.jog.2011.05.001, 2012. a, b
Döll, P., Müller Schmied, H., Schuh, C., Portmann, F. T., and Eicker, A.: Global-scale assessment of groundwater depletion and related groundwater abstractions: Combining hydrological modeling with information from well observations and GRACE satellites, Water Resour. Res., 50, 5698–5720, https://doi.org/10.1002/2014WR015595, 2014. a, b
Döll, P., Douville, H., Güntner, A., Schmied, H. M., and Wada, Y.: Modelling Freshwater Resources at the Global Scale: Challenges and Prospects, in: Remote Sensing and Water Resources, edited by: Cazenave, A., Champollion, N., Benveniste, J., and Chen, J., Springer International Publishing, New York, NY, USA, 5–31, https://doi.org/10.1007/978-3-319-32449-4_2, 2016. a, b
Duscher, K., Günther, A., Richts, A., Clos, P., Philipp, U., and Struckmeier, W.: The GIS layers of the “International Hydrogeological Map of Europe ” in a vector format, Hydrogeol. J., 23, 1867–1875, https://doi.org/10.1007/s10040-015-1296-4, 2015. a
EASAC: Groundwater in the Southern Member States of the European Union: an assessment of current knowledge and future prospects – Country report for Greece, EASAC, available at: https://easac.eu/fileadmin/PDF_s/reports_statements/Greece_Groundwater_country_report.pdf (last access: 1 January 2020), 2010. a
EEA: Corine Land Cover 2006 raster data, avaialable at: http://land.copernicus.eu/pan-european/corine-land-cover/clc-2006 (last access: 1 January 2020), 2006. a
EEA: European Pollutant Release and Transfer Register, available at: https://prtr.eea.europa.eu/ (last access: 1 January 2020), 2020a. a
EEA: WISE WFD reference spatial data sets, available at: https://www.eea.europa.eu/data-and-maps/data/wise-wfd-spatial-2 (last access: 1 January 2020), 2020b. a
Elliott, J., Deryng, D., Müller, C., Frieler, K., Konzmann, M., Gerten, D., Glotter, M., Flörke, M., Wada, Y., Best, N., Eisner, S., Fekete, B. M., Folberth, C., Foster, I., Gosling, S. N., Haddeland, I., Khabarov, N., Ludwig, F., Masaki, Y., Olin, S., Rosenzweig, C., Ruane, A. C., Satoh, Y., Schmid, E., Stacke, T., Tang, Q., and Wisser, D.: Constraints and potentials of future irrigation water availability on agricultural production under climate change, P. Natl. Acad. Sci. USA, 111, 3239–3244, https://doi.org/10.1073/pnas.1222474110, 2014. a
Eurostat: Crop production in national humidity, available at: https://ec.europa.eu/eurostat/web/products-datasets/-/apro_cpnh1 (last access: 1 January 2020), 2020a. a
Eurostat: Crop production in EU standard humidity, available at: https://ec.europa.eu/eurostat/web/products-datasets/-/apro_cpsh1 (last access: 1 January 2020), 2020b. a
Eurostat: Irrigation: number of farms, areas and equipment by size of irrigated area and NUTS 2 regions, available at: https://ec.europa.eu/eurostat/web/products-datasets/-/ef_poirrig (last access: 1 January 2020), 2020c. a, b, c
Eurostat: Annual freshwater abstraction by source and sector, available at: https://ec.europa.eu/eurostat/web/products-datasets/-/env_wat_abs, (last access: 1 January 2020), 2020d. a, b
Eurostat: Water abstraction by NUTS 2 regions, available at: https://ec.europa.eu/eurostat/web/products-datasets/-/env_watabs_r2 (last access: 1 January 2020), 2020e. a, b
Eurostat: Water abstraction by river basin district (RBD), available at: https://ec.europa.eu/eurostat/web/products-datasets/-/env_watabs_rb, (last access: 1 January 2020), 2020f. a
Eurostat: NUTS – Nomenclature of territorial units for statistics, available at: https://ec.europa.eu/eurostat/web/nuts/background (last access: 1 January 2020), 2020h. a
Fader, M., Shi, S., von Bloh, W., Bondeau, A., and Cramer, W.: Mediterranean irrigation under climate change: more efficient irrigation needed to compensate for increases in irrigation water requirements, Hydrol. Earth Syst. Sci., 20, 953–973, https://doi.org/10.5194/hess-20-953-2016, 2016. a
Falkenmark, M.: Growing water scarcity in agriculture: future challenge to global water security, Philos. T. Roy. Soc. Lond. A, 371, 20120410, https://doi.org/10.1098/rsta.2012.0410, 2013. a
Famiglietti, J. S.: The global groundwater crisis, Nat. Clim. Change, 4, 945–948, https://doi.org/10.1038/nclimate2425, 2014. a
FAO: AQUASTAT Main Database, available at: http://www.fao.org/nr/water/aquastat/data/query/, last access: 1 January 2020. a, b, c, d
FAO and IIASA: Global Agro-Ecological Zones, available at: http://www.fao.org/nr/gaez/en/, last access: 1 January 2020. a
Feyen, L.: Calibration of the LISFLOOD model for Europe: current status and way forward, European Commission EUR22125 EN, available at: http://publications.jrc.ec.europa.eu/repository/handle/JRC32044 (last access: 1 January 2020), 2005. a
Fischer, G., Nachtergaele, F. O., Prieler, S., Teixeira, E., Tóth, G., van Velthuizen, H., Verelst, L., and Wiberg, D.: Global Agro-Ecological Zones (GAEZ v3. 0) – model documentation, IIASA, Laxenburg, Austria, and FAO, Rome, Italy, available at: http://pure.iiasa.ac.at/13290 (last access: 1 January 2020), 2012. a, b
Foster, S. and Custodio, E.: Groundwater Resources and Intensive Agriculture in Europe – Can Regulatory Agencies Cope with the Threat to Sustainability?, Water Resour. Manage., 33, 2139–2151, https://doi.org/10.1007/s11269-019-02235-6, 2019. a
Fuentes, A.: Policies Towards a Sustainable Use of Water in Spain, Tech. rep., OECD – Organisation for Economic Co-Operation and Development, Paris, France, https://doi.org/10.1787/5kgj3l0ggczt-en, 2011. a, b
García-Ruiz, J. M., López-Moreno, J. I., Vicente-Serrano, S. M., Lasanta-Martínez, T., and Beguería, S.: Mediterranean water resources in a global change scenario, Earth-Sci. Rev., 105, 121–139, https://doi.org/10.1016/j.earscirev.2011.01.006, 2011. a
Garduño, H. and Foster, S.: Sustainable Groundwater Irrigation approaches to reconciling demand with resources, Tech. Rep., GW MATE strategic overview series no. 4, World Bank, Washington, D.C., USA, available at: http://documents.worldbank.org/curated/en/603961468331259 (last access: 1 January 2020), 2010. a
Garrido, A., Martínez-Santos, P., and Llamas, M. R.: Groundwater irrigation and its implications for water policy in semiarid countries: the Spanish experience, Hydrogeol. J., 14, 340, https://doi.org/10.1007/s10040-005-0006-z, 2006. a
Gelati, E., Madsen, H., and Rosbjerg, D.: Stochastic reservoir optimization using El Niño information: case study of Daule Peripa, Ecuador, Hydrol. Res., 42, 413–431, https://doi.org/10.2166/nh.2011.009, 2011. a
Gelati, E., Madsen, H., and Rosbjerg, D.: Reservoir operation using El Niño forecasts – case study of Daule Peripa and Baba, Ecuador, Hydrolog. Sci. J., 59, 1559–1581, https://doi.org/10.1080/02626667.2013.831978, 2014. a
Gelati, E. et al.: Integrated model of irrigation, crop growth and water resources (LISFLOOD-EPIC): description and application in the Euro-Mediterranean area, in preparation, 2020. a, b, c, d, e
Giordano, M.: Global Groundwater? Issues and Solutions, Annu. Rev. Environ. Resour., 34, 153–178, https://doi.org/10.1146/annurev.environ.030308.100251, 2009. a, b
Giorgi, F.: Climate change hot-spots, Geophys. Res. Lett., 33, L08707, https://doi.org/10.1029/2006gl025734, 2006. a
Gleeson, T. and Richter, B.: How much groundwater can we pump and protect environmental flows through time? Presumptive standards for conjunctive management of aquifers and rivers, River Res. Appl., 34, 83–92, https://doi.org/10.1002/rra.3185, 2018. a, b
Gleeson, T., Alley, W. M., Allen, D. M., Sophocleous, M. A., Zhou, Y., Taniguchi, M., and VanderSteen, J.: Towards Sustainable Groundwater Use: Setting Long-Term Goals, Backcasting, and Managing Adaptively, Groundwater, 50, 19–26, https://doi.org/10.1111/j.1745-6584.2011.00825.x, 2012. a
Gorelick, S. M. and Zheng, C.: Global change and the groundwater management challenge, Water Resour. Res., 51, 3031–3051, https://doi.org/10.1002/2014WR016825, 2015. a
Government of Spain: Red Oficial de Seguimiento del Estado Cuantitativo: Red Piezométrica [Official piezometric monitoring network], available at: https://www.miteco.gob.es/es/agua/temas/evaluacion-de-los-recursos-hidricos/red-oficial-seguimiento/, last access: 1 January 2020. a, b, c
Greve, P., Gudmundsson, L., and Seneviratne, S. I.: Regional scaling of annual mean precipitation and water availability with global temperature change, Earth Syst. Dynam., 9, 227–240, https://doi.org/10.5194/esd-9-227-2018, 2018. a
Grogan, D. S., Wisser, D., Prusevich, A., Lammers, R. B., and Frolking, S.: The use and re-use of unsustainable groundwater for irrigation: a global budget, Environ. Res. Lett., 12, 034017, https://doi.org/10.1088/1748-9326/aa5fb2, 2017. a
Gruere, G.: Policies to Manage Agricultural Groundwater Use – Portugal, OECD, available at: https://www.oecd.org/agriculture/topics/water-and-agriculture/documents/groundwater-country-note-PRT-2015 final.pdf (last access: 1 January 2020), 2015. a
Guiot, J. and Cramer, W.: Climate change: The 2015 Paris Agreement thresholds and Mediterranean basin ecosystems, Science, 354, 465–468, https://doi.org/10.1126/science.aah5015, 2016. a
Haddeland, I., Skaugen, T., and Lettenmaier, D. P.: Anthropogenic impacts on continental surface water fluxes, Geophys. Res. Lett., 33, L08406, https://doi.org/10.1029/2006GL026047, 2006. a
Haddeland, I., Heinke, J., Biemans, H., Eisner, S., Flörke, M., Hanasaki, N., Konzmann, M., Ludwig, F., Masaki, Y., Schewe, J., Stacke, T., Tessler, Z. D., Wada, Y., and Wisser, D.: Global water resources affected by human interventions and climate change, P. Natl. Acad. Sci. USA, 111, 3251–3256, https://doi.org/10.1073/pnas.1222475110, 2014. a
Hejazi, M., Edmonds, J., Clarke, L., Kyle, P., Davies, E., Chaturvedi, V., Wise, M., Patel, P., Eom, J., Calvin, K., Moss, R., and Kim, S.: Long-term global water projections using six socioeconomic scenarios in an integrated assessment modeling framework, Technol. Forecast. Social Change, 81, 205–226, https://doi.org/10.1016/j.techfore.2013.05.006, 2014. a
Hernández-Mora, N., Martínez Cortina, L., Llamas Madurga, M. R., and Custodio Gimena, E.: Groundwater issues in southern EU MEMBER states – Spain country report, EASAC, available at: https://easac.eu/fileadmin/PDF_s/reports_statements/Spain_Groundwater_country_report.pdf (last access: 1 January 2020), 2010. a
Huang, Z., Hejazi, M., Li, X., Tang, Q., Vernon, C., Leng, G., Liu, Y., Döll, P., Eisner, S., Gerten, D., Hanasaki, N., and Wada, Y.: Reconstruction of global gridded monthly sectoral water withdrawals for 1971–2010 and analysis of their spatiotemporal patterns, Hydrol. Earth Syst. Sci., 22, 2117–2133, https://doi.org/10.5194/hess-22-2117-2018, 2018. a
Hunter, M. C., Smith, R. G., Schipanski, M. E., Atwood, L. W., and Mortensen, D. A.: Agriculture in 2050: recalibrating targets for sustainable intensification, BioScience, 67, 386–391, https://doi.org/10.1093/biosci/bix010, 2017. a
Hussain, M. and Mahmud, I.: pyMannKendall: a Python package for non parametric Mann Kendall family of trend tests, J. Open Sour. Softw., 4, 1556, https://doi.org/10.21105/joss.01556, 2019. a
IAASTD: Agriculture at the crossroads. International assessment of agricultural knowledge, science and technology, Island Press, Washington, D.C., USA, 2009. a
ICID: Sprinkler and Micro Irrigated area, International Commission on Irrigation and Drainage (ICID), New Delhi, India, available at: http://www.icid.org/sprinklerandmircro.pdf (last access: 1 January 2020), 2012. a
IFPRI and IIASA: Global spatially-disaggregated crop production statistics data for 2005 version 3.2, available at: https://dataverse.harvard.edu/dataset.xhtml?persistentId=doi:10.7910/DVN/DHXBJX, last access: 1 January 2020. a
INSPIRE: D2.8.I.1 Data Specification on Coordinate Reference Systems – Technical Guidelines, available at: https://inspire.ec.europa.eu/documents/Data_Specifications/INSPIRE_DataSpecification_RS_v3.2.pdf (last access: 1 January 2020), 2014. a
IPCC: Climate Change and Land: an IPCC special report on climate change, desertification, land degradation, sustainable land management, food security, and greenhouse gas fluxes in terrestrial ecosystems, IPCC, Geneva, Switzerland, 2019. a, b
Jägermeyr, J., Gerten, D., Schaphoff, J. H. S., Kummu, M., and Lucht, W.: Water savings potentials of irrigation systems: global simulation of processes and linkages, Hydrol. Earth Syst. Sci., 19, 3073–3091, https://doi.org/10.5194/hess-19-3073-2015, 2015. a, b
Jägermeyr, J., Gerten, D., Schaphoff, S., Heinke, J., Lucht, W., and Rockström, J.: Integrated crop water management might sustainably halve the global food gap, Environ. Res. Lett., 11, 025002, https://doi.org/10.1088/1748-9326/11/2/025002, 2016. a
Joodaki, G., Wahr, J., and Swenson, S.: Estimating the human contribution to groundwater depletion in the Middle East, from GRACE data, land surface models, and well observations, Water Resour. Res., 50, 2679–2692, https://doi.org/10.1002/2013WR014633, 2014. a
Kahil, M. T., Dinar, A., and Albiac, J.: Modeling water scarcity and droughts for policy adaptation to climate change in arid and semiarid regions, J. Hydrol., 522, 95–109, https://doi.org/10.1016/j.jhydrol.2014.12.042, 2015. a
Kendall, M. G.: Rank Correlation Methods, 4th Edn., Charles Griffin, London, UK, 1975. a
Keramidas, K., Kitous, A., Després, J., and Schmitz, A.: POLES-JRC model documentation, Publications Office of the European Union, Seville, Spain, https://doi.org/10.2760/225347, 2017. a
Konikow, L. F. and Kendy, E.: Groundwater depletion: A global problem, Hydrogeol. J., 13, 317–320, https://doi.org/10.1007/s10040-004-0411-8, 2005. a, b
Lehner, B. and Döll, P.: Development and Validation of a Global Database of Lakes, Reservoirs and Wetlands, J. Hydrol., 296, 1–22, https://doi.org/10.1016/j.jhydrol.2004.03.028, 2004. a
Lehner, B., Liermann, C. R., Revenga, C., Vörösmarty, C., Fekete, B., Crouzet, P., Döll, P., Endejan, M., Frenken, K., Magome, J., Nilsson, C., Robertson, J. C., Rödel, R., Sindorf, N., and Wisser, D.: High-resolution mapping of the world's reservoirs and dams for sustainable river-flow management, Front. Ecol. Environ., 9, 494–502, https://doi.org/10.1890/100125, 2011a. a
Lehner, B., Reidy Liermann, C., Revenga, C., Vörösmarty, C., Fekete, B., Crouzet, P., Doll, P., Endejan, M., Frenken, K., Magome, J., Nilsson, C., Robertson, J., Rodel, R., Sindorf, N., and Wisser, D.: Global Reservoir and Dam Database, Version 1 (GRanDv1): Reservoirs, Revision 01, NASA, Palisades, NY, USA, https://doi.org/10.7927/h4hh6h08, 2011b. a
Lehner, F., Coats, S., Stocker, T. F., Pendergrass, A. G., Sanderson, B. M., Raible, C. C., and Smerdon, J. E.: Projected drought risk in 1.5 ∘C and 2 ∘C warmer climates, Geophys. Res. Lett., 44, 7419–7428, https://doi.org/10.1002/2017GL074117, 2017. a
Levine, J. B. and Salvucci, G. D.: Equilibrium analysis of groundwater–vadose zone interactions and the resulting spatial distribution of hydrologic fluxes across a Canadian Prairie, Water Resour. Res., 35, 1369–1383, https://doi.org/10.1029/1999WR900018, 1999. a
Llamas, M. R., Custodio, E., de la Hera, A., and Fornés, J. M.: Groundwater in Spain: increasing role, evolution, present and future, Environ. Earth Sci., 73, 2567–2578, https://doi.org/10.1007/s12665-014-4004-0, 2015. a
Llamas, R. and Custodio, E. (Eds.): Environmental implications of intensive groundwater use withspecial regard to streams and wetlands, Balkema, Lisse, the Netherlands, 2002. a
Llamas, R. and Garrido, A.: Lessons from intensive groundwater use in Spain: Economic and social benefits and conflicts, in: The Agricultural Groundwater Revolution: Opportunities and Threats to Development, edited by Giordano and Villholth, CAB International, Wallingford, UK, 266–295, 2007. a
Long, D., Pan, Y., Zhou, J., Chen, Y., Hou, X., Hong, Y., Scanlon, B. R., and Longuevergne, L.: Global analysis of spatiotemporal variability in merged total water storage changes using multiple GRACE products and global hydrological models, Remote Sens. Environ., 192, 198–216, https://doi.org/10.1016/j.rse.2017.02.011, 2017. a
Malek, Ž. and Verburg, P. H.: Adaptation of land management in the Mediterranean under scenarios of irrigation water use and availability, Mitig. Adapt. Strat. Global Change, 23, 821–837, https://doi.org/10.1007/s11027-017-9761-0, 2017. a
Mann, H.: Nonparametric Tests Against Trend, Econometrica, 13, 245–259, https://doi.org/10.2307/1907187, 1945. a
MITECO: Libro blanco del agua en España – Síntesis [White book of water in Spain – Summary], Spanish Ministry for Ecological Transition and Demographic Challenge, Madrid, Spain, available at: https://www.miteco.gob.es/es/agua/temas/planificacion-hidrologica/sintesis_tcm30-77435.pdf (last access: 1 January 2020), 2000. a
Moench, M., Burke, J. J., and Moench, Y.: Rethinking the approach to groundwater and food security, Tech. Rep., Water Reports 24, FAO, Rome, Italy, available at: http://www.fao.org/3/a-y4495e.pdf (last access: 1 January 2020), 2003. a
Molden, D., Frenken, K., Barker, R., DeFraiture, C., Mati, B., Svendsen, M., Sadoff, C., Finlayson, M., Atapattu, S., Giordano, M., Inocencio, A., Lannerstad, M., Manning, N., Molle, F., Smedema, B., and Vallee., D.: Trends in water and agricultural development, in: Water for food, water for life: a comprehensive assessment of water management in agriculture, chap. 2, edited by: Molden, D., Earthscan, London, UK & International Water Management Institute, Colombo, Sri Lanka, 57–89, 2007. a, b
Molinero, J., Custodio, E., Sahuquillo, A., and Llamas, M. R.: Groundwater in Spain: Overview and management practices, Tech. rep., Real Academia de Ciencias, Madrid, Spain, available at: http://www.rac.es/ficheros/doc/00587.pdf (last access: 1 January 2020), 2008. a
Mubareka, S., Maes, J., Lavalle, C., and de Roo, A.: Estimation of water requirements by livestock in Europe, Ecosyst. Serv., 4, 139–145, https://doi.org/10.1016/j.ecoser.2013.03.001, 2013. a
Ngo, L. L., Madsen, H., and Rosbjerg, D.: Simulation and optimisation modelling approach for operation of the Hoa Binh reservoir, Vietnam, J. Hydrol., 336, 269–281, https://doi.org/10.1016/j.jhydrol.2007.01.003, 2007. a
Ntegeka, V. N., Salamon, P., Gomes, G., Sint, H., Lorini, V., Thielen Del Pozo, J., and Zambrano, H.: EFAS–Meteo: A European daily high–resolution gridded meteorological data set for 1990–2011, Joint Research Centre, European Commission, Ispra (VA), Italy, https://doi.org/10.2788/51262, 2013. a
Pastor, A. V., Ludwig, F., Biemans, H., Hoff, H., and Kabat, P.: Accounting for environmental flow requirements in global water assessments, Hydrol. Earth Syst. Sci., 18, 5041–5059, https://doi.org/10.5194/hess-18-5041-2014, 2014. a
Planton, S., Lionello, P., Artale, V., Aznar, R., Carillo, A., Colin, J., Congedi, L., Dubois, C., Elizalde Arellano, A., Gualdi, S., Hertig, E., Jorda Sanchez, G., Li, L., Jucundus, J., Piani, C., Ruti, P., Sanchez-Gomez, E., Sannino, G., Sevault, F., and Somot, S.: The climate of the Mediterranean region in future climate projections, in: The Climate of the Mediterranean Region, chap. 8, edited by: Lionello, P., Elsevier, Amsterdam, the Netherlands, https://doi.org/10.1016/C2011-0-06210-5, 2012. a
Pokhrel, Y. N., Hanasaki, N., Yeh, P. J.-F., Yamada, T. J., Kanae, S., and Oki, T.: Model estimates of sea-level change due to anthropogenic impacts on terrestrial water storage, Nat. Geosci., 5, 389–392, https://doi.org/10.1038/ngeo1476, 2012. a
Pokhrel, Y. N., Koirala, S., Yeh, P. J.-F., Hanasaki, N., Longuevergne, L., Kanae, S., and Oki, T.: Incorporation of groundwater pumping in a global Land Surface Model with the representation of human impacts, Water Resour. Res., 51, 78–96, https://doi.org/10.1002/2014WR015602, 2015. a
Ribeiro, L. and Veiga da Cunha, L.: Portuguese groundwater report – EASAC WG on the role of groundwater in the water resources policy of southern EU member states, EASAC, available at: https://easac.eu/fileadmin/PDF_s/reports_statements/Portugal_Groundwater_country_report.pdf (last access: 1 January 2020), 2010. a
Rockström, J. and Karlberg, L.: The Quadruple Squeeze: Defining the safe operating space for freshwater use to achieve a triply green revolution in the Anthropocene, Ambio, 39, 257–265, https://doi.org/10.1007/s13280-010-0033-4, 2010. a
Rockström, J., Steffen, W., Noone, K., Persson, Å., Chapin III, S. F., Lambin, E., Lenton, M. T., Scheffer, M., Folke, C., Schellnhuber, H., Nykvist, B., De Wit, A. C., Hughes, T., van der Leeuw, S., Rodhe, H., Sörlin, S., Snyder, K. P., Costanza, R., Svedin, U., Falkenmark, M., Karlberg, L., Corell, W. R., Fabry, J. V., Hansen, J., Walker, B., Liverman, D., Richardson, K., Crutzen, P., and Foley, J.: Planetary boundaries: exploring the safe operating space for humanity, Ecol. Soc., 14, 32, 2009. a
Rodell, M., Famiglietti, J. S., Wiese, D. N., Reager, J. T., Beaudoing, H. K., Landerer, F. W., and Lo, M.-H.: Emerging trends in global freshwater availability, Nature, 557, 651–659, https://doi.org/10.1038/s41586-018-0123-1, 2018. a, b
Rohwer, J., Gerten, D., and Lucht, W.: Development of functional irrigation types for improved global crop modelling, PIK report No. 104, PIK – Potsdam Institute for Climate Impact Research, Potsdam, Germany, available at: https://www.pik-potsdam.de/research/publications/pikreports/.files/pr104.pdf (last access: 1 January 2020), 2007. a
Rosegrant, M. W., Ringler, C., and Zhu, T.: Water for Agriculture: Maintaining Food Security under Growing Scarcity, Annu. Rev. Environ. Resour., 34, 205–222, https://doi.org/10.1146/annurev.environ.030308.090351, 2009. a
Sacks, B.: Crop Calendar Dataset, available at: https://nelson.wisc.edu/sage/data-and-models/crop-calendar-dataset/index.php, last access: 1 January 2020. a
Sacks, W. J., Deryng, D., Foley, J. A., and Ramankutty, N.: Crop planting dates: an analysis of global patterns, Global Ecol. Biogeogr., 19, 607–620, https://doi.org/10.1111/j.1466-8238.2010.00551.x, 2010. a
Samaniego, L., Thober, S., Kumar, R., Wanders, N., Rakovec, O., Pan, M., Zink, M., Sheffield, J., Wood, E. F., and Marx, A.: Anthropogenic warming exacerbates European soil moisture droughts, Nat. Clim. Change, 8, 421–426, https://doi.org/10.1038/s41558-018-0138-5, 2018. a
Sauer, T., Havlík, P., Schneider, U. A., Schmid, E., Kindermann, G., and Obersteiner, M.: Agriculture and resource availability in a changing world: The role of irrigation, Water Resour. Res., 46, W06503, https://doi.org/10.1029/2009WR007729, 2010. a
Scanlon, B. R., Jolly, I., Sophocleous, M., and Zhang, L.: Global impacts of conversions from natural to agricultural ecosystems on water resources: Quantity versus quality, Water Resour. Res., 43, W03437, https://doi.org/10.1029/2006WR005486, 2007. a
Scanlon, B. R., Reedy, R. C., Faunt, C. C., Pool, D., and Uhlman, K.: Enhancing drought resilience with conjunctive use and managed aquifer recharge in California and Arizona, Environ. Res. Lett., 11, 035013, https://doi.org/10.1088/1748-9326/11/3/035013, 2016. a
Seckler, D., Barker, R., and Amarasinghe, U.: Water Scarcity in the Twenty-first Century, Int. J. Water Resour. Dev., 15, 29–42, https://doi.org/10.1080/07900629948916, 1999. a
Sharpley, A. N. and Williams, J. R.: EPIC–Erosion/Productivity Impact Calculator: 1. Model Documentation, US Department of Agriculture Technical Bulletin, available at: http://epicapex.tamu.edu/files/2015/05/EpicModelDocumentation.pdf (last access: 1 January 2020), 1990. a
Shiklomanov, I. A.: Appraisal and Assessment of World Water Resources, Water Int., 25, 11–32, https://doi.org/10.1080/02508060008686794, 2000. a
Siebert, S., Burke, J., Faures, J. M., Frenken, K., Hoogeveen, J., Döll, P., and Portmann, F. T.: Groundwater use for irrigation – a global inventory, Hydrol. Earth Syst. Sci., 14, 1863–1880, https://doi.org/10.5194/hess-14-1863-2010, 2010. a, b, c, d, e, f
Siebert, S., Kummu, M., Porkka, M., Döll, P., Ramankutty, N., and Scanlon, B. R.: A global data set of the extent of irrigated land from 1900 to 2005, Hydrol. Earth Syst. Sci., 19, 1521–1545, https://doi.org/10.5194/hess-19-1521-2015, 2015. a
Taylor, R. G., Scanlon, B., Döll, P., Rodell, M., van Beek, R., Wada, Y., Longuevergne, L., Leblanc, M., Famiglietti, J. S., Edmunds, M., Konikow, L., Green, T. R., Chen, J., Taniguchi, M., Bierkens, M. F. P., MacDonald, A., Fan, Y., Maxwell, R. M., Yechieli, Y., Gurdak, J. J., Allen, D. M., Shamsudduha, M., Hiscock, K., Yeh, P. J.-F., Holman, I., and Treidel, H.: Ground water and climate change, Nat. Clim. Change, 3, 322–329, https://doi.org/10.1038/nclimate1744, 2012. a, b
Texas A&M AgriLife Research: EPIC version 0810 source code, available at: http://epicapex.tamu.edu/model-executables/epic0810/, last access: 1 January 2020. a
Tharme, R. E.: A global perspective on environmental flow assessment: emerging trends in the development and application of environmental flow methodologies for rivers, River Res. Appl., 19, 397–441, https://doi.org/10.1002/rra.736, 2003. a
Thiemig, V., Salamon, P., Gomes, G. N., Skøien, J. O., Ziese, M., Rauthe-Schöch, A., Rehfeldt, K., Pichon, D., and Schweim, C.: EMO-5: Copernicus pan-European high-resolution meteorological data set for large-scale hydrological modelling, in: EGU General Assembly 2020, Online, 4–8 May 2020, EGU2020-21551, https://doi.org/10.5194/egusphere-egu2020-21551, 2020. a
Tian, Y., Xiong, J., He, X., Pi, X., Jiang, S., Han, F., and Zheng, Y.: Joint Operation of Surface Water and Groundwater Reservoirs to Address Water Conflicts in Arid Regions: An Integrated Modeling Study, Water, 10, 1105, https://doi.org/10.3390/w10081105, 2018. a, b
UN: Protection of the quality and supply of freshwater resources: application of integrated approaches to the development, management and use of water resources, in: chap. 18, Report of the United Nations Conference on Environment and Development, 3–14 June 1992, Rio de Janeiro, 196–225, United Nations, New York, USA, available at: https://sustainabledevelopment.un.org/content/documents/Agenda21.pdf (last access: 1 January 2020), 1993. a
Vandecasteele, I., Bianchi, A., Batista e Silva, F., Lavalle, C., and Batelaan, O.: Mapping current and future European public water withdrawals and consumption, Hydrol. Earth Syst. Sci., 18, 407–416, https://doi.org/10.5194/hess-18-407-2014, 2014. a
van der Knijff, J. M., Younis, J., and de Roo, A. P. J.: LISFLOOD: a GIS-based distributed model for river basin scale water balance and flood simulation, Int. J. Geogr. Inform. Sci., 24, 189–212, https://doi.org/10.1080/13658810802549154, 2010. a
van der Velde, M., Tubiello, F. N., Vrieling, A., and Bouraoui, F.: Impacts of extreme weather on wheat and maize in France: evaluating regional crop simulations against observed data, Climatic Change, 113, 751–765, https://doi.org/10.1007/s10584-011-0368-2, 2012. a
Vergnes, J.-P. and Decharme, B.: A simple groundwater scheme in the TRIP river routing model: global off-line evaluation against GRACE terrestrial water storage estimates and observed river discharges, Hydrol. Earth Syst. Sci., 16, 3889–3908, https://doi.org/10.5194/hess-16-3889-2012, 2012. a
Vergnes, J.-P., Decharme, B., and Habets, F.: Introduction of groundwater capillary rises using subgrid spatial variability of topography into the ISBA land surface model, J. Geophys. Res.-Atmos., 119, 11065–11086, https://doi.org/10.1002/2014JD021573, 2014. a
Wada, Y., van Beek, L. P. H., van Kempen, C. M., Reckman, J. W. T. M., Vasak, S., and Bierkens, M. F. P.: Global depletion of groundwater resources, Geophys. Res. Lett., 37, L20402, https://doi.org/10.1029/2010GL044571, 2010. a, b
Wada, Y., van Beek, L. P. H., and Bierkens, M. F. P.: Nonsustainable groundwater sustaining irrigation: A global assessment, Water Resour. Res., 48, W00L06, https://doi.org/10.1029/2011WR010562, 2012. a, b
Werner, A. D., Zhang, Q., Xue, L., Smerdon, B. D., Li, X., Zhu, X., Yu, L., and Li, L.: An Initial Inventory and Indexation of Groundwater Mega-Depletion Cases, Water Resour. Manage., 27, 507–533, https://doi.org/10.1007/s11269-012-0199-6, 2012. a, b
Williams, J. R.: The EPIC Model, in: Computer Models of Watershed Hydrology, chap. 25, edited by Singh, V. P., Water Resources Publications, Highlands Ranch, CO, USA, 909–1000,1995. a
Williams, J. R., Jones, C. A., Kiniry, J. R., and Spanel, D. A.: The EPIC Crop Growth Model, T. ASAE, 32, 0497–0511, https://doi.org/10.13031/2013.31032, 1989. a
Wriedt, G., Van Der Velde, M., Aloe, A., and Bouraoui, F.: A European irrigation map for spatially distributed agricultural modelling, Agr. Water Manage., 96, 771–789, https://doi.org/10.1016/j.agwat.2008.10.012, 2009a. a
Wriedt, G., Van Der Velde, M., Aloe, A., and Bouraoui, F.: Estimating irrigation water requirements in Europe, J. Hydrol., 373, 527–544, https://doi.org/10.1016/j.jhydrol.2009.05.018, 2009b. a
Wurbs, R. A.: Reservoir-system simulation and optimization models, J. Water Resour. Plan. Manage., 119, 455–472, https://doi.org/10.1061/(ASCE)0733-9496(1993)119:4(455), 1993. a
WWF: Global Lakes and Wetlands Database, available at: https://www.worldwildlife.org/pages/global-lakes-and-wetlands-database, last access: 1 January 2020. a
You, L., Wood, S., Wood-Sichra, U., and Wu, W.: Generating global crop distribution maps: From census to grid, Agricult. Syst., 127, 53–60, https://doi.org/10.1016/j.agsy.2014.01.002, 2014. a
Zajac, Z., Zambrano-Bigiarini, M., Salamon, P., Burek, P., Gentile, A., and Bianchi, A.: Calibration of the LISFLOOD hydrological model for Europe – Calibration Round 2013, Joint Research Centre, European Commission, Ispra (VA), Italy, 2013. a