 | 10 Oct 2022
Downscaled climate change scenarios for Central America
Jorge Tamayo
Ernesto Rodriguez-Camino
Alfonso Hernanz
Sara Covaleda
The intersectoral workshop held in December 2016 among the Ibero-American networks on water, climate change and meteorology, identified the need of downscaled climate change scenarios for Central America. Such scenarios would be developed by National Meteorological and Hydrological Services in the region, based on a common methodology, allowing the assessment of climate change impacts on water resources and extreme hydro-meteorological events. This project was supported by the International and Ibero-American Foundation for Administration and Public Policies of Spain in the framework of the EUROCLIMA+ programme. One final outcome of the project has been a freely accessible web viewer, installed on the Centro Clima webpage (https://centroclima.org/escenarios-cambio-climatico/, last access: 26 September 2022), managed by the Regional Committee on Hydraulic Resources of the Central American Integration System, where all information generated during the project is available for consultation and data downloading by the different sectors of users.
A key element in this project has been to integrate many downscaled projections based on different methods (dynamical and statistical), totalizing 45 different projections, and aiming at estimating the uncertainty coming from different sources in the best possible way. Another essential element has been the strong involvement of the different user sectors through national workshops, first, at the beginning of the project for the identification and definition of viewer features, and then for the presentation of results and planning of its use by prioritized sectors.
In a second phase of the project, a regional working group made up of experts from the participating National Meteorological and Hydrological Services will be in charge of viewer maintenance and upgrade, including new sectoral parameters, developed in collaboration with interested users, and computation and addition of new downscaled projections from CMIP6 in collaboration with the State Meteorological Agency of Spain.
- Article
(794 KB) - Full-text XML
-
Supplement
(3027 KB) - BibTeX
- EndNote


There currently exist three Iberoamerican (countries in the Americas where Spanish or Portuguese are predominant languages) co-operation networks for meteorology, climate change and water. Portugal, Andorra and Spain are also themselves included. The Iberoamerican Conference of Directors of Meteorological and Hydrological Services (CIMHET) was created in 1993 and its main objective is to promote collaboration among National Meteorological and Hydrological Institutes by establishing a framework for cooperation (http://www.cimhet.org, last access: 26 September 2022). The Iberoamerican Network of Climate Change Offices (RIOCC) was created in 2004 by the Iberoamerican Forum of Environment Ministers and has as main objective to maintain a fluent and permanent dialogue to better understand the climate change priorities, challenges and experiences of the Iberoamerican countries (https://www.lariocc.es, last access: 26 September 2022). The Conference of Iberoamerican Water Directors (CODIA) was also created in 2001 as a response to the mandate of the Iberoamerican Forum of Environment Ministers to promote coordination of the Iberoamerican countries for development and exchange of experiences in water management (https://codia.info, last access: 26 September 2022).
In December 2016 an intersectoral workshop of the three aforementioned networks for meteorology, climate and water was held in La Antigua (Guatemala). During the discussions the need of downscaled climate change scenarios with common format for Central America and based on common data and methodology was identified. Such scenarios would allow the assessment of climate change impacts and the subsequent elaboration of adaptation instruments as required -among others- by the Paris Agreement. The assessment of climate change impacts on water resources and extreme hydro-meteorological events was targeted as the main application of the generated scenarios. It was also agreed during the workshop that National Meteorological and Hydrological Services (NMHSs) in the region would take the initiative and assume the responsibility for the production and delivery of such downscaled scenarios. Finally, the project was developed and funded under the umbrella of the EUROCLIMA+ programme (https://www.fiiapp.org/en/proyectos_fiiapp/euroclima, last access: 26 September 2022) with coordination and management from the International and Ibero-American Foundation for Administration and Public Policies (FIIAPP, https://www.fiiapp.org, last access: 26 September 2022) and technical support from the State Meteorological Agency of Spain (AEMET, http://www.aemet.es, last access: 26 September 2022).
In order to meet this identified need of high-resolution climate change projections for Central América, the project -called Generation of Downscaled Scenarios for Central America (https://euroclimaplus.org/en/lao3/generation-of-regionalised-climate-change-scenarios-in-central-america, last access: 26 September 2022) was launched to integrate many downscaled projections based on different methods (dynamical and statistical) and aiming to a better estimation of the uncertainty coming from different sources. Part of the downscaled projections were generated by the project itself, whereas others were generated by external initiatives. A web based viewer integrating all available downscaled projections information was also developed serving as a friendly interface with users and facilitating the exploration and download of scenario data.
Final users have been strongly involved in the project. At the beginning of the project a series of national workshops were organized to collect users' needs to be considered in the development of the viewer. At the same time a working group -with representatives from all participating countries- was formed around different capacity building activities. After some training period this working group assumed the responsibility of managing the web based viewer, including its maintenance and upgrading, and the liaison with users. From the very beginning, knowledge transfer and development of capacities were considered a priority for the project.
It is important to emphasize that the usage of common input data -including the same global climate models and observational gridded data-, downscaling methodology-based on statistical algorithms and regional climate models-, postprocessing and visualization was a requirement of the project to facilitate the development of common downstream applications for the whole Central America region.
This paper is organized as follows. Section 2 describes the process for identifying users' needs. The downscaled climate change projections generated during the project are described in Sect. 3, whereas the newly developed viewer for displaying and downloading all generated information is presented in Sect. 4. Capacity building activities are collected and briefly described in Sect. 5. Finally, lessons learned from the project, conclusions and further developments are summarized in Sects. 6 and 7, respectively.
The general rationale behind this project was to transfer and adapt to the Central American region the Spanish experience in generating high-resolution climate change projections data for impacts and adaptation purposes in sectors seriously affected by changing climate conditions (Amblar-Francés et al., 2017, 2018, 2020). In 2006, routine production of regionalized/downscaled climate change projections at century-scale for Spain was launched as a consequence of the international climate change negotiations in the United Nations Framework Convention on Climate Change (UNFCCC) and the commitments there assumed by the Parties. Under the umbrella of the Spanish National Adaptation Plan to Climate Change (PNACC), AEMET was mandated to develop the production and update of such projections in coordination with the academic and research community. PNACC is the general reference frame tool for the coordination of Public Administrations' efforts dealing with the assessment of impacts, vulnerability, and adaptation to climate change in the Spanish sectors acknowledged as potentially affected. The long way traveled in these 16 years had not only meant steady progress but also sometimes inadequate decisions and consequently delays in the production of high-resolution climate change projections. From the lessons learned by the Spanish experience, our intention was to avoid a meandering progress and apply for the Central American region the most successful choices and solutions in the generation of high-resolution data and their use by affected sectors.
The consultation and involvement of potential users was considered a key component of the project. Also the user-friendliness of the viewer (see Sect. 4) was deemed to be a fundamental tool for ensuring an adequate flow of climate information from meteorological services to socio-economic sectors seeking to plan climate change adaptation measures.
During the years 2018–2019 a series of national workshops were held with users from sectors prioritized for climate change adaptation in each of the countries. The participating prioritized sectors were chosen by national hosts; however water, agriculture, public infrastructures and tourism sectors were cross-cutting among all Central American countries. The aim of these workshops was to present the project objectives and activities based on the Spanish experience and gather national users' views and needs. Representatives from different national institutions that were likely to use the downscaled scenarios generated as part of the project were invited to participate. A balance was sought between the number of attendees and sectors.
A typical workshop was structured as follows. They began with a presentation of the objectives and activities of the project, followed by sectoral group discussions. Then, the following topics were discussed with participants: (i) although underlying data has daily resolution, preferent levels of temporal aggregation can be envisaged and visualized: monthly, quarterly, annual, dry/wet season, among others; (ii) predetermined areas within the same country considering geographical, climatological or political criteria; (iii) initial list of climate variables and indicators for priority sectors; (iv) possible new capabilities of the viewer not included in the Spanish AdapteCCa viewer (https://escenarios.adaptecca.es, last access: 26 September 2022) initially taken as model to follow.
These initial workshops allowed, firstly, to publicize the project and viewer and, secondly, to gather information on the needs of the different sectors that could potentially be included in the preliminary version of the viewer. Finally, the suggestions were examined by the technical developers of the viewer and as many suggestions as possible were selected, taking into account the proposals and needs of all countries in the region and the timeframe of the project. At the same time these initial workshops allowed us to get some preliminary impression of the degree of familiarization by the different sectors and countries with projections data and their use to guide possible adaptation measures. The main general conclusions from the initial workshops were: (i) efforts should be pursued to convey good practices with the use of projections data; (ii) need to adapt some technical features in the Spanish viewer to Central American conditions; (iii) need to empower staff of Central American meteorological services and affected sectors to appropriate the viewer tool; (iv) need to reinforce the relationship between meteorological services and climate change offices and their respective roles related with climate change issues.
Throughout the year 2020, after the generation of a beta version of the viewer, a final round of national workshops was held with the following main objectives: (a) to present the results of the project to national users of climate change scenarios and (b) to familiarize users with the use of the viewer. In these national workshops, the main results of the project were described, including the calculated downscaled scenarios and a description of the viewer. Regarding the downscaled scenarios, the following aspects were presented: different types of scenarios calculated, data used and their peculiarities, downscaling methods, comparison of time series (observational/modeled data) and examples of scenario applications. The characteristics and functionalities of the viewer were also described in detail, alongside with the process for incorporating improvements in a second phase of the project. In addition, these workshops included the presentation of an example of the use of downscaled scenarios for integrated water resources management in Spain, given that this sector is considered a priority for the Central American region.
3.1 Methodology and downscaling techniques
Physically based global climate models (GCMs) are the main source of information to estimate future climate projections. Although GCMs can represent the main features of observed climate, they have two key limitations. First, there are substantial differences among GCMs -and the subsequent simulations- and therefore some estimation of this uncertainty coming from climate models should be addressed. Second, GCMs outputs are of too coarse scale to be directly used in impact and adaptation studies (Schoof, 2013; Peel et al., 2015; Lauri et al., 2012; Hernanz et al., 2021a, b).
To address the uncertainty coming from climate models requires analizing simulations from multiple GCMs and/or different ensemble members from each GCM. This uncertainty is just one of the cascade of uncertainties affecting the generation of climate projections (Wilby and Dessai, 2010) such as a “top-down” assessment of climate risks, going from future society, through greenhouse gas emissions, GCM simulations, regional scenarios, impact models and local impacts to an actual adaptation response. The relative importance of the different uncertainties depends on timescale, region, impact, relevant climate variables and other potential factors.
Downscaling (or regionalization) techniques are a critical step for providing actionable information at regional and local scales required by the community working on climate change impact and adaptation. Downscaling techniques have been developed to derive local climate change information from large-scale GCMs outputs (Rummukainen, 2012; Maraun et al., 2010). The two primary categories of downscaling techniques are (a) dynamic downscaling and (b) empirical/statistical downscaling (ESD), with both families having been widely reviewed (Rummukainen, 2012; Trzaska and Schnarr, 2014). Most dynamic downscaling methods obtain regional information by nesting a high-resolution regional climate model within a GCM whereas ESD methods are based on the existence of statistical relationships between large-scale variables (predictors) and local variables (predictands). Also, different downscaling methods add new uncertainty to the estimation of the future projected climate.
We have applied two statistical downscaling techniques – regression and analogue – to a large ensemble of GCM projections released through the World Climate Research Programme (WCRP) Coupled Model Intercomparison project Phase 5 (CMIP5; Taylor et al., 2012). Hernanz et al. (2021a, b) have evaluated both downscaling techniques for precipitation and maximum and minimum temperature whereas Amblar et al. (2020) have applied a similar procedure but for another domain. Here downscaled projections for the same variables (precipitation and maximum and minimum temperature) have been developed over the Central America region. These methods (e.g., Benestad, 2002) rely on statistical relationships linking GCM outputs (predictors) to the local surface variables, here precipitation and temperatures (predictands), over a particular domain (Maraun and Widmann, 2018). In general, these models or relationships are first trained (and tested) using some reanalysis and observed data during a representative historical period and later applied to new (e.g., future) GCM data to obtain the downscaled local projections.
Dynamically downscaled projections were provided by the CORDEX (Coordinated Regional Climate Downscaling Experiment) initiative (see Giorgi et al., 2009 and http://www.cordex.org, last access: 26 September 2022) established by the World Climate Research Programme (see https://www.wcrp-climate.org, last access: 26 September 2022) for evaluating and improving regional climate downscaling models and techniques and for producing coordinated sets of regional downscaled projections worldwide. The main objective of CORDEX is to provide an ensemble of highresolution data -by running different Regional Climate Models (RCMs) nested in a collection of GCMs- for evaluation of impacts and adaptation studies. Central America is one of the regions contemplated by the different domains where dynamically downscaled projections were computed. Table 1 shows the combination of GCMs and RCMs available for the Central America domain with a horizontal resolution of 50 km. CORDEX data were not bias corrected being therefore their use recommended as change with respect to the corresponding reference (historical) period.
3.2 Study area
The area for which this project was developed comprises the six Iberoamerican countries in Central America (Costa Rica, El Salvador, Guatemala, Honduras, Nicaragua and Panama) and is bordered by Mexico to the north, Belize to the north west, Colombia to the south, the Caribbean Sea to the east, and the Pacific Ocean to the west (see Fig. 1). The Central America topography is dominated by a highly active volcanic belt running along the Pacific seaboard from Mexico to Costa Rica with heavy vegetation. The climate of Central America is very much conditioned by the strong influence of the two major oceans and the trade winds. The highest temperatures occur in April, prior to the summer wet season, due to higher levels of sunlight, lower cloud cover and a decrease in trade winds, whereas the lowest occur during the winter dry season, when trade winds contribute to a cooler climate.
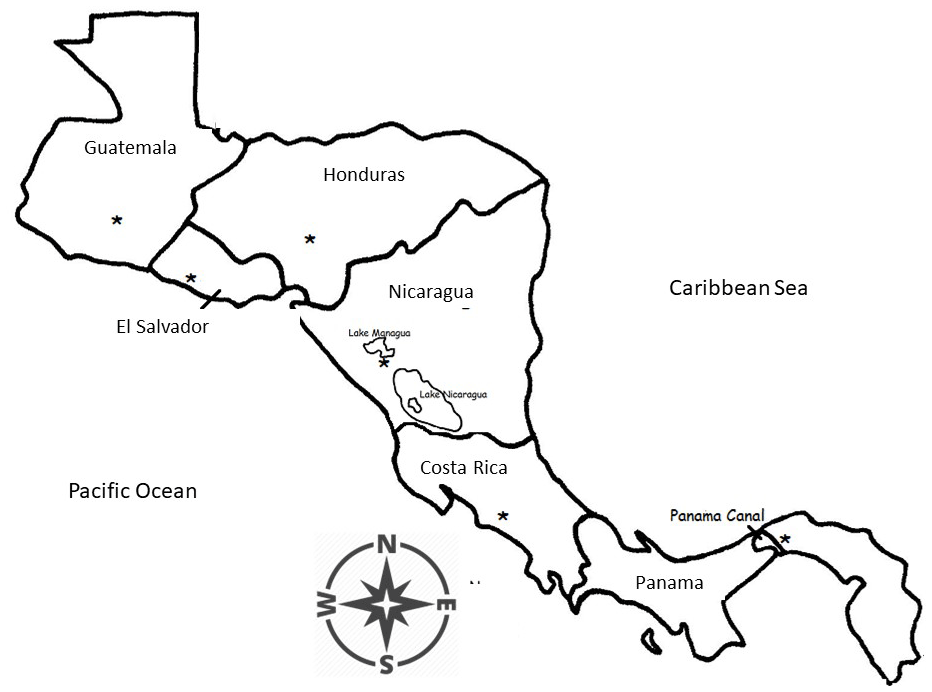
Figure 1Study area.
3.3 Data
Two types of downscaled projections, dynamical and statistical, have been incorporated to the visualization tool (see Sect. 4) for a better estimation of the uncertainties coming from GCMs simulations and downscaling techniques.
For statistical downscaling, daily precipitation and maximum/minimum temperature station data for historical predictands were provided by the participant NMHSs. Additionally, daily gridded observational data for precipitation (with 5 km resolution) from CHIRPS (Funk et al., 2015) and for maximum/minimum temperature (with 25 km resolution) from ERA5 (Hersbach and Dee, 2016; Hersbach et al., 2020) were used as predictands. The application of statistical downscaling to a highresolution observational grid partially circumvents the problems associated with the non-uniform distribution of observational in situ data (see e.g., Amblar-Francés et al., 2020). Besides, this data complements the widely used CORDEX data based on dynamical downscaling and allows to identify features that are dependent on the particular downscaling method.
Table 1Combination of GCMs and two RCMs for historical and scenarios simulations (see http://www.cordex.org, last access: 26 September 2022, for acronyms and models references).

Data for the predictors used in the calibration (over the period 1971–2000) and validation of the statistical algorithms come from the European Centre for Medium-Range Weather Forecasts (ECMWF) daily ERA-Interim reanalysis (Dee et al., 2011). ERA-Interim essentially represents the large-scale state of the observed atmospheric predictors and the point-scale predictands. The precise predictor variables used depend on the specific downscaling method and the chosen variable (see Hernanz et al., 2021a, b; Petisco de Lara, 2008a, b; Amblar-Francés et al., 2017). The climate predictors of interest are selected using knowledge of physical processes as well as identifying those highly correlated with the predictand.
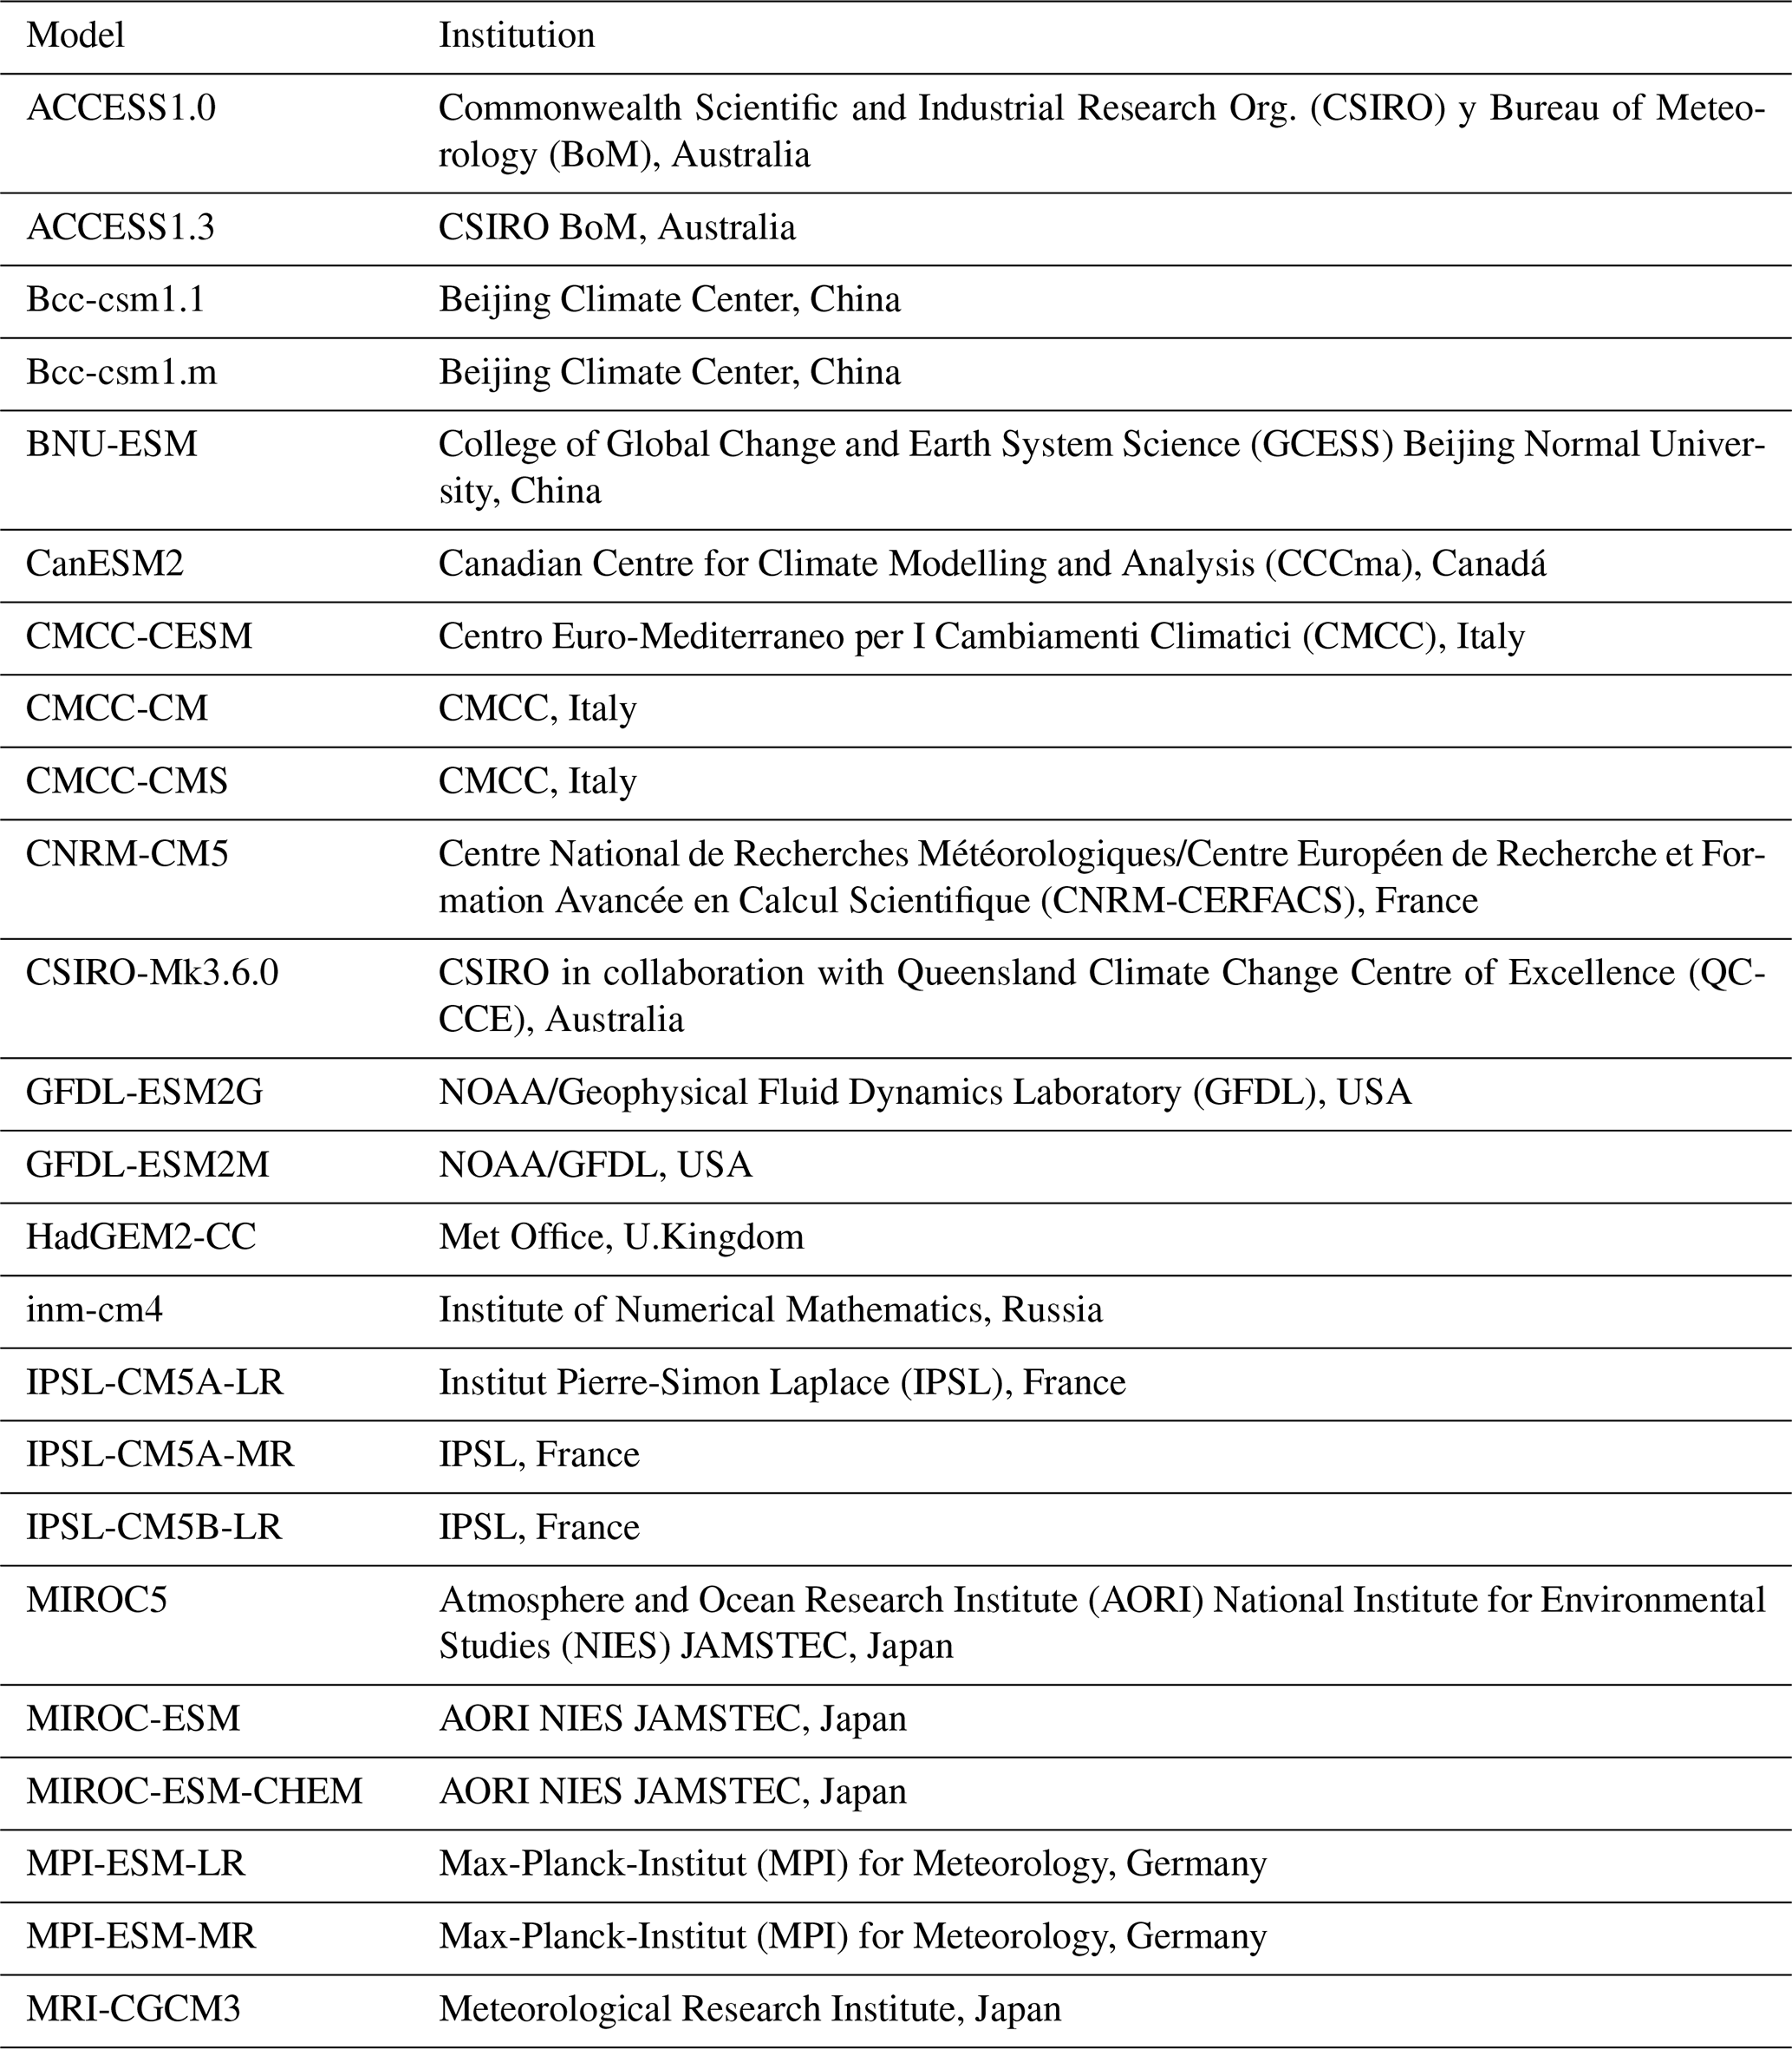
Finally, we have made use of projections of 23 different GCMs from the CMIP5 (Table 2) and three Representative Concentration Pathways (RCPs) for the statistical downscaling. The selection of CMIP5 models was simply based on the availability of the predictors needed by the two downscaling methods (see Amblar-Francés el al., 2020).
Table 2List of GCMs used for their downscaling with two statistical downscaling methods (see interpretation of acronyms and models.
A key element of the project has been the development of a web based viewer to provide a user friendly interface for visualization and also downloading the projections (see Fig. 2).
The viewer is available on the Centro Clima website (https://centroclima.org/escenarios-cambio-climatico, last access: 26 September 2022) managed by the Regional Committee for Hydraulic Resources from the Central American Integration System (CRRH-SICA, https://www.sica.int, last access: 26 September 2022). It is originally based on the one developed as part of the Climate Change National Adaptation Plan of Spain (http://escenarios.adaptecca.es, last access: 26 September 2022).
The viewer allows consultations on 37 different climatic variables and derived indices, obtained from the downscaled projections, based on dynamical (50 km resolution) and statistical (25 km resolution for temperature and 5 km resolution for precipitation) methods. Three commonly used emission scenarios are considered (RCP4.5, RCP6.0 and RCP8.5) as well as a reference (historical) period.
The application allows the information to be consulted either in the form of maps or time series. For each variable and index, the application displays interactive maps for the historical average (1970–2000) as well as the projected climatology for three future 30 year periods: near (2011–2040), middle (2041–2070) and far (2071–2100) future. Time series can be generated with different levels of geographical aggregation ranging from the whole domain for which the scenarios have been generated up to National Departments or even user-defined areas. Information can be consulted either as the actual value of the variable or index considered or as its difference with respect to the historical climate. Time series can also be aggregated on a monthly, seasonal (user defined) and annual basis showing individual model simulations, the multi-model average and some estimation of the uncertainty based on the dispersion of individual simulations. Finally, the user selected information can be downloaded in different formats, both for graphics and data. Underlying daily data are also available for off-line downloading. The viewer will be updated as new data and information on downscaled climate change projections are generated and also with new products demanded by users.
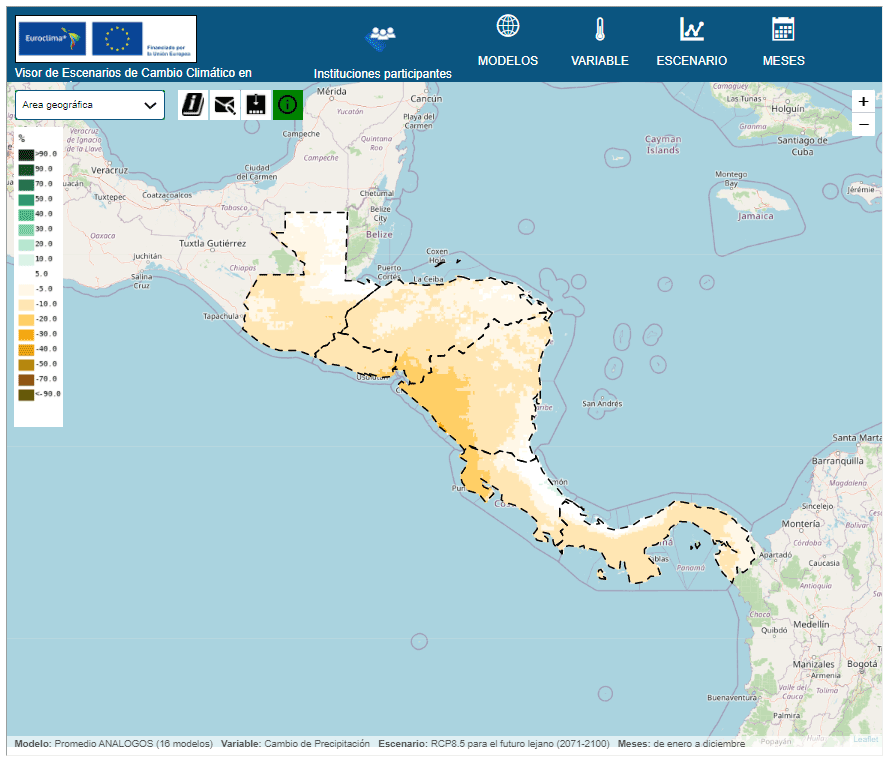
Figure 2Screenshot showing viewer home page.
All the sources of uncertainty mentioned in Sect. 3.1 can be easily explored in the viewer through the selection of different emission scenarios, GCMs and downscaling techniques. For example, in Fig. S1 the expected change in maximum temperature under the RCP4.5 for the end of the century given by the multimodel ensemble mean of dynamical downscaling and the two statistical downscaling techniques is shown. This type of comparison allows us to estimate the degree of agreement or disagreement between the different downscaling techniques. On the other hand, Fig. S2 shows the expected evolution of maximum temperature under the same scenario by the three downscaling techniques, allowing to determine the level of agreement among the different GCMs. Figures S3–S6 show the same information but for minimum temperature and for precipitation. Additionally, the same maps can be displayed for one particular GCM instead for the ensemble mean, the evolution graphs can be restricted to a specific subregion, and a disaggregation by seasons/months can also be displayed. The number of combinations available in the viewer is extremely high (different RCPs, GCMs, downscaling techniques, climate indexes, etc.) so only a small sample has been included in the Supplement.
Training of technical staff from the Iberoamerican NMHSs in the techniques and procedures for the generation of local climate change scenarios is one of the activities that has been carried out since 2008 at the initiative of the CIMHET. The fifth edition of the course was held in Montevideo (Uruguay) in June 2018; in this course the technicians of Central American meteorological services formed the initial core of the Central American working group for the development of the scenario generation project supported by EUROCLIMA+.
Following this general and introductory course, three other courses were held, organized specifically in the context of the present project, and focused on different topics related to different aspects of downscaled scenario generation.
The first course on “Extraction and Use of CORDEX Data” (San Salvador, 25 February to 1 March 2019) focused on showing the different tools and procedures available for the extraction and use of data from dynamically downscaled climate projections made publicly available by the CORDEX project. The course was eminently practical and participants generated examples of the evolution of indices of extremes for their respective countries from this type of data. The course lasted one week with 28 teaching hours.
The second course was a “Basic Course on Climate Services” (Mexico DF, 17–28 June 2019) and was conceived in the framework of an institutional agreement between AEMET and the Rovira i Virgili University (URV). Taking advantage of the synergies of the Climate Change Scenarios project of EUROCLIMA+, it was decided to focus the first edition of this course on Central America and neighboring countries (Colombia, Venezuela, Cuba, Mexico). Finally, the course was integrated into the training activities of the EUROCLIMA+ project. The course lasted two weeks with 56 teaching hours.
The third course on “Statistical Methods of Downscaling for Climate Change Projections” (Managua, 14–18 October 2019) had as its main objective to show the different statistical methods for downscaling climate projections from GCMs and their suitability for estimating uncertainties in projections coming mainly from three sources: emission scenarios, GCMs and downscaling techniques. The course lasted one week with 28 teaching hours.
In parallel, the Panamanian Ministry of Environment requested EUROCLIMA+ to provide training on downscaled climate change scenarios to technicians of the Ministries of Environment with responsibility on climate change issues, in particular in the management of downscaled climate change scenarios for their use in impacts and adaptation to climate change issues. The course was aimed to review the concepts and methodologies related to climate change scenarios, show examples of limitations in their use, good practices and application in sectors affected by climate change. This course was held in Panama in a face-to-face manner. Shortly after, the other countries participating in the project showed interest in this course and, therefore, it was planned to repeat it in each country. Because of the COVID pandemic, the course could only be held in a face-to-face manner in Nicaragua, and then it had to be adapted to a virtual format. The virtual sessions of the course were held in October 2020 and the generated didactic material was used to create a permanent virtual course (available upon request to the first author) in the FIIAPP moodle platform.
Although we attempted to select participants with a very defined background and work responsibilities for all courses and training events, the high diversity of knowledge and skills was a clear obstacle to ensuring more efficient communication with all participants. The main reason behind such a diverse background is to a certain extent related with differences in the degree of development of climate units in the respective meteorological services. Whereas some services in the region had created special climate units tasked with the generation of high-resolution climate change projection data with the specific purpose of feeding the impacts and adaptation community, others -on the contrary- were still in the process of creating such units or even lack of them. The lack of continuity of the same participants in all training events – mainly due to their need to cover duties at their home services – was also an impediment for a more efficient training. To palliate this issue the project has increasingly benefited from the introduction of virtual and online tools allowing an easy and continuous access to the training material generated during the life of the project and beyond.
Some general ideas on how to generate and use downscaled climate change projections were pervading all courses. The uncertainty inherent to all steps in the generation of downscaled projections, and consequently the probabilistic nature of the projections, the need of some evaluation either of each step in the generation (selection of GCMs, properties of the downscaling algorithms, combination of different sources of information, etc.) or of the final downscaled data, the climatic use and interpretation of data, etc. were some of the recurrent topics cross cutting all training events.
After learning from previous similar projects conducted in some countries of the region, the main challenge for this project was to transfer the developed tool, knowledge and know-how to regional experts. Some past projects and experiences succeeded in generating downscaled projections data but failed in transferring knowledge to the staff of Central American meteorological services. Behind this insufficient transfer there were several (sometimes coincident) factors which we tried to evade in this project. First, whereas private consultants or research groups were the main actors in previous experiences, this project was mainly developed making use of public service experts sharing the perspective of the recipient governmental institutions. Second, this project -unlike previous ones- was originally conceived and governed under the umbrella of a long-standing and existing meteorological network that will guarantee the future continuity of this action. Third, this project -contrary to earlier similar ones- is part of other cooperation initiatives in the region related with meteorology and climate, also piloted by CIMHET, aiming to consolidate and reinforce common responses to challenges exceeding national borders. We may well say that the original plan focused on data and tools developing, capacity building, and knowledge transferring was reasonably met.
The Central America Scenarios project had three main objectives: (i) generate downscaled projections; (ii) integrate them in an user friendly tool for their visualization and download; (iii) capacity building and training.
The generation of downscaled projections using the same input data and methodology allows a joint analysis for the whole Central American region and at the same time has the capability to focus on national and sub-national levels. The high number of simulations significantly improves the situation prior to the start of the action, where each country had a limited number of projections that differed in terms of background information, methodology and resolution.
The development and maintenance of a visualization and download tool has resulted to be a key element for facilitating the use of and access to climate information by the community of impacts and adaptation to climate change. The information contained in the viewer can serve as a basis for developing specific climate services for different user groups.
National meteorological services in the region have strengthened their capacities in generating downscaled projections enabling them to provide the climate scenario information required by national governments for national communications on climate change to the United Nations Framework Convention on Climate Change and for the adoption of adaptation measures to climate change in affected sectors. As a result of the project the Central America national meteorological services has created stable units to develop and produce downscaled projections. These groups are strongly coordinated among themselves and will be the germ of further developments in this area of work.
Special emphasis has been put on good practices in the use and interpretation of the viewer data such as: exploration of uncertainties, making a climatic use of available data, expression of projections in a probabilistic way, need of correcting model bias, need of a previous assessment of the GCMs, etc. It may well be said that the analysis and comparison of all the information contained in the viewer should be the general rule to get a clear idea of the uncertainties coming from different sources during the generation of high-resolution projections: different emission scenarios, different GCMs and different downscaling techniques.
Close interaction with final users and different capacity building events developed along the project has allowed us to conclude that a proper understanding of the basic concepts associated with regionalised climate change scenarios is essential for their proper management, use and application.
To ensure the success and continuity of the platform beyond the end of the project some actions were taken. First, creation of a working group -with representatives from all participating NMHSs having strong technical capabilities- tasked with updating regionalised scenarios and committed to the maintenance and upgrading of the visualization tool. The working group also seeks fostering interaction with users by responding quickly to their demands and needs and allowing for an efficient flow of information, enabling faster progress towards understanding risks and vulnerabilities and planning sector-specific adaptation measures. Second, reinforcement of the relationship among the Central American national meteorological services and AEMET within the frame of the CIMHET. Third, continuous support and coordination by the Spanish cooperation agency FIIAPP and the EUROCLIMA+ programme. Forth, although the visualization tool was mainly developed, initially maintained and hosted by AEMET, it was migrated to a server in the region and is now maintained by Central American experts with technical support (as needed) from AEMET. Finally, as detailed in Sect. 7, a new plan including update of projections and liaison with relevant sectors in the region affected by the changing climate conditions is being discussed and developed.
After the generation of downscaled projections based on CMIP5 and the implementation of a viewer for exploration and download of data, it was clear that the maintenance and upgrade of the visualization tool was the main task ahead.
Shortly after the generation of data based on CMIP5, a new cycle of GCMs data (based on CMIP6) started to be available for their use on different downstream applications. Therefore efforts are underway for computing new regionalizations of the new CMIP6 models. Again, the basic data in the new cycle will consist of dynamically downscaled projections provided by the CORDEX initiative and statistically downscaled projections generated within the project itself.
New sectoral climate change indicators will be added after a round of workshops with the most relevant sectors in the region affected by the changing climate conditions. The identification of new sectoral indicators will be jointly agreed with the affected sectors and it is intended to steadily enhance their number in the viewer.
All data generated in this project are available and downloadable from the website https://centroclima.org/escenarios-cambio-climatico (CRRH-SICA, 2020).
The supplement related to this article is available online at: https://doi.org/10.5194/asr-19-105-2022-supplement.
ERC coordinated all technical aspects and wrote the original draft. SC coordinated the overall project and wrote the original draft. AH contributed to development of downscaling algorithms. JT wrote the original draft and contributed to the design and supervision of the project.
The contact author has declared that none of the authors has any competing interests.
Publisher’s note: Copernicus Publications remains neutral with regard to jurisdictional claims in published maps and institutional affiliations.
This article is part of the special issue “21st EMS Annual Meeting – virtual: European Conference for Applied Meteorology and Climatology 2021”.
Special thanks to Ignacio Villarino, Miguel Herrero, Inmaculada Abia and Nieves Garrido from AEMET-Castilla Leon for their contributions to the development of the viewer; to Petra Ramos, Pilar Amblar, María Asunción Pastor and Antonio Serrano for their involvement in training activities and generation of downscaled climate change projections; to the staff of NMHSs that support the development of the project and also to the staff of CRRH-SICA for hosting the viewer.
The research leading to these results has received funding from the EU EUROCLIMA+ programme. EUROCLIMA+ is a regional cooperation programme between the European Union and Latin America focused on public policies to address climate change.
This paper was edited by Stefanie Gubler and reviewed by two anonymous referees.
Amblar-Francés, P., Casado-Calle, M. J., Pastor-Saavedra, M. A., Ramos-Calzado, P., and Rodríguez-Camino, E.: Guía de escenarios regionalizados de cambio climático sobre España a partir de los resultados del IPCC-AR5 [Guide to downscaled climate change scenarios for Spain based on IPCC-AR5 models], Tech. Report, AEMET, Madrid., https://doi.org/10.31978/014-17-010-8, 2017.
Amblar-Francés, M. P., Pastor-Saavedra, M. A., Casado-Calle, M. J., Ramos-Calzado, P., and Rodríguez-Camino, E.: Strategy for generation of climate change projections feeding Spanish impact community, Adv. Sci. Res., 15, 217–230, https://doi.org/10.5194/asr-15-217-2018, 2018.
Amblar-Francés, M. P., Ramos-Calzado, P., Sanchis-Lladó, J., Hernanz-Lázaro, A., Peral-García, M. C., Navascués, B., Dominguez-Alonso, M., Pastor-Saavedra, M. A., and Rodríguez-Camino, E.: High resolution climate change projections for the Pyrenees region, Adv. Sci. Res., 17, 191–208, https://doi.org/10.5194/asr-17-191-2020, 2020.
Benestad, R. E.: Empirically downscaled temperature scenarios for northern Europe based on a multi-model ensemble, Climate Res., 21, 105–125, 2002.
CRRH-SICA: Data and institutional website developed by Ramos-Calzada, P., Amblar-Frances, P., Serrano de la Torre, A., Herrero, M., Hernanz, A., Sanchís-Lladó, J., Pastor-Saavedra, M. A., Villarino-Barrera, J. I., Abia-Llera, I., Garrido del Pozo, N., and Rodriguez-Camino, E.: Escenarios de Cambio Climático para Centroamérica [Climate Change Scenarios for Central America], Comité Regional de Recursos Hídricos – Sistema de la Integración Centroamericana (CRRH-SICA) [data set], https://centroclima.org/escenarios-cambio-climatico (last access: 26 September 2022), 2020.
Dee, D. P., Uppala, S. M., Simmons, A. J., Berrisford, P., Poli, P., Kobayashi, S., Andrae, U., Balmaseda, M. A., Balsamo, G., Bauer, P., Bechtold, P., Beeljars, A. C. M., van den Berg, L., Bidlot, J., Bormann, N., Delsol, C., Dragani, R., Fuentes, M., Geer, A. J., Haimberger, L., Healy, S. B., Hersbach, H., Hólm, E. V., Isaksen, L., Kållberg, P., Köhler, M., Matricardi, M., McNally, A. P., Monge-Sanz, B. M., Morcrette, J.-J., Park, B.-K., Peubey, C., de Rosnay, P., Tavolato, C., Thépaut, J.-N., and Vitart, F.: The ERA-Interim reanalysis: configuration and performance of the data assimilation system, Q. J. Roy. Meteorol. Soc., 137, 553–597, https://doi.org/10.1002/qj.828, 2011.
Funk, C., Peterson, P., Landsfeld, M., Pedreros, D., Verdin, J., Shukla, S., Husak, G., Rowland, J., Harrison, L., Hoell, A., and Michaelsen, J.: The climate hazards infrared precipitation with stations – a new environmental record for monitoring extremes, Sci. Data 2, 150066, https://doi.org/10.1038/sdata.2015.66, 2015.
Giorgi, F., Jones, C., and Asrar, G.: Addressing climate information needs at the regional level: The CORDEX framework, WMO Bull., 58, 175–183, 2009.
Hersbach, H. and Dee, D.: ERA5 reanalysis is in production, ECMWF Newsletter, 147, 5–6, 2016.
Hersbach, H., Bell, B., Berrisford, P., Hirahara, S., Horányi, A., Muñoz-Sabater, J., Nicolas, J., Peubey, C., Radu, R., Schepers, D., Simmons, A., Soci, C., Abdalla, S., Abellan, X., Balsamo, G., Bechtold, P., Biavati, G., Bidlot, J., Bonavita, M., De Chiara, G., Dahlgren, P., Dee, D., Diamantakis, M., Dragani, R., Flemming, J., Forbes, R., Fuentes, M., Geer, A., Haimberger, L., Healy, S., Hogan, R. J., Hólm, E., Janisková, M., Keeley, S., Laloyaux, P., Lopez, P., Lupu, C., Radnoti, G., de Rosnay, P., Rozum, I., Vamborg, F., Villaume, S., and Thépaut, J.-N.: The ERA5 global reanalysis, Q. J. Roy. Meteorol. Soc., 146, 1999–2049, https://doi.org/10.1002/qj.3803, 2020.
Hernanz, A., García-Valero, J. A., Domínguez, M., Ramos-Calzado, P., Pastor-Saavedra, M. A., and Rodríguez-Camino, E.: Evaluation of statistical downscaling methods for climate change projections over Spain: present conditions with perfect predictors, Int. J. Climatol., 42, 762–776, https://doi.org/10.1002/joc.7271, 2021a
Hernanz, A., García-Valero, J. A., Domínguez, M., and Rodríguez-Camino, E.: Evaluation of statistical downscaling methods for climate change projections over Spain: Future conditions with pseudo reality (transferability experiment), Int. J. Climatol., 42, 3987–4000, https://doi.org/10.1002/joc.7464, 2021b.
Lauri, H., de Moel, H., Ward, P. J., Räsänen, T. A., Keskinen, M., and Kummu, M.: Future changes in Mekong River hydrology: impact of climate change and reservoir operation on discharge, Hydrol. Earth Syst. Sci., 16, 4603–4619, https://doi.org/10.5194/hess-16-4603-2012, 2012.
Maraun, D. and Widmann, M.: Statistical Downscaling and Bias Correction for Climate Research, Cambridge: Cambridge University Press, https://doi.org/10.1017/9781107588783, 2018.
Maraun, D., Wetterhall, F., Ireson, A. M., Chandler, R. E.,Kendon, E. J., Widmann, M., Brienen, S., Rust, H. W., Sauter, T.,Themeßl, M., Venema, V. K. C., Chun, K. P., Goodess, C. M.,Jones, R. G., Onof, C., Vrac, M., and Thiele-Eich, I.: Precipitation downscaling under climate change: recent develop-ments to bridge the gap between dynamical models and the end user, Rev. Geophys., 48, RRG3003, https://doi.org/10.1029/2009RG000314, 2010.
Peel, M. C., Srikanthan, R., McMahon, T. A., and Karoly, D. J.: Approximating uncertainty of annual runoff and reservoir yield using stochastic replicates of global climate model data, Hydrol. Earth Syst. Sci., 19, 1615–1639, https://doi.org/10.5194/hess-19-1615-2015, 2015.
Petisco de Lara, S. E.: Método de regionalización de precipitación basado en análogos: explicación y validación [Downscaling of precipitation based on analogs: method and validation], Tech. Note AEMCC-3A, AEMET, Madrid, http://hdl.handle.net/20.500.11765/5220 (last access: 26 September 2022), 2008a.
Petisco de Lara, S. E.: Método de regionalización de temperatura basado en análogos: explicación y validación [Downscaling of temperature based on analogs: method and validation], Tech. Note AEMCC-3B, AEMET, Madrid, http://hdl.handle.net/20.500.11765/5221 (last access: 26 September 2022), 2008b.
Rummukainen, M.: State-of-the-art with Regional Climate Models, Wiley Interdisciplin. Rev.: Clim. Change, 1, 82–96, 2012.
Schoof, J. T.: Statistical downscaling in climatology, Geography Compass, 7, 249–265, https://doi.org/10.1111/gec3.12036, 2013.
Taylor, K. E., Stouffer, R. J., and Meehl, G. A.: An Overview of CMIP5 and the experiment design, B. Am. Meteor. Soc., 93, 485–498, https://doi.org/10.1175/BAMS-D-11-00094.1, 2012.
Trzaska, S. and Schnarr, E.: A Review of Downscaling Methods for Climate Change Projections: African and Latin American Resilience to Climate Change (ARCC), http://www.ciesin.org/documents/Downscaling_CLEARED_000.pdf (last access: 26 September 2022), 2014.
Wilby, R. L. and Dessai, S.: Robust adaptation to climate change, Weather, 65, 180–185, 2010.
- Abstract
- Introduction and motivation
- Identification of users' needs
- Generation of downscaled climate change projections
- Climate change viewer
- Capacity building for scenario development
- Conclusion and lessons learned
- Future steps
- Data availability
- Author contributions
- Competing interests
- Disclaimer
- Special issue statement
- Acknowledgements
- Financial support
- Review statement
- References
- Supplement