 | 21 Apr 2023
Spatiotemporal investigation of wet–cold compound events in Greece
Iason Markantonis
Diamando Vlachogiannis
Athanasios Sfetsos
Ioannis Kioutsioukis
Nadia Politi
Climate change is set to affect extreme climate and meteorological events. The combination of interacting physical processes (climate drivers) across various spatial and temporal scales resulting to an extreme event is referred to as compound event. The complex geography and topography of Greece forms a variety of regions with different local climate conditions affecting the daily minimum temperature and precipitation distributions and subsequently the distribution of compound events of low temperature and high precipitation values. The aim of our study in this work is to identify these wet–cold events based on observational data from the Hellenic National Meteorological Service (HNMS) stations, which are divided into five different geographical categories, in the period 1980–2004 and coldest months of the year (November-April) on monthly basis. Two available reanalysis products, that of ERA-Interim downscaled with the Weather Research and Forecasting (WRF) model at 5km horizontal resolution (WRF_5), and the coarser resolution (∼30 km) ERA5 Reanalysis dataset from European Centre for Medium-Range Weather Forecasts (ECMWF), are adopted to derive a gridded monthly spatial distribution of wet–cold compound events, after performing a comparison with the observations. The results yield that the monthly maximum HNMS probabilities range from 0.07 % in April to 0.85 % in February, ERA5 range from 0.4 % in April to 2.97 % in February and WRF_5 from 10.4 % in November to 25.04 % in February. The results also displayed that February, January and December, are in this order, the months with the highest WCCEs.
- Article
(7246 KB) - Full-text XML
- BibTeX
- EndNote


This work follows as a more meticulous study of the participating presentation at the EMS annual meeting hosted online 6–10 September 2021 (Markantonis et al., 2021). The motivation for this is the absence of studies that examine extreme wet–cold compound events (WCCEs) in Greece, although Greece as part of the Mediterranean is considered a region affected by WCCEs (Zhang et al., 2021). Similar studies have been conducted for the Mediterranean, but not analytically for Greece (Lazoglou and Anagnostopoulou, 2019; De Luca et al., 2020; Hochman et al., 2022; Vogel et al., 2021). WCCEs may have a negative short-term socio-economic impact due to low temperatures and heavy precipitation, causing damages to infrastructures, agriculture, electricity outages and transportation disruptions (Houston et al., 2006; Llasat et al., 2014; Vajda et al, 2014). On the other hand, they have a positive impact on freshwater availability, winter tourism and ecosystem stability (García-Ruiz et al., 2011; Trujillo et al., 2012; Pestereva et al., 2012; Demiroglu et al., 2015).

Figure 1Map of HNMS stations groups (a) and stations on orography of (b) ERA5 and (c) WRF_5. The numbers correspond to those at Table A1.
This study aims to examine the monthly spatiotemporal variation of WCCEs in Greece in the period between 1980–2004 continuing the work of the authors that examines the consequences of Climate Change on WCCEs in Greece (Markantonis et al., 2022). The current investigation focuses on the simultaneous occurrence of daily extreme values for minimum temperature (TN) and accumulated precipitation (RR) on monthly basis, between November and April, months with at least one observed event in the Hellenic National Meteorological Service (HNMS) station timeseries. The stations available by HNMS are divided adopting geographical criteria to examine the geographical distribution of WCCEs probabilities. HNMS observations are compared with the datasets from the two available reanalysis products. The spatiotemporal analysis is concluded by adopting those products to simulate the monthly climatology of WCCEs in Greece This analysis includes regions without observations that yield significantly higher probabilities compared to any available HNMS time-series even in April or November, months that only few stations exhibit positive WCCEs probabilities.
HNMS provides freely observational data from 21 stations for the purpose of scientific research (http://emy.gr/emy/el/services/paroxi-ipiresion-elefthera-dedomena, last access: 19 April 2023). The data have been evaluated by HNMS and the time-series have no missing or distorted values. The time-series available for the historic period 1980–2004 have a 3 h temporal resolution and from these values we extract the daily values of TN and RR. The position of the stations is shown in Fig. 1 and information on the characteristics of the stations are available in Table A1. Figure 1a also presents the division of the stations into five categories based on the criteria explained in the Methodology section.
The absence of the necessary dense network of stations for the investigation of WCCEs distribution in Greece between 1980 and 2004, lead us to adopt a dynamical downscaling of ERA-Interim (Dee et al., 2011) of approximately 80 km resolution using the WRF model (reference WRF model here) in the configuration described by Politi et al. (2018, 2021) at 5 km resolution. We denote the produced data set as WRF_5. The second reanalysis product adopted is the latest available reanalysis product ERA 5 from the European Centre for Medium-Range Weather Forecasts (ECMWF) of spatial resolution ∼30 km × 30 km (Hersbach et al., 2020). Although, the resolution is much coarser than that of WRF_5, ERA 5 is a novel and more advanced reanalysis product. The elevation range of WRF_5 is also much broader than ERA5 (Fig. 1b and c) simulating the orography with greater detail, a major factor in the temperature equation.
3.1 Thresholds selection
TN-RR WCCEs are studied by adopting an approach that examines a constant threshold for each variable regardless of station or grid point. This approach adopts the fixed threshold of 20 mm d−1 for RR and 0 ∘C for TN for all stations and grid points. TN equal to or under 0 ∘C indicates a Frost Day (FD) (Fonseca et al., 2016), while RR equal to or higher than 20 mm d−1 is considered a heavy precipitation day (RR20) (Kundzewicz et al., 2006). Both indices are also proposed by the joint CCl/CLIVAR/JCOMM Expert Team (ET) on Climate Change Detection and Indices (ETCCDI). We investigate WCCEs (or RR20-FD) during the years 1980 to 2004 and the months November to April as the predominant cold season in Greece and the months with observed events according to HNMS stations. This leads to seven different time series, one for each month of the period and one for all months as a total.
3.2 Validation
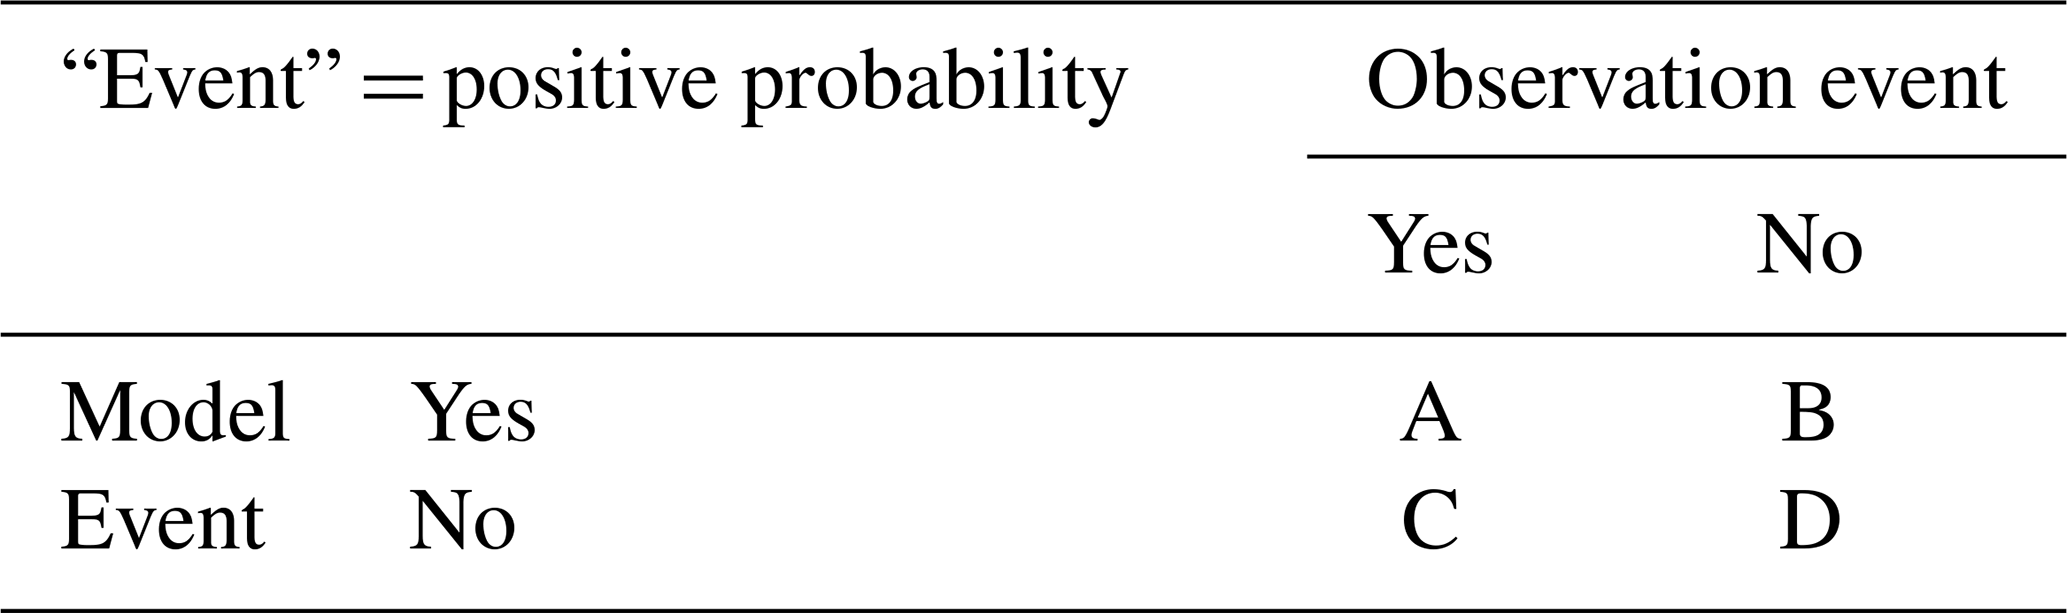
Validation of the reanalysis models' datasets is conducted in the respective grid cells of the stations performing the nearest neighbour approach. Simulated temperature values are corrected with respect to the real elevation of the stations based on the equation: if Hm>Hs and if Hm<Hs. This procedure ensures that the different data sets are evaluated at the same elevation to observations. This approach applies the assumption of a constant temperature gradient which is a limitation of this study. Moreover, the 21 stations are grouped into five categories as suggested by Emmanouil et al. (2021), based on geographical criteria (Fig. 1a). Six of the stations belong to two categories (Table A2), as they fulfil more than one criterion. Thus, validation is conducted for each category separately and for the total number of stations. Analytically, North stations are located at a latitude higher than the 40th parallel. The West stations are located western of the Pindus Mountain range. Mainland stations are also divided in two more categories, with Seaside stations concerning those which are coastal, while the Continental ones have a greater distance from the coastline. Finally, the last category consists of stations located in the Aegean Islands. WCCEs probabilities for each station and model are presented in the supplementary material. BIAS and RMSE along with the Critical Success Index (CSI) are used for the validation. CSI is calculated as: . A, B and C symbolize elements from the contingency table (Table 1) that occur from comparing the zero and the nonzero number of occurrencesin stations with the corresponding model grid cells.
4.1 Observations-reanalysis comparison
Figure 2 presents WCCEs probabilities observed at the geographical categories in which all the stations are divided and the responding grid points of the reanalysis models available. The results are also displayed on monthly basis from November to April (Fig. 2a–f) and Fig. 2g displays the aggregated probabilities for the entire period.
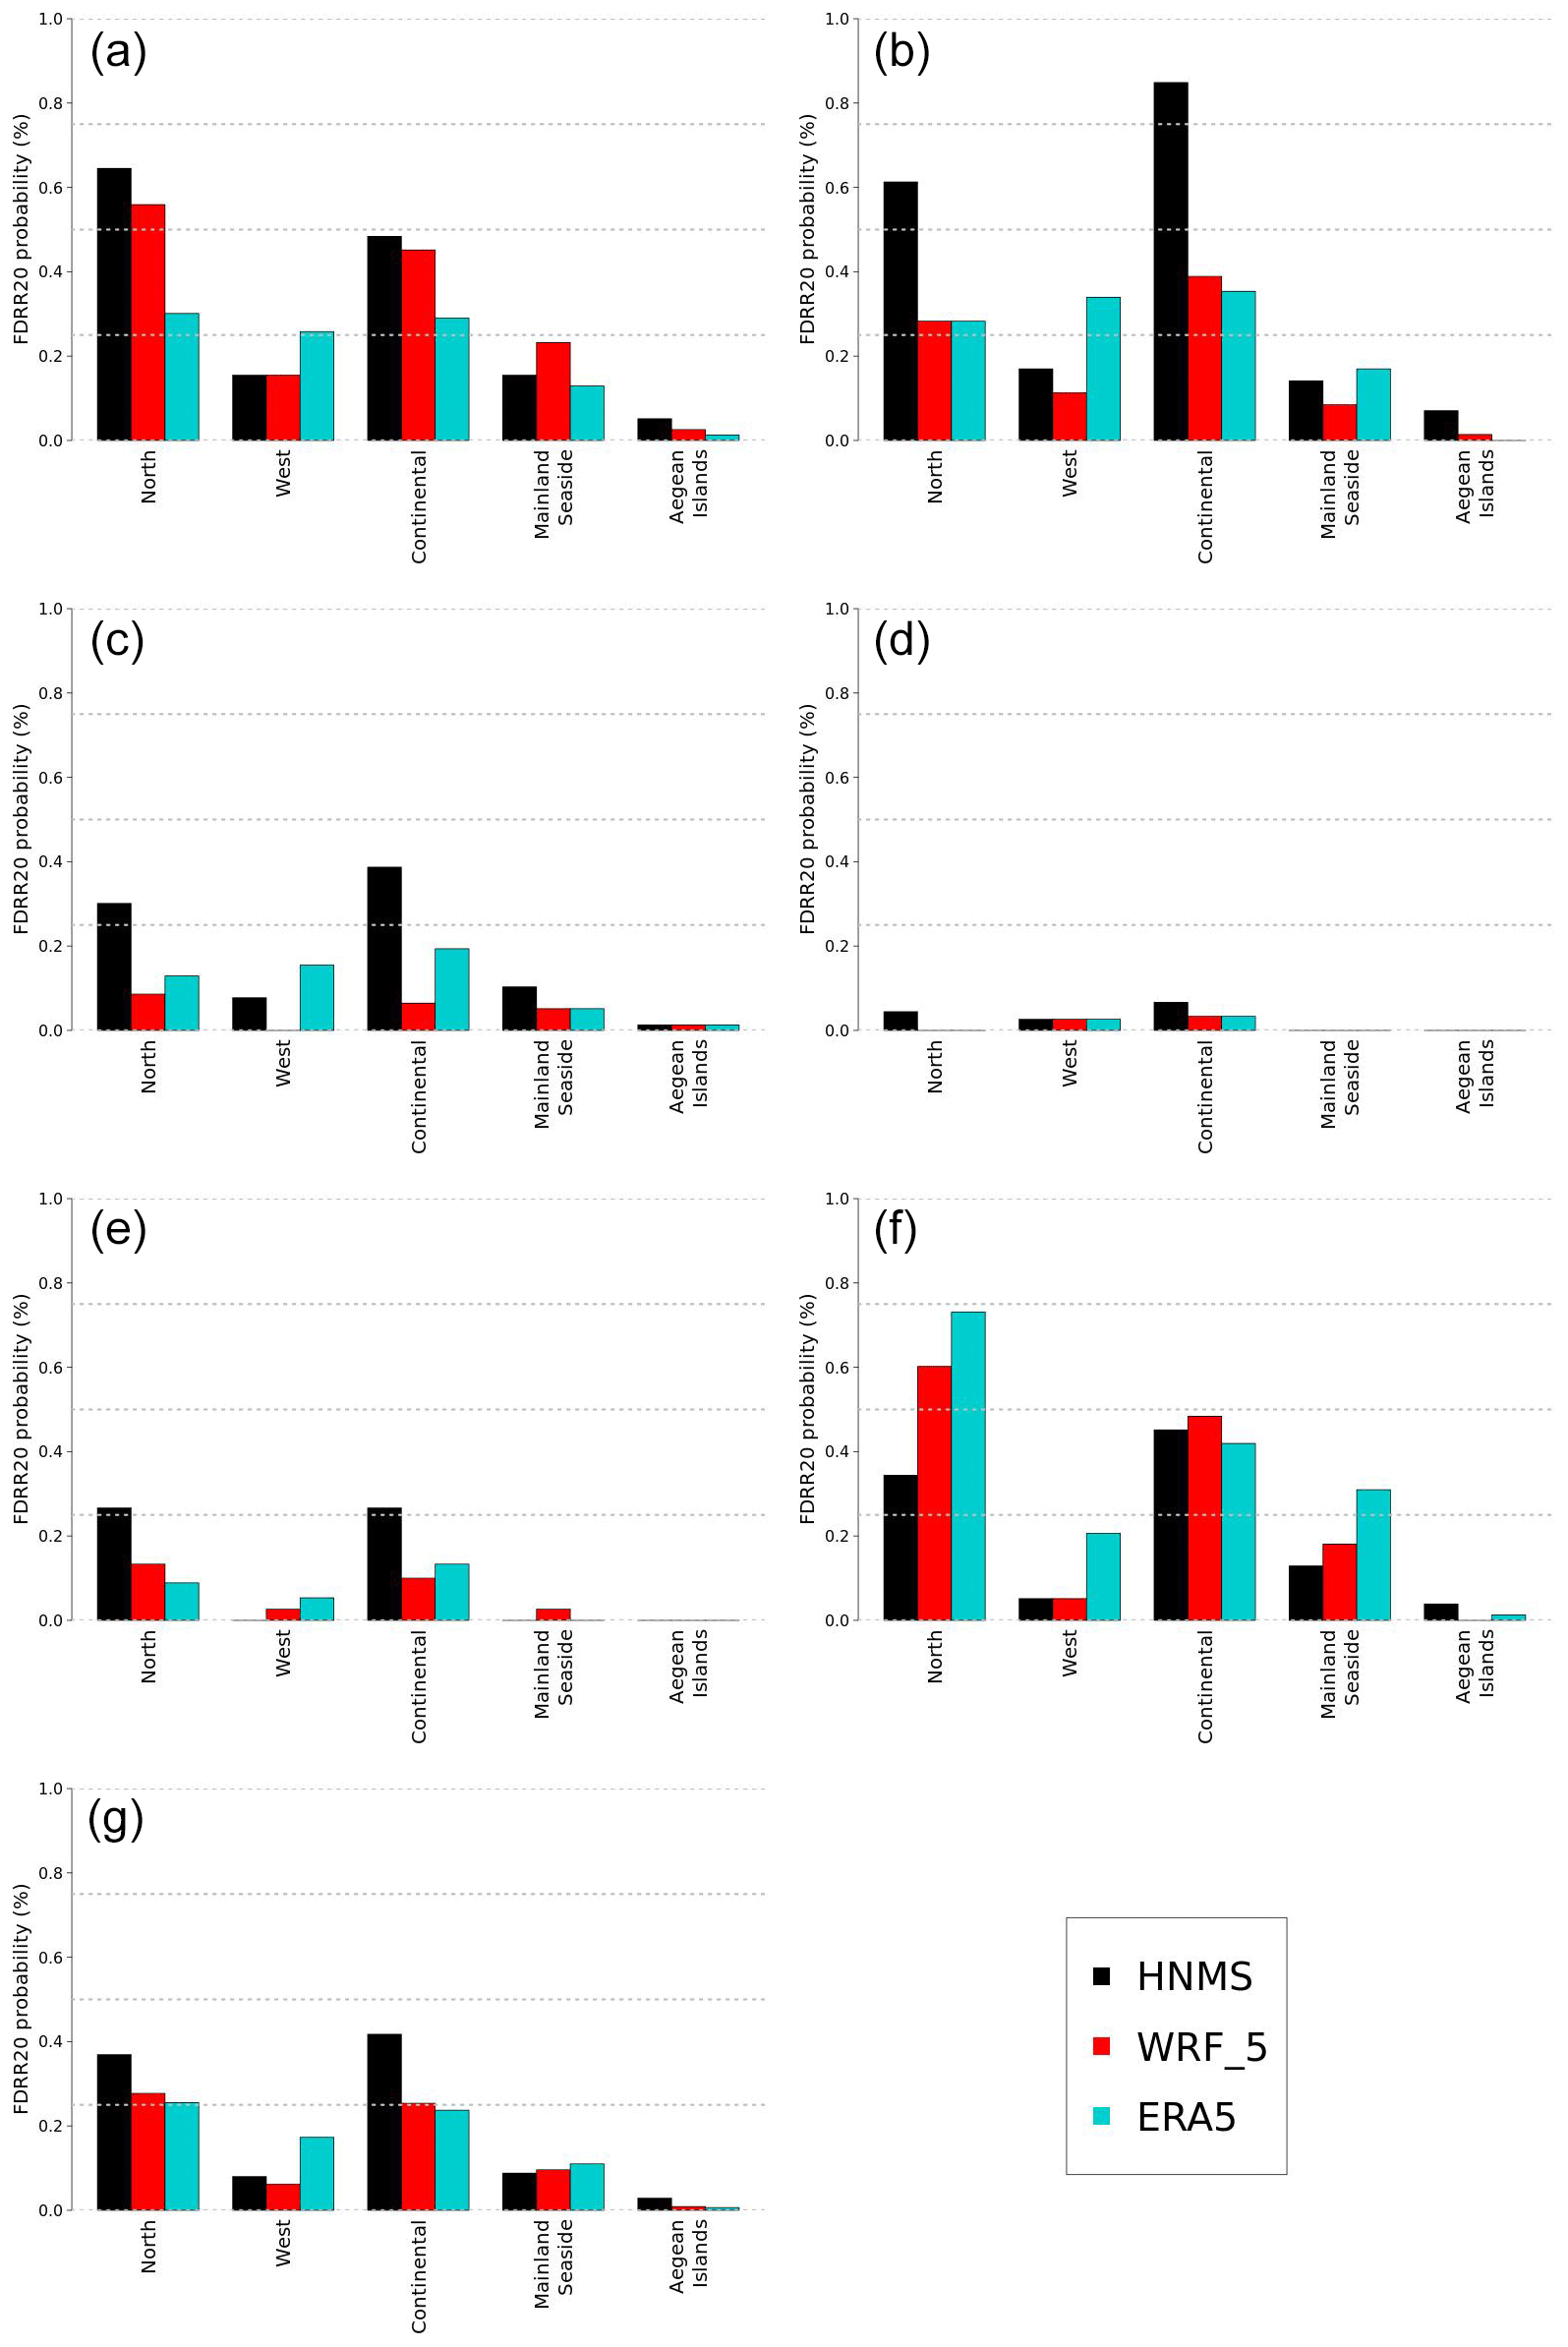
Figure 2RR20-FD aggregated probabilities for HNMS, WRF_5 and ERA5 five station categories for the months (a) January, (b) February, (c) March, (d) April, (e) November, (f) December and (g) for the entire season November–April.
Examining firstly the spatial distribution of WCCEs probabilities, we observe in Fig. 2g that North and Continental categories yield the highest WCCEs probabilities, with HNMS exhibiting higher probabilities (∼0.4 %) than ERA5 and WRF_5 (∼0.25 %) for both categories. West and Mainland Seaside categories exhibit similar probabilities (∼0.1 %), with ERA5 yielding higher probabilities (∼0.2 %) for the West categories. Aegean Islands presents close to zero probabilities for HNMS and zero for ERA5 and WRF_5. HNMS yields the highest monthly probabilities in February (Fig. 2b) for the Continental group with 0.85 %, while North yields 0.6 % in February (Fig. 2b) and January (Fig. 2a). WRF_5 and ERA5 yield the highest probabilities in December and in the North category with 0.61 % and 0.73 % respectively. Moreover, ERA5 aggregated probabilities in December are higher than both HNMS and WRF_5 (Table 2). All datasets display the lowest probabilities in April.
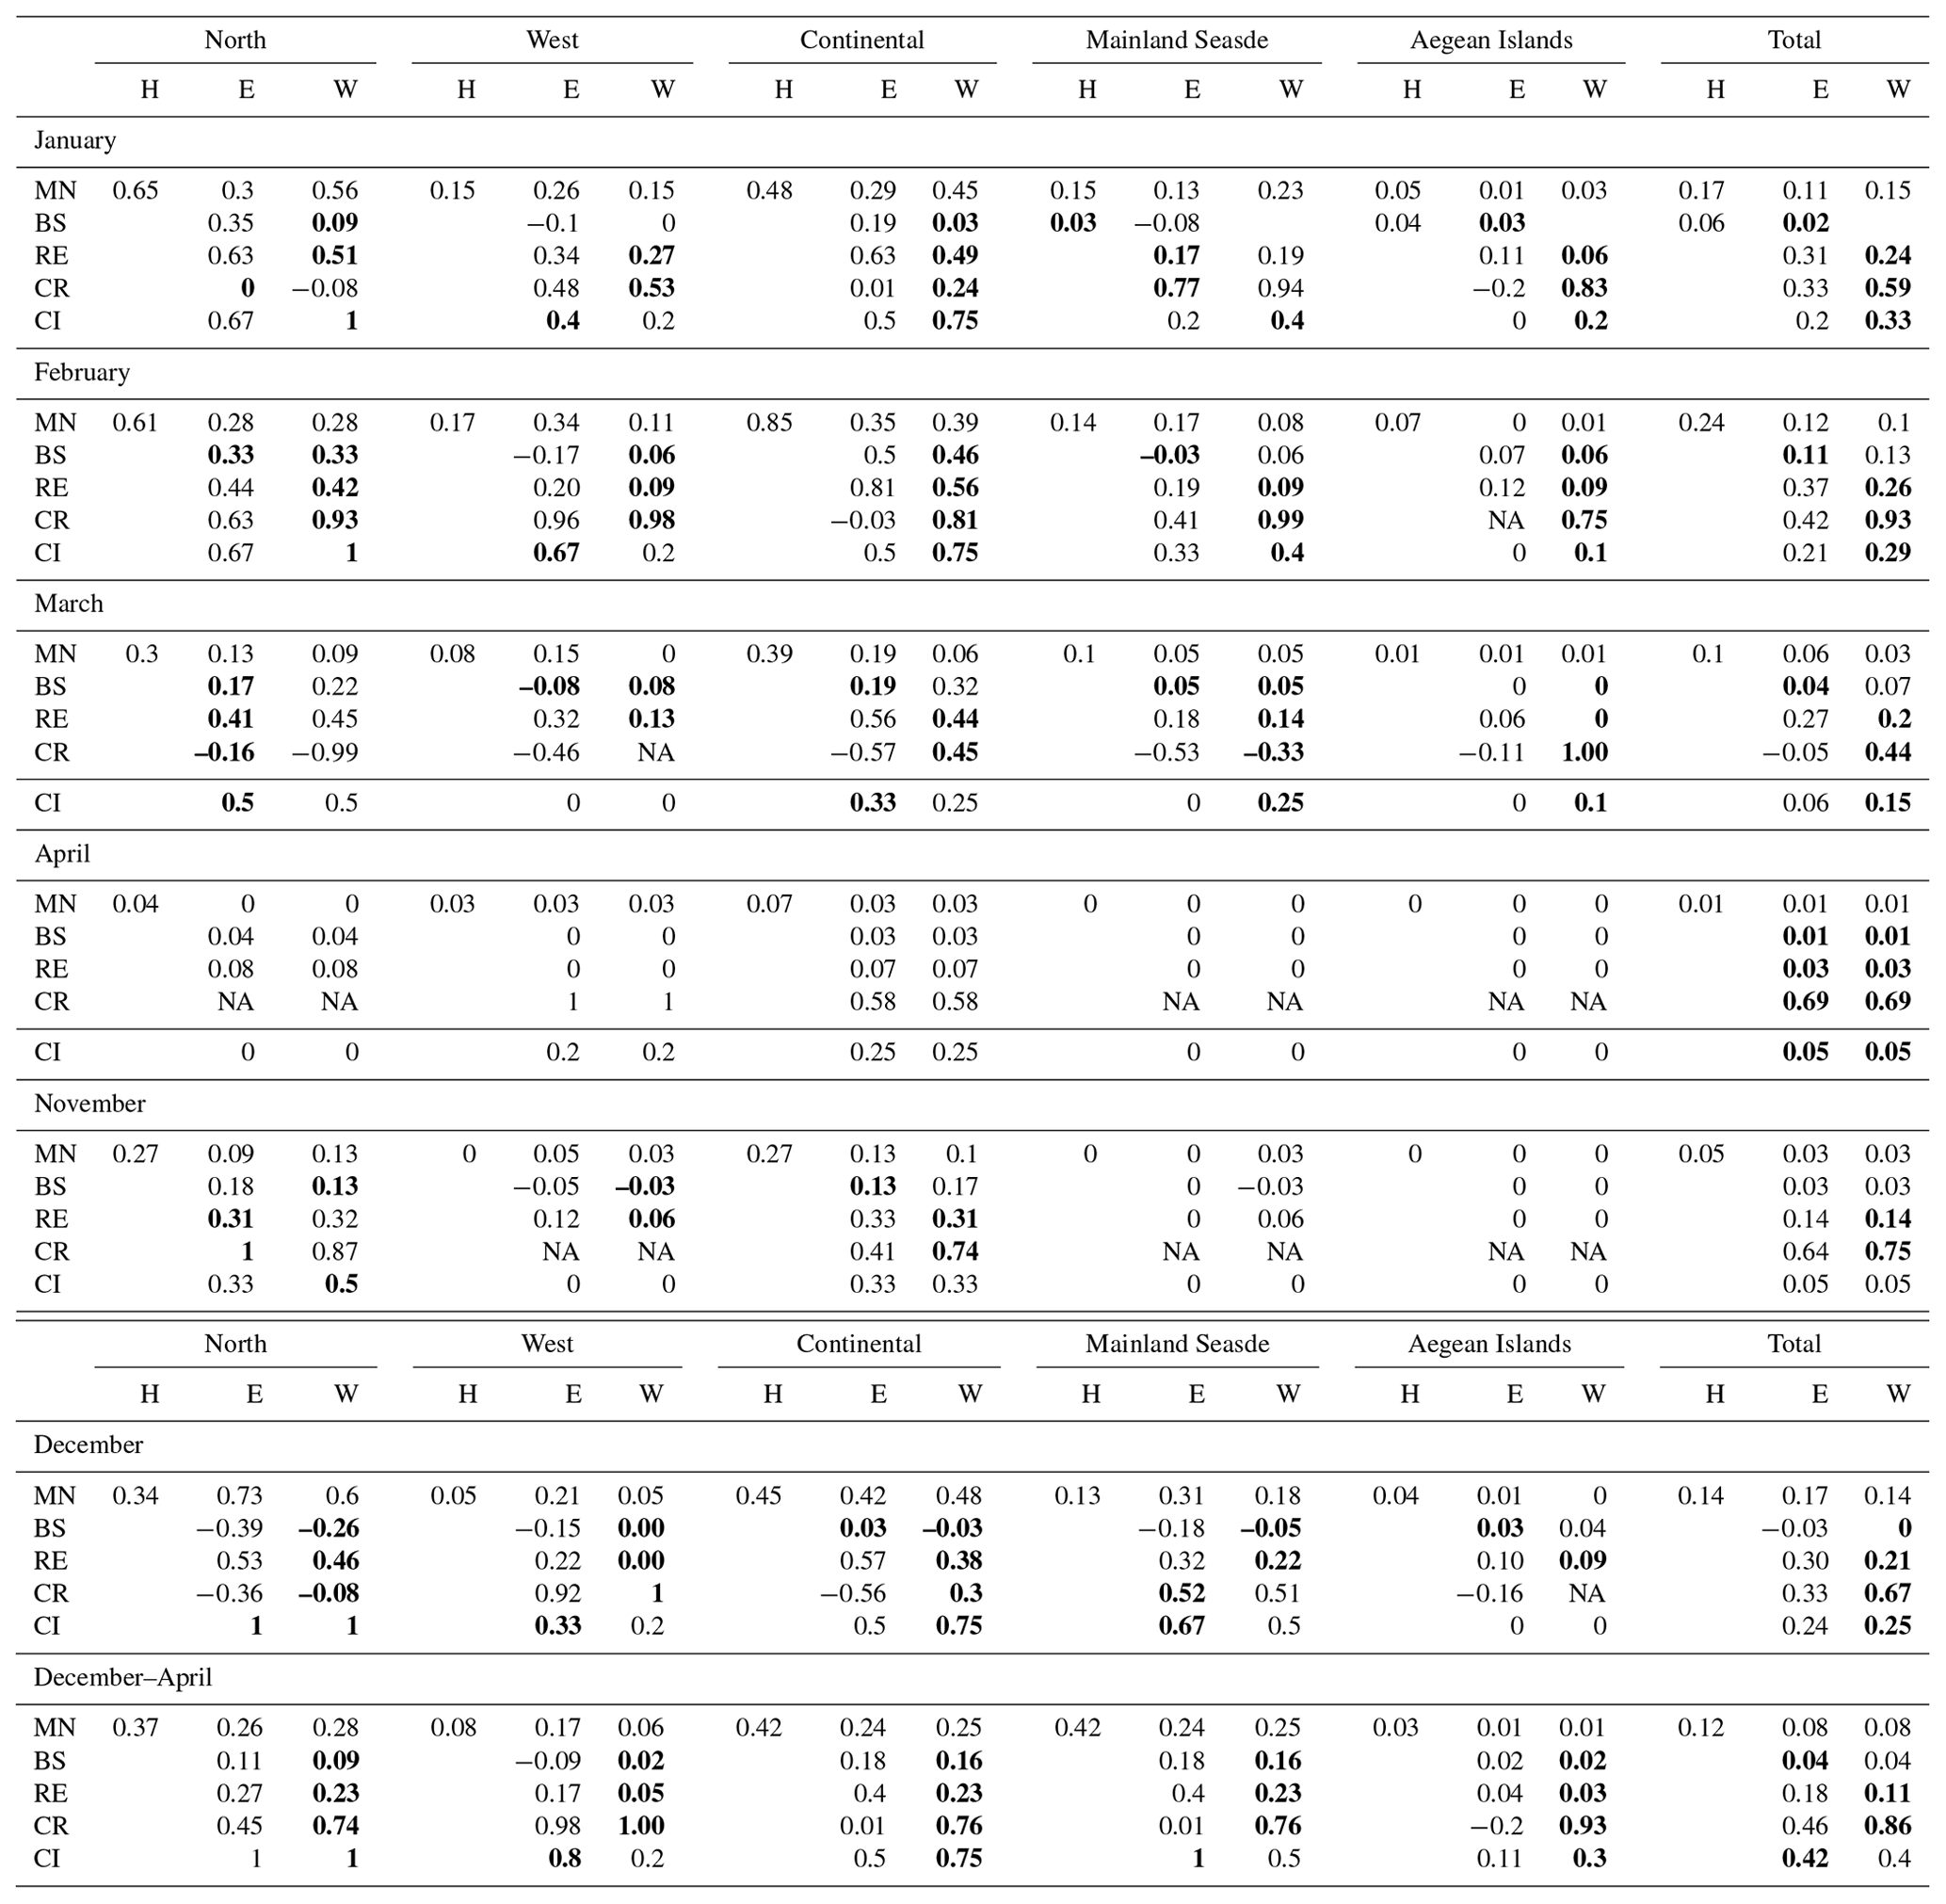
In Table 2 we observe that after the temperature correction, ERA5 and WRF_5 yield similar bias (0.04 %), rmse (0.10 % and 0.11 % respectively) and CSI (0.42 and 0.4, respectively) values for the entire season and the total of stations, WRF_5 exhibits higher correlation (0.86) compared to ERA5 (0.46). Although ERA5 displays great positive value bias in the West category and especially in February with 0.17 % and December with 0.15 %, the greatest positive bias is observed in the North category also in December with 0.39 %. Likewise, WRF_5 displays the greatest positive bias in December in the North with 0.29 %, and mostly negative bias for the rest of the months. The greatest RMSE values are observed in February (Continental) for both ERA5 and WRF_5 with 0.81 % and 0.56 %, respectively. North is the category with the highest CSI values for ERA5 and WRF_5 for all months with the exception of April.
4.2 WCCEs probabilities
Figure 3 completes the examination of the spatiotemporal distribution of WCCEs probabilities in Greece since it includes areas lacking the presence of observational data. Similar to Fig. 2, it includes a monthly analysis (November to April) and the aggregated values for the whole season. Areas with less than 0.1 % probabilities are marked with grey color.
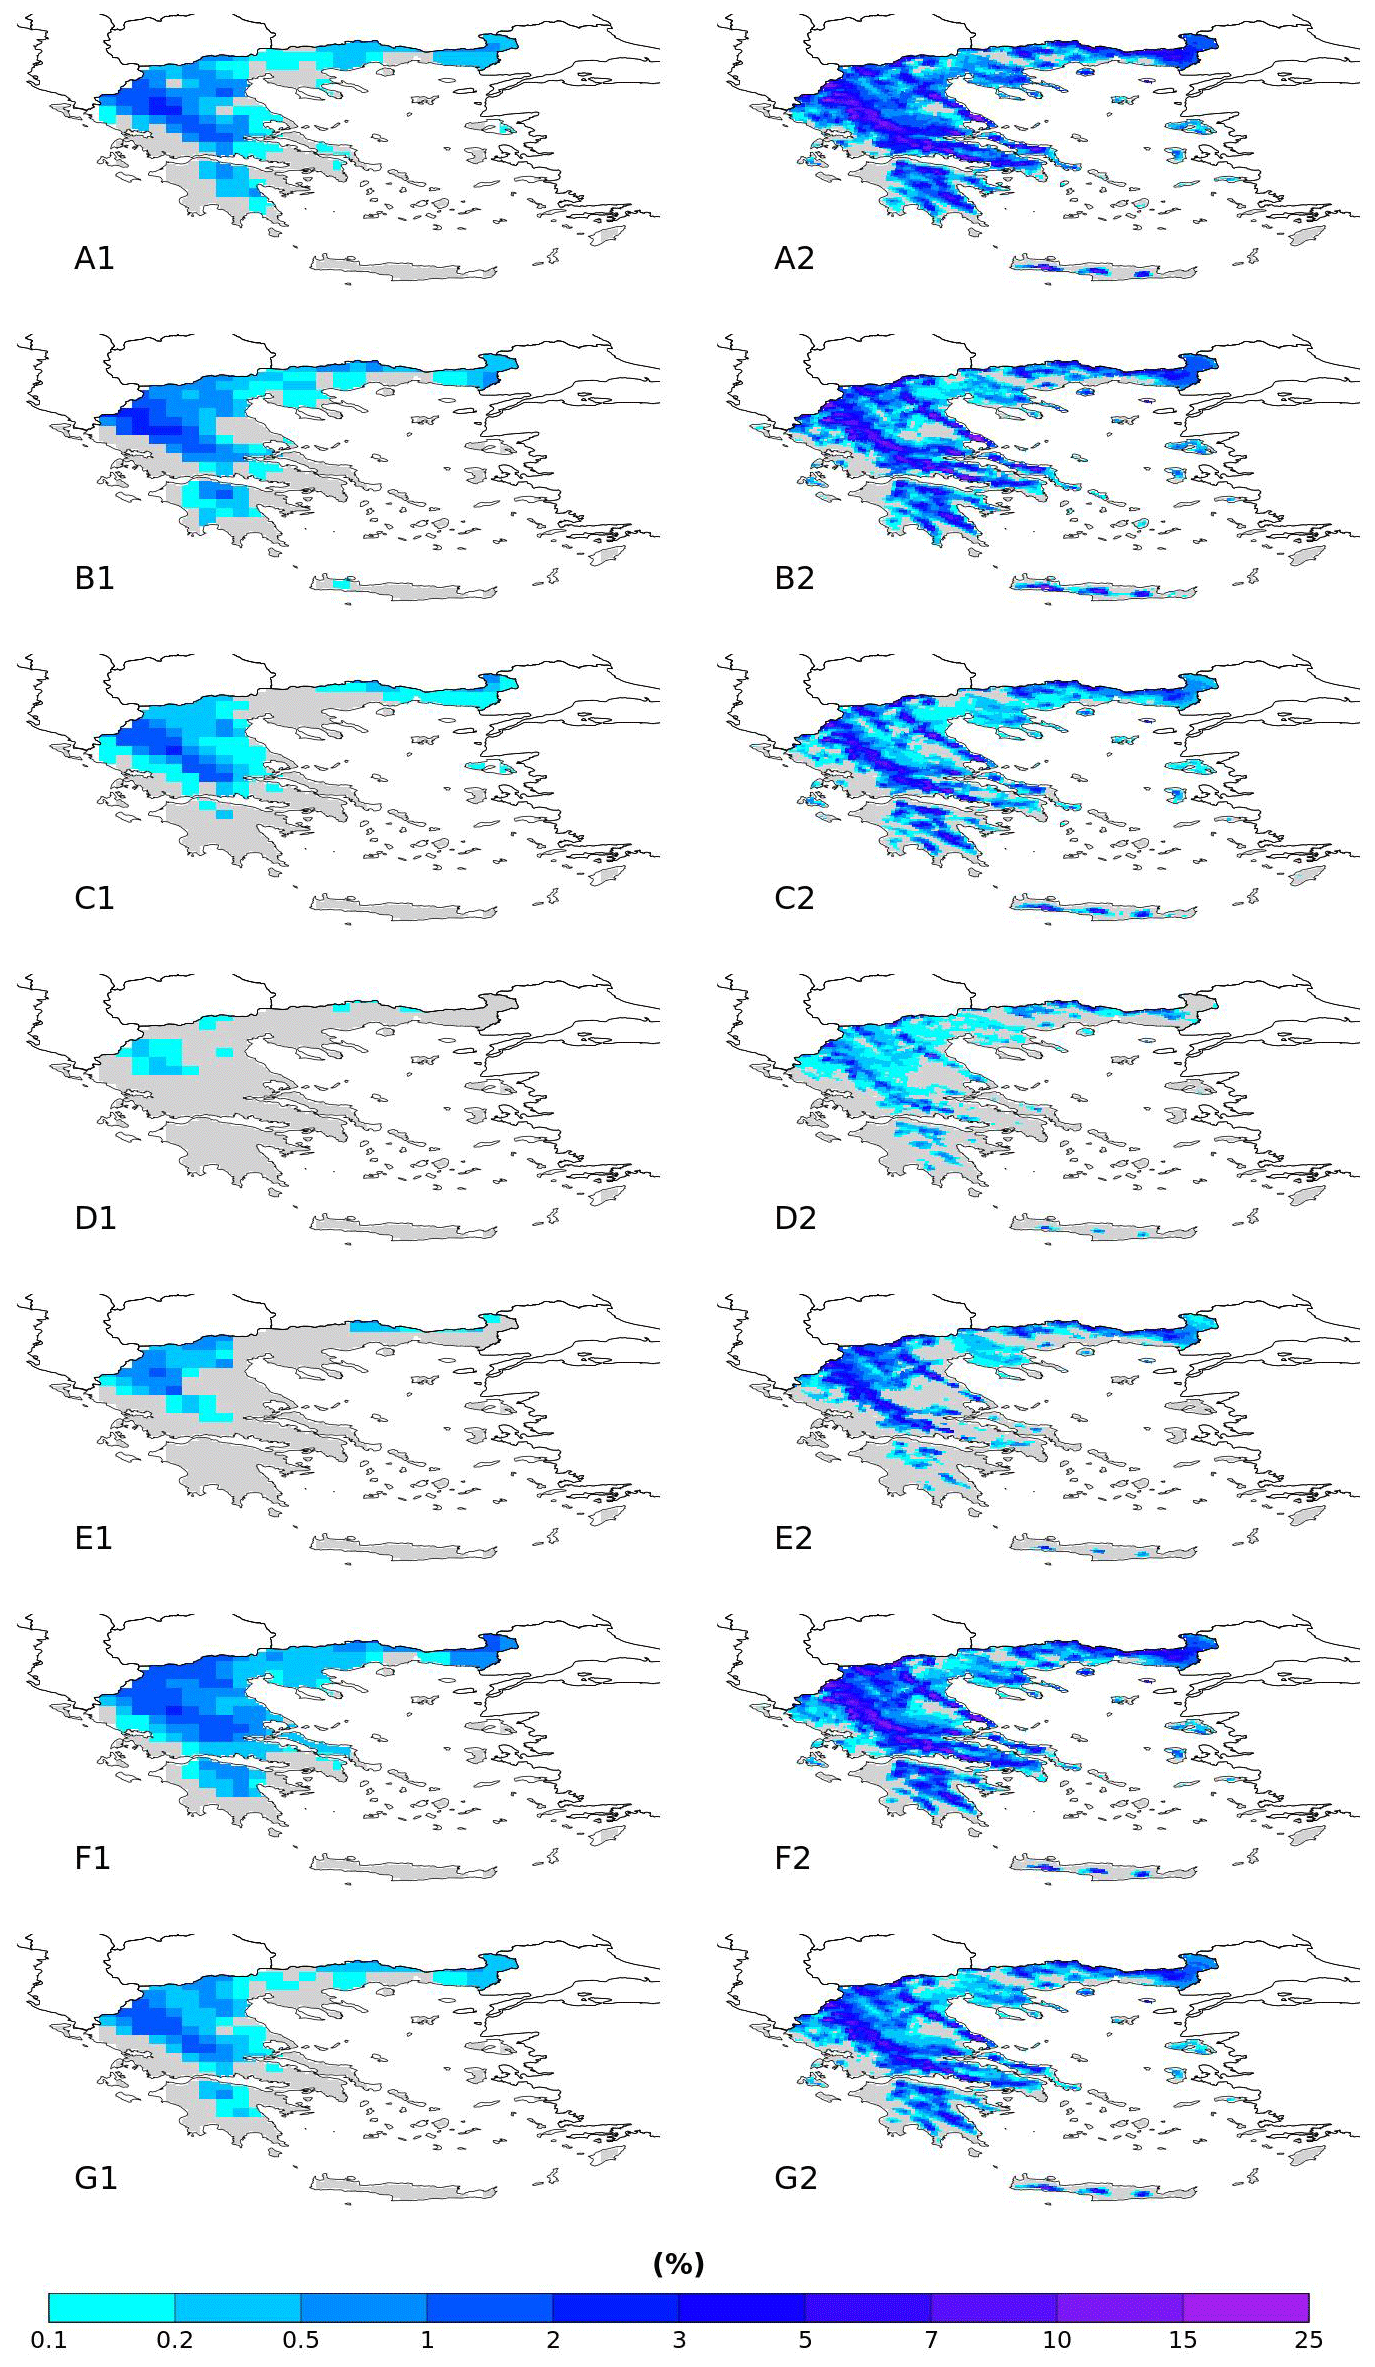
Figure 3WCCEs probabilities spatial distribution for (1) ERA5 and (2) WRF_5 for the months (a) January, (b) February, (c) March, (d) April, (e) November, (f) December and (g) for the entire season November–April.
Table 2Table that exhibits aggregated WCCEs probabilities (MN) for HNMS (H), ERA5 (E) and WRF_5 (W) for all station categories and the total of stations, and for each month and the entire season. Also, it exhibits the BIAS (BI), RMSE (RE), Pearson Correlation (CR) and CSI (CI) of ERA5 and WRF_5. The bold format points the values with better score between ERA5 and WRF_5.
According to Fig. 3 WRF_5 (column 2) yields greater spatial distribution and range of WCCEs probabilities than ERA5 (column 1). In the aggregated values for the entire season (Fig. 3g1 and g2) WRF_5 displays a maximum value of 13.92 % while ERA5 only 1.83 %. The highest probabilities are observed for both datasets in February with 25.04 % for WRF_5 and 2.97 % for ERA5. April (Fig. 3d) yields the lowest extent of WCCEs for both datasets and the lowest monthly maximum probability with 0.4 % for ERA5. On the other hand, WRF_5 yields the lowest monthly probability in November (Fig. 3d2).
The geographical extent of WCCEs varies monthly, mainly over the mountainous areas in April and over the majority of mainland Greece in January, including a significant number of Islands as manifested in the finer resolution of WRF_5. The western parts of the mainland, the southern Aegean Islands and lowland areas of Crete are the areas that show the lowest probabilities through all months. On the other hand, semi-mountainous and mountainous areas of north-western mainland are the regions yielding the highest probabilities for all months and for both datasets. The areas of the two main cities (Athens and Thessaloniki) that contain more than half of the inhabitants of Greece, display significant probability values in January.
This work attempted to estimate the monthly climatology of WCCEs in Greece for the historical period 1980–2004 by adopting a fixed threshold approach. Two reanalysis products, compared also with observations, provided the spatial distribution of WCCEs in Greece. From this study emerges that in Greece, a mostly mountainous country, RR20-FD events are common phenomena during the colder period of the year in areas with higher elevation, greater distance from the coastline and mostly in northern latitudes, as observed by the grouping of HNMS stations. The comparison between the simulated datasets showcased the added value and need for finer spatial resolution datasets for areas with complex topography like Greece, as great differences emerged between ERA5 and WRF_ERA_I particularly in areas that lack the presence of observations. The results also displayed that that February, January and December, are in this order, the months with the highest WCCEs, while April and November, the months with the fewest number of observed events in HNMS stations yield significant WCCEs probabilities and spatial distribution in northern and mountainous Greece.
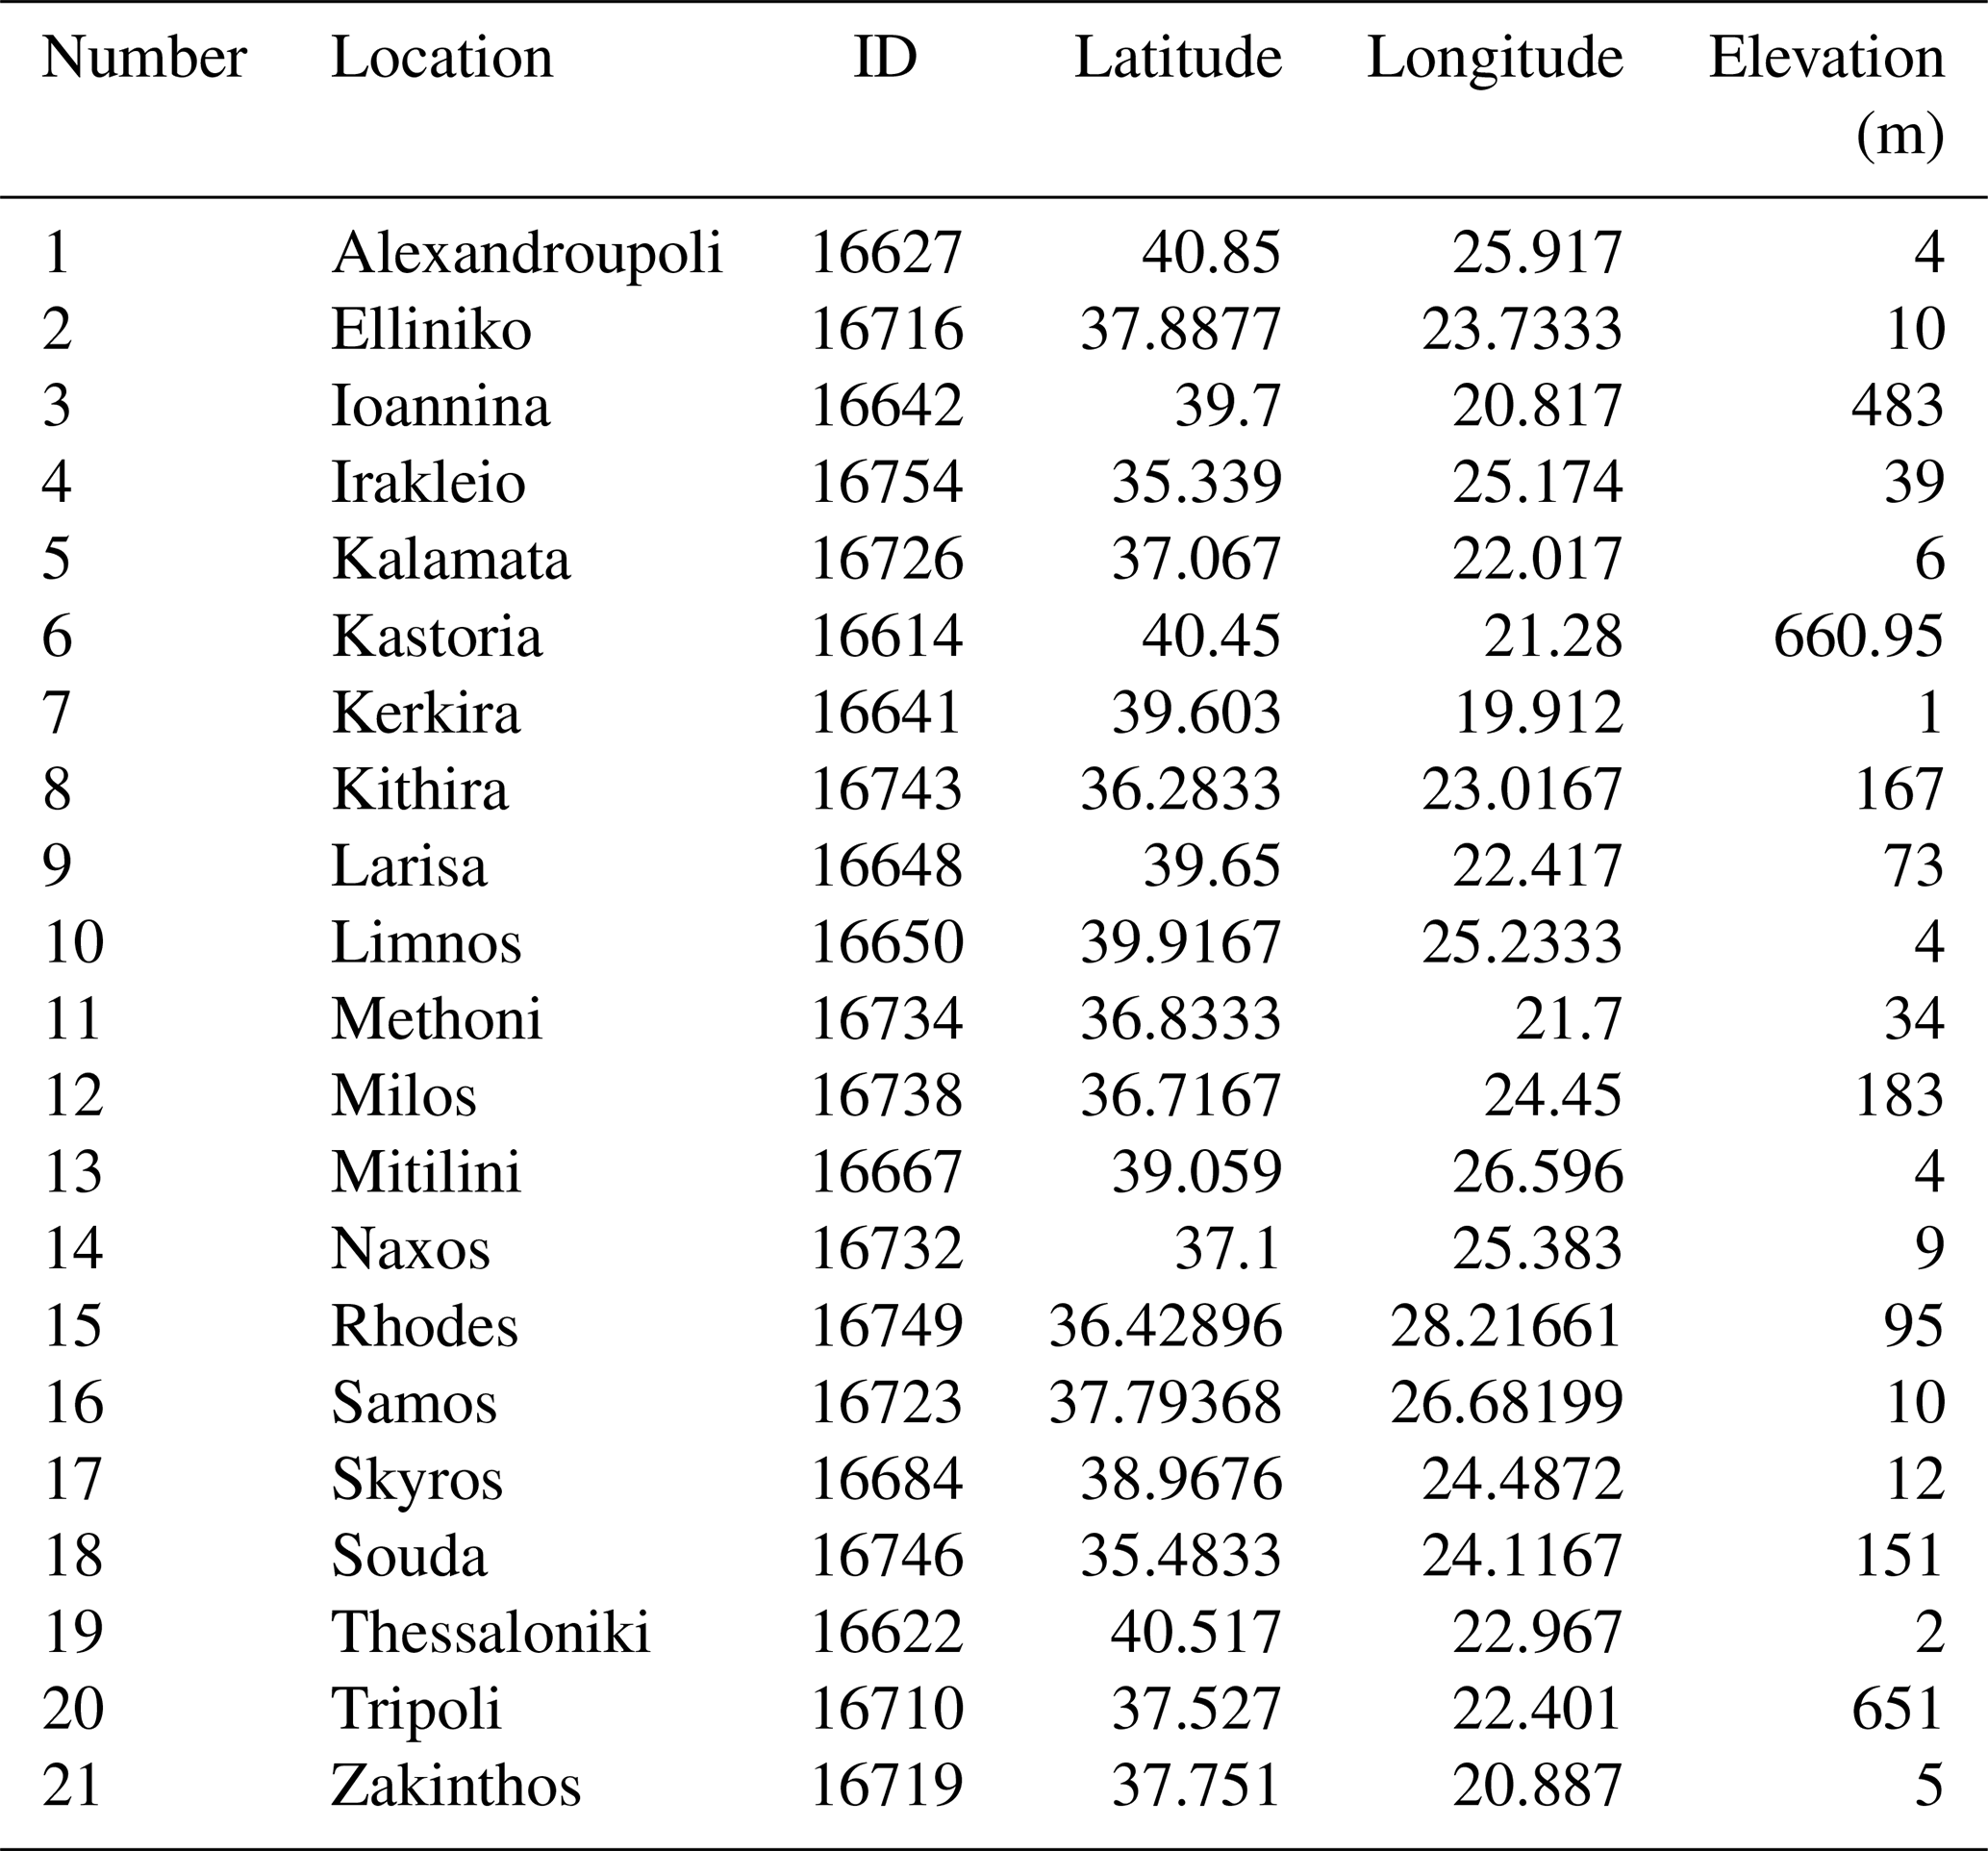
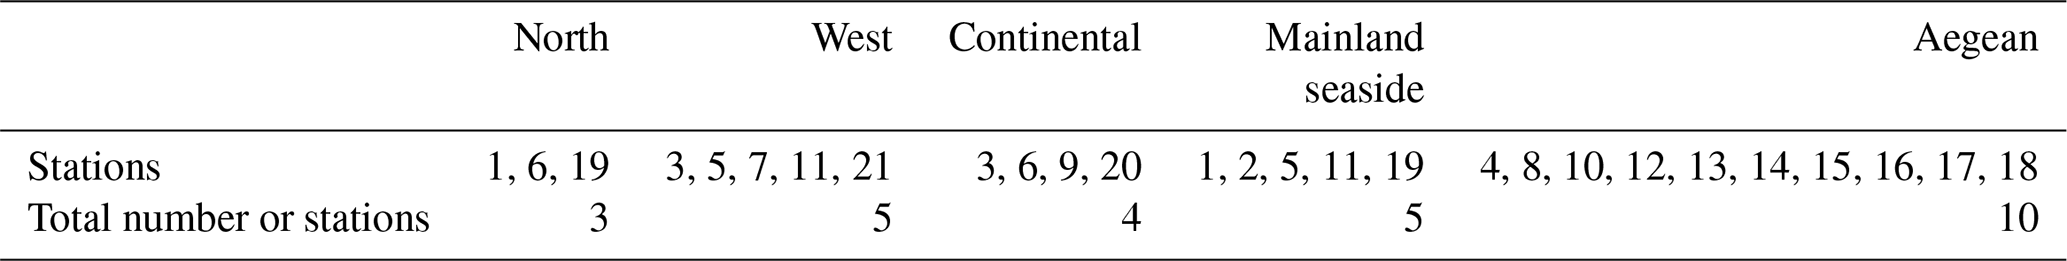
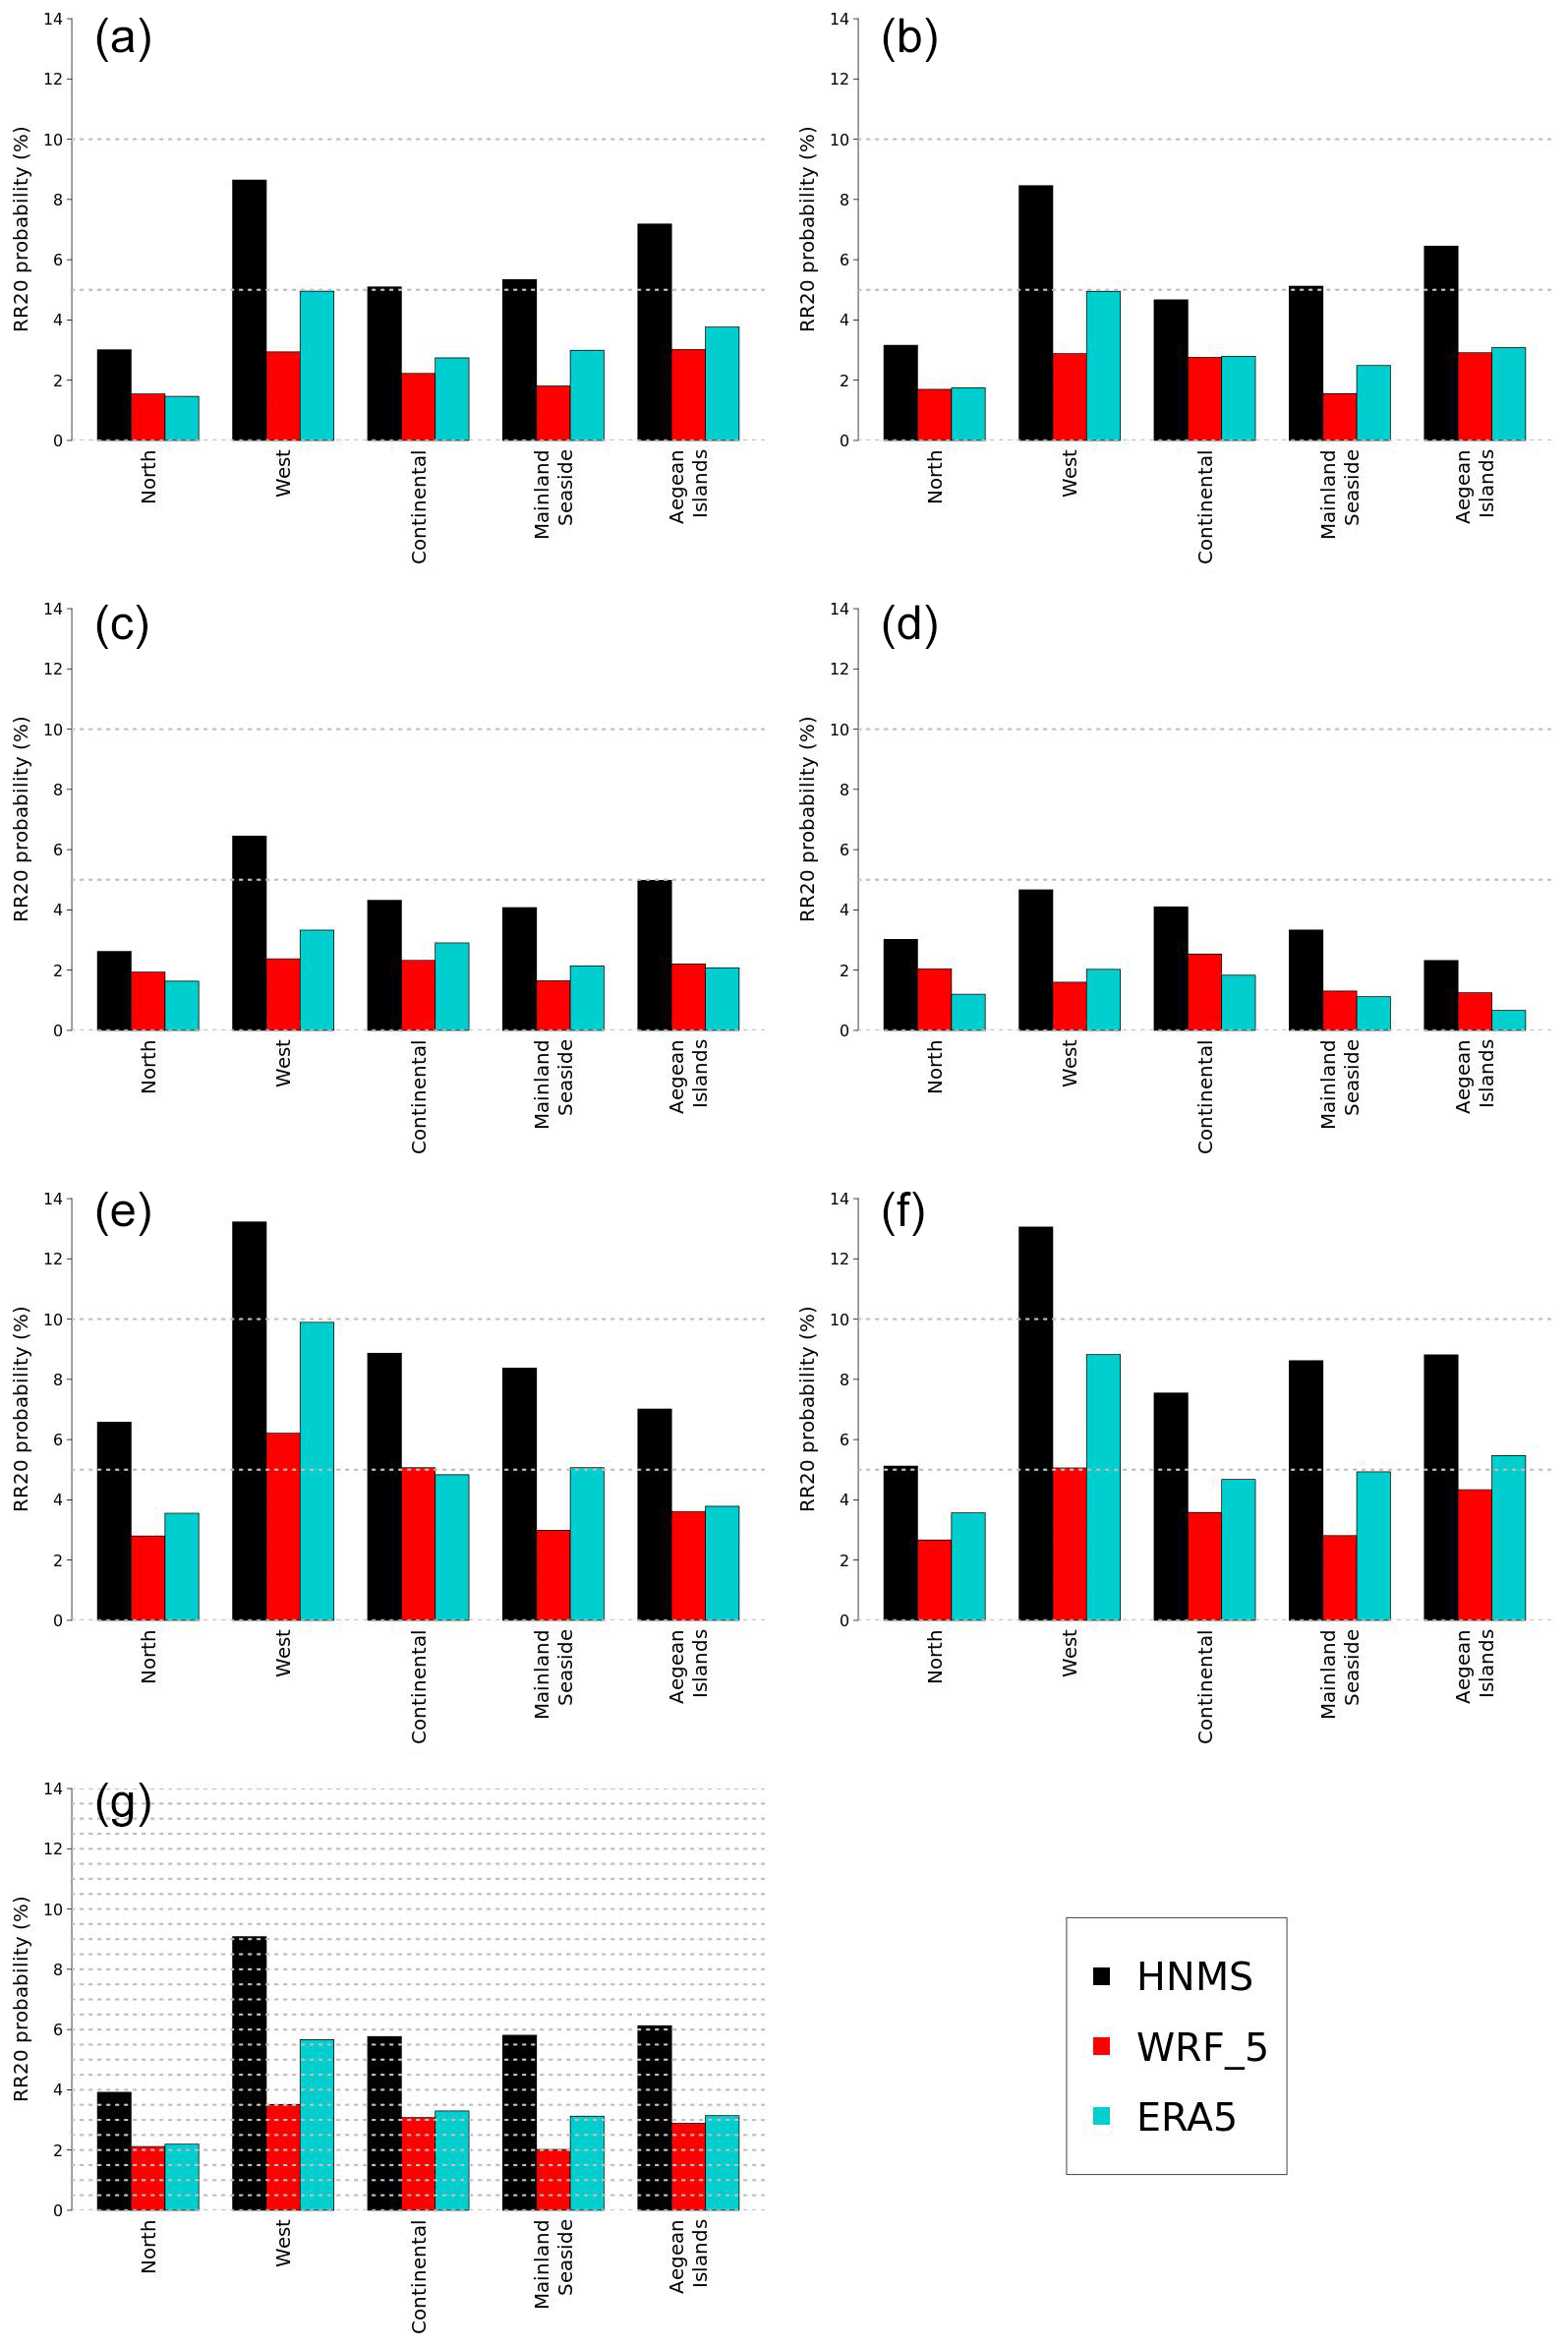
Figure B1RR20 aggregated probabilities for HNMS, WRF_5 and ERA5 five station categories for the months (a) January, (b) February, (c) March, (d) April, (e) November, (f) December and (g) for the entire season November–April.
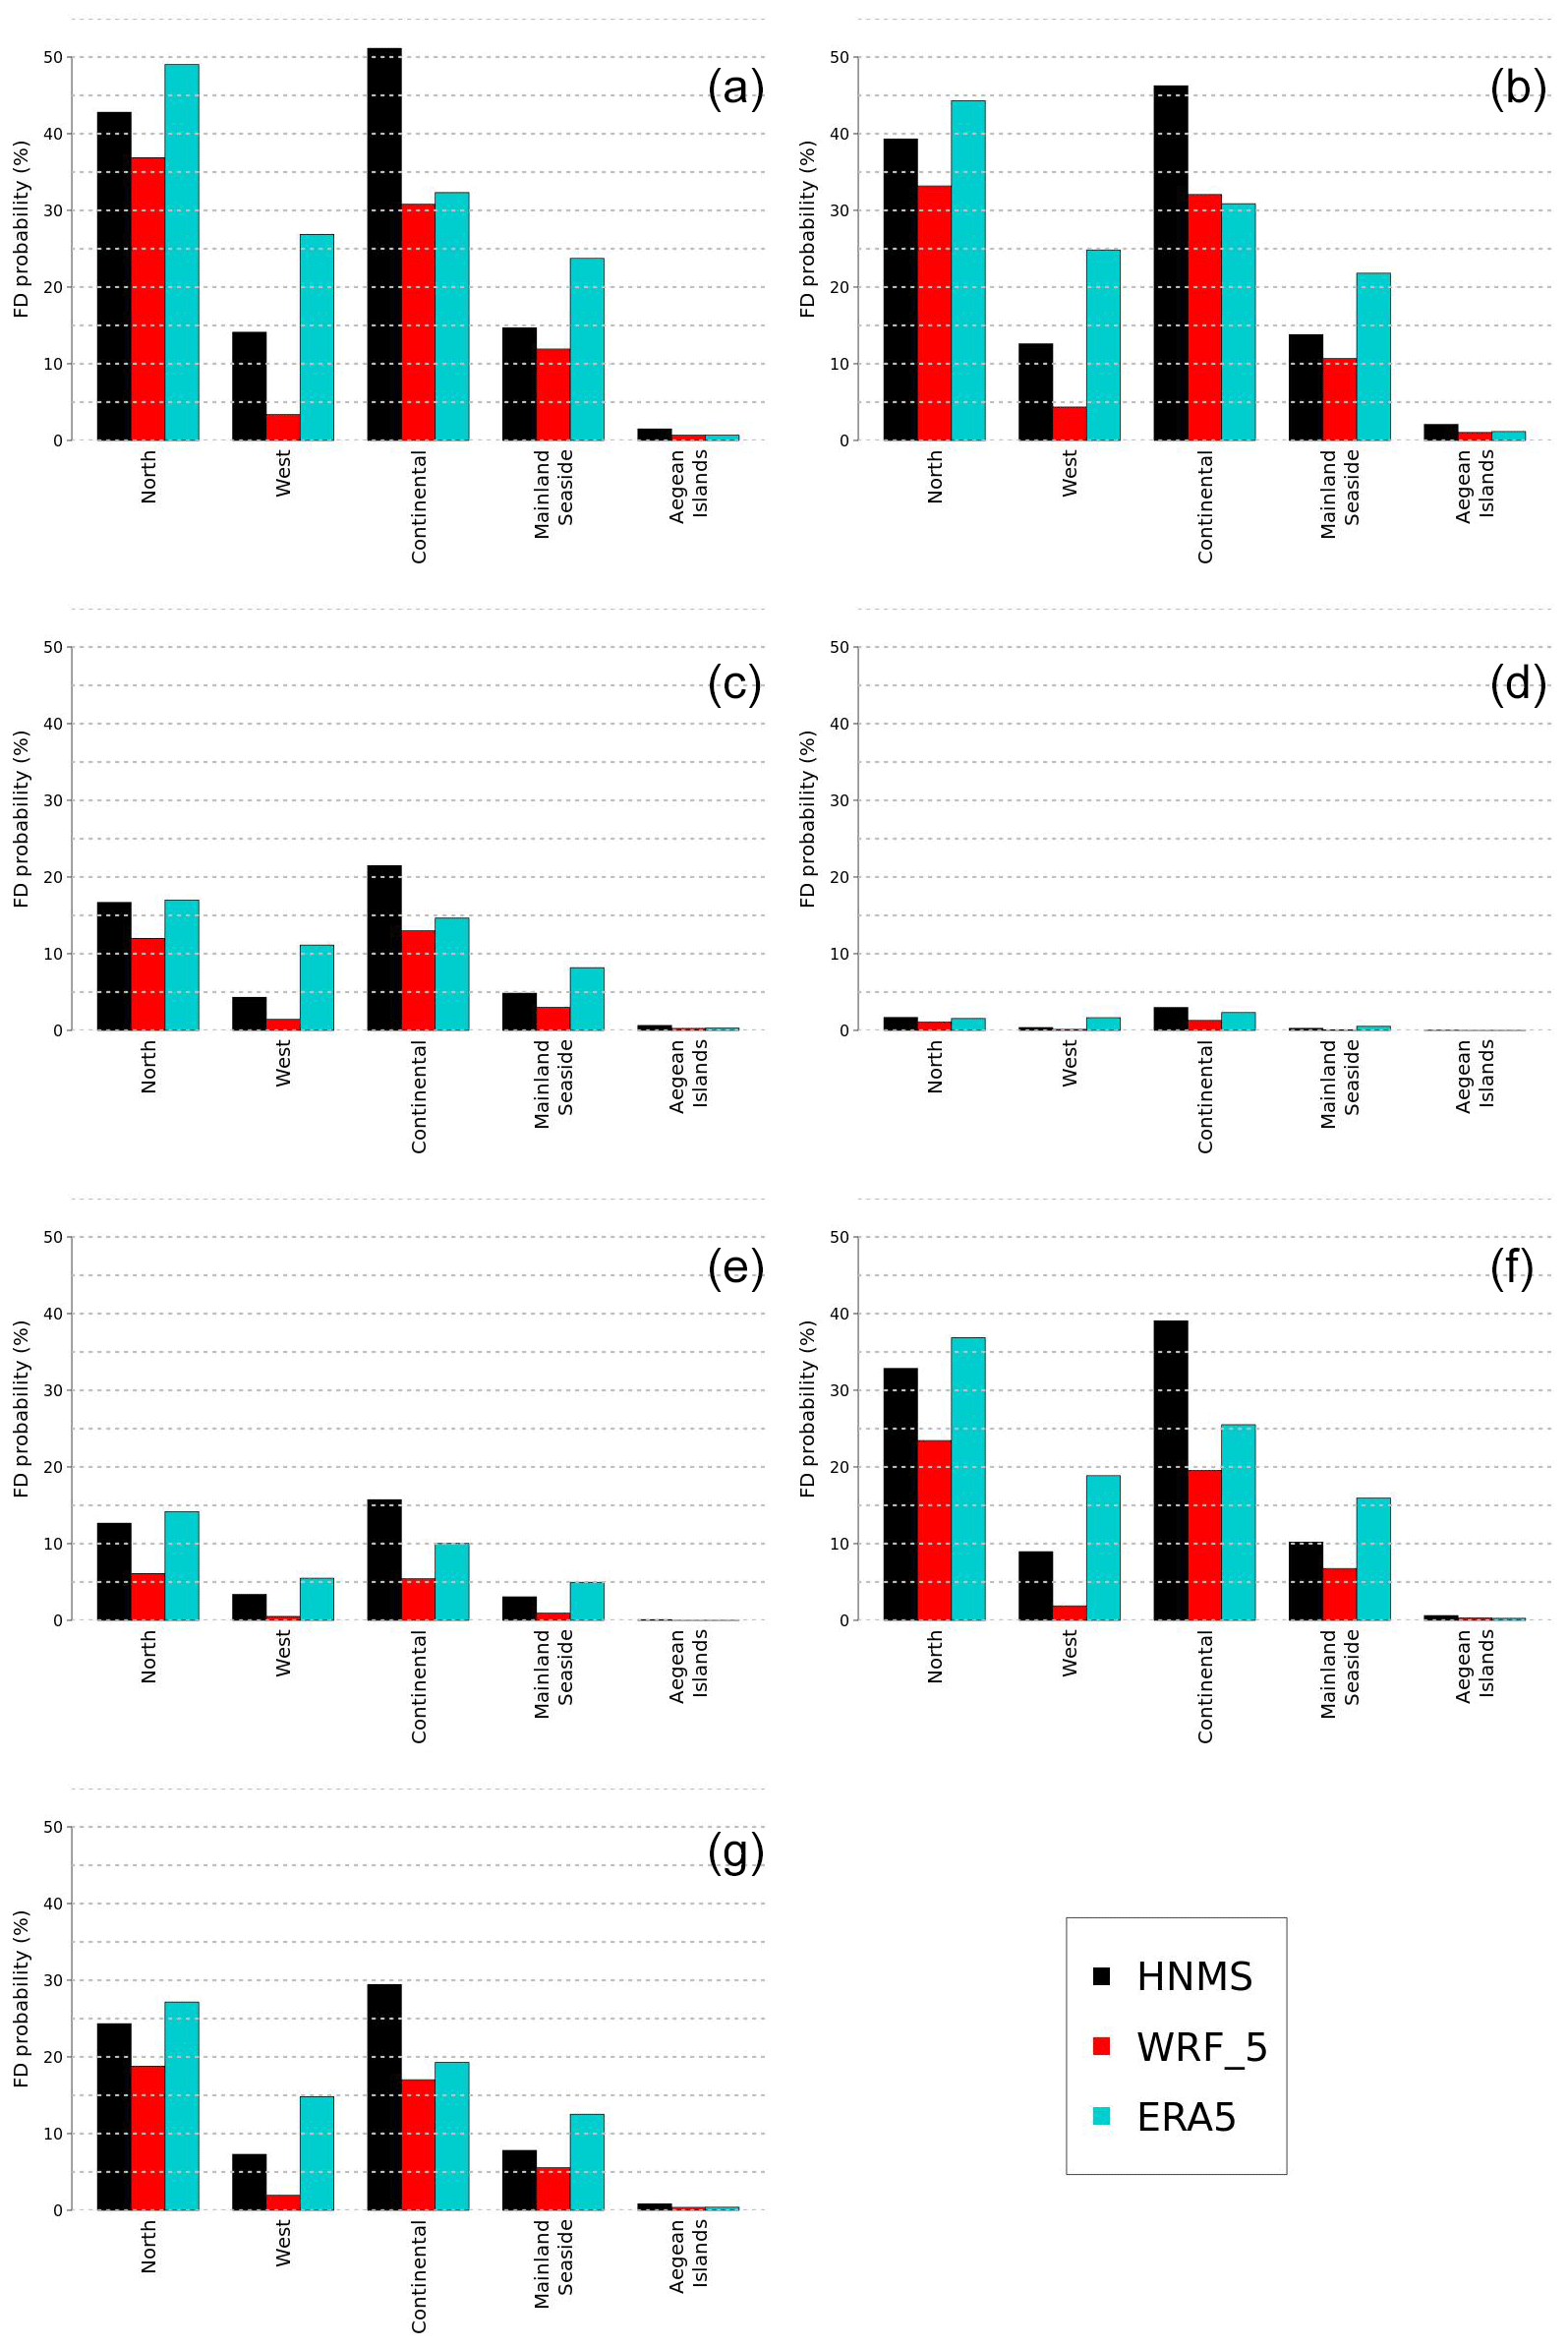
Figure B2FD aggregated probabilities for HNMS, WRF_5 and ERA5 five station categories for the months (a) January, (b) February, (c) March, (d) April, (e) November, (f) December and (g) for the entire season November–April.
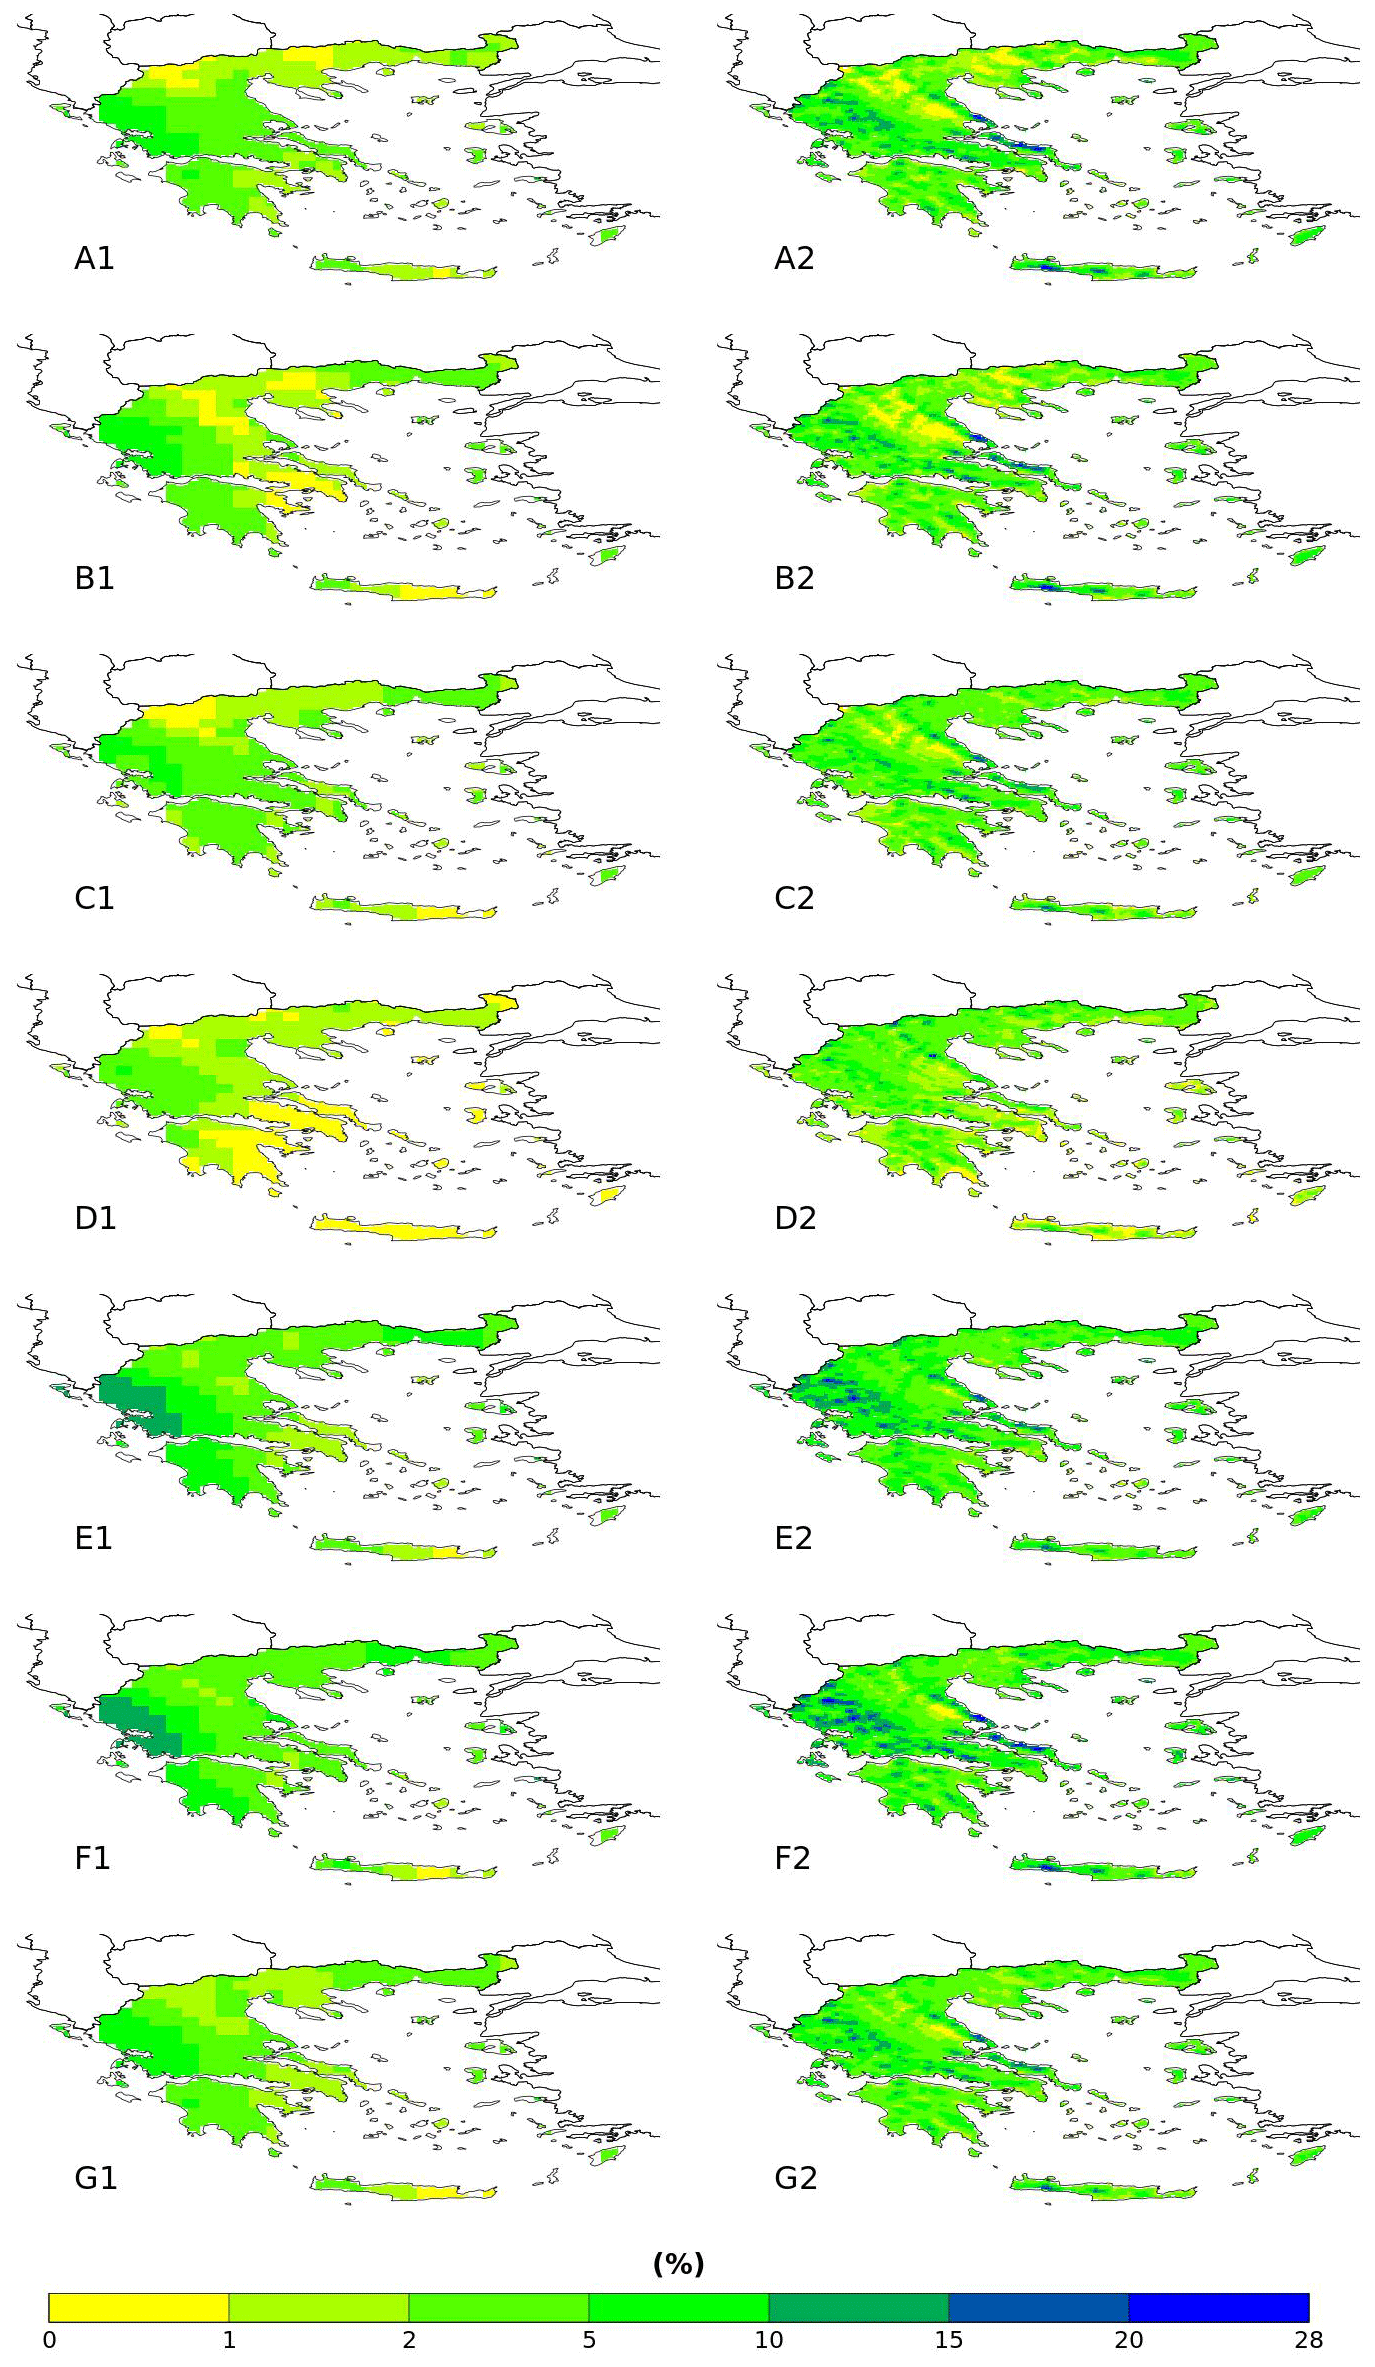
Figure C1RR20 probabilities spatial distribution for (1) ERA5 and (2) WRF_5 for the months (a) January, (b) February, (c) March, (d) April, (e) November, (f) December and (g) for the entire season November–April.
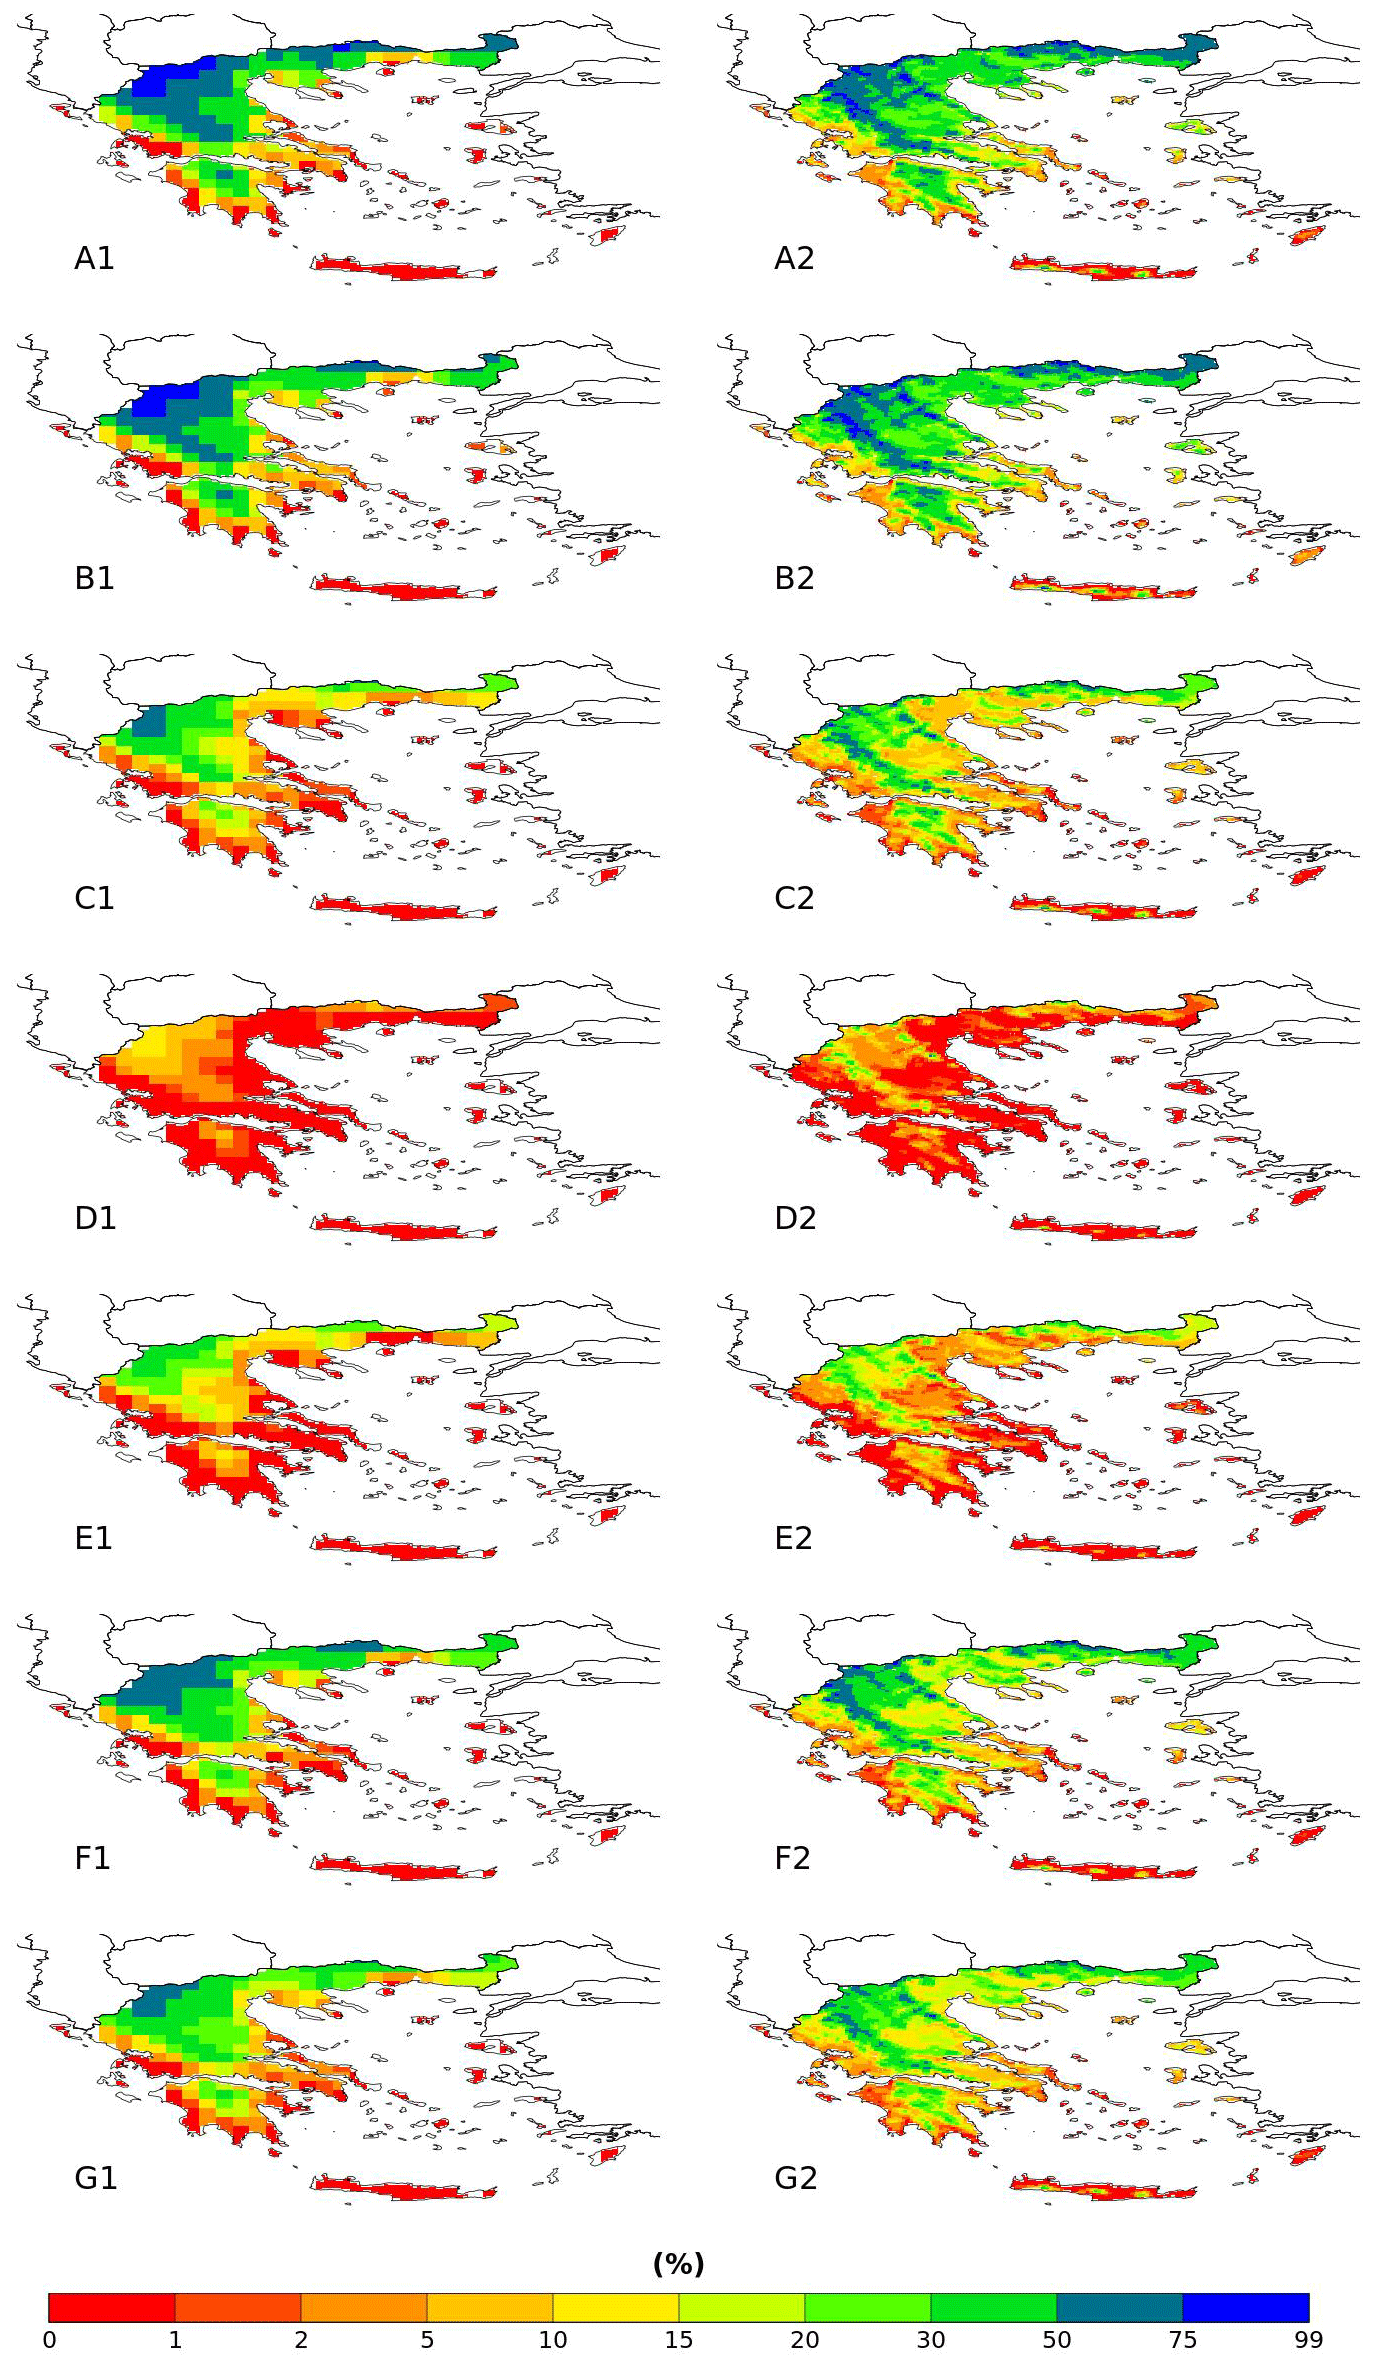
Figure C2FD probabilities spatial distribution for (1) ERA5 and (2) WRF_5 for the months (a) January, (b) February, (c) March, (d) April, (e) November, (f) December and (g) for the entire season November–April.
Code and results data available upon request.
IM has worked on conceptualization, methodology, validation, visualization, investigation, writing review and editing. ND worked on software development. AS, DV and IK contributed on review and supervision. All authors have read and agreed to the published version of the manuscript.
The contact author has declared that none of the authors has any competing interests.
Publisher's note: Copernicus Publications remains neutral with regard to jurisdictional claims in published maps and institutional affiliations.
This article is part of the special issue “21st EMS Annual Meeting – virtual: European Conference for Applied Meteorology and Climatology 2021”.
This paper was edited by Frank Kaspar and reviewed by two anonymous referees.
Dee, D. P., Uppala, S. M., Simmons, A. J., Berrisford, P., Poli, P., Kobayashi, S., Andrae, U., Balmaseda, M. A., Balsamo, G., Bauer, P., Bechtold, P., Beljaars, A. C. M., van de Berg, L., Bidlot, J., Bormann, N., Delsol, C., Dragani, R., Fuentes, M., Geer, A. J., Haimberger, L., Healy, S. B., Hersbach, H., Hólm, E. V., Isaksen, L., Kållberg, P., Köhler, M., Matricardi, M., McNally, A. P., Monge-Sanz, B. M., Morcrette, J.-J., Park, B.-K., Peubey, C., de Rosnay, P., Tavolato, C., Thépaut, J.-N., and Vitart, F.: The ERA-Interim reanalysis: configuration and performance of the data assimilation system, Q. J. Roy. Meteorol. Soc., 137, 553–597, https://doi.org/10.1002/qj.828, 2011.
De Luca, P., Messori, G., Faranda, D., Ward, P. J., and Coumou, D.: Compound warm–dry and cold–wet events over the Mediterranean, Earth Syst. Dynam., 11, 793–805, https://doi.org/10.5194/esd-11-793-2020, 2020.
Demiroglu, O. C., Kučerová, J., and Ozcelebi, O.: Snow reliability and climate elasticity: case of a Slovak ski resort, Tourism Rev., 70, 1–12, https://doi.org/10.1108/TR-01-2014-0003, 2015.
Emmanouil, G., Vlachogiannis, D., and Sfetsos, A.: Exploring the ability of the WRF-ARW atmospheric model to simulate different meteorological conditions in Greece, Atmos. Res., 247, 105226, https://doi.org/10.1016/j.atmosres.2020.105226, 2021.
Fonseca, D., Carvalho, M. J., Marta-Almeida, M., Melo-Gonçalves, P., and Rocha, A.: Recent trends of extreme temperature indices for the Iberian Peninsula, Phys. Chem. Earth Pt. A/B/C, 94, 66–76, https://doi.org/10.1016/j.pce.2015.12.005, 2016.
García-Ruiz, J. M., López-Moreno, J. I., Vicente-Serrano, S. M., Lasanta-Martínez, T., and Beguería, S.: Mediterranean water resources in a global change scenario, Earth-Sci. Rev., 105, 121–139, https://doi.org/10.1016/j.earscirev.2011.01.006, 2011.
Hersbach, H., Bell, B., Berrisford, P., Hirahara, S., Horányi, A., Muñoz-Sabater, J., Nicolas, J., Peubey, C., Radu, R., Schepers, D., Simmons, A., Soci, C., Abdalla, S., Abellan, X., Balsamo, G., Bechtold, P., Biavati, G., Bidlot, J., Bonavita, M., de Chiara, G., Dahlgren, P., Dee, D., Diamantakis, M., Dragani, R., Flemming, J., Forbes, R., Fuentes, M., Geer, A., Haimberger, L., Healy, S., Hogan, R. J., Hólm, E., Janisková, M., Keeley, S., Laloyaux, P., Lopez, P., Lupu, C., Radnoti, G., de Rosnay, P., Rozum, I., Vamborg, F., Villaume, S., and Thépaut, J. N.: The ERA5 global reanalysis, Q. J. Roy. Meteorol. Soc., 146, 1999–2049, https://doi.org/10.1002/QJ.3803, 2020.
Hochman, A., Marra, F., Messori, G., Pinto, J. G., Raveh-Rubin, S., Yosef, Y., and Zittis, G.: Extreme weather and societal impacts in the eastern Mediterranean, Earth Syst. Dynam., 13, 749–777, https://doi.org/10.5194/esd-13-749-2022, 2022.
Houston, T. G., Changnon, S. A., Ae, T. G. H., and Changnon, S. A.: Freezing rain events: a major weather hazard in the conterminous US, Nat. Hazards, 40, 485–494, https://doi.org/10.1007/S11069-006-9006-0, 2006.
Kundzewicz, Z. W., Radziejewski, M., and Pinskwar, I.: Precipitation extremes in the changing climate of Europe, Clim. Res., 31, 51–58, https://doi.org/10.3354/cr031051, 2006.
Lazoglou, G. and Anagnostopoulou, C. Joint distribution of temperature and precipitation in the Mediterranean, using the Copula method, Theor. Appl. Climatol., 135, 1399–1411, https://doi.org/10.1007/s00704-018-2447-z, 2019.
Llasat, M. C., Turco, M., Quintana-Seguí, P., and Llasat-Botija, M.: The snow storm of 8 March 2010 in Catalonia (Spain): a paradigmatic wet-snow event with a high societal impact, Nat. Hazards Earth Syst. Sci., 14, 427–441, https://doi.org/10.5194/nhess-14-427-2014, 2014.
Markantonis, I., Vlachogiannis, D., Sfetsos, T., Kioutsioukis, I., and Politi, N.: An Investigation of cold-wet Compound Events in Greece, in: EMS Annual Meeting 2021, 6–10 September 2021, online, EMS2021-188, https://doi.org/10.5194/ems2021-188, 2021.
Markantonis, I., Vlachogiannis, D., Sfetsos, A., and Kioutsioukis, I.: Investigation of the extreme wet–cold compound events changes between 2025–2049 and 1980–2004 using regional simulations in Greece, Earth Syst. Dynam., 13, 1491–1504, https://doi.org/10.5194/esd-13-1491-2022, 2022.
Pestereva, N. M., Popova, N. Y., and Shagarov, L. M.: Modern climate change and mountain skiing tourism: the Alps and the Caucasus, Europ. Res., 30, 1602–1617, 2012.
Politi, N., Nastos, P. T., Sfetsos, A., Vlachogiannis, D., and Dalezios, N. R.: Evaluation of the AWR-WRF model configuration at high resolution over the domain of Greece, Atmos. Res., 208, 229–245, https://doi.org/10.1016/j.atmosres.2017.10.019, 2018.
Politi, N., Vlachogiannis, D., Sfetsos, A., and Nastos, P. T.: High-resolution dynamical downscaling of ERA-Interim temperature and precipitation using WRF model for Greece, Clim. Dynam., 57, 1–27, https://doi.org/10.1007/s00382-021-05741-9, 2021.
Trujillo, E., Molotch, N. P., Goulden, M. L., Kelly, A. E., and Bales, R. C.: Elevation- dependent influence of snow accumulation on forest greening, Nat. Geosci., 5, 705–709, https://doi.org/10.1038/ngeo1571, 2012.
Vajda, A., Tuomenvirta, H., Juga, I., Nurmi, P., Jokinen, P., and Rauhala, J.: Severe weather affecting European transport systems: the identification, classification and frequencies of events, Nat. Hazards, 72, 169–188, https://doi.org/10.1007/s11069-013-0895-4, 2014.
Vogel, J., Paton, E., and Aich, V.: Seasonal ecosystem vulnerability to climatic anomalies in the Mediterranean, Biogeosciences, 18, 5903–5927, https://doi.org/10.5194/bg-18-5903-2021, 2021.
Zhang, W., Luo, M., Gao, S., Chen, W., Hari, V., and Khouakhi, A.: Compound Hydrometeorological Extremes: Drivers, Mechanisms and Methods, Front. Earth Sci., 9, 941, https://doi.org/10.3389/feart.2021.673495, 2021.