 | 27 Jul 2023
Fog formation, smog situations and air quality in high school physics education
Beáta Molnár
Péter Tasnádi
It has become a worldwide expectation that the physics curriculum includes everyday knowledge as well. One important field that can make the curriculum more colourful and exciting is the field of meteorology. In our paper, a three-lesson-long curriculum for high schools will be presented on how to teach the connection between fog formation and air quality. The international educational experience of this particular topic will be surveyed, mainly in the countries of the Carpathian Basin, moreover, the measurement processes and education methods used in the GLOBE Program will also be presented. The experimental curriculum consists of three parts. In the first part air humidity and the concepts of absolute and relative humidity are discussed. Through a few specific exercises, the students participating in the program learn to specify relative humidity and become acquainted with fog formation. It is shown via an experiment that air cooling at a saturated state is not enough to form fog because condensational nuclei are needed for the formation of tiny water drops.
In the 2nd lesson, the concept of temperature inversion and its connection to fog and air pollution are discussed. Using Internet websites the students collect information about the formation of smog, its types, occurrence, and the conditions for declaring smog alerts.
In the 3rd lesson, the methods of air pollution analysis and different air pollutants are discussed. Websites, where the students can follow the air pollution data of their area, are used. Based on these, problems related to the interpretation of the data will be solved. The information which is available on the website of the European Environment Agency is also touched on.
- Article
(2800 KB) - Full-text XML
- BibTeX
- EndNote


In autumn and in winter, fog is a common weather phenomenon in the Carpathian Basin (Wantuch, 2001; Cséplő et al., 2019). At this time the sky was clear over the higher areas, such as the Carpathian Mountains range, while the lower areas could be covered in fog (visibility below 1 km) for days (Fig. 1). This is the persistent cold pool, which is typical for the Carpathian Basin when the concentration of pollutants also increases. This is often ended by a strong cold front, which sweeps out the polluted air and disperses the fog. (Szabóné André et al., 2016, 2021; Cuxart et al., 2021).
The teaching of the material also serves a motivational purpose, because it is a phenomenon, which the students often encounter themselves. On the other hand, the topic also plays an important role from an environmental point of view. Systematic measurements, extracurricular learning and small-group project works play an important role in understanding atmospheric processes (Činčera et al., 2019; Salame et al., 2020; The GLOBE Program, 2023). A good basis for this is provided by various national and cross-border environmental programs, such as the GLOBE Program (Salame et al., 2020; The GLOBE Program, 2023). Teaching students the relationship between fog formation and air pollution is currently an important topic. In the following, the course and the results of the pilot work will be given.
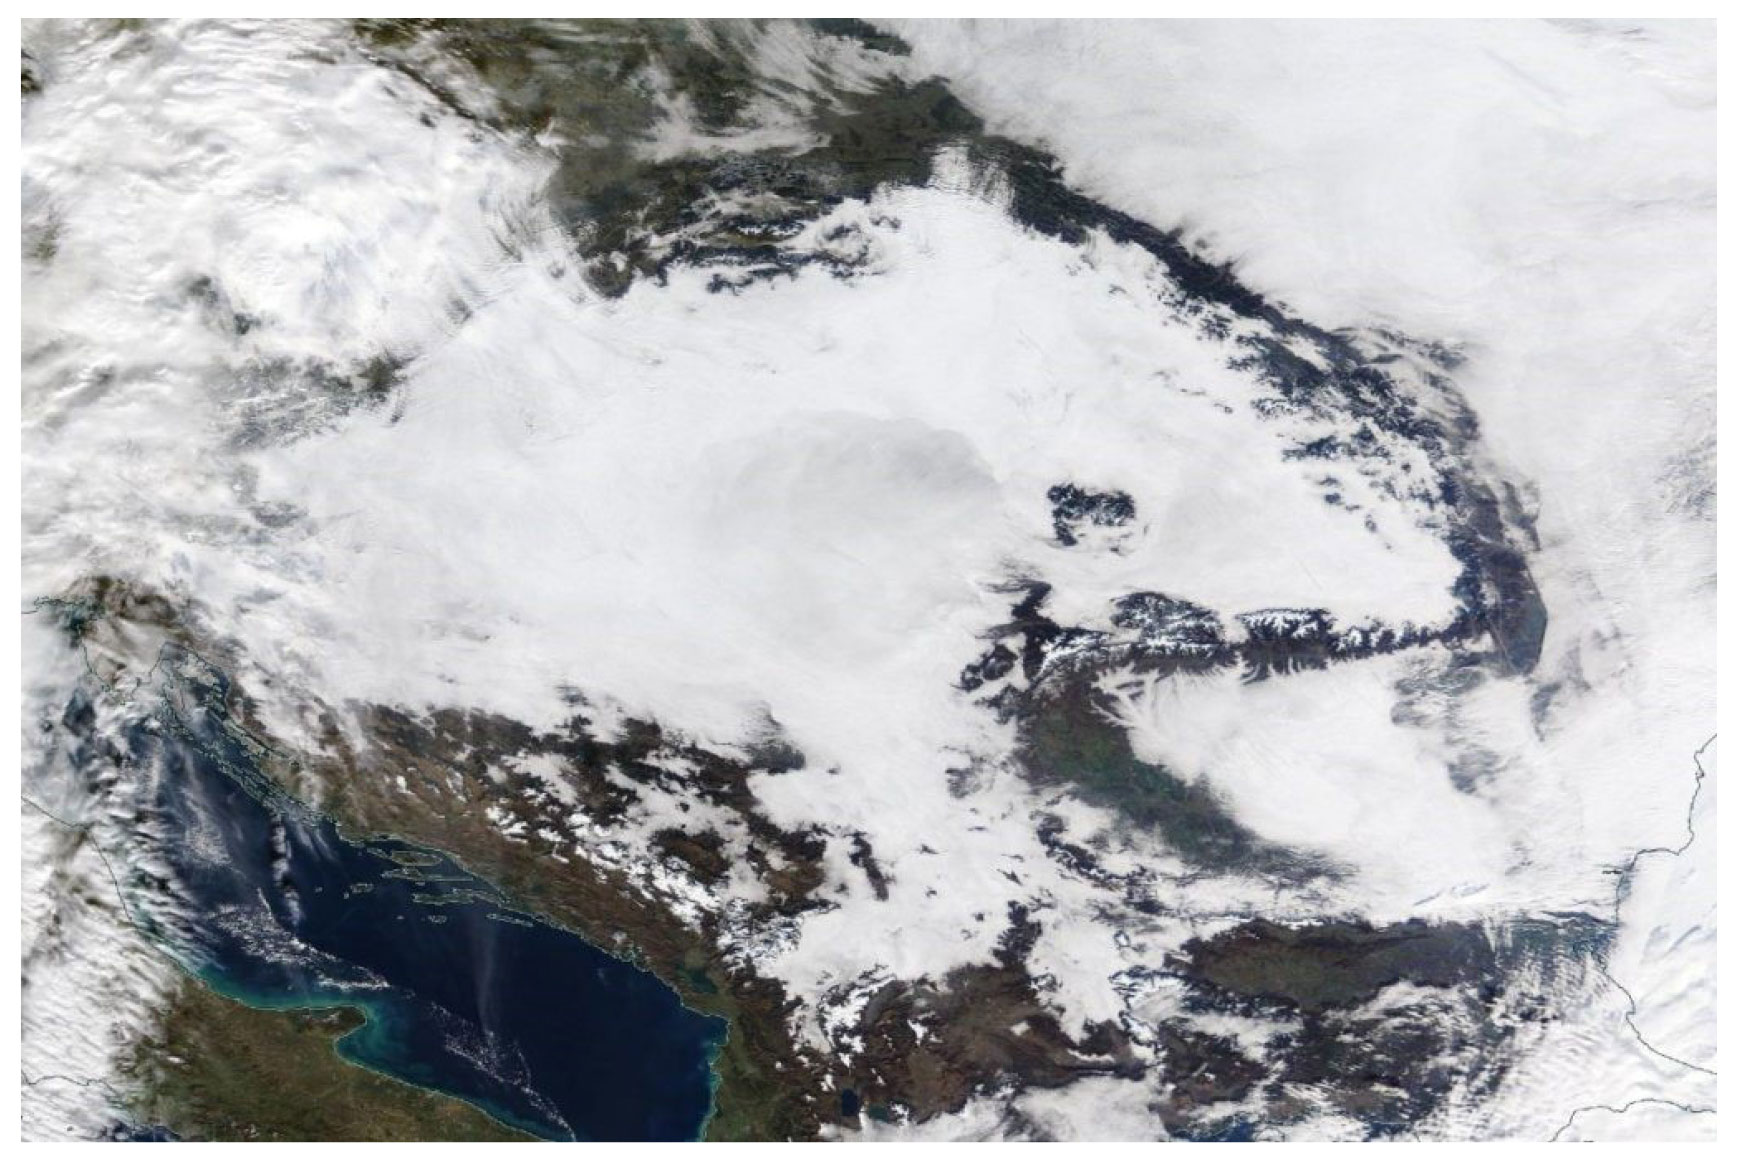
Figure 1Fog in the Carpathian basin (NASA).
Students learn about air pollution in geography class, along with the structure of the atmosphere. They learn about the formation of precipitation in physics, along with the changing of states of matter. In relation to air pollution, they mainly learn about the depletion of the ozone layer, the increasing greenhouse effect, acid rain, the radioactive pollution of the atmosphere and smog. We wanted to make the latter, along with the connection between fog and air pollution more understandable for secondary school students. The first step in teaching is the exact description and explanation of the phenomena. Fog is usually taught together with other meteorological and atmospheric phenomena. In the literature, good examples of the combined presentation of fog and air pollution (e.g. aerosol particles), fog and cloud, and fog and extreme weather phenomena can be found (Georgopoulos et al., 2017; Huo et al., 2020; Salame et al., 2020; Ahrens et al., 2021). Computer applications are also playing an increasingly important role in understanding the phenomena and students are also improving their computer skills while studying this subject (Steegen et al., 2018). However, computer work cannot replace real experiences, experiments and small-group learning. Societal, environmental and health aspects are also important.
The Global Leadership and Organizational Behavior Effectiveness research (GLOBE) Program addresses to the process of teaching meteorology. In the past decades, teaching materials built on the students' measurement and experimentation activities have been used in many countries (House, 1998; Salame et al., 2020; The GLOBE Program, 2023). Several educational protocols have been created in the field of atmospheric sciences, and meteorology, but only a few of these discuss the connection between air pollution and the weather (Mandrikas et al., 2017). The relevancy of the topic in question and its motivational quality of insight into the real world is the reason for our choice.
The water that evaporate from the ground or the plants enters the air in the form of water vapour. At a given T temperature 1 cubic metre of air can contain a given maximum amount of water vapour. This is called the state of saturation. As the air warms, it can contain more and more water vapour. When the moist air cools, it can saturate, and its vapour condenses out in the form of small liquid water droplets. One of the forms of condensation occurring above the ground is dew – water droplets appearing on various surfaces. Another form of condensed vapour is, what we call fog. Fog can appear even before the relative humidity of the air reaches 100 %. We distinguish several types of fog according to their formation, such as radiation and advection fog. Radiation fog forms when the ground cools the air above it, and the vapour in the air is saturated. Advection fog forms when warm moist air moves over a cold ground (Prupacher and Klett, 2010). It should be mentioned that supersaturation is a critical issue in cloud formation. Experiments have shown that pure water can be supersaturated by several hundred per cent without condensation, but cloud formation occurs even at only a supersaturation of a few tenth per cent. This can be understood if we consider that phase transformation always takes place on the nuclei of the new phase. In the case of pure water vapour, the new phase is formed by a local random increase of the density of the vapour. However, this is usually only possible in case of high supersaturation. Atmospheric air, however, always contains hygroscopic pollutants that attract the water molecules of the vapour and become the nuclei of the liquid phase. In such cases, a slight saturation shown by experience is sufficient. The teacher has to adjust this problem in more or less detail to the given student group. Air pollutants entering the atmosphere increase the number of condensation nuclei, and thus the probability of fog forming.
It is a typical characteristic of the Earth's atmosphere that air temperature decreases with the increasing altitude. However, it can occur, that with increasing altitude the air temperature also increases, which is called temperature inversion (Rogers and Yau, 1989). A unique case of temperature inversion is the “cold cushion” of air, which is a common occurrence in the Carpathian Basin (Szabóné André et al., 2021). When this occurs, cold air stays near the ground, while it is warmer between 1000 and 2000 m.
The occurrence of air-polluting materials in the atmosphere can induce smog in bigger cities, or in industrial areas. Classical smog, also known as London type smog is generated by high concentration of sulphur oxides in the air and is caused by the use of sulphur-bearing fossil fuels, particularly coal. Tropospheric ozone is responsible for the formation of Los Angeles type smog. This type of smog, also known as photochemical smog, forms under warm, sunny conditions with no wind. Both types of smog are a consequence of the chemical reactions that occur between the pollutants and the water in fog. During chemical reactions secondary pollutants are formed, which can be converted into sulphuric and nitric acid which is harmful to the environment and human health (Allaby, 2003).
5.1 Air pollution in the Hungarian and Slovak curricula
In Hungary, air pollution is involved in Physics (Grade 12), Geography (Grade 9, 10), and Science (Grade 11.) curricula. The expected learning outcome in Geography is that the students are able to name the most important sources of air pollution and know their consequences, furthermore, they understand the global consequences of the locally acting polluting processes.
In Science, it is that the students “Consciously evaluate the information on the air quality of their living environment, understand the purpose of the measures imposed in case of different levels of smog alarms, support the measures for the protection of the air quality of the settlement, and initiate it if necessary.” (National Curriculum, 2023) The curriculum in Physics does not mention air pollution directly but includes the question of environmental protection.
In Hungary, the final exam can be taken at two levels (ordinary and advanced). Geography graduation requirements include air pollution on both levels. At the ordinary level, students should be able to name the most important sources of air pollution and be able to show examples of the harmful effects of air pollution on health, society, and the economy. At the advanced level, the requirements of the ordinary level are completed by the understanding of people's individual responsibility for air pollution and the ability to mitigate harmful effects.
In Slovakia, students study air pollution from Geography and this is also one of the geography requirements in the final exam.
5.2 First lesson
The goal of the first lesson was for students to understand the concept of humidity in the air, along with absolute and relative humidity, and for them to understand the need for condensational nuclei for fog formation. Students know, that when the Sun heats the Earth's surface water evaporates and turns into a gas, and water vapour forms a part of the atmosphere. So, the process of fog formation can be placed into a wider context of the water cycle (Lee et al., 2019). This topic is taught in both Hungary and Slovakia as part of the geography subject. A table showing the saturated vapour density as a function of air temperature was presented to students (see for example Atkinson, 1981). In order to better understand the concepts of absolute humidity and relative humidity, they had to solve quantitative problems. For example: “What is the relative humidity if there is 2.5 g of water vapour in 2 m3 air at 5 ∘C and what is 6.2 g? How much vapour is there in 3 m3 air at −10 ∘C and how much at 30 ∘C if the relative humidity is 60 %?” They were introduced to the concept of saturated moist air and had to calculate e.g. how many grams of moisture condense if the air is cooled from 20 to 5 ∘C. The relative humidity of the air is 55 % at 20 ∘C and the absolute humidity is not changed during cooling.
Considering that students learnt the curriculum in distance learning, they answered the above-mentioned questions individually, and then checked the solutions together, but in-school learning the individual work can be checked in pairs. Finally, the students are introduced to the concept of the dew point and learn that the vapour, which condensed in the air close to the Earth's surface appears in the form of small droplets of water, called fog.
In the next part of the lesson, the teaching goal is for the students to understand that cold air is not enough for condensation, condensational nuclei are also needed. The various form of condensates and the differences in their formation are also briefly discussed. The central part of the lesson is a demonstration experiment, which helps the understanding of the formation of condensates. The well-known and very impressive experiment is to be presented requires only simple tools, is not dangerous, and students can repeat it at home. A bottle is filled about two-thirds full with hot water (Neuberger and Nicholas, 1962). After a minute most of the water has to be poured out, leaving only 2–3 cm of water in the bottle. This step is necessary because otherwise, the water vapour would have condensed on the walls of the bottle, and we would not be able to see, what is in the bottle. After this, the bottle was closed and we put ice on its top. No precipitation was observed in the glass jar, although the moist air above the water had cooled down. After that, we repeated the experiment but having poured out most of the water a lighted match was dropped into the jar. The bottle was then quickly closed and ice was put on its top as before. Students noticed that mist was forming in the bottle. This was because the burning match emitted condensation seeds which started the condensation process in the supersaturated gas produced during cooling. If we want to prove that fog formation requires condensation seeds, we can also proceed in another way. For example, it is possible to produce supersaturated vapour in a bottle by reducing the pressure, but this is more difficult to achieve, and using the experiment suggested above can be used to produce a better environment for modelling the fog formation. Besides the demonstration experiments, we consider experience gained by measuring atmospheric parameters as pedagogically essential tools, which also improve the learning process at the secondary school level. Therefore, we place special emphasis on the evaluation of the experimental data (Crouch, 2004).
It should be mentioned that among the students, aged 14 to 16, there are many misunderstandings about the state of water vapour and fog. Perhaps this stems from students associating water vapour with the small droplets of water appearing above hot food. In a multiple-choice question of the preliminary test, many students labelled the fog to be a gas. Another answer, which appeared many times, was that fog is an aerosol, which probably came from their previous chemistry studies. This is why it is important to talk about the question of the state of matter after the demonstration experiment particularly, that fog consists of small drops of water (size of 2–10 µm for continental and 15–25 µm for maritime fog). The commonly known mist (the visibility from 1 to 5 km) appearing above food is also not water vapour but is made up of small liquid drops of water, like fog. Similarly, information could be provided on aerosol particles, and their connection with condensation nuclei (what is an aerosol particle, how large is it, etc.). It was discussed that in inhabited areas there are more dust, soot, and other air polluting particles in the air in inhabited areas. Within cities, where Urban heat islands can form, the temperature is a few degrees higher and the relative humidity is lower, the probability of fog can be lower (Sachweh and Koepke, 1997; Vujović and Todorović, 2018). Following that, the temperature inversion was introduced, which causes the foggy weather characteristic of the Carpathian Basin. Due to the temperature inversion, the cold, dense and moist air remains in the basin, while the smoke from chimneys cannot reach the higher altitudes, and these together can contribute to the increase in air pollution, which can lead to the development of smog (Lareau et al., 2013; Szabóné André et al., 2021).
5.3 Second lesson
The aim of the second lesson was for students to understand the reason for the formation of smog (Lagzi et al., 2013). The development of smog and related information are easily accessible to students. Teaching the topic in a classroom environment, it is worth forming groups of four, where students can search and process information cooperatively. Because this curriculum was piloted during a distance learning period, the students searched for the information on their own and presented it to the class. At the beginning of the lesson, students had to answer two questions:
-
What does the word smog mean, and what words does it stem from?
-
What different types of smog do we know?
The following questions should be answered by only one member of each group, based on their own research. He/she become an “expert” of the problem:
-
Under which circumstances does winter/summer smog form? Which air-polluting materials contribute to its formation? What chemical reactions occur during fog formation?
-
What health risks does winter/summer smog pose? In which weather situation does it form? In which areas of the planet is its presence characteristic of? Which memorable historical events did it appear on?
After each member of each group has become an expert on a problem, the experts on each question get together and discuss their answers. Having finished the discussion, experts go back to their original group and teach the task to their peers. Finally one of the experts on each task presents the problem to the class. The speaker is chosen by rolling the dice. After the presentation, experts from the other groups may supplement the presentation.
In addition to acquiring new knowledge, this method also helps students to develop their societal sensitivity. Although it is faster if the teacher conveys the information to students, we are convinced, that students' own information search and the independent information processing related to the conversation with their peers results in deeper knowledge.
5.4 Third lesson
The purpose of the third lesson was for the students to collect daily data on air pollution as well as to understand the relationship between these and socio-economic factors. The aim was also that the students could use air pollution data in their daily practice. The motivating introduction to the third lesson was provided by a weather report, which also included the air pollution data. After the quoted report, students became familiar with the definition and concept of the Air Quality Index (AQI) that can be found on the web page of the European Environmental Agency (https://www.eea.europa.eu/en, last access: 19 July 2023). In addition, they visited websites where the current data of the Air Quality Index for Hungary and Slovakia are available. We quickly surveyed the air-polluting materials that the students know about. Students were then given a table of the pollutants, including their names, sources, and daily and annual changes in their concentrations. They were also informed that every country displays current data on air pollution through their own systems (for example https://www.shmu.sk/en, last access: 19 July 2023, in Slovakia, and https://legszennyezettseg.met.hu/en/air-quality, last access: 19 July 2023, in Hungary). The current data for measuring stations in most countries can be accessed at https://aqicn.org/map/europe/ (last access: 19 July 2023).
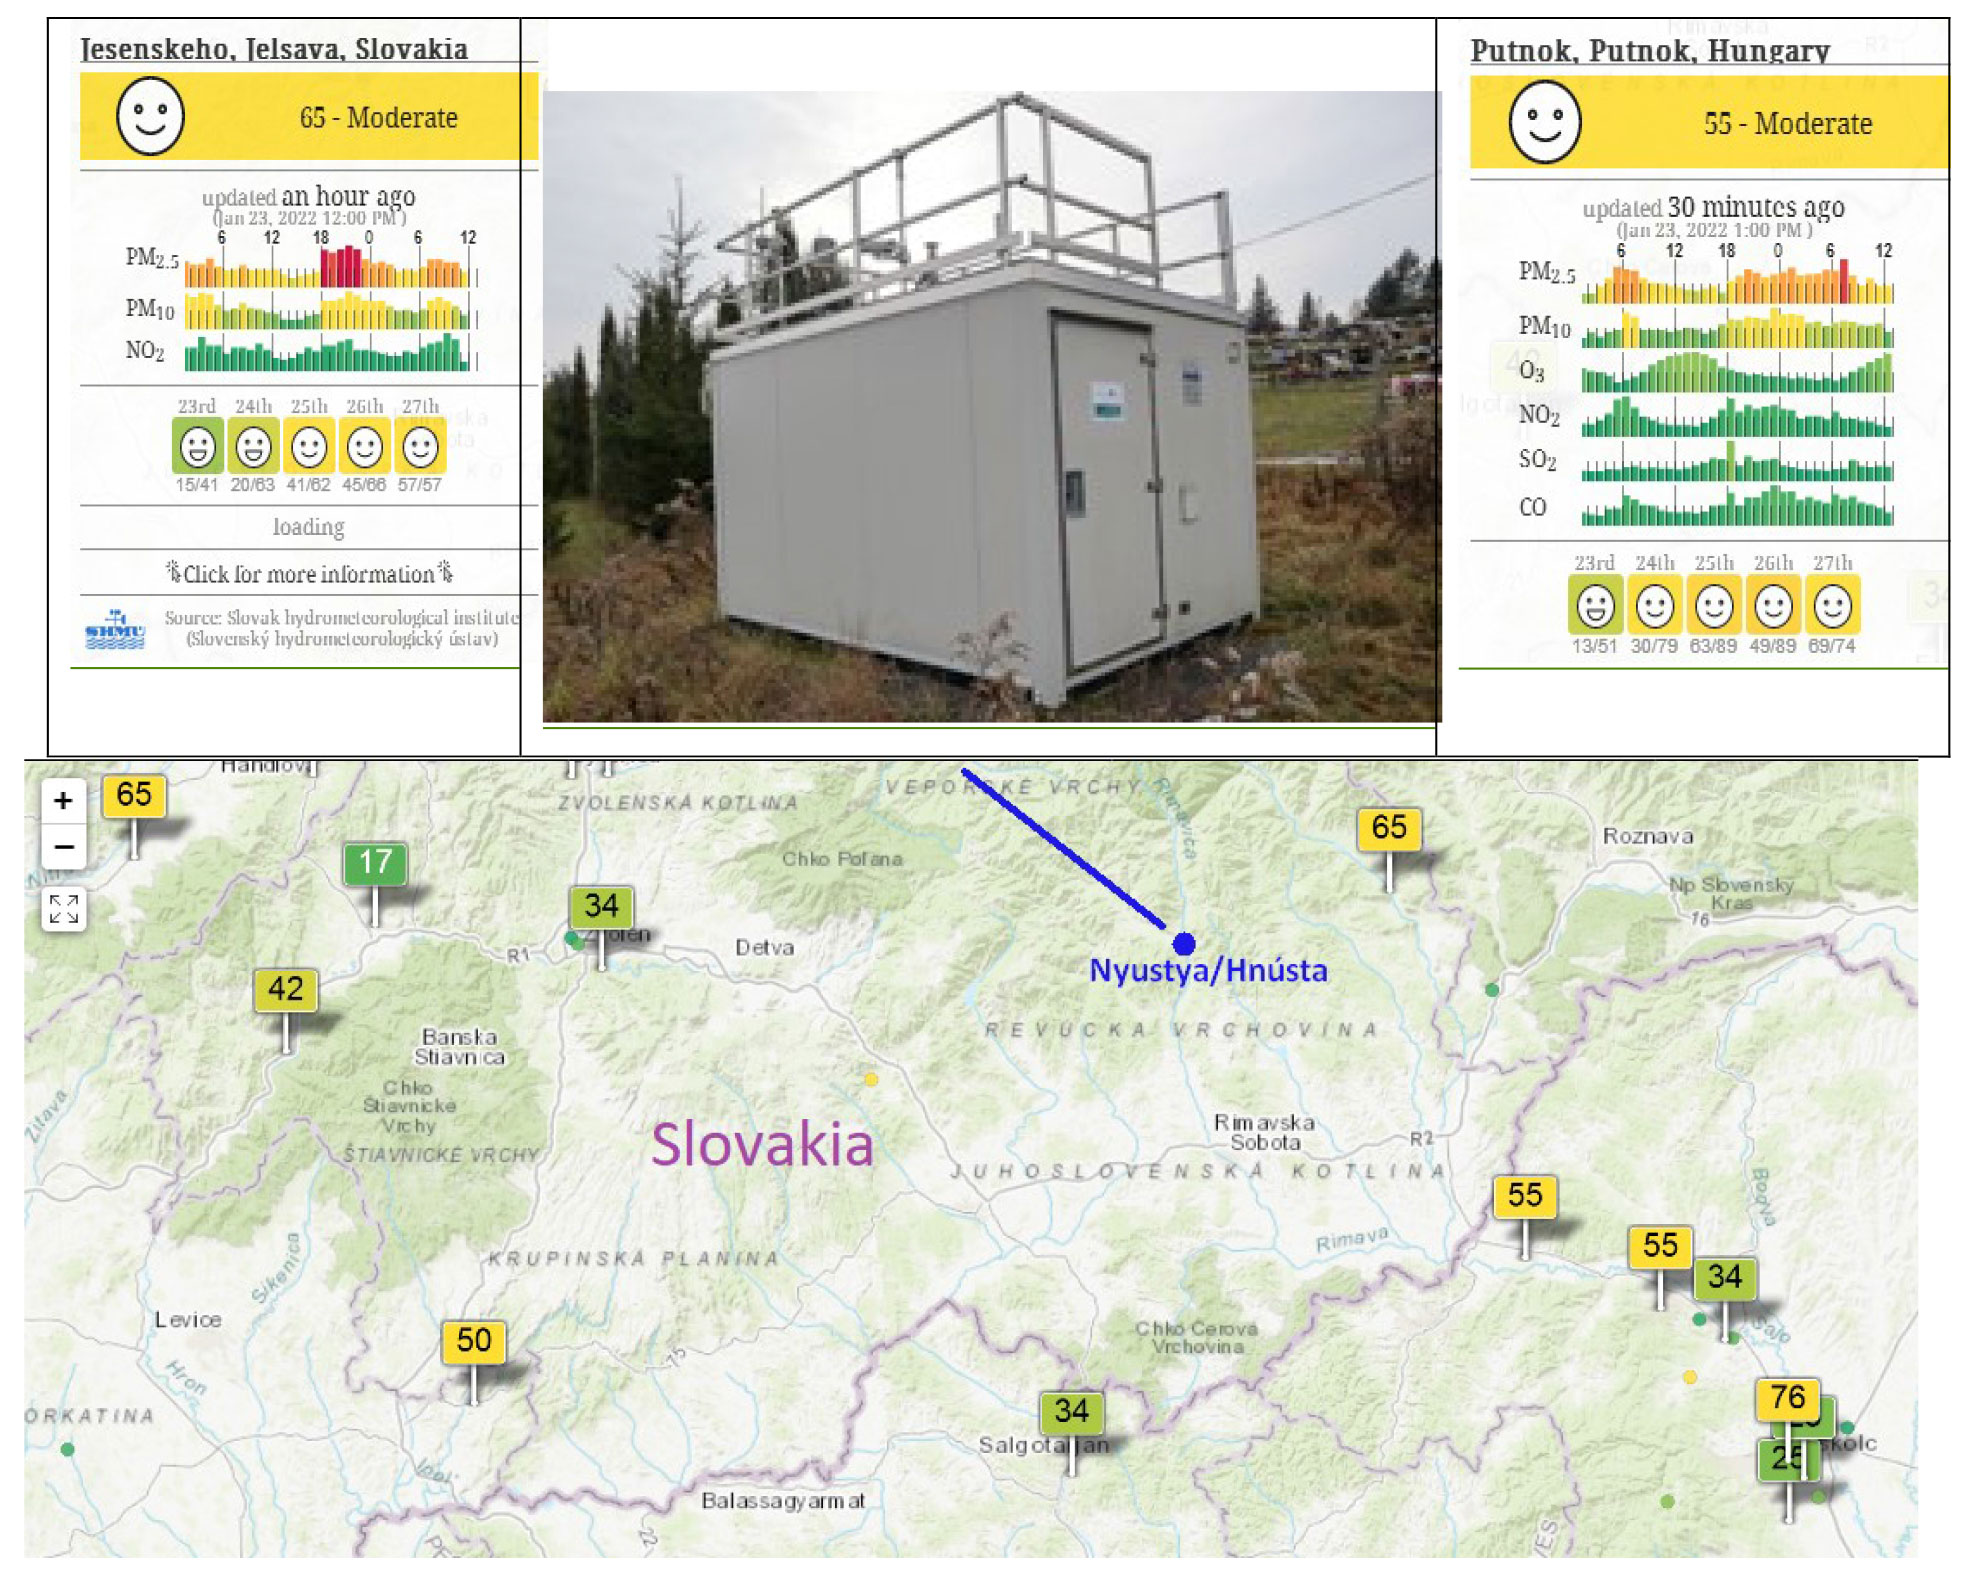
Figure 2The automatic air environmental measuring station nearest to Rimavská Sobota in Slovakia (Hnúšťa). Presently it is not included in the international data traffic (above, centre). Last day air pollution data (PM2,5, PM10, NO2), current and forecasted AQI 23. January 2022 Jelšava station (Krajčovičová and Matejovičová, 2010; Krajčovičová et al., 2014) (above, left). The same data from Putnok, Hungary, OLM (Országos Légszennyezettségi Mérőhálózat, National Air Pollution Monitoring Network, https://legszennyezettseg.met.hu/en/air-quality, last access: 19 July 2023) (above, right). Stations participating in international data exchange are marked by little tables with the measured AQI. (map below) The AQI values change between 0–500. Below 50 the air quality is good, between 50–100 moderate, 101–150 is dangerous for human groups sensitive to air pollution (https://aqicn.org/map/europe/, last access: 19 July 2023).
The first task for students was to look up the weather station closest to their home, and its measurements on air pollution. In most places, air pollution is indicated by the air pollution index. The index is very beneficial in informing people about the state of air pollution therefore students were introduced to the calculation of the index. The harmful effect of air pollutants on human health can be divided into six categories based on the given concentration of the pollutant. In Fig. 2 a map can be seen which shows AQI data based on the data available from the air-pollution measuring stations evaluated by model calculation. The Internet can provide good data from which project problems can be constructed for secondary school students (data processing, air-environment monitoring, explanation of the changes in pollution, and so on). These problems are research-based, experience-centred problems, which can highly motivate students. If the problems relate to their closest living environment, then they help to develop and preserve local identity. (As an example, we set project problems for our students concerning the air pollution near Rimavská Sobota.) The problems connected with air pollution are involved both in the Hungarian and Slovak curricula and sometimes questions and problems in the final exam also concern air pollution (Mónus, 2019, 2020; Demčaková et al., 2021).
5.5 Exercises
Finally, the students were given the following exercises:
-
Find the closest weather station to your home at https://aqicn.org/map/europe/ (last access: 19 July 2023). What is the air quality index? Which category does the value belong to?
-
Find out on the website, what dangers each category poses for which groups of people?
-
Find your closest station's data from previous years on the website. In which months had the best and worst air quality?
-
Does the air pollution index change during the day? If it does, which time of the day shows the worst air quality?
-
Find the places with the worst air quality in Hungary and Slovakia!
-
Compare the current and long-term data of the downtown station in Bratislava with the data measured by the station in Jelšava, Slovakia, then the data measured by a station in downtown Budapest that of measured by the station in Putnok, Hungary. Explain the difference by considering geographical, economic, and social causes.
Previous investigations have indicated that the students understand various hydro-bio-geological processes in the water cycles, but most of them lack the dynamic, cyclic, and systemic perceptions of the system (Ben-zvi-Assarf and Orion, 2005). Therefore, we considered it essential to supplement the content knowledge of high school physics with those related to atmospheric humidity, fog, and air pollution. For this aim, a three-hour teaching module was elaborated, which includes the analysis of air-polluting events and foggy weather. Perhaps the best example of this is the permanent cold pool which often forms in the Carpathian Basin in winter. The teaching material was used in special extracurricular non-compulsory courses. Pre- and post-tests were given to students when the module was piloted. After experimental teaching, 43 % of students were able to answer questions about the conditions of fog formation and the relationship between air pollution and fog formation with an accuracy of over 90 %.
Other than helping the students better understand the concept of humidity, the experiment helped them better understand phase transitions. Based on our experience, the experimental curriculum motivated the students to become active in solving environmental protection tasks. An important result is that we recognized the importance of targeted research on the Internet in the teaching process.
Analysis data is available upon request from the correspondence author.
All three authors contributed to the writing of this paper. BM created the teaching resources, made and evaluated the school tests, and edited the manuscript. PT gave the theoretical, TW the methodological background.
The contact author has declared that none of the authors has any competing interests.
Publisher’s note: Copernicus Publications remains neutral with regard to jurisdictional claims in published maps and institutional affiliations.
This article is part of the special issue “21st EMS Annual Meeting – virtual: European Conference for Applied Meteorology and Climatology 2021”. The corresponding presentation was part of session ES3.1: Education and training: at schools, for the public, for stakeholders and professionals.
The authors thank to Physics Education PhD Program of the Doctoral School of Physics of Eötvös Loránd University and to the colleagues from Tompa Mihály Protestant High School, Rimaszombat (Rimavská Sobota, Slovakia) for supporting of PhD research. The educational research activity related to CA20108 - FAIR NEtwork of micrometeorological measurements (FAIRNESS) and the Pannonian Experiment (PANNEX) program which is part of the Regional Hydroclimate Project (RHP) of the World Climate Research Programme (WCRP) Global Energy and Water Exchanges Project (GEWEX). Thank you for their help.
This paper was edited by Tomas Halenka and reviewed by two anonymous referees.
Ahrens, C. D. and Henson, R.: Meteorology Today: An Introduction to Weather, Climate, and the Environment, Cengage learning, Australia Brazil, Canada, Mexico, Singapore, United Kingdom, United States, ISBN 978-0-357-45207-3, 2021.
Allaby, M: Fog, Smog, and Poisoned Rain, Facts on Files, Facts on File, New York, ISBN 0-8160-4789-8, 2003.
Atkinson, B. W. (Ed.): Dynamical meteorology: an introductory selection, Methuen, London, 228 pp, ISBN 978-0416738308, 1981.
Ben-zvi-Assarf, O. and Orion, N. J.: A Study of Junior High Students' Perceptions of the Water Cycle, Geosci. Educ., 53, 366–373, https://doi.org/10.5408/1089-9995-53.4.366, 2005.
Činčera, J., Kroufek, R., Marková, K., Křepelková, Š., and Šimonová, P.: The GLOBE Program: what factors influence students' and teachers' satisfaction with science education, Res. Sci. Technol. Educ., 37, 245–261, https://doi.org/10.1080/02635143.2019.1687441, 2019.
Crouch, C. H., Fagen, A. P., Callan, J. P., and Mazur, E.: Classroom Demonstrations: Learning Tools Or Entertainment?, Am. J. Phys., 72, 835-838, https://doi.org/10.1119/1.1707018, 2004.
Cséplő, A., Sarkadi, N., Horváth, Á., Schmeller, G., and Lemler, T.: Fog climatology in Hungary, Időjárás, 123, 241–264, https://doi.org/10.28974/idojaras.2019.2.7, 2019.
Cuxart, J., Prtenjak, M. T., and Matjacic, B.: Pannonian Basin Nocturnal Boundary Layer and Fog Formation: Role of Topography, Atmosphere, 12, 712, https://doi.org/10.3390/atmos12060712, 2021.
Demčaková, A., Sera, B., and Sery, M.: Environmental pollution as a part of environmental education in school education – example from Slovakia, Fresenius Environ. Bull., 30, 2045–2052, 2021.
Georgopoulos, K., Houssos, E. E., Gkikas, A., Papadimas, C. D., Lolis, C. J., and Bartzokas, A.: Deucalion: Modern Educational Tools for Precaution Measures During Extreme. In Weather Events Perspectives on Atmospheric Sciences, edited by: Karacostas, T. S., Bais, A. F., and Nastos, P. T., Springer International Publishing, Switzerland, 428–435, ISBN 978-3-319-35095-0, 2017.
House, R. J.: A brief history of GLOBE, J. Manag. Psychol., 13, 230–240, https://doi.org/10.1108/02683949810215048, 1998.
Huo, Y.-J., Shih, K.-T., and Lin, C.-J.: The study on Integrating Air Pollution Environmental Education into the Teaching Personal and Social Responsibility Model in Physical Education, IOP Conf. Ser.-Earth Environ., 576, 012006, https://doi.org/10.1088/1755-1315/576/1/012006, 2020.
Krajčovičová, J. and Matejovičová, J.: Notification of the postponement of attainment deadlines and exemption from the obligation to apply daily and annual limit values of PM10 and annual limit value of NO2 for certain zones and agglomerations of Slovakia. Slovak Hydrometeorological Institute, Bratislava, 94 pp., https://www.shmu.sk/File/Notification.pdf/ (last access: 31 May 2023), 2010.
Krajčovičová, J., Kremler, M., and Matejovičová, J.: Local PM10 source apportionment for non-attainment areas in Slovakia, Int. J. Environ. Pollut., 54, 166, https://doi.org/10.1504/IJEP.2014.065117, 2014.
Lagzi, I., Mészáros, R., Gelybó, Gy., and Leelossy, Á.: Atmospheric Chemistry, Eötvös Loránd University, Budapest, 208 pp., https://www.eltereader.hu/media/2014/04/Atmospheric_Chemistry_READER.pdf, last access: 19 July 2023.
Lareau, N. P., Crosman, E., Whiteman, C. D., Horel, J. H., Hoch, S. W., Brown, W. O. J., and Horst, T. W.: The Persistent Cold-Air Pool Study, B. Am. Meteorol. Soc., 94, 51–63, https://doi.org/10.1175/BAMS-D-11-00255.1, 2013.
Lee, T. D., Jones, M. G., and Chesnutt, K.: Teaching Systems Thinking in the Context of the Water Cycle, Res. Sci. Educ., 49, 137–172, https://doi.org/10.1007/s11165-017-9613-7, 2019.
Mandrikas, A., Stavrou, D., and Skordoulis, C.: Teaching Air Pollution in an Authentic Context, J. Sci. Educ. Technol., 26, 238–251, https://doi.org/10.1007/s10956-016-9675-8, 2017.
Mónus, F.: Comparing environmental awareness of Hungarian students in secondary schools with different socio-economical background, J. Appl. Technol. Educ. Science Eng., 9, 17–27, https://doi.org/10.24368/jates.v9i1.68, 2019.
Mónus, F.: Environmental perceptions and pro-environmental behavior – comparing different measuring approaches, Environ. Educ. Res., 25, 1–26, https://doi.org/10.1080/13504622.2020.1842332, 2020.
National Curriculum: framework curriculum high school classes 9–12, https://www.oktatas.hu/kozneveles/kerettantervek/2020_nat/kerettanterv_gimn_9_12 evf, last access: 31 May 2023 (in Hungarian).
Neuberger, H. and Nicholas, G.: Manual of Lecture Demonstrations, Laboratory Experiments, and Observational Equipment for Teaching Elementary Meteorology in Schools and Colleges, Report Resumes, Pennsylvania State University, University Park, USA, 189 pp., ark:/13960/t6934p477, 1962.
Prupacher, H. R. and Klett J. D.: Microphysics of clouds and Precipitation, Springer Science & Business Media, New York, ISBN 978-0-7923-4211-3, 2010.
Rogers, R. R. and Yau, M. K.: A short course on cloud physics, Butterworth-Heinemann is an imprint of Elsevier, Oxford, UK, ISBN 0-7506-3215-1, 1989.
Sachweh, M. and Koepke, P.: Fog dynamics in an urbanized area, Theor. Appl. Climatol., 58, 87–93, https://doi.org/10.1007/BF00867435, 1997.
Salame, I. I., Sabi, S., and Hamid, S.: A study of the GLOBE Program and its impact on public school teachers and their students, J. Acad. Perspect., 2020, 1–19, 2020.
Steegen, A., Hasendonckx, F., and Cock, M.: Can an Interactive Learning Path on A Tablet PC Counter Misconceptions on the Formation of Clouds and Wind?, Rev. Int. Geogr. Educ., 8, 53–73, 2018.
Szabóné André, K., Bartholy, J., and Pongrácz, R.: Synoptic climatological analysis of persistent cold air pools over the Carpathian Basin, EGU General Assembly, Vienna, Austria, 17–22 April, 2016EGUGA.18.2928S, 2016.
Szabóné André, K., Bartholy, J., Pongrácz, R., and Bór, J.: Local identification of persistent cold air pool conditions in the Great Hungarian Plain, Idojaras, 125, 167–192, https://doi.org/10.28974/idojaras.2021.2.1, 2021.
The GLOBE Program: A Worldwide Science and Education Program, https://globe.gov/, last access: 31 May 2023.
Vujović, D. and Todorović, N.: Urban-rural fog differences in Belgrade area, Serbia, Theor. Appl. Climatol., 131, 889–898, https://doi.org/10.1007/s00704-016-2019-z, 2018.
Wantuch, F.: Visibility and fog forecasting based on decision tree method, Idojaras, 105, 29–38, 2001.
- Abstract
- Introduction
- Where does this appear in today's education?
- Material on the topic from the GLOBE Program
- Background in physics
- Educational practice
- Summary
- Data availability
- Author contributions
- Competing interests
- Disclaimer
- Special issue statement
- Acknowledgements
- Review statement
- References