 | 18 Aug 2022
Microclimatic field measurements to support microclimatological modelling with ENVI-met for an urban study area in Cologne
Nils Eingrüber
Wolfgang Korres
Karl Schneider
Cities are particularly affected by climate change impacts. Due to global warming, the frequency and intensity of summer heat events increases for many cities around the globe. Urban climatological studies have shown significant positive trends in the number of hot days and tropical nights. Heat stress is an important health as well as economic risk. Thus, urban planning needs to adapt to climate change. This requires a sound scientific analysis of different adaptation measures and management options, which must be based on appropriate data, models and scenarios to assess their suitability and efficacy. The goal of this paper is to assess the suitability of a low cost weather station network consisting of 33 NETATMO weather sensors and ultrasonic anemometers to measure air temperature, relative air humidity, wind speed and wind direction of a 16 ha study area in Cologne with high temporal and spatial resolution to support microclimatological modelling. The temperature and humidity sensors were calibrated against a research grade reference sensor under laboratory conditions. In addition, a research grade meteorological station (Campbell Sci.) was set up in the study area as a reference. The NETATMO sensors were placed to identify local microclimatic effects due to different surface types, vegetation and building structures. Using descriptive statistical analyses and pairwise comparisons, significant differences in the microclimatic conditions of the various sites were found, which can clearly be attributed to specific small scale microclimate factors. Significant differences were particularly identified comparing an avenue and a narrow street as well as a backyard and an urban park area. The sensors proved to provide data reliably and with suitable quality to measure microclimatic effects. The choice of sensors lends itself well for citizen participation, needed to facilitate climate change adaptation. In our further research, the data will be used as reference data for microclimatological modelling with ENVI-met investigating particularly options of mitigating climate change effects.
- Article
(2457 KB) - Full-text XML
-
Supplement
(699 KB) - BibTeX
- EndNote


In the context of climate change, an increasing frequency and intensity of extreme heat exposure is observed, analysed and predicted for many cities and agglomerations around the world. While the fundamental effects of urban surfaces on local climate were analysed in a pioneering work by Oke (1984) who discusses also observation techniques and problems regarding the selection of measurement sites and the design of a network to analyse the conditions in the urban canopy layer, recent climate studies and events such as the ongoing extreme heat event in India and Pakistan in spring 2022 show that besides climate mitigation and adaptation, measures on the local scale are essential in addition to climate protection policies.
Many urban climatological studies showed significant positive trends in the number of hot days with maximum temperatures of over 30 ∘C in recent decades, especially in the city centres (Salata et al., 2016). Extreme temperatures pose a serious health risk to humans and jeopardize urban ecosystems as well as urban services. Significant effects upon human wellbeing, health and mortality rate were observed with adverse impacts upon society and economy (Ketterer and Matzarakis, 2014; Lee et al., 2016). Thus, climate change leads to an increasing need to adapt cities and to mitigate adverse effects. In order to reduce the exposure to heat in urban areas, suitable adaptation measures must be developed and implemented in urban planning (Müller et al., 2014). Green infrastructure, facade greenings, urban water bodies, shadings, cooling materials or reflective surfaces are promising approaches as they decrease the absorbed incoming radiation by a higher albedo or shift the partitioning of the surface energy balance towards latent instead of sensible heat flux (Herath et al., 2018b). In many recent studies, climatological effects of different adaptation measures were analysed and shown (Yuan et al., 2017; Perini et al., 2017; Sun et al., 2017). Zölch et al. (2016) evaluate various measures such as spatial arrangement of urban green areas or different types of green infrastructure to mitigate heat stress and to improve thermal outdoor comfort. Similar applications can be found in Sodoudi et al. (2018). Emmanuel and Loconsole (2015) quantify the mitigation of urban overheating by green infrastructure in Glasgow. Similarly, Declet-Barreto et al. (2013) analyse cooling effects of central parks as an adaptation strategy in Phoenix. The results of these studies show that green infrastructure is a successful mitigation approach to reduce heat stress, e.g. for Montreal in Wang and Akbari (2016), for Tehran in Farhadi et al. (2019), for Toronto in Wang et al. (2016) or for cities in Sri Lanka in Herath et al. (2018a). In addition, studies by Yang et al. (2013) and Krüger et al. (2011) confirm that different surface materials as well as the urban geometry, density and morphology have a significant impact on thermal outdoor comfort and air quality in cities (Rui et al., 2019). Other measures to reduce heat stress in urban areas are the cooling effects of green roofs or walls (Razzaghmanesh et al., 2016) and the temperature regulating effects of urban forests (Zhao et al., 2018). Also, the spatial arrangement of these surface cover types is important to optimize the effects of adaptation strategies (Middel et al., 2015). However, given the location in different climate zones, differences in topography, morphology and structure as well as society, economy and culture, adaptation measures are unique for each city and vary in terms of their efficacy, suitability and acceptability. The implementation of adaptation measures requires citizen participation. Thus, it is important to involve stakeholders throughout the process, starting from evidence based diagnosis of microclimatic effects all the way to the implementation and maintenance of adaptation measures.
The willingness of citizen to participate in the transformation towards climate-adapted cities is particularly promoted by experiencing cause and effect relationships and by being able to actively participate. Many studies on urban climatology focus on the urban heat island effect to explain the temperature differences between agglomerations and its surrounding countryside (Stewart, 2011) investigating particularly the scale of entire cities. Only few studies however have been carried out to investigate and model urban microclimate at a very small scale of blocks within city quarters with a spatial resolution which is directly related to the own living environment of the urban citizen.
Pathways towards adaptation building of cause and effect relationships can particularly be assessed using microclimatological models. Also, the assessment of the efficacy of adaptation measures under future climate conditions requires model analyses. As adaptation measures are implemented in local places, high resolution modelling is necessary to address local effects and foster participation. This in turn requires high resolution measurements to calibrate and validate the models. The ENVI-met model is a well established tool for calculating the urban microclimate with a high spatial resolution of up to 1 m3, featuring properties and parameters of a wide range of natural and built surfaces (Acero and Arrizabalaga, 2018). ENVI-met models all relevant energy and matter fluxes (ENVI-met, 2022). Thus, microclimatic effects of different planning alternatives can be analysed (Ebrahimnejad et al., 2017; Ziaul and Pal, 2020; Gusson and Duarte, 2016). Examining the effects of green infrastructure (e.g. trees, parks and facade/roof greenings) or other adaptation measures is one key application (Ambrosini et al., 2014; Crank et al., 2018; Yilmaz et al., 2018). Also, the effects of cooling building materials can be assessed (Tsoka et al., 2018). The validation of the ENVI-met model outputs requires in situ data with an appropriate high temporal and high spatial resolution. Thus, a densely distributed measurement network of weather sensors is needed (Bande et al., 2019; Simon et al., 2018).
Building on the work here cited, the goal of this paper is to describe and assess a network of low cost weather stations implemented in a 16 ha residential study area in Cologne to measure the urban microclimate. Thus, we first present the study area and the weather sensors used. Based upon the results of a thorough quality assessment of the sensors, the suitability of this measurement network of low cost weather stations is assessed to identify microclimatic effects and support microclimate modelling with ENVI-met. In combination with research-grade climate stations measuring in a well-defined standard environment, these low cost stations are particularly useful as they address the actual living environment of the urban residents and facilitate their participation, thus building a bridge between expert application and citizen participation. Understanding factors explaining these microclimatic effects is the basis to develop adaptation measures and to foster active participation in climate change adaptation. To this end, this paper documents the setup of the microclimatic measurement network, the quality assurance procedure and first measurement analysis results.
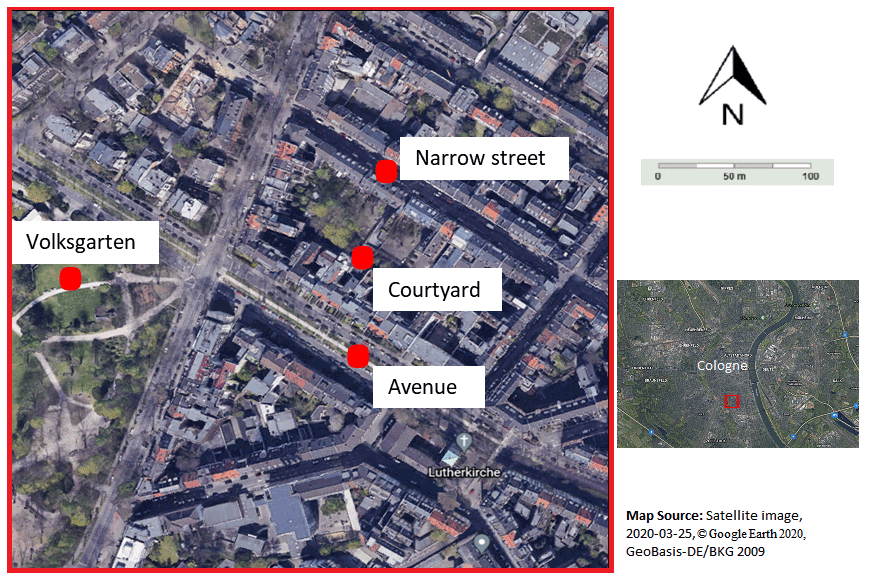
Figure 116 ha study area in the southern city of Cologne and its characteristic spatial units (satellite image: © Google Earth 2020).

Figure 2Built up weather station network in the urban study area in Cologne: Locations of the 33 installed NETATMO sensors (temperature/humidity sensors and wind sensors) and the research grade meteorological station (map: © TIM Online 2020).
2.1 Study area and measurement network
The 16 ha study area is located in Western Germany in the southern city of Cologne within the humid and oceanic Cfb climate zone according to Köppen. The study area is a residential area characterized by homogeneous and closed building structures with mostly orthogonal street arrangements, which can be divided into narrow streets and avenues (Fig. 1). The urban park “Volksgarten” with lawn, bushes, groups of trees and a pond in the western part of the study area as well as smaller green areas in the courtyards with single trees and gardens occupies about 20 % of the research area. A microclimatic measurement network was implemented (i) to continuously measure the three dimensional local climate character of the streets, avenues and courtyards, (ii) to address the variability of local climate character as a function of street character, ventilation through the park, vegetation and greenings as well as height, (iii) to provide quality control of the measurements by using reference measurements and sensor calibration and (iv) to facilitate citizen participation by using inexpensive weather stations and sensors allowing extension of the network. Thus, we selected the semi professional, small smart home NETATMO weather stations consisting of an indoor module (base station) with WiFi connection, two to four temperature/humidity outdoor modules and an ultrasonic anemometer (technical specifications: NETATMO, 2022). The temperature/humidity sensors are shielded with not aspirated white radiation shields provided by the weather hardware company TFA. The shield offers a good air flow and protection against precipitation. The weather stations were installed by an expert in private spaces (front gardens, building facades/balconies and courtyards) in various heights. The stations automatically store and upload the measured data in real time via the provided wireless internet connection of the participating citizens. The interested citizen scientists have been engaged free of charge using social networks in the study area, e.g. the parish or associations, but also by contacting local companies (like shops, theatre), or by recommendations for further interested citizens in the study area by existing participants. The citizen scientists provide us with metadata about the measurements, send us photos for documentation, and ensure that the measurement conditions in the surrounding of the sensors remain as constant as possible (e.g. by regularly removing weeds). The citizen scientists have received an account and access from us in order to follow the measurements in real time with an app on their smart phone or in the PC browser. In the app, they can also get background information on the measurements, display easy understandable diagrams, or download the measurement data as Excel files. In addition, we provide the citizen scientists with simple statistical evaluations such as annual summaries for the sensors as well as our research results and publications at regular intervals. We provide information about the sensors and our current research activities in a regular newsletter, continuously visit the participants for routine checks as well as during study courses with students (surveys on environmental perception). Furthermore, we offer the citizen scientists to educate themselves during our provided citizen urban climate excursions on measurement methods, local effects of small scale climate factors on the urban microclimate, as well as climate change adaptation strategies in cities (in cooperation with the CUBiK project). In total, 33 outdoor sensors assigned to eleven NETATMO base stations have been uniformly installed by us in the research area in early summer 2021 to continuously measure air temperature, relative air humidity, wind speed and wind direction. The network was designed to address the microclimate character of different types of streets (avenue vs. narrow street) around the central block, of different street orientation (NW–SE vs. NE–SW), as well as comparing frontyard and backyard locations. Also, sites with different types of facades, ventilation, vegetation and greenings are equipped with sensors, and can be analysed in reference to a site in the Volksgarten park. Up to four outdoor modules are installed for each NETATMO base station. Thus, microclimatic differences between different sides of the street, sun exposure of the building facades, different heights from the street level (2–14 m), different distances from buildings and vegetation and between courtyard and frontyard side can be analysed. This setup enables the analysis of microclimatic effects related to street orientation, street character, and facade character (e.g. regular vs. greened facades) through pairwise comparisons. Furthermore, the arrangement also allows analysing gradients from the Volksgarten park in the west to the dense and narrow development in the east of the study area. All sensors are mounted on rods with a minimum distance of 50 cm from facades or vegetation. This distance was chosen with regard to the ENVI-met microclimate model, since it corresponds to the centre of one pixel in the model world. In addition to a NETATMO sensor (sensor Z2.1) at the Volksgarten site, a research grade meteorological station (Campbell Sci.) was installed there serving as reference for the NETATMO weather stations. Precipitation, solar irradiation, wind speed and wind direction, air temperature and relative air humidity as well as soil moisture and soil temperature in two different depth levels below the ground surface (20 and 50 cm depth) are continuously measured at this reference station, which is located on a regularly short-cut grass surface. The soil moisture and soil humidity sensors were oriented parallel to the soil surface. Figure 2 shows the exact locations and codes of all stations and sensors in the study area. The measurement interval was set to the smallest possible recording interval of five minutes for all stations, which have been recording continuously since installation. The measurement time series of all sensors include gaps of less than 8 % of all possible five minute intervals in 2021. To check for the long term stability and consistency of the measurement network, the continuous monitoring is interrupted for some days every few month due to re-calibration under laboratory conditions and rotation of the sensors.

Figure 3Air temperatures measured at the NETATMO sensors in the study area during the eleven day test period.
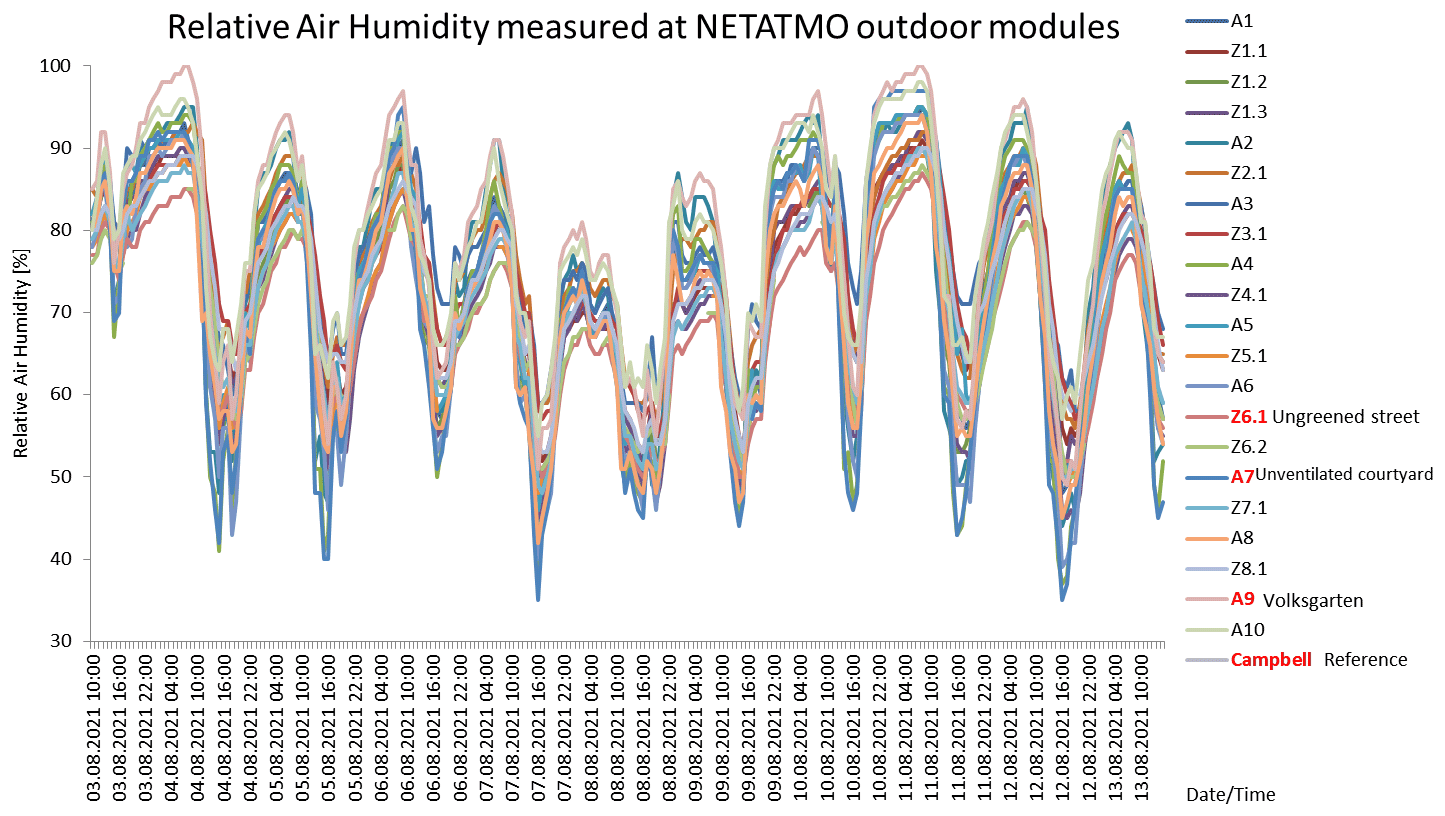
Figure 4Relative air humidities measured at the NETATMO sensors in the study area during the eleven day test period.
2.2 Statistical evaluation methods
Prior to installation, the NETATMO sensors were quality checked under laboratory conditions and calibrated using a two-point calibration process utilizing a high accuracy reference sensor (Dostmann electronic PT). The temperature two-point calibrations were carried out for 7 and 35 ∘C based on which the temperature scales of all NETATMO sensors have been linearly adjusted. In the same way, the humidity two-point calibrations were carried out for 12 % and 88 % based on which the relative humidity scales of all NETATMO sensors have been linearly adjusted. After the calibration, the NETATMO sensors have been validated against the reference sensor for the temperatures 7, 22, 30 and 35 ∘C, respectively for the humidities 12 %, 38 % and 88 %, whereby these different temperature and humidity conditions were changed both in successive orders of magnitude and by jumps (e.g. from 7 ∘C directly to 35 ∘C). As a statistical goodness of fit indicator, the root mean square error (RMSE) has been calculated for all conditions and sensors. For temperature, an averaged RMSE of 0.083 ∘C could be determined for all sensors, ranging from 0.059 to 0.178 ∘C. For relative humidity, an averaged RMSE of 1.42 % was found for all sensors, ranging from 0.71 % to 2.64 %. After sudden extreme temperature and humidity condition changes (e.g. from 7 to 35 ∘C), the NETATMO sensors reached equilibrium after a typical full response time of around 25–35 min with a deviation of less than 0.2 ∘C and 5 % respectively to the lab reference sensor. As the response time of the reference sensor is shorter than with the low cost sensors, only the stationary data after this full response time have been included for the two-point calibration procedure and validation analysis. The equilibrium curve and the time to reach the equilibrium also allows a statement about the adaptation dynamics of the sensors in the field which can accurately resolve and reproduce small dynamic temperature or humidity fluctuations (such as 0.3 ∘C in 5 min).
To analyse the ability of the network to detect microclimatic variations due to local effects, an eleven day test period in August 2021 (3–13) was selected, which was characterized by stable high pressure weather conditions. The data of all NETATMO sensors have been compared to each other and quality checked against the research grade meteorological reference station in the Volksgarten for the test period. The relative frequency distributions of sensors close to each other (two nearest neighbour stations) have been evaluated. Significant differences between the individual sensors were found and analysed based on statistical t-tests for a significance level of α=0.05. The differences can be attributed to specific small scale microclimate factors. Temperature deviations of more than two standard deviations (upwards) were only detected for sensor A4 after midday on a very warm day with intense radiation. This deviation can be traced back to the fact that at this site, ivy has grown after the installation of the sensor much closer than 50 cm to the sensor. Thus, the surface converting heat and radiation is closer at this sensor as compared to the other sensors. When comparing the sensor A4 to the other sensors, the inconsistent distance at A4 to the energy conversion surface (here ivy) as compared to the other locations must be taken into account.
To investigate the urban microclimate of this 16 ha study area during the test period, descriptive statistical analyses and significance tests were applied for all NETATMO sensors. Arithmetic means and standard deviations were calculated. Based on these values, pairwise comparisons between different site characteristics around the sensors were implemented to assess their microclimatic effects. These pairwise comparisons address seven contrasting attributes regarding the microclimate factors and conditions around the sensors: (1) the presence of vegetation within a 5 m distance to a sensor, (2) the presence of a facade within a 5 m distance to a sensor, (3) the location of a sensor in a courtyard or frontyard side, (4) the presence of vegetation in the street/courtyard where a sensor is located, (5) the location of a sensor in the avenue or in the narrow street canyon, (6) the height level of a sensor below/above 5 m, and (7) the direct ventilation of a sensor by the Volksgarten park (visibility). The differences of the averaged values of the pairwise comparisons have been checked for statistical significance using t-tests with a significance level of α=0.05.
The measured air temperatures and relative air humidities of all NETATMO sensors in the entire research area for the eleven day test period in August 2021 can be found in Figs. 3 and 4. The heterogeneous climate character of the study area becomes clear as obvious microclimatic differences between the various sensor locations can be identified. These can clearly be attributed to small scale microclimate factors, which can be assessed using the pairwise comparisons.
For the comparison (1) it was found that the average temperature of sensors within a 5 m radius of vegetation with 19.85 ∘C is significantly lower in contrast to sensors without vegetation (20.11 ∘C on average). In the same way for (2), the average temperature of sensors far away from facades (19.70 ∘C) is significantly cooler than for sensors close to facades (20.09 ∘C). For (3), courtyard sensors (19.82 ∘C) are significantly colder than frontyard sensors (20.10 ∘C), and for (4), sensors in greened streets or courtyards (19.97 ∘C) show significantly lower temperatures than sensors without this attribute (20.25 ∘C). In the same way for (5), sensors which are located in the avenue (20.15 ∘C) are significantly colder than sensors in the narrow street canyon (20.38 ∘C). Regarding the height level comparison (6), a non significant difference could be identified with slightly colder temperatures at high up sensor positions (19.99 ∘C) in contrast to low sensors (20.03 ∘C). Finally for (7), significantly lower average temperatures could be found for sensors with direct ventilation through the Volksgarten park (19.90 ∘C) for the significance level of α=0.05 compared to sensors without this attribute (20.14 ∘C).
Table 1Means and standard deviations of temperature [∘C] and relative humidity [%] at the NETATMO sensors for the 11 d period in August 2021.
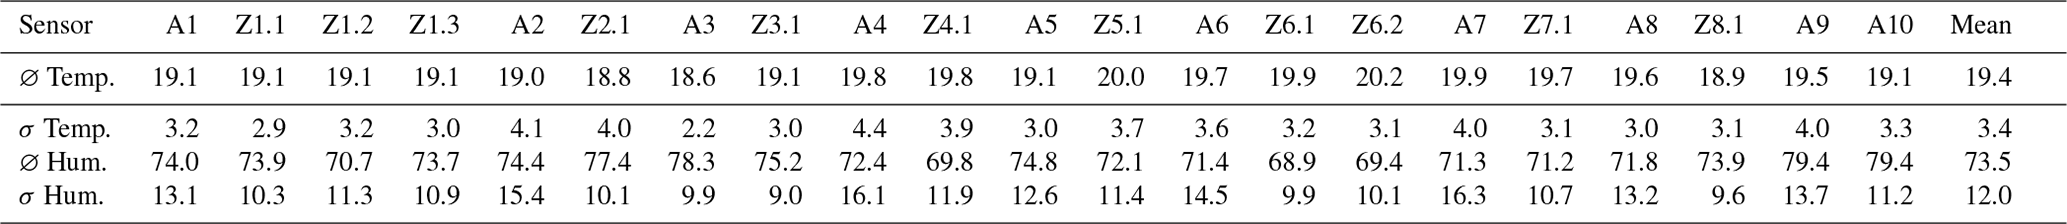
Statistics based on measurement data for the eleven day test period 3–13 August 2021.
Table 2Means and standard deviations of wind speed [m s−1] at the ultrasonic anemometers for the 11 d period in August 2021.
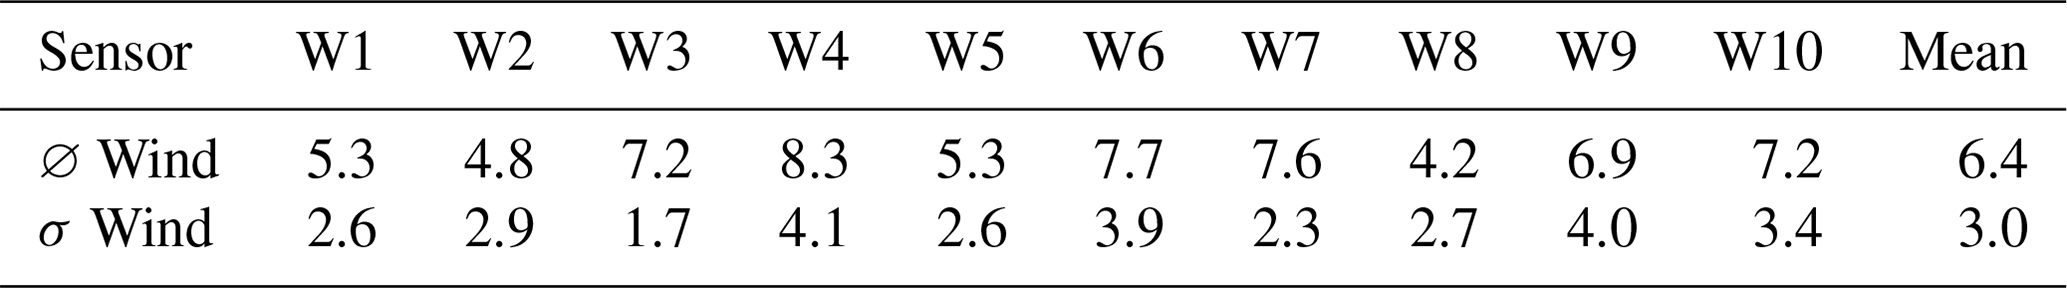
Statistics based on measurement data for the eleven day test period 3–13 August 2021.
The pairwise comparisons for the average relative air humidity show similar patterns. For (1), the mean humidity of sensors close to vegetation with 72.8 % is significantly higher than at sensors without (70.5 %), while for the comparison (2), the average humidity of sensors farer away from facades (72.3 %) is significantly higher than at sensors close to facades (71.2 %). For (3), courtyard sensors (71.8 %) have a significant higher humidity than frontyard sensors (71.2 %), and for (4), sensors in greened streets or courtyards (73.0 %) show significantly higher humidities than sensors without this attribute (69.2 %). In the same way for (5), sensors which are located in the avenue (72.1 %) have significantly higher mean values than sensors in the narrow street canyon (68.4 %). Regarding the height level comparison (6), a non significant difference could be identified again with a higher average humidity at high up sensor positions (71.8 %) in contrast to low sensors (71.1 %), while for (7), a significant higher average humidity could be found for sensors with direct ventilation through the Volksgarten park (72.7 %) compared to sensors without this attribute (69.9 %). Some single sensors are particularly noticeable regarding their microclimatic characteristics (see red captions in Figs. 3 and 4). For example, the coldest night temperatures can mostly be found at Z2.1 which is positioned on the large green area of the Volksgarten park. The coolest daytime temperatures, on the other hand, can be measured at A3, which is located in the green inner courtyard on a permanently shaded north side. The highest daytime air temperatures can usually be measured at A4 at a street close to the ground on a wind protected, radiation intensive south side. Based on the statistics in Table 1, it is noticeable that the highest mean air temperature is measured at Z6.2, which is the sensor furthest from the green area Volksgarten. As expected, the lowest standard deviation of the measured temperatures can be found at A3 in the fully shaded and greened inner courtyard. In terms of relative humidity, the highest values can be measured during daytime at A9 next to the large green area Volksgarten, while the lowest daytime values can be measured at Z6.1 in the narrow, ungreened street far away from the Volksgarten park. At night time, minimum values of relative humidity usually occur at A7, which is positioned at a higher altitude in an unventilated courtyard. The highest standard deviations of relative humidity were also observed at this unventilated courtyard sensor A7 as well as at the south side sensor A4 closest to the ground and in the vicinity of greenery. The wind speed measurements also show the expected wind profiles regarding altitude, shielding, ventilation and street corridor effects. This is a proof of the suitability of the measurement concept. The highest wind speeds could be measured at W7 located in a wind corridor street with southwest alignment which is the dominating wind direction in Cologne/Germany, while the lowest wind speeds usually occur at W8 in the unventilated, greened inner courtyard (see statistics in Table 2).
Overall, it can be concluded that microclimatic differences of the sites can clearly be demonstrated with the dense measurement network, and that sensors with similar specific microclimate factors and environmental properties or attributes show the same pattern in the measurement magnitudes and daily cycles, so that groups with similar characteristics can be delimited. Significant differences in the temperatures, humidities and wind speeds can be identified between the sensors in the spatial units Volksgarten park, inner courtyard, avenue and the narrow street canyon. Thus, the urban microclimate of the 16 ha study area in Cologne can realistically differentiated with the developed measurement concept.
Based on our results from the field measurements in the study area in Cologne and the data analyses, a first proof of concept demonstrated the suitability of the measuring approach. The previous quality check of the NETATMO sensors under laboratory conditions based on the two-point calibration and the subsequent validation with the reference showed that these sensors have a good accuracy expressed by the very low RMSE values and a high level of consistency with each other. Thus, these sensors are well suited for the microclimatic measurements in our urban study area. In addition, these low cost sensors have a high potential to facilitate citizen participation in science based identification of the effects of climate change adaptation measures. The measurement data of the 33 sensors have been analysed for an eleven day test period in August 2021. The data quality could be assessed as good, as neighbouring sensors show a high agreement of magnitudes and frequency distributions to each other, and larger deviations (>2σ) were only identified for one sensor which was overgrown with ivy. Using descriptive statistical analyses and significance tests as well as pairwise comparisons based on seven contrasting attributes regarding different microclimate factors, characteristics or conditions around the sensors, significant microclimatic differences between the various measurement sites were identified. Sensors close to vegetation, far away from facades, positioned in greened inner courtyards or directly ventilated by the Volksgarten park have a significantly lower mean temperature and significantly higher mean relative humidity than sensors at locations without these attributes. Furthermore, it was found that sensors in the avenue show a significantly lower mean temperature and higher mean humidity than sensors in the parallel narrow street canyon, where the highest wind speeds could also be measured. In addition, a gradient of the microclimate parameters with a significant trend from west (Volksgarten) to east (dense development) could be found. Thus, our measurement concept and dense weather station network allows to identify and monitor microclimatic differences of the sites, to statistically delimit effects of different location attributes and microclimate factors, and therefore to differentiate the urban microclimate of our study area to support ENVI-met modelling.
Thermal effects of different climate change adaptation measures must be further evaluated regarding their magnitude, spatial extend and relationship to circulation pattern and latent heat flux. In the future, we will analyse various adaptation options and climate change scenarios until 2099 for our study area in Cologne in order to assess the adaptation potential of the urban microclimate at a spatial scale which is relevant to local decision makers. Therefore, a high resolution and physically based model is needed. The 3D gridded numeric ENVI-met model will be used, which allows to implement many key properties of the built environment in the model domain. This continuous time series model simulates energy fluxes and mass transfer from pixel to pixel and is based on differential equations and approximations, such as the Navier-Stokes equation. The findings of this paper are relevant for a comprehensive calibration and validation of the ENVI-met model for the study area in Cologne, as the measurement data of the developed sensor network will be used to evaluate model outputs and to check whether the microclimatic model simulations can reliably and accurately reproduce and represent the actual measured time series at these weather sensors. Therefore, also the long term stability of this sensor network will be assessed, especially for extreme value ranges such as 100 % relative humidity.
Data are currently not publicly available and will be published at a later state of the research.
The supplement related to this article is available online at: https://doi.org/10.5194/asr-19-81-2022-supplement.
NE developed the measurement sensor network. KS and WK supported in the development and implementation of the measurement concept. NE performed the sensor validation and statistical data analyses, and prepared the manuscript. WK and KS participated in writing and supervising the work. All have read and accepted the manuscript for submission.
The contact author has declared that none of the authors has any competing interests.
Publisher’s note: Copernicus Publications remains neutral with regard to jurisdictional claims in published maps and institutional affiliations.
This article is part of the special issue “21st EMS Annual Meeting – virtual: European Conference for Applied Meteorology and Climatology 2021”.
We would like to thank all citizen scientists and local cooperation partners in the study area who make it possible to carry out our measurements in private spaces. We acknowledge support for the Article Processing Charge from the DFG (German Research Foundation, grant no. 491454339).
This research has been supported by the DFG – German Research Foundation (grant no. 491454339).
This paper was edited by Arianna Valmassoi and reviewed by two anonymous referees.
Acero, J. A. and Arrizabalaga, J.: Evaluating the performance of ENVI-met model in diurnal cycles for different meteorological conditions, Theor. Appl. Climatol., 131, 455–469, https://doi.org/10.1007/s00704-016-1971-y, 2018.
Ambrosini, D., Galli, G., Mancini, B., Nardi, I., and Sfarra, S.: Evaluating mitigation effects of urban heat islands in a historical small center with the ENVI-Met®climate model, Sustainability, 6, 7013–7029, https://doi.org/10.3390/su6107013, 2014.
Bande, L., Afshari, A., Al Masri, D., Jha, M., Norford, L., Tsoupos, A., Marpu, P., Pasha, Y., and Armstrong, P.: Validation of UWG and ENVI-Met Models in an Abu Dhabi District, Based on Site Measurements, Sustainability, 11, 4378, https://doi.org/10.3390/su11164378, 2019.
Crank, P. J., Sailor, D. J., Ban-Weiss, G., and Taleghani, M.: Evaluating the ENVI-met microscale model for suitability in analysis of targeted urban heat mitigation strategies, Urban Climate, 26, 188–197, https://doi.org/10.1016/j.uclim.2018.09.002, 2018.
Declet-Barreto, J., Brazel, A. J., Martin, C. A., Chow, W. T., and Harlan, S. L.: Creating the park cool island in an inner-city neighborhood: heat mitigation strategy for Phoenix, AZ, Urban Ecosystems, 16, 617–635, https://doi.org/10.1007/s11252-012-0278-8, 2013.
Ebrahimnejad, R., Noori, O., and Deihimfard, R.: Mitigation potential of green structures on local urban microclimate using ENVI-met model, International Journal of Urban Sustainable Development, 9, 274–285, https://doi.org/10.1080/19463138.2017.1370424, 2017.
Emmanuel, R. and Loconsole, A.: Green infrastructure as an adaptation approach to tackling urban overheating in the Glasgow Clyde Valley Region, UK, Landscape Urban Plan., 138, 71–86, https://doi.org/10.1016/j.landurbplan.2015.02.012, 2015.
ENVI-met: Modell für das Stadtklima, Berechnen Sie das Mikroklima einer Stadt auf den Quadratmeter genau, https://www.envi-met.com/de/, last access: 28 February 2022.
Farhadi, H., Faizi, M., and Sanaieian, H.: Mitigating the urban heat island in a residential area in Tehran: Investigating the role of vegetation, materials, and orientation of buildings, Sustain. Cities Soc., 46, 101448, https://doi.org/10.1016/j.scs.2019.101448, 2019.
Gusson, C. S. and Duarte, D. H.: Effects of built density and urban morphology on urban microclimate-calibration of the model ENVI-met V4 for the subtropical Sao Paulo, Brazil, Procedia Engineer., 169, 2–10, https://doi.org/10.1016/j.proeng.2016.10.001, 2016.
Herath, H. M. P. I. K., Halwatura, R. U., and Jayasinghe, G. Y.: Evaluation of green infrastructure effects on tropical Sri Lankan urban context as an urban heat island adaptation strategy, Urban For. Urban Gree., 29, 212–222, https://doi.org/10.1016/j.ufug.2017.11.013, 2018a.
Herath, H. M. P. I. K., Halwatura, R. U., and Jayasinghe, G. Y.: Modeling a tropical urban context with green walls and green roofs as an urban heat island adaptation strategy, Procedia Engineer., 212, 691–698, https://doi.org/10.1016/j.proeng.2018.01.089, 2018b.
Ketterer, C. and Matzarakis, A.: Human-biometeorological assessment of heat stress reduction by replanning measures in Stuttgart, Germany, Landscape Urban Plan., 122, 78–88, https://doi.org/10.1016/j.landurbplan.2013.11.003, 2014.
Krüger, E. L., Minella, F. O., and Rasia, F.: Impact of urban geometry on outdoor thermal comfort and air quality from field measurements in Curitiba, Brazil, Building Environ., 46, 621–634, https://doi.org/10.1016/j.buildenv.2010.09.006, 2011.
Lee, H., Mayer, H., and Chen, L.: Contribution of trees and grasslands to the mitigation of human heat stress in a residential district of Freiburg, Southwest Germany, Landscape Urban Plan., 148, 37–50, https://doi.org/10.1016/j.landurbplan.2015.12.004, 2016.
Middel, A., Chhetri, N., and Quay, R.: Urban forestry and cool roofs: Assessment of heat mitigation strategies in Phoenix residential neighborhoods, Urban Forest. Urban Gree., 14, 178–186, https://doi.org/10.1016/j.ufug.2014.09.010, 2015.
Müller, N., Kuttler, W., and Barlag, A. B.: Counteracting urban climate change: adaptation measures and their effect on thermal comfort, Theor. Appl. Climatol., 115, 243–257, https://doi.org/10.1007/s00704-013-0890-4, 2014.
NETATMO: Smart Home Weather Station's technical specifications, https://www.netatmo.com/en-gb/weather/weatherstation/specifications, last access: 5 May 2022.
Oke, T. R.: Methods in urban climatology, Appl. Climatol., 14, 19–29, 1984.
Perini, K., Chokhachian, A., Dong, S., and Auer, T.: Modeling and simulating urban outdoor comfort: Coupling ENVI-Met and TRNSYS by grasshopper, Energ. Buildings, 152, 373–384, https://doi.org/10.1016/j.enbuild.2017.07.061, 2017.
Razzaghmanesh, M., Beecham, S., and Salemi, T.: The role of green roofs in mitigating Urban Heat Island effects in the metropolitan area of Adelaide, South Australia, Urban Forest. Urban Gree., 15, 89–102, https://doi.org/10.1016/j.ufug.2015.11.013, 2016.
Rui, L., Buccolieri, R., Gao, Z., Gatto, E., and Ding, W.: Study of the effect of green quantity and structure on thermal comfort and air quality in an urban-like residential district by ENVI-met modelling, Building Simul.-China, 12, 183–194, https://doi.org/10.1007/s12273-018-0498-9, 2019.
Salata, F., Golasi, I., de Lieto Vollaro, R., and de Lieto Vollaro, A.: Urban microclimate and outdoor thermal comfort. A proper procedure to fit ENVI-met simulation outputs to experimental data, Sustain. Cities Soc., 26, 318–343, https://doi.org/10.1016/j.scs.2016.07.005, 2016.
Simon, H., Lindén, J., Hoffmann, D., Braun, P., Bruse, M., and Esper, J.: Modeling transpiration and leaf temperature of urban trees–a case study evaluating the microclimate model ENVI-met against measurement data, Landscape Urban Plan., 174, 33–40, https://doi.org/10.1016/j.landurbplan.2018.03.003, 2018.
Sodoudi, S., Zhang, H., Chi, X., Müller, F., and Li, H.: The influence of spatial configuration of green areas on microclimate and thermal comfort, Urban Forest. Urban Gree., 34, 85–96, https://doi.org/10.1016/j.ufug.2018.06.002, 2018.
Stewart, I. D.: A systematic review and scientific critique of methodology in modern urban heat island literature, Int. J. Climatol., 31, 200–217, https://doi.org/10.1002/joc.2141, 2011.
Sun, S., Xu, X., Lao, Z., Liu, W., Li, Z., García, E. H., He, L., and Zhu, J.: Evaluating the impact of urban green space and landscape design parameters on thermal comfort in hot summer by numerical simulation, Build. Environ., 123, 277–288, https://doi.org/10.1016/j.buildenv.2017.07.010, 2017.
Tsoka, S., Tsikaloudaki, A., and Theodosiou, T.: Analyzing the ENVI-met microclimate model's performance and assessing cool materials and urban vegetation applications–A review, Sustain. Cities Soc., 43, 55–76, https://doi.org/10.1016/j.scs.2018.08.009, 2018.
Wang, Y. and Akbari, H.: Analysis of urban heat island phenomenon and mitigation solutions evaluation for Montreal, Sustain. Cities Soc., 26, 438–446, https://doi.org/10.1016/j.scs.2016.04.015, 2016.
Wang, Y., Berardi, U., and Akbari, H.: Comparing the effects of urban heat island mitigation strategies for Toronto, Canada, Energ. Buildings, 114, 2–19, https://doi.org/10.1016/j.enbuild.2015.06.046, 2016.
Yang, X., Zhao, L., Bruse, M., and Meng, Q.: Evaluation of a microclimate model for predicting the thermal behavior of different ground surfaces, Build. Environ., 60, 93–104, https://doi.org/10.1016/j.buildenv.2012.11.008, 2013.
Yilmaz, S., Mutlu, E., and Yilmaz, H.: Alternative scenarios for ecological urbanizations using ENVI-met model, Environ. Sci. Pollut. Res., 25, 26307–26321, https://doi.org/10.1007/s11356-018-2590-1, 2018.
Yuan, J., Emura, K., and Farnham, C.: Is urban albedo or urban green covering more effective for urban microclimate improvement?: A simulation for Osaka, Sustain. Cities Soc., 32, 78–86, https://doi.org/10.1016/j.scs.2017.03.021, 2017.
Zhao, Q., Sailor, D. J., and Wentz, E. A.: Impact of tree locations and arrangements on outdoor microclimates and human thermal comfort in an urban residential environment, Urban Forest. Urban Gree., 32, 81–91, https://doi.org/10.1016/j.ufug.2018.03.022, 2018.
Ziaul, S. and Pal, S.: Modeling the effects of green alternative on heat island mitigation of a meso level town, West Bengal, India, Adv. Space Res., 65, 1789–1802, https://doi.org/10.1016/j.asr.2019.12.031, 2020.
Zölch, T., Maderspacher, J., Wamsler, C., and Pauleit, S.: Using green infrastructure for urban climate-proofing: An evaluation of heat mitigation measures at the micro-scale, Urban Forest. Urban Gree., 20, 305–316, https://doi.org/10.1016/j.ufug.2016.09.011, 2016.