Articles | Volume 19
https://doi.org/10.5194/asr-19-91-2022
22 Aug 2022
 | 22 Aug 2022

Condensation–mass flux connection in warm convective clouds: theory and implications for cloud supersaturation

Yefim L. Kogan
Abstract

The study focused on the relationship between Condensation Rate (CR) and the upward/Plus Mass Flux (MFP) in a system of trade wind cumulus clouds simulated by an LES model. The model was initialized with data observed during the RICO field project, and simulated in a 50.0×50.0 km horizontal domain.

In our previous study (Kogan, 2021) we showed that a nearly perfect correlation exists between CR and MFP (correlation coefficient R=0.99). As a result, condensation rate can be highly accurately expressed as a linear function of upward mass flux. This LES derived finding was explained using condensation theory and concept of quasi-steady supersaturation. The obtained from the LES model slope of the CR–MFP linear fit was in excellent agreement with its theoretical value (error less than 5 %). The theory also showed that the equality between the LES and theoretical values of the slope follows from the equality between supersaturation and its quasi-steady value.

The study results suggest that condensation rates, for a variety of cloud conditions, can be precisely estimated using the single variable–upward mass flux. Possible implications of the results for evaluating supersaturation and degree of non-adiabaticity in clouds are discussed.

Dates
1 Introduction

In tropical shallow cumulus clouds latent heat released during water phase transition is an important source of energy driving formation and evolution of cumulus convection. The formulation of phase transition processes (condensation and evaporation) in computer models depends on grid resolution (LES/CRM/NWP) and the method chosen to describe the microphysics (explicit/bin or parameterized/bulk). Obviously, condensation is influenced by microphysics, including aerosols (Kogan and Martin, 1994). The latter effect is often referred to as “convection invigoration”. It is, therefore, important to formulate parameterizations for phase transition processes, especially applicable to cloud resolving (CRM) and NWP models.

In our previous study (Kogan, 2021) we found that a strong correlation exists between integral cloud condensation rate (CR) and integral upward mass flux (MFP). At first sight this result should not be surprising, as mass flux has long been recognized as a major factor affecting cumulus convection (see e.g., Arakawa and Schubert, 1974; Tiedtke, 1989; Suselj et al., 2019). It was also well known that vertical velocity has a strong effect on supersaturation, and, therefore, cloud microphysics (see, e.g., Squires, 1952; Politovich and Cooper, 1988). Nevertheless, the exceptionally high correlation (correlation coefficient R=0.99), and the simple linear relationship between these variables (CR=αlesMFP), was quite remarkable. While the analyzed dataset consisted of more than 2000 clouds in a wide range of sizes and at different stages of their evolution, the slope of the linear fit, αles, remained nearly constant. This result was also obtained in a recent study by Grant et al. (2022) who found a similar linear relationship between condensation and vertical velocity in deep convective clouds.

This study provides theoretical formulation of the CR–MFP relationship based on the cloud drop condensational growth equation and the concept of quasi-steady supersaturation.

2 Model and dataset

Our LES model (SAMBM) employs the dynamical core of the System for Atmospheric Modeling (SAM; Khairoutdinov and Randall, 2003) and the Bulk Microphysics (BM; Kogan, 2013) fine-tuned for shallow Cu convection. The observations from the RICO field campaign (vanZanten et al., 2011) were used for initialization of the LES simulations conducted in a rather large 50.0×50.0×4 km3 domain (500×500×100 grid points).

Over the course of the simulation from 8 to 32 h, we selected 2031 clouds by applying a threshold of liquid water path > 20 g m−2. In order to facilitate the analysis of the complex system of clouds at various stages of their development, the dataset was sorted out by cloud top height and divided into four groups G1–G4, each of which condenses approximately equal amount of water vapor per second. The groups G1–G2 represent clouds mostly in the growing stage, while groups G3–G4 contain mature and decaying clouds.

3 LES model results

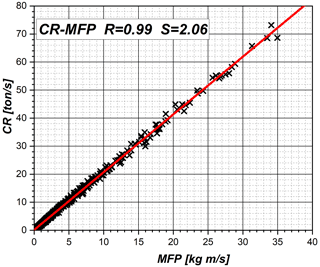
The analysis of the LES dataset described in Kogan (2021) revealed a remarkably strong correlation between the condensation rate and the upward mass flux. The scatter plot in Fig. 1 shows the CR–MFP dependence for the whole dataset, e.g., for clouds of all sizes and all stages of their evolution.

https://asr.copernicus.org/articles/19/91/2022/asr-19-91-2022-f01

Figure 1Scatter plot of condensation rates (CR) as a function of upward mass flux (MFP) for clouds in all groups. R is the correlation coefficient; S is the slope of the linear fit.

Download

The data clearly shows a perfect linear relationship (R=0.99) between the condensation rate (CRdqldt) and upward mass flux (ρaW) which can be expressed as:

(1) d q l d t = α les ρ a W

where αles=2.06×10⁻⁶ [m−1]. Here liquid water content ql and air density ρa are in kg m−3, vertical velocity W in m s−1. The subscript “les” signifies that coefficient αles is obtained from LES data, as opposite to the similar coefficient αqs derived from theory (see below).

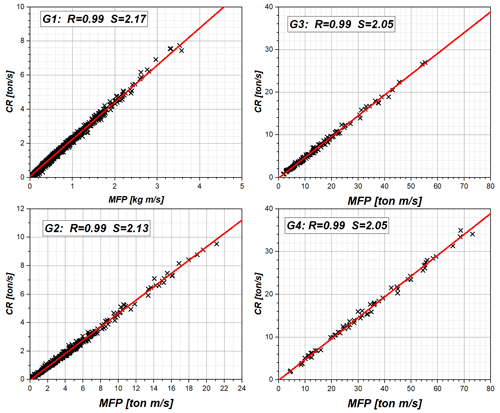
The coefficients αles for individual cloud groups slightly differ from the coefficient for the whole dataset (Fig. 2). They are 4 %–5 % higher for small clouds (2.17 for G1 and 2.13 for G2), while lower for larger clouds (2.052 for G3 and 2.049 for G4 clouds). Obviously, using the specific latent heat constant, one can relate formulation (Eq. 1) to the latent heat released during phase transitions.

https://asr.copernicus.org/articles/19/91/2022/asr-19-91-2022-f02

Figure 2Scatter plots of condensation rates (CR) as a function of upward mass flux (MFP) for clouds in each of the four groups. R is the correlation coefficient; S is the slope of the linear fit.

Download

4 Theoretical formulation of the CR–MFP relationship

The SAMBM model used in our study is a so-called two and half moment model, i.e., it employs three prognostic moments for cloud water variables (cloud water content, qc, cloud drop concentration, nc, and cloud integral radius, Ri), as well as two moments for rain water variables (rain water content, qr, and rain drop concentration, nr) (Khairoutdinov and Kogan, 1999). The use of an additional cloud moment, the integral radius Ri=rn(r)dr (n(r) is the drop size distribution function), is essential, as it allows explicit calculation of condensation rates. Specifically, using the condensational growth equation for cloud drop with radius r

(2) d r d t = G ( T , P ) S r

and having Ri as a prognostic variable, we can explicitly calculate the rate of change of cloud liquid water content:

(3) d q l d t = 4 π ρ w G ( T P ) S R i .

Here S is supersaturation, ρw and ρa are water and air density, respectively. The coefficient G(TP) is a weak function of temperature T and pressure P (e.g., Politovich and Cooper, 1988).

In order to solve Eq. (3), we first calculate changes in temperature T and water vapor content qv due to advection and turbulent mixing. The corresponding intermediate values of T* and qv* are used to calculate supersaturation S, and, based on it, condensation/evaporation rates according to Eq. (3). This splitting of dynamical and microphysical terms is analogous to a Lagrangian air parcel model where the two terms in the supersaturation equation (Eq. 4) account for dynamical ascent/descent, as well as latent heat release (e.g., Squires, 1952; Paluch and Knight, 1984).

(4) d S d t = A 1 W - A 2 S R i

In Eq. (4) coefficients A1 and A2 are weak functions of temperature T and pressure P (see, e.g., Politovich and Cooper, 1988; Pinsky et al., 2013). As was shown in many studies of supersaturation in clouds (e.g., Paluch and Knight, 1984; Cooper, 1989; Korolev and Mazin, 2003; Pinsky et al., 2013; Siebert and Shaw, 2017), for times larger than phase relaxation time, the Eq. (4) has an asymptotic quasi-steady solution for S:

(5) S q s = A 1 W A 2 R i .

The quasi-steady supersaturation is an important characteristic of the condensation process, as it corresponds to an equilibrium between contributions to the supersaturation equation from dynamical and microphysical processes. It is appropriate, therefore, to measure the actual cloud supersaturation in units of Sqs:

(6) S = κ S q s .

Under adiabatic conditions for times larger than phase relaxation time (e.g. Paluch and Knight, 1984; Khain et al., 2000; Pinsky et al., 2022) the supersaturation reaches its `quasi-steady” value. In this case the kappa factor κ=1. In general, due to mixing and entrainment, the value of κ may deviate from 1. Using LES model, the spatial distribution of κ can be evaluated according to Eq. (9) below, and, thus, κ may serve as a measure of entrainment/mixing in various cloud regions.

Substituting Eq. (6) into Eq. (3) and using Eq. (5), we can rewrite Eq. (3) as:

(7) d q l d t = 4 π ρ w G A 1 A 2 κ W = κ A 1 A 3 ρ a W = κ α q s ρ a W

where coefficient A3 is expressed through A2 and G. In Eq. (7) we introduced coefficient

(8) α q s = A 1 A 3

which is a weak function of temperature T and pressure P (Pinsky et al., 2013). Similar to Eq. (3) formulation (Eq. 7) demonstrates that CR is a linear function of upward mass flux. By comparing the LES derived formulation (Eq. 3) with the theoretical formulation (Eq. 7), one can obtain κ as:

(9) κ = α les / α q s .

In order to evaluate αqs which is a function of temperature T and pressure P, we first calculate at each vertical level the values of T and P as horizontal averages over the cloudy areas, and then obtain αqs using Eq. (8), and expressions for A1 and A3. The values of αles are calculated as slopes of linear fits either to the full LES dataset (αqs=2.06), or to each individual group subset (2.17, 2.13, 2.052, and 2.049 for G1–G4 groups, respectively, see Fig. 2).

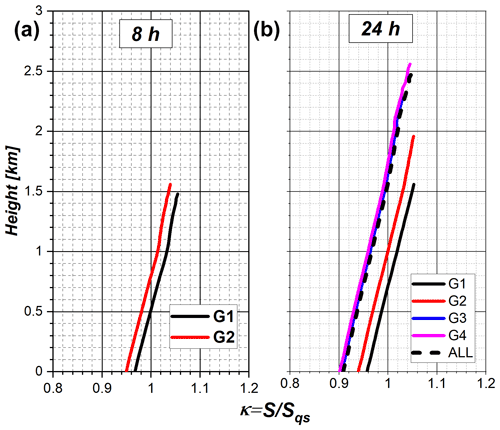
The vertical profile of κ is shown in Fig. 3 for two times in cloud system evolution. The left panel refers to an early cloud system formation (t=8 h) when only small clouds in G1/G2 groups were formed. The right panel refers to t=24 h when the cloud system has already been fully developed with clouds present in all groups.

https://asr.copernicus.org/articles/19/91/2022/asr-19-91-2022-f03

Figure 3Vertical profile of the ratio of supersaturation to its quasi-steady value. (a) The early stage of cloud formation (time = 8 h). (b) the mature stage of cloud system development (time = 24 h). The vertical coordinate is the height above the cloud base.

Download

As Fig. 3 shows, in the early formed clouds at t=8 h the supersaturation is, on average, smaller by 3 %–5 % than its quasi-steady value (Fig. 3a). This is the result of small values of integral radius Ri at the early stage of cloud formation, which combined with growing updrafts leads to large quasi-steady supersaturations (Eq. 5). At the mature stage Ri is larger, resulting in the decrease of Sqs. The decrease in Sqs is especially pronounced below cloud tops where updrafts approaching the inversion layer are weak.

While all these factors may qualitatively explain the increase of κ with height, the more accurate profile of κ may be obtained by accounting for vertical variation of αles. The profiles shown in Fig. 3 consider only constant with height integral values of αles; i.e., averaged over the whole cloud. Our preliminary results from the study of vertically dependent CR and MFP variables, showed that the coefficient αles slightly increases with height. As the result, the qualitative behavior of κ with height will remain the same.

5 Conclusions
  1. Data from LES simulations of shallow cumulus clouds demonstrated a nearly perfect correlation between Condensation Rate (CR) and upward/Plus Mass Flux (MFP).

  2. The strong correlation and the linear relationship between these variables, is explained using the condensation theory. The theory also shows that the linear CR–MFP dependence is due to the fact that cloud supersaturations, on average, are equal to their quasi-steady values.

  3. In cloud regions where, because of entrainment and mixing, supersaturation differs from its quasi-steady value, the degree of non-adiabaticity may be evaluated by the κ-factor. The latter is defined as the ratio of supersaturation to its quasi-steady value (κ=S/Sqs), and can be calculated using the slope of the CR–MFP linear fit and relationship (Eq. 9).

  4. The strong dependence of condensation rates on vertical mass flux, and the simple linear functional relationship between these variables, may be useful in formulation of condensation process in simple conceptual models of cloud topped convective boundary layer.

  5. Finally, we note that the theoretical formulation of the CR–MFP linear relationship was based on the cloud drop condensational growth equation, and, thus, applicable for local variables. As a result, it may be integrated over limited regions of the clouds, e.g., over horizontal cloud slices to obtain relationships for horizontally averaged variables. Expanding the CR–MFP relationship for horizontally averaged variables which vary in the vertical, may serve as a framework for sub-grid scale latent heat release parameterization.

Code availability

The software code for data analysis was developed by the author and is available upon request.

Data availability

Analysis data is available upon request from the author.

Competing interests

The author has declared that there are no competing interests.

Disclaimer

Publisher's note: Copernicus Publications remains neutral with regard to jurisdictional claims in published maps and institutional affiliations.

Special issue statement

This article is part of the special issue “21st EMS Annual Meeting – virtual: European Conference for Applied Meteorology and Climatology 2021”.

Acknowledgements

This investigation was supported by ONR Grant N00014-20-1-2050. The author is grateful to the two reviewers for many constructive comments. The computing for this project was performed at the OU Supercomputing Center for Education and Research (OSCER) at the University of Oklahoma.

Financial support

This research has been supported by the Office of Naval Research (grant no. N00014-20-1-2050).

Review statement

This paper was edited by Emily Gleeson and reviewed by two anonymous referees.

References

Arakawa, A. and Schubert, W. H. : Interaction of a cumulus cloud ensemble with the large-scale environment. Part I, J. Atmos. Sci., 31, 674–701, 1974. 

Cooper, W. A.: Effects of variable droplet growth histories on droplet size distributions. Part I: Theory, J. Atmos. Sci., 46, 1301–1311, 1989. 

Grant, L. D., van den Heever, S. C., Haddad, Z. S., Bukowski, J., Marinescu, P. J., Storer, R. L., Posselt, D. J., and Stephens, G. L.: A Linear Relationship between Vertical Velocity and Condensation Processes in Deep Convection, J. Atmos. Sci., 79, 449–466, 2022. 

Khain, A. P., Ovchinnikov, M., Pinsky, M., Pokrovsky, A., and Krugliak, H.: Notes on the state-of-the-art numerical modeling of cloud microphysics, Atmos. Res., 55, 159–224, 2000. 

Khairoutdinov, M. F. and Kogan, Y. L.: A Large Eddy Simulation Model with Explicit Microphysics: Validation Against Aircraft Observations of a Stratocumulus-Topped Boundary Layer, J. Atmos. Sci., 56, 2115–2131, 1999. 

Khairoutdinov, M. F. and Randall, D. A.: Cloud resolving modeling of the ARM summer 1997 IOP: Model formulation, results, uncertainties, and sensitivities, J. Atmos. Sci., 60, 607–625, 2003. 

Kogan, Y. L.: A Cumulus Cloud Microphysics Parameterization for Cloud-Resolving Models, J. Atmos. Sci., 70, 1423–1436, 2013. 

Kogan, Y. L.: LES study of precipitation/condensation dependence on cumulus clouds dynamics, Adv. Sci. Res., 18, 89–92, https://doi.org/10.5194/asr-18-89-2021, 2021. 

Kogan, Y. L. and Martin, W. J.: On parameterization of bulk condensation in numerical cloud models, J. Atmos. Sci., 51, 1728–1739, 1994.  

Korolev, A. and Mazin, I. P.: Supersaturation of water vapor in clouds, J. Atmos. Sci., 60, 2957–2974, 2003. 

Paluch, I. R. and Knight, C. A.: Mixing and evolution ofcloud droplet size spectra in vigorous continental cumulus, J. Atmos. Sci., 41, 1801–1815, 1984. 

Pinsky, M., Mazin, I. P., Korolev, A. V., and Khain, A.: Supersaturation and diffusional droplet growth in liquid clouds, J. Atmos. Sci., 70, 2778–2793, https://doi.org/10.1175/JAS-D-12-077.1, 2013. 

Pinsky, M., Eytan, E., Koren, I., and Khain, A.: Convective and turbulent motions in non-precipitating Cu. Part II: LES simulated cloud represented by a starting plume, J. Atmos. Sci., 79, 793–813, https://doi.org/10.1175/JAS-D-21-0137.1, 2022. 

Politovich, M. K. and Cooper, W. A.: Variability of the supersaturation in cumulus clouds, J. Atmos. Sci., 45, 1651–1664, 1988. 

Siebert, H. and Shaw, R. A.: Supersaturation Fluctuations during the Early Stage of Cumulus Formation, J. Atmos. Sci., 74, 975–988, https://doi.org/10.1175/JAS-D-16-0115.1, 2017. 

Squires, P: The growth of cloud drops by condensation, Aust. J. Sci. Res., 5, 59–86, 1952. 

Suselj, K., Kurowski, M., and Teixeira, J.: A Unified Eddy-Diffusivity/Mass-Flux Approach for Modeling Atmospheric Convection, J. Atmos. Sci., 76, 2505–2537, 2019. 

Tiedtke, M.: A comprehensive mass flux scheme for cumulus parameterization in large-scale models, Mon. Weather Rev., 117, 1779–1800, 1989. 

vanZanten, M. C., Stevens, B., Nuijens, L., Siebesma, A. P. Ackerman, A. S., Burnet, F., Cheng, A., Couvreux, F., Jiang, H., Khairoutdinov, M., Kogan, Y., Lewellen, D. C., Mechem, D., Nakamura, K., Noda, A., Shipway, B. J., Slawinska, J., Wang, S., and Wyszogrodzki, A.: Controls on precipitation and cloudiness in simulations of trade-wind cumulus as bserved during RICO, J. Adv. Model. Earth Syst., 3, M06001, https://doi.org/10.1029/2011MS000056, 2011. 

Download
Short summary
The energy exchanged during condensation/evaporation processes is an important driving force of tropical cumulus convection. We found theoretically, and confirmed in computer simulations, that the rate of condensation/evaporation can be expressed as a linear function of the cloud vertical velocity. This finding suggests a new approach to calculate cloud energy transformations in numerical weather prediction models.